lean mass and lower limb muscle function in relation to ... · chair rise time and peak muscle...
TRANSCRIPT

ORIGINAL ARTICLE
Lean mass and lower limb muscle function in relation to hip strength,geometry and fracture risk indices in community-dwelling older women
A. Elhakeem1,2& A. Hartley1,2 & Y. Luo3
& A. L. Goertzen4& K. Hannam1
& E. M. Clark1 & W. D. Leslie4,5 & J. H. Tobias1
Received: 25 September 2018 /Accepted: 29 November 2018 /Published online: 14 December 2018# The Author(s) 2018
AbstractSummary In a population-based sample of British women aged over 70 years old, lean mass and peak lower limb muscle forcewere both independently associated with hip strength and fracture risk indices, thereby suggesting a potential benefit of promot-ing leg muscle strengthening exercise for the prevention of hip fractures in postmenopausal women.Introduction To investigate cross-sectional associations of lean mass and physical performance, including lower limb musclefunction, with hip strength, geometry and fracture risk indices (FRIs) in postmenopausal women.Methods Data were from the Cohort of Skeletal Health in Bristol and Avon. Total hip (TH) and femoral neck (FN) bone mineraldensity (BMD), hip geometry and total body leanmass (TBLM)were assessed by dual x-ray absorptiometry (DXA). Finite elementanalysis of hip DXAwas used to derive FN, intertrochanteric and subtrochanteric FRIs. Grip strength, gait speed and chair rise timewere measured objectively. Lower limb peak muscle force and muscle power were assessed by jumping mechanography.Results In total, 241 women were included (age = 76.4; SD = 2.6 years). After adjustment for age, height, weight/fat mass andcomorbidities, TBLM was positively associated with hip BMD (βTH BMD = 0.36, P ≤ 0.001; βFN BMD = 0.26, P = 0.01) andcross-section moment of inertia (0.24, P ≤ 0.001) and inversely associated with FN FRI (− 0.21, P = 0.03) and intertrochantericFRI (− 0.11, P = 0.05) (estimates represent SD difference in bone measures per SD difference in TBLM). Lower limb peakmuscle force was positively associated with hip BMD (βTH BMD = 0.28, P ≤ 0.001; βFN BMD = 0.23, P = 0.008) and inverselyassociated with FN FRI (− 0.17, P = 0.04) and subtrochanteric FRI (− 0.18, P = 0.04). Associations of grip strength, gait speed,chair rise time and peak muscle power with hip parameters were close to the null.Conclusions Lean mass and lower limb peak muscle force were associated with hip BMD and geometrical FRIs in postmeno-pausal women. Leg muscle strengthening exercises may therefore help prevent hip fractures in older women.
Keywords DXA . Fracture risk index . Jumpingmechanography . Physical performance . Sarcopenia
Introduction
Sarcopenia, a common disorder of older age characterised bylow lean mass plus low muscle strength and/or low physicalperformance [1], is associated with increased mortality [2] andconsiderable economic burden [3]. Frailty, one of the mainclinical manifestations of sarcopenia, partly reflects functionalconsequences of impaired muscle strength on physical perfor-mance. There has been increasing interest in the effects ofsarcopenia and frailty on bone mineral density (BMD) andhip fractures. Physical performance measures which reflectfrailty (e.g. grip strength, gait speed, chair rise time) have beenshown to predict hip fracture risk in older individuals [4, 5].Furthermore, lowmuscle mass has been related to reduced hipBMD [6] and weaker hip strength based on estimates from hipstructural analysis [7]. In addition, lower limb musclestrength, assessed using a range of methods, has been related
Electronic supplementary material The online version of this article(https://doi.org/10.1007/s00198-018-4795-z) contains supplementarymaterial, which is available to authorized users.
* A. [email protected]
1 Musculoskeletal Research Unit, Translational Health Sciences,Bristol Medical School, University of Bristol, Bristol, UK
2 MRC Integrative Epidemiology Unit, Population Health Sciences,Bristol Medical School, University of Bristol, Bristol, UK
3 Department of Mechanical Engineering, University of Manitoba,Winnipeg, Canada
4 Department of Radiology, University of Manitoba,Winnipeg, Canada
5 Department of Internal Medicine, University of Manitoba,Winnipeg, Canada
Osteoporosis International (2019) 30:211–220https://doi.org/10.1007/s00198-018-4795-z

to hip BMD in older populations though it is unclear if theseassociations are independent of lean mass [6, 8–10].
Few have examined these relationships beyond 70 years ofage and thus there is a need for studies exploring the role oflower limb muscle strength in osteoporosis at older ages. Werecently demonstrated the feasibility and acceptability ofusing jumping mechanography to assess lower limb musclefunction in a sample of community-dwelling women agedover 70 years old after first excluding women with significantfrailty based on their Short Physical Performance Battery(SPPB) score [11]. We subsequently used jumpingmechanography estimates to identify lower limb peak muscleforce as well as gait speed as two independent predictors ofosteogenic impacts in this age group [12].
In the present study, we used cross-sectional data from theCohort of Skeletal Health in Bristol and Avon (COSHIBA) toinvestigate the relationship between sarcopenia-related com-ponents and osteoporosis in later life. Specifically, we aimedto examine the associations of lean mass and physical perfor-mance, including lower limb muscle function assessed byjumping mechanography, with DXA-assessed hip BMD andhip structural analysis-derived measures of hip strength, in-cluding whether any associations found were independent ofeach other. We additionally examined how these physical andmuscle performance measures relate to novel geometrical hipfracture risk indices [13–15].
Methods
Study population
COSHIBA consists of postmenopausal women recruited dur-ing 2007–2009 from primary care registries within SouthwestEngland, and born between 1927 and 1942 [16]. A total of1064 women were invited to attend research clinic assess-ments in 2015 and to complete a questionnaire collectingsociodemographic and health data. Full written consent wasobtained. Ethical approval was obtained from the South West:Frenchay Research Ethics Committee (14/SW/0138).
Measurements
Dual x-ray absorptiometry
Total body and hip dual x-ray absorptiometry (DXA) scanswere collected using a GE Healthcare Lunar Prodigy.Consenting participants who were able to transfer onto theDXA scan bed unaided underwent a total body scan generat-ing fat and lean mass (kg) and left and right hip scans gener-ating total hip and femoral neck BMD (g/cm2). The manufac-turer’s advanced hip structural analysis software was used toderive minimum neck width (mm) and cross-sectional
moment of inertia (mm4). For the purpose of analyses, theright hip results were used unless there was prior joint replace-ment, fracture or significant artefact.
Hip fracture risk indices
DXA-based finite element analysis was used to derive fracturerisk indices for the femoral neck, intertrochanteric andsubtrochanteric hip regions. The procedure for calculatinghip fracture risk indices using DXA-based finite element anal-ysis has been described previously [13–15]. Briefly, a subject-specific finite element model is automatically constructedfrom the subject’s hip DXA scan using in-house MATLAB-based programs (The MathWorks, Inc., Natick, MA). TheDXA scan is used to generate a proximal femur bone densitymap and the femur contour. The femur contour is then used tocreate a two-dimensional finite element mesh, assign materialproperties (Young’s modulus and yield stress), apply loading/constraint conditions and calculate fracture risk indices(unitless) as the average ratio of von Mises stress to yieldstress over the three proximal femur subregions (femoral neck,intertrochanteric and subtrochanteric). The impact force, pre-dicted from the subject’s body weight, height and thickness ofhip soft tissue [17], is applied to the greater trochanter; con-straint conditions are applied at the femoral head and the distalfemur. Greater fracture risk index measurements are associat-ed with greater hip fracture risk independent of other riskfactors including femoral neck BMD [15].
Grip strength
Grip strength was recorded to the nearest 0.1 kg using aJAMAR digital dynamometer (Patterson Medical, IL), withthe handle set at the second point. Three tests were performedon each hand (with 30-s rest between each test) with the par-ticipant standing upright (unless unable to stand) with theirarm fully extended next to their body and a stiff wrist. Theparticipant was instructed to squeeze as hard as they can for aslong as possible, using standard instructions. Measurementsalternated between each hand with a total of three attempts foreach hand and the maximal value was taken.
Gait speed and chair rise time from Short PhysicalPerformance Battery
Gait speed and chair rise time were assessed as part of theShort Physical Performance Battery (SPPB) [18]. Gait speedwas assessed using a 4-min timed walk at usual speed, withthe best of two attempts scored. Chair rise time was based onthe best of 5 timed chair rises without using arms. The SPPBalso included tests of side-by-side, semi-tandem, and tandembalances, performed for up to a maximum of 10 s. We alsoderived a total SPPB score by scoring each of the three tests
212 Osteoporos Int (2019) 30:211–220

(i.e. grip strength, chair rise time and standing balance) out offour giving a maximal possible score of 12 [18].
European Working Group on Sarcopenia in Older Peopleconceptual stages of sarcopenia
The European Working Group on Sarcopenia in Older People(EWGSOP) conceptual stages of sarcopenia [1] were used toclassify women into three groups of no sarcopenia, pre-sarcopenia (low muscle mass without impact on musclestrength or physical performance) and sarcopenia (lowmusclemass, plus low muscle strength or low physical performance)or severe sarcopenia (low muscle mass, low muscle strengthand low physical performance).
Jumping mechanography
Lower limb peak muscle power and force were assessed usinga LeonardoMechanography Ground Reaction Force platform,consisting of two plates with corner sensors that detect voltageproportional to applied force [19]. Sensor recordings wereused to derive test-specific performance calculations(Leonardo software version 4.2, Novotec Medical,Germany). Women with an SPPB score ≥ 6 were judged asphysically capable and safe to jump and therefore eligible forjumping mechanography tests. Peak power was assessed bytwo-legged jump and peak force by a one-legged hopping.
Heights, weights and comorbidities
Height was measured using a Harpenden stadiometer (HoltainLtd., Crymych, UK), to the nearest millimetre. Weight wasmeasured using Tanita scales (Tanita UK Ltd., Uxbridge,UK), to the nearest 0.5 kg. Comorbidities were self-reportedand grouped as none, one, two or more.
Statistical analyses
We first examined age-adjusted means of each bone measureacross sarcopenia (EWGSOP) and physical performance(SPPB) groups and used an F test to compare the overalldifference of the means. Separate linear regression modelswere then used to examine associations of grip strength, gaitspeed, chair rise time, total body lean mass and lower limbpeak muscle force and power with hip BMD (total hip andfemoral neck BMD), hip geometry (cross-sectional momentof inertia, minimum neck width) and hip fracture risk indices(femoral neck, intertrochanteric and subtrochanteric). Wefitted two models for each bone parameter; an age-adjustedmodel (model 1) followed by a model that was additionallyadjusted for height, weight (or fat mass instead of weight inthe case of lean mass) and comorbidities (model 2).
In additional analyses, the physical performance mea-sures and muscle mass/function variables that remainedassociated with bone measures after adjustment for covar-iates (i.e. model 2) were included in mutually adjustedmodels for each bone measure. To investigate the extentto which total hip BMD explains associations with femo-ral neck fracture risk index and vice versa, we fittedmodels with adjustment for total hip BMD and modelswith adjustment for femoral neck fracture risk index. Weexamined if lower limb lean mass and appendicular leanmass (calculated as total arms lean mass + total legs leanmass)/height2) were more strongly related to hip parame-ters than total body lean mass by comparing estimatesfrom models with each lean mass measure. Results werepresented as difference in SD units in each bone measureper SD unit difference in each physical performance andmuscle mass/function measure. All analyses were per-formed in R (R Foundation for Statistical Computing,Vienna).
Results
Participant characteristics
A total of 358 women had complete data on hip BMD, geom-etry and fracture risk indices in addition to measurements toderive EWGSOP and SPPB categories (Online Resource 1).Of these, 241 women had complete data on jumpingmechanography and all covariates (Fig. 1, Table 1).
Mean bone parameters across sarcopeniaand physical performance groups
Figure 2 shows age-adjusted mean total hip BMD and fem-oral neck fracture risk index across EWGSOP and SPPBgroups. There was a trend of lower total hip BMD acrossEWGSOP groups such that the pre-sarcopenia andsarcopenia groups had lower BMD than the group withoutsarcopenia higher (Fig. 2). A similar trend of higher femoralneck fracture risk index across EWGSOP groups was alsoobserved (Fig. 2). Age-adjusted means for other hip boneparameters are shown in Online Resource 2. There weretrends of lower femoral neck BMD and lower cross-sectional moment of inert ia and trends of higherintertrochanteric and subtrochanteric fracture risk indicesacross EWGSOP but not SPPB groups (Online Resource2). There was little evidence of a difference in minimumneck width across EWGSOP and SPPB groups (OnlineResource 2).
Osteoporos Int (2019) 30:211–220 213

Associations with hip strength
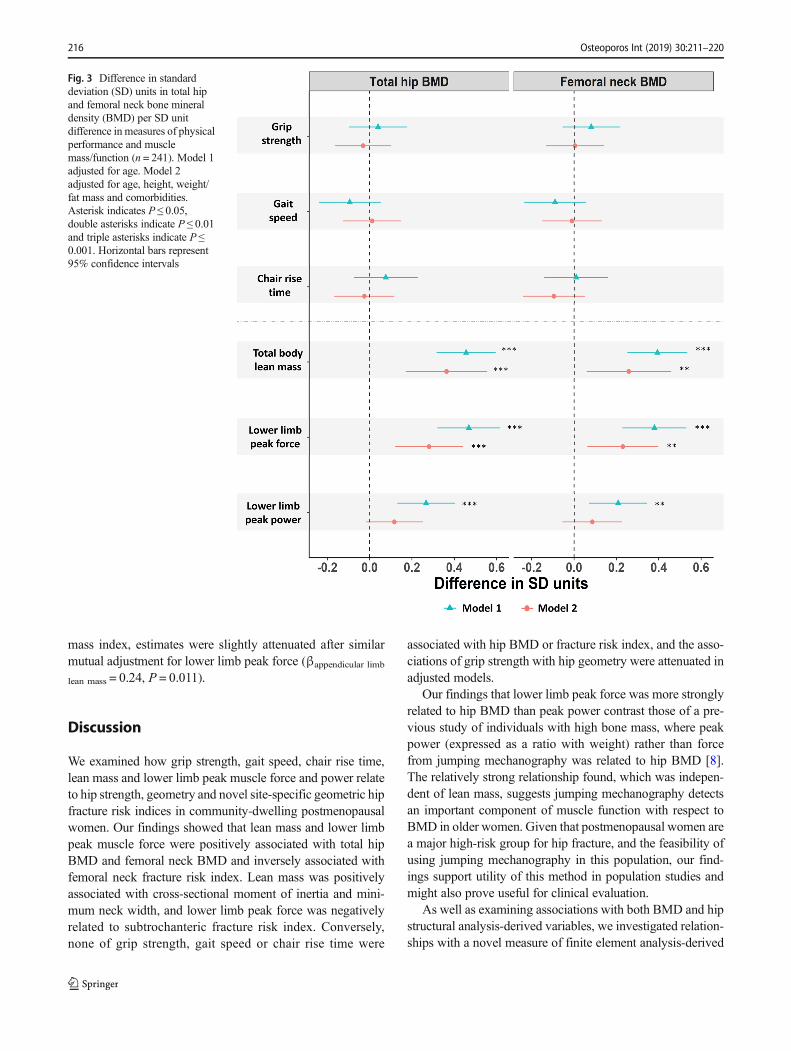
Figure 3 shows associations of physical performance mea-sures and muscle mass/function with hip BMD. In age-adjusted models, SD unit increases in total body lean massand lower limb peak muscle force and power were associatedwith higher total hip BMD and femoral neck BMD (Fig. 3).After further adjustment for height, weight/fat mass and co-morbidities, total body lean mass and lower limb peak muscleforce remained positively associated with total hip BMD andfemoral neck BMD (Fig. 3). Grip strength, gait speed andchair rise time were not associated with hip BMD includingboth before or after adjustment (Fig. 3).
Associations with hip geometry
Figure 4 shows associations of physical performance mea-sures and muscle mass/function with hip cross-sectional mo-ment of inertia and minimum neck width. In age-adjusted
models, SD unit increases in total body lean mass and gripstrength were positively associated with both cross-sectionalmoment of inertia and minimum neck width, whereas lowerlimb peak muscle force was positively related to cross-sectional moment of inertia only (Fig. 4). After further adjust-ment for height, weight/fat mass and comorbidities, total bodylean mass was positively associated with cross-sectional mo-ment of inertia and marginally associated with minimum neckwidth (Fig. 4). Lower limb peak muscle force and power werenot associated with minimum neck width, and both gait speedand chair rise time were unrelated to cross-sectional momentof inertia and minimum neck width (Fig. 4).
Associations with hip fracture risk indices
Figure 5 shows associations of physical performance mea-sures and muscle mass/function with hip fracture risk indices.In age-adjusted models, SD unit increases in total body lean
Table 1 Characteristics of women from the Cohort of Skeletal Health inBristol and Avon with data on hip BMD, geometry, fracture risk indices,lean mass, physical performance measures, jumping mechanographymeasures and all covariates (n = 241)
Mean (SD)
Covariates
Age (years) 76.4 (2.6)
Height (cm) 158.7 (5.6)
Weight (kg) 66.0 (10.4)
Total body fat mass (kg) 26.6 (7.4)
Comorbidities* [n(%)]
None 113 (46.9)
One 101 (41.9)
Two or more 27 (11.2)
Hip density and geometry
Total hip BMD (g/cm2) 0.87 (0.14)
Femoral neck BMD (g/cm2) 0.84 (0.13)
Minimum neck width (mm) 30.5 (2.2)
Cross-sectional moment of inertia (mm4) 9091.5 (2285.6)
Hip fracture risk indices
Femoral neck 0.041 (0.027)
Intertrochanteric 0.025 (0.028)
Subtrochanteric 0.004 (0.003)
Lean mass and physical performance measures
Total body lean mass (kg) 37.4 (4.0)
Grip strength (kg) 21.4 (4.9)
Gait speed (m/s) 1.0 (0.2)
Chair rise time (s) 12.7 (4.2)
Jumping mechanography
Peak muscle force (kN) 1.3 (0.3)
Peak muscle power (kW) 1.3 (0.3)
*Data for comorbidities shown as n (%)
Fig. 1 Study flowchart: Cohort of Skeletal Health in Bristol and Avon
214 Osteoporos Int (2019) 30:211–220

mass, lower limb peak muscle force and peak muscle powerwere associated with lower femoral neck and intertrochantericfracture risk indices, whereas only peak muscle force wasassociated with subtrochanteric fracture risk index (Fig. 5).After further adjustment for height, weight/fat mass and co-morbidities, total body lean mass remained negatively associ-ated with both femoral neck and intertrochanteric fracture riskindices, and lower limb peak muscle force remained negative-ly associated with both femoral neck and subtrochanteric frac-ture risk index (Fig. 5). Grip, strength, gait speed and chair risetime were not associated with fracture risk indices (Fig. 5).
Additional analyses
Models with mutual adjustment for total body lean mass andlower limb peak force (plus all covariates) showed that bothmeasures were independently positively associated with totalhip BMD (βtotal body lean mass = 0.29 (95% CI 0.10 to 0.48),P = 0.003; βpeak force = 0.29 (0.13 to 0.45), P < 0.001) andfemoral neck BMD (βtotal body lean mass = 0.20 (0.00 to 0.40),P = 0.053; βpeak force = 0.24 (0.07 to 0.41), P = 0.006). Therewas also evidence from these models to suggest that both mea-sures were independently negatively related to femoral neck
fracture risk index (βtotal body lean mass = − 0.17 (− 0.36 to 0.02),P = 0.086; βpeak force = − 0.17 (− 0.33 to − 0.01), P = 0.034).
Total body lean mass and lower limb peak force were nolonger associated with femoral neck fracture risk index afteradjustment for total hip BMD (βtotal body lean mass changedfrom − 0.21 before adjustment to 0.02 (P = 0.808) after adjust-ment for BMD and βpeak force changed from − 0.17 beforeadjustment to 0.01 (P = 0.917) after adjustment for BMD),suggesting that hip strength explains their association withfracture risk. Conversely, both measures remained associatedwith total hip BMD after adjustment for femoral neck fracturerisk index (βtotal body lean mass = 0.22, P = 0.004; βpeak force =0.17, P = 0.008).
Online Resource 3 presents a comparison of estimates frommodels using total body lean mass, lower limb lean mass andappendicular lean mass. Overall, these show that broadly sim-ilar results were found for each lean mass measure thoughassociations appeared somewhat stronger for total body leanmass (Online Resource 3). Further, the associations of lowerlimb lean mass with total hip BMD attenuated after mutualadjustment for lower limb peak force (βlower limb lean mass =0.14, P = 0.121), whereas estimates for the latter were un-changed (βpeak force = 0.31, P < 0.001). For appendicular lean
Fig. 2 Age-adjusted mean totalhip bone mineral density (BMD)and femoral neck fracture riskindex across European WorkingGroup on Sarcopenia in OlderPeople (EWGSOP) and ShortPhysical Performance Battery(SPPB) groups (n = 358).EWGSOP stages: no sarcopenia(n = 316), pre-sarcopenia (n =23), sarcopenia (n = 19). SPPBgroups: < 6 (n = 14), 6–11 (n =253), 12 (n = 91). P values from Ftest comparing overall differenceof means were (i) EWGSOPstages: P < 0.001 for total hipBMD and P = 0.027 for femoralneck fracture risk index, and (ii)SPPB groups: P = 0.023 for totalhip BMD and P = 0.628 forfemoral neck fracture risk index
Osteoporos Int (2019) 30:211–220 215
mass index, estimates were slightly attenuated after similarmutual adjustment for lower limb peak force (βappendicular limb
lean mass = 0.24, P = 0.011).
Discussion
We examined how grip strength, gait speed, chair rise time,lean mass and lower limb peak muscle force and power relateto hip strength, geometry and novel site-specific geometric hipfracture risk indices in community-dwelling postmenopausalwomen. Our findings showed that lean mass and lower limbpeak muscle force were positively associated with total hipBMD and femoral neck BMD and inversely associated withfemoral neck fracture risk index. Lean mass was positivelyassociated with cross-sectional moment of inertia and mini-mum neck width, and lower limb peak force was negativelyrelated to subtrochanteric fracture risk index. Conversely,none of grip strength, gait speed or chair rise time were
associated with hip BMD or fracture risk index, and the asso-ciations of grip strength with hip geometry were attenuated inadjusted models.
Our findings that lower limb peak force was more stronglyrelated to hip BMD than peak power contrast those of a pre-vious study of individuals with high bone mass, where peakpower (expressed as a ratio with weight) rather than forcefrom jumping mechanography was related to hip BMD [8].The relatively strong relationship found, which was indepen-dent of lean mass, suggests jumping mechanography detectsan important component of muscle function with respect toBMD in older women. Given that postmenopausal women area major high-risk group for hip fracture, and the feasibility ofusing jumping mechanography in this population, our find-ings support utility of this method in population studies andmight also prove useful for clinical evaluation.
As well as examining associations with both BMD and hipstructural analysis-derived variables, we investigated relation-ships with a novel measure of finite element analysis-derived
Fig. 3 Difference in standarddeviation (SD) units in total hipand femoral neck bone mineraldensity (BMD) per SD unitdifference in measures of physicalperformance and musclemass/function (n = 241). Model 1adjusted for age. Model 2adjusted for age, height, weight/fat mass and comorbidities.Asterisk indicates P ≤ 0.05,double asterisks indicate P ≤ 0.01and triple asterisks indicate P ≤0.001. Horizontal bars represent95% confidence intervals
216 Osteoporos Int (2019) 30:211–220

hip fracture risk index that was previously found to predict hipfracture [13–15]. Peak lower limb muscle force predictedhigher hip BMD (total and FN) and lower fracture risk index(femoral neck and subtrochanteric) independently of leanmass, but equivalent relationships were not seen for the pri-marily hip size-related hip structural analysis-derived vari-ables. Interestingly, the relationship between peak force andfracture risk index was fully explained by differences in BMD,whereas in contrast, the relationship between peak force andBMD was at least partly independent of fracture risk index.These findings suggest that despite the availability of a widerange of derived estimates from hip DXA, BMD remains themost sensitive for detecting relationships with musclestrength. This is in keeping with results from previous trialsshowing increments in hip BMD following interventions toimprove lower limb muscle strength [20–22].
In contrast, we found little association between other mea-sures of physical performance (i.e. grip strength, gait speed and
chair rise time), which are strongly linked to premature mortalityrisk [23], and hip BMD or fracture risk. This may agree with aprevious study which found only modest associations betweenchair rise time and gait speed and hip BMD in older women [24].Of these measures, only grip strength was positively related tohip cross-sectional moment of inertia and minimum neck width,and although this association attenuated after adjustment, it couldagree with a previous study showing that grip strength was thephysical performancemeasuremost strongly related toBMD in asample of physically active postmenopausal women [25].
This study has several important strengths. These includethe use of a population-based cohort of community-dwellingover 70-year-old women to investigate the relation betweenmuscle s t rength and BMD. The use of jumpingmechanography provided precise measures of specific ele-ments of muscle function and may represent an importantcomponent of muscle function for bone. In addition, we useda novel measure of finite element analysis-derived hip fracture
Fig. 4 Difference in standarddeviation (SD) units in hip cross-sectional moment of inertia andminimum neck width per SD unitdifference in measures of physicalperformance and musclemass/function (n = 241). Model 1adjusted for age. Model 2adjusted for age, height, weight/fat mass and comorbidities.Asterisk indicates P ≤ 0.05,double asterisks indicate P ≤ 0.01and triple asterisks indicate P ≤0.001. Horizontal bars represent95% confidence intervals
Osteoporos Int (2019) 30:211–220 217

Fig.
5Differencein
standard
deviation(SD)units
infemoral
neck,intertrochantericandsubtrochantericfracture
risk
indicesperSD
unitdifference
inmeasuresof
physical
performance
andmuscle
mass/functio
n.Model1adjusted
forage.Model2adjusted
forage,height,w
eight/fatmassandcomorbidities.Pforcategoricalvariablesarefrom
testcomparing
modelswith
andwith
outthemeasure
included.M
odel1unadjusted.A
steriskindicatesP≤0.05
anddoubleasterisksindicateP≤0.01.H
orizontalb
arsrepresent9
5%confidence
intervals
218 Osteoporos Int (2019) 30:211–220

risk index, which aids in the interpretation of our findings withrespect to fracture risk. There are also some limitations to thiswork. Loss of generalisability is likely as we had to excludesome women from jumping mechanography due to frailty.The study was cross-sectional and therefore reverse causationis possible. Residual confounding from unmeasured con-founders may also influence the associations found.
In conclusion, our findings showed that lean mass and low-er limb peak muscle force were both independently associatedwith hip BMD and fracture risk indices in postmenopausalwomen. These findings support the use of interventions toincrease leg muscle strength as a means of improving not onlyhip BMD but also reducing fracture risk. More research maybe needed to develop exercise regimes that increase musclepeak force specifically, for example, by incorporating balanceexercise and isometric muscle strengthening into a singleregime.
Acknowledgments We thank all COSHIBA participants for their in-volvement in the study.
Funding COSHIBAwas originally funded through a Clinician ScientistFellowship for EMC from Arthritis Research UK (grant ref. 17823). Thefunder had no role in the design of the study or the decision to submit itfor publication.
Compliance with ethical standards
Conflicts of interest None.
Open Access This article is distributed under the terms of the CreativeCommons Attribution-NonCommercial 4.0 International License (http://creativecommons.org/licenses/by-nc/4.0/), which permits anynoncommercial use, distribution, and reproduction in any medium,provided you give appropriate credit to the original author(s) and thesource, provide a link to the Creative Commons license, and indicate ifchanges were made.
Publisher’s Note Springer Nature remains neutral with regard to juris-dictional claims in published maps and institutional affiliations.
References
1. Cruz-Jentoft AJ, Baeyens JP, Bauer JM, Boirie Y, Cederholm T,Landi F, Martin FC, Michel JP, Rolland Y, Schneider SM,Topinková E, Vandewoude M, Zamboni M, European WorkingGroup on Sarcopenia in Older People (2010) Sarcopenia:European consensus on definition and diagnosis: report of theEuropean Working Group on sarcopenia in older people. AgeAgeing 39(4):412–423
2. Chang SF, Lin PL (2016) Systematic literature review and meta-analysis of the association of sarcopenia withmortality.WorldviewsEvid-Based Nurs 13(2):153–162
3. Janssen I, Shepard DS, Katzmarzyk PT, Roubenoff R (2004) Thehealthcare costs of sarcopenia in the United States. J Am GeriatrSoc 52(1):80–85
4. Harvey NC, Oden A, Orwoll E, Lapidus J, Kwok T, Karlsson MKet al (2018) Measures of physical performance and muscle strengthas predictors of fracture risk independent of FRAX, falls, andaBMD: a meta-analysis of the osteoporotic fractures in men(MrOS) study. J Bone Miner Res
5. Rikkonen T, Poole K, Sirola J, Sund R, Honkanen R, Kroger H(2018) Long-term effects of functional impairment on fracture riskand mortality in postmenopausal women. Osteoporos Int 29(9):2111–2120
6. Verschueren S, Gielen E, O'Neill TW, Pye SR, Adams JE,WardKAet al (2013) Sarcopenia and its relationship with bone mineral den-sity in middle-aged and elderly European men. Osteoporos Int24(1):87–98
7. Kim KM, Lim S, Oh TJ, Moon JH, Choi SH, Lim JY, Kim KW,Park KS, JangHC (2018) Longitudinal changes in muscle mass andstrength, and bone mass in older adults: gender-specific associa-tions between muscle and bone losses. J Gerontol A Biol Sci MedSci 73(8):1062–1069
8. Hardcastle SA, Gregson CL, Rittweger J, Crabtree N, Ward K,Tobias JH (2014) Jump power and force have distinct associationswith cortical bone parameters: findings from a population enrichedby individuals with high bonemass. J Clin EndocrinolMetab 99(1):266–275
9. Pasco JA, Holloway KL, Brennan-Olsen SL, Moloney DJ,Kotowicz MA (2015) Muscle strength and areal bone mineral den-sity at the hip in women: a cross-sectional study. BMCMusculoskelet Disord 16:124
10. Singh H, Kim D, Bemben MG, Bemben DA (2017) Relationshipbetween muscle performance and DXA-derived bone parameters incommunity-dwelling older adults. J Musculoskelet NeuronalInteract 17(2):50–58
11. Hannam K, Hartley A, Clark EM, Aihie Sayer A, Tobias JH,Gregson CL (2017) Feasibility and acceptability of using jumpingmechanography to detect early components of sarcopenia incommunity-dwelling older women. J Musculoskelet NeuronalInteract 17(3):246–257
12. Hartley A, Gregson CL, Hannam K, Deere KC, Clark EM, TobiasJH (2018) Sarcopenia is negatively related to high gravitationalimpacts achieved from day-to-day physical activity. J Gerontol ABiol Sci Med Sci 73(5):652–659
13. Luo Y, Ferdous Z, Leslie WD (2013) Precision study of DXA-based patient-specific finite element modeling for assessing hipfracture risk. Int J Numer Method Biomed Eng 29(5):615–629
14. Luo Y, Ferdous Z, Leslie WD (2011) A preliminary dual-energy X-ray absorptiometry-based finite element model for assessing osteo-porotic hip fracture risk. Proc Inst Mech Eng H 225(12):1188–1195
15. Yang S, Leslie WD, Luo Y, Goertzen AL, Ahmed S, Ward LM,Delubac I, Lix LM (2018) Automated DXA-based finite elementanalysis for hip fracture risk stratification: a cross-sectional study.Osteoporos Int 29(1):191–200
16. Clark EM, Gould V, Morrison L, Ades AE, Dieppe P, Tobias JH(2012) Randomized controlled trial of a primary care-based screen-ing program to identify older women with prevalent osteoporoticvertebral fractures: Cohort for Skeletal Health in Bristol and Avon(COSHIBA). J Bone Miner Res 27(3):664–671
17. Luo Y (2017) Image-based multilevel biomechanical modeling forfall-induced hip fracture. Springer International Publishing. 165 p
18. Guralnik JM, Simonsick EM, Ferrucci L, Glynn RJ, Berkman LF,Blazer DG, Scherr PA, Wallace RB (1994) A short physical perfor-mance battery assessing lower extremity function: association withself-reported disability and prediction of mortality and nursinghome admission. J Gerontol 49(2):M85–M94
19. Buehring B, Krueger D, Binkley N (2010) Jumpingmechanography: a potential tool for sarcopenia evaluation in olderindividuals. J Clin Densitom 13(3):283–291
Osteoporos Int (2019) 30:211–220 219

20. McMillan LB, Zengin A, Ebeling PR, Scott D (2017) Prescribingphysical activity for the prevention and treatment of osteoporosis inolder adults. Healthcare 5(4):85
21. Sakai A, Oshige T, Zenke Y, YamanakaY, Nagaishi H, Nakamura T(2010) Unipedal standing exercise and hip bone mineral density inpostmenopausal women: a randomized controlled trial. J BoneMiner Metab 28(1):42–48
22. Winters-Stone KM, Dobek J, Nail LM, Bennett JA, Leo MC,Torgrimson-Ojerio B, Luoh SW, Schwartz A (2013) Impact + re-sistance training improves bone health and body composition inprematurely menopausal breast cancer survivors: a randomizedcontrolled trial. Osteoporos Int 24(5):1637–1646
23. Cooper R, Kuh D, Hardy R (2010) Objectively measured physicalcapability levels and mortality: systematic review and meta-analy-sis. BMJ 341:c4467
24. Taaffe DR, Simonsick EM, Visser M, Volpato S, Nevitt MC,Cauley JA, Tylavsky FA, Harris TB (2003) Lower extremity phys-ical performance and hip bone mineral density in elderly black andwhite men and women: cross-sectional associations in the HealthABC Study. J Gerontol A Biol Sci Med Sci 58(10):M934–M942
25. Marin RV, Pedrosa MAC, Moreira-Pfrimer LDF, Matsudo SMM,Lazaretti-Castro M (2010) Association between lean mass andhandgrip strength with bone mineral density in physically activepostmenopausal women. J Clin Densitom 13(1):96–101
220 Osteoporos Int (2019) 30:211–220