lean manufacturing: set-up time reduction in … · abstract lean manufacturing: set-up time...
TRANSCRIPT

LEAN MANUFACTURING: SET-UP TIME REDUCTION IN SECONDARY WOOD
MANUFACTURING FACILITIES IN NORTH AMERICA
ENIS KUCUK
THESIS SUBMITTED TO
THE FACULTY OF THE VIRGINIA POLYTECHNIC INSTITUTE AND STATE
UNIVERSITY
IN PARTIAL FULFILLMENT OF THE REQUIREMENTS FOR THE DEGREE OF
MASTER OF SCIENCE IN FOREST PRODUCTS
Urs K. Buehlmann
Omar A. Espinoza
Philip A. Araman
April 15, 2016
BLACKSBURG, VA
Keywords: Lean Manufacturing, Set-up Time Reduction, Forest Products, Secondary Wood
Products Manufacturing, Wood Products Industry, Furniture Manufacturing Industry,
Woodworking Machines, Small and Medium Sized Enterprises (SMEs), North America
Copyright © 2016 by Enis KUCUK

ABSTRACT
LEAN MANUFACTURING: SET-UP TIME REDUCTION IN SECONDARY WOOD
MANUFACTURING FACILITIES IN NORTH AMERICA
ENIS KUCUK
ABSTRACT
Since the emergence and the subsequent evolution of lean manufacturing concepts,
numerous enterprises of different scale and specialties have adopted lean tools and techniques in
their facilities with varying success. In general, lean manufacturing related studies have been
conducted on large manufacturing firms, such as the automotive industry. Yet, lean
manufacturing tools and techniques are also suited for small enterprises. Thus, the main concern
of this study is to investigate the success of set-up time reduction efforts (one of the steps needed
to achieve “one-piece flow”) in secondary wood products manufacturing facilities on four
woodworking machines (moulder, shaper, table saw, and band saw) based on firm size.
The first objective of this research is to explore the results of the implementation of set-
up time reduction efforts on selected woodworking machines in enterprises of varying size. It is
assumed that company size is a major factor influencing the rate of set-up time improvements.
To that end, the first hypothesis, which states that “Small firms are less successful in reducing
set-up time through set-up time reduction efforts than are large firms,” has been developed and
supportive questions have been corresponding created. While statistical testing of the hypotheses
created for this is not possible due to the limited number of participants, speculations about the
possible outcome can be made. Thus, for hypothesis one, the data obtained does not show any
sign of a relationship between a firm size and the success rate of set-up time reduction efforts.

ABSTRACT
iii
The second objective of this study is to investigate how a firm's productivity is affected
by set-up time reduction efforts as related to firm size. With regards to some of the weaknesses
of typical small manufacturing firms (e.g. having limited budget and resources, intuitive
management strategies including lack of strategic planning), large firms, by and large, are
expected to be more successful in increasing productivity through set-up time reduction. To that
end, the goal is to investigate results of the set-up time reduction efforts in terms of productivity
improvement in manufacturing facilities. With this in mind, the second hypothesis was proposed,
which reads “Small firms achieve lower productivity gains through set-up time reduction than do
large firms.” For the second hypothesis, while no conclusive proof can be offered, no sign of a
relationship between firm size and productivity gain through set-up time reduction could be
found.
Another objective of this study is to explore the success rate of set-up time activities on
the four types of woodworking machines in industry facilities considering the training activities
provided by manufacturers. The aim is to compare set-up time improvement performance of
manufacturers between enterprises which trained their workers/operators and enterprises which
did not train their employees. To understand the relationship between the scale of firms (and/or
facilities) and training activities to improve set-ups, the third hypothesis, which reads “Small
firms are less concerned with set-up time reduction through training than are large firms,” has
been developed. For the third hypothesis, while testing is not possible, it appears that there is no
relationship between firm size and the level of concern for set-up time reduction through training
activities.
The final objective of this research is to investigate whether the secondary wood
manufacturing firms studied experienced a bottleneck in their production due to the long set-up

ABSTRACT
iv
actions of machines. In order to accomplish this objective, the final hypothesis, “In both, large
and small firms, bottlenecks occur at machines with high set-up times,” has been developed. The
final hypothesis cannot be accepted or rejected due to the limited number of responses obtained,
set-up time was a frequently indicated explanation for the occurrence of production bottlenecks
in secondary wood products manufacturing firms.

ACKNOWLEDGEMENTS
v
ACKNOWLEDGEMENTS
First of all, I would like to express my highest gratitude to my main academic adviser Dr.
Urs Buehlmann and committee members Dr. Omar Espinoza and Dr. Philip A. Araman for their
continued guidance, patience, support, assistance, and allocating their time to share their
knowledge and improve my academic and professional skills. I can feel their contribution om my
sharply expanding knowledge and the way of my thinking. Now, I am more comfortable with my
future as a person in both academic or business areas. I would also to thank several other
academic and industry people who contributed my research and make it more understandable
and suitable; Mathias Schmitt, Scott Leavengood, John Schultz, Daniel Saloni, Matt
Bumgardner.
Additionally, there are some other important people in my life from the beginning and I
would also show my respect for them. These important people are my family; my father Ahmet
Kucuk, my mother Rabihe Kucuk, and my brother Evren Kucuk. Without their support, I would
not be able to achieve this master’s degree. Thanks for being always with me even though
physically far from where I studied. Thank you…

Table of Contents
vi
Table of Contents
Table of Contents
ABSTRACT ................................................................................................................................... ii
ACKNOWLEDGEMENTS ......................................................................................................... v
TABLE OF CONTENTS ............................................................................................................ vi
List of Tables .............................................................................................................................. viii
List of Figures ................................................................................................................................ x
1.INTRODUCTION...................................................................................................................... 1
1.1. Research Motivation .......................................................................................................... 1
2.RESEARCH STATEMENT ..................................................................................................... 3
2.1. Research Hypotheses.......................................................................................................... 4
3.LITERATURE REVIEW ......................................................................................................... 7
3.1. Lean Manufacturing .......................................................................................................... 7
3.1.1.Introduction to Lean .................................................................................................... 7
3.1.2. Toyota Production System (TPS) ............................................................................... 8
3.1.3. Lean Principles .......................................................................................................... 13
3.1.3.1. Value..................................................................................................................... 14
3.1.3.2. Value Stream Map .............................................................................................. 14
3.1.3.3. Flow ...................................................................................................................... 16
3.1.3.4. Pull ........................................................................................................................ 17
3.1.3.5. Perfection ............................................................................................................. 17
3.1.4. Liker’s 14 Principles .................................................................................................. 18
3.1.5. Waste........................................................................................................................... 23
3.1.6. Standardize Work...................................................................................................... 25
3.2. Reduction of Set-up Time ................................................................................................ 26
3.2.1. Set-up Concepts ...................................................................................................... 29
3.2.2. Concept Implementation ....................................................................................... 31
3.3. Documented Set-up Time Reduction Studies ................................................................ 33
4. METHODOLOGY ................................................................................................................. 36
4.1. Data Sources ..................................................................................................................... 37
4.1.1. Population of interest ................................................................................................ 37
4.1.2. Online Questionnaire ................................................................................................ 38
4.1.3. Mailing List ................................................................................................................ 38
4.2. Questionnaire Design ....................................................................................................... 39
4.2.1. Company Information ............................................................................................... 40

Table of Contents
vii
4.2.2. Set-up Time Reduction Efforts ................................................................................. 41
4.2.3. General Questions...................................................................................................... 42
5. RESULTS ................................................................................................................................ 44
5.1. Company Information ..................................................................................................... 44
5.2. Set-up Time Reduction Efforts ....................................................................................... 47
5.2.1. Set-up Time Reduction Efforts: Moulder ............................................................... 47
5.2.2. Set-up Time Reduction Efforts: Table Saw ............................................................ 50
5.2.3. Set-up Time Reduction Efforts: Shaper .................................................................. 53
5.2.4. Set-up Time Reduction Efforts: Band Saw ............................................................. 54
5.3. General Questions ............................................................................................................ 55
6. DISCUSSION .......................................................................................................................... 57
6.1. The Survey ........................................................................................................................ 57
6.1.1. Discussion of Survey Answers .................................................................................. 58
6.1.1.1. Employment Size and Location ......................................................................... 58
6.1.1.2. Frequency of Set-up Time Reduction Efforts .................................................. 59
6.1.1.3. Number of Responses for Machines .................................................................. 59
6.1.1.4. Set-up Time and Productivity Improvement ................................................... 60
6.1.1.5. Time Spent ........................................................................................................... 62
6.1.1.6. Training ............................................................................................................... 63
6.1.1.7. The Single Most Important Outcome ............................................................... 64
6.1.2. General Questions...................................................................................................... 66
6.1.2.1. The Largest Set-up Time Reduction Achieved On Any Machine in Facilities
............................................................................................................................................ 66
6.1.2.2. Most Rewarding Outcome ................................................................................. 66
6.1.2.3. Bottleneck Machines ........................................................................................... 66
6.2. Referring to Earlier Literature ....................................................................................... 67
6.3. Future Research ............................................................................................................... 69
7.CONCLUSIONS ...................................................................................................................... 71
REFERENCES ............................................................................................................................ 73
APPENDIX A: THE SURVEY QUESTIONS ......................................................................... 80
APPENDIX B: COLLECTED DATA, NUMBER OF RESPONSES, ANSWERS
OBTAINED ............................................................................................................................... 102

List of Tables
viii
List of Tables
Table 1: Liker’s 14 management principles based on the Toyota Production System ................ 20
Table 2: The four concepts and six techniques to shorten set-up time ........................................ 28
Table 3: The targeted NAICS industry categories of this study .................................................. 37
Table 4: Advantages and disadvantages of conducting an online survey .................................... 39
Table 5: Classification of enterprises based on employment. ...................................................... 41
Table 6: The statistics on respondents’ job descriptions. ............................................................ 44
Table 7: The main product category produced in respondents’ facilities. ................................... 46
Table 8: Locations of the facilities of respondents. ..................................................................... 46
Table 9: Employement sizes in facilities of respondents. ............................................................ 47
Table 10: Numbers of specified machine types. .......................................................................... 47
Table 11: Set-up time improvement where setup time reduction efforts have been undertaken
on the moulder .............................................................................................................................. 48
Table 12: The single most important outcome achieved through set-up time reduction of
moulders. ....................................................................................................................................... 48
Table 13: Areas where the set-up time was reduced the most (Moulder). ................................... 49
Table 14: The most time consuming part of a moulder set-up. ................................................... 50
Table 15: Set-up time improvement where setup time reduction efforts have been undertaken
on the table saw. ............................................................................................................................ 51
Table 16: The single most important outcome achieved through set-up time reduction of table
saws. .............................................................................................................................................. 52
Table 17: The most time consuming part of a table saw set-up. .................................................. 53
Table 18: Machines that the largest set-up time reduction was achieved. ................................... 55
Table 19: The most rewarding set-up time reduction effort in respondents’ companies. ............ 56
Table 20: Bottleneck machines, reason for and solution to the specified bottleneck. ................. 56
Table 21: The most time consuming areas for their machine set-ups in respondents’ facilities. 62

List of Tables
ix
Table 22: Employment sizes and the single most important outcome through set-up
improvement in respondents’ facilities ......................................................................................... 65

List of Figures
x
List of Figures
Figure 1: The TPS House............................................................................................................... 9
Figure 2: The five major lean principles attributed ..................................................................... 13
Figure 3: Example of a current state value stream map. .............................................................. 16
Figure 4: The five-step thought process for guiding the implementation of lean techniques ..... 18
Figure 5: Wastes to be removed .................................................................................................. 25
Figure 6: Using a liner to standardize die height ......................................................................... 30
Figure 7: Several examples for of quick fasteners ....................................................................... 32

INTRODUCTION
1
1.INTRODUCTION
1.1. Research Motivation
Reducing the time spent to set-up machines in manufacturing facilities is critical to
improving any company’s competitiveness in today's global economy. To that end, companies
are able to get several benefits from reducing set-up time, including increased capacity, reduced
lead-time, increased customer responsiveness, reduced batch sizes, reduced inventory, less
waste, and more flexibility for the production. According to McIntosh et al. (2007), high a
frequency of changeovers, which can be achieved through reduced set-up time, are needed when
companies desire to be more responsive and have more flexible manufacturing systems.
Flexibility can be defined as the ability of a manufacturing system to respond efficiently and
timely to changes in customer demand (Zammori et al., 2011; Wadhwa, 2012). These related
advantages can be triggered with the improvement of set-up time in manufacturing facilities.
Set-up time is defined as the time between the last good item produced and the first good
item produced after set-up of a new production batch by the machine (Trevino et al., 1993). Set-
up activities are categorized into two types: internal and external set-ups. External set-up time is
the set-up time spent on activities that can be performed while the machine continues its
production run. Internal set-up, conversely, describes the set-up activities that require to stop the
machine (also see 3.1.7.1. Set-up Concepts) (Cakmakci, 2009; Monden, 2011). As mentioned
before, manufacturers benefit from successful set-up time reduction efforts due to reduced lead
time, reduced inventory and work in process (WIP), as well as through reduced lot sizes. These
advantages can help companies increase their competitiveness including an ability to diversify
their product lines and/or increase their production capacity.

INTRODUCTION
2
The term “Lean” is roughly defined as making manufacturing (or other) systems more
effective and more efficient (Womack et al., 1990). Lean manufacturing techniques are rooted in
the Toyota Motor Company’s the Toyota Production System (TPS) that started evolving in
1950s. The main idea of Lean is eliminating unnecessary tasks from work areas to reduce costs
and increase productivity (Monden, 2011). Lean offers various tools to improve any given
facility’s manufacturing systems including set-time reduction. Industries, such as the automobile
industry, have been successful in implementing set-up reduction efforts. However, the
implementation of Lean techniques in other industries needs further exploration. One of these
industries is the forest products industry. This study intends to describe efforts by the U.S.
secondary wood products industry to capture the benefits of set-up time reduction efforts. In
particular, the study tries to quantify the estimated success rate of set-up time reduction efforts
on commonly used basic woodworking machines in secondary wood products manufacturing
firms. In particular, the following four pieces of equipment were investigated: moulder, table
saw, shaper, and band saw. The underlying idea of examining secondary wood products
manufacturing facilities is that, in general, these manufacturers produce various types of products
on the same equipment and thus set-ups for the production of a new product are required
frequently. To obtain insights into common practices, a survey was prepared based on the
research hypotheses outlined in chapter 2.Research Statement. The survey then was conducted as
a web-based survey among readers of one of the leading wood products industry trade
magazines. The results of this study were used to describe current trends and successes of set-up
time improvement efforts among secondary wood manufacturing firms in North America.

RESEARCH STATEMENT
3
2.RESEARCH STATEMENT
This chapter provides an overview of the research hypotheses tested in this study. Data was
obtained through an empirical study to test these hypotheses through the use of a survey
instrument. Four hypotheses were proposed, and are shown below:
H01: Small firms are less successful in reducing set-up time through set-up time
reduction efforts than are large firms.
H02: Small firms achieve lower productivity gains through set-up time reduction than
do large firms.
H03: Small firms are less concerned with set-up time reduction through training than
are large firms.
H04: In both large and small firms, bottlenecks occur at machines with high set-up
times.
Since the emergence and the evolution of lean manufacturing concepts, numerous enterprises
of different scale have adopted lean techniques in their facilities. However, little documented
evidence of implementation efforts of lean manufacturing is available for small enterprises
(Achanga et al., 2006). In general, lean manufacturing related studies have been conducted
mostly for large-scale manufacturers, such as the automotive industry. Yet, lean manufacturing
tools and techniques are also suited for small enterprises (Conner, 2001). Thus, this study is an
effort to add to the body of knowledge concerning set-up time reduction in wood products
manufacturing firms, where the main focus of this study is set-up time reduction on four
woodworking machines (moulder, shaper, table saw, and band saw).

RESEARCH STATEMENT
4
2.1. Research Hypotheses
Hypothesis one (H01) is intended to obtain further insights about the use of set-up time
reduction tools on woodworking machines in enterprises of the North American wood products
manufacturing industry. It is theorized that there are varying success rates for set-up time
improvements in different sized enterprises. Commonly, small manufacturing firms face capital
limitations, and additionally, often lack management level support during lean implementations
(Achanga et al., 2006). These characteristics can make small manufacturing firms less successful
in regards to their set-up time improvement efforts. Also, due to small companies' capital
restrictions, such firms may avoid hiring an outside expert on set-up time reduction efforts when
this is advisable. Therefore, the first hypothesis seeks to answer the relationship between firm
size and the success rate of set-up time reduction efforts.
The second hypothesis of this study is to investigate how productivity is affected by set-up
time reduction actions on machines considering the size of a firm. As mentioned before, set-up
time activities can be divided into two types: internal set-up activities (machine stopped) and
external set-up activities (machine running). To that end, Monden (2011) noted that the most
significant factor for successful set-up time reduction is converting as much of the internal set-up
time to external set-up time. Thus, production continues with minimal stoppages. It was
estimated that set-up time in a typical facility might represent 5-10 percent of the total processing
time, showing the magnitude of the opportunity to increase productivity of individual machines
(Illinois Manufacturing Excellence Center (IMEC). n.d.). In fact, thanks to successful set-up time
reduction efforts, the 5-10 percent of the total productive time can be used for productivity
increase thanks to successful set-up time reduction efforts. This estimated 5 – 10 percent
proportion (increasing productivity) may be higher in large manufacturing firms than typical

RESEARCH STATEMENT
5
small manufacturing firms due to small firms’ inherent weaknesses (Rose et al., 2009) e.g.
having a limited budget and resources, and intuitive (without exploring reasons and facts)
strategic decisions. Therefore, this study hypothesized that larger firms benefit more from set-up
time reduction than do smaller firms.
The third hypothesis of this study is to explore the success rate of set-up time reduction
activities on the four types of woodworking machines in relation to the training activities
provided by each manufacturer. In general, small manufacturing firms are reluctant to provide
formal training to their employees (Hill & Stewart, 2000). This situation can cause smaller firms
to be less successful in reducing their set-up time in their facilities. This study will attempt to
explore the relationship between training activities and set-up time improvement (on the four
woodworking machines selected). Training can be an important method for employees to use
their equipment more effectively. Training can allow employees to make quicker set-ups due to
gaining skills and knowledge including how and where to place tools and parts for set-ups, and
having more knowledge about their equipment.
The fourth hypothesis of this study is to reveal that if there is a relationship between
production bottlenecks and long set-up activities of machines in wood manufacturing facilities or
not. A bottleneck is described by Goldratt (1992) as "Any resource whose capacity is equal to or
less than the demand placed upon it (p.139).” In a production system, a bottleneck can be
explained as the condition when one machine runs full capacity and limits other machines’
output and thereby lowers their capacities. Similarly, during a set-up of any machine in a
production line, remaining machines may be needed to stop running; thus, limiting capacity and
causing production bottlenecks. Eliminating bottlenecks can result in increased capacity of the
entire manufacturing line (Markgraf & Media, n.d.). Therefore, it is hypothesized that the main

RESEARCH STATEMENT
6
reason for the bottleneck in manufacturing facility is the long set-up activities on the (bottleneck)
machine.

LITERATURE REVIEW
7
3.LITERATURE REVIEW
3.1. Lean Manufacturing
3.1.1.Introduction to Lean
The term “Lean” first appeared in the book entitled The Machine that Changed the World
by Womack et al. (1990) and was coined by International Motor Vehicle Program (IMVP)
researcher John Krafcik. “Lean” was used as a term describing practices that make production
systems more effective and more efficient (Womack et al., 1990). In the book, Womack et al.
(1990) depict the results from a five-year study by the International Motor Vehicle Program
(IMVP). IMVP was founded by the Massachusetts Institute of Technology (MIT) with help of
the U.S. government in the 1980s to benchmark the global automotive industry in an effort to
strengthen the competitiveness of U.S. automobile manufacturers (Womack et al., 1990).
Womack et al.’s (1990) study revealed that the implementation of lean provides numerous
benefits to manufacturers, such as improvements in productivity, on-time delivery, and cost
reduction while it uses less of everything. In fact, Womack et al. (1990) stated that lean
manufacturing requires
“… Half the human effort in the factory, half the manufacturing space, half the
investment in tools, half the engineering hours to develop a new product. Also, it requires
keeping far less than half the needed inventory on site, results in fewer defects. And
produces a greater and ever growing variety of products (p.11).”
Therefore, adopting or using Lean helps companies be more successful and competitive.
Toyota Motor Company is the most obvious example for the success of implementing lean

LITERATURE REVIEW
8
manufacturing systems, making it the largest automobile manufacturer in 2012 (Organisation
Internationale des Constructeurs d’Automobiles (OICA), 2013).
During the 1950s, lean techniques originated at the Toyota Motor Company under the
umbrella of what Toyota refers to as the Toyota Production System (TPS). TPS was primarily
developed by Taiichi Ohno, who is considered the pioneer of Lean (Womack et al., 1990). Ohno
stated that to increase productivity and to reduce costs, he and his working group focused on the
idea of eliminating unnecessary tasks in all areas of work, creating a fundamental principle of
Lean (Monden, 2011). Thus, Lean is about being more productive while using less of everything.
The following chapter includes more details about the Toyota Production System (TPS) and lean
thinking.
3.1.2. Toyota Production System (TPS)
Development of the Toyota Production System (TPS) started in the 1950s and was
initiated by Taiichi Ohno (Shuker, 2000). The main goal of the TPS is to eliminate all kinds of
waste through continuous improvement in an enterprise (Monden, 2011). Additionally,
according to Kasul and Motwani (1997), TPS is focused on “Manufacturing the necessary
quantity of the necessary item at the necessary time (p. 274).” TPS has become synonymous and
is broadly referred to as lean manufacturing (Herrmann et al., 2008). The elements of the TPS
are illustrated by the Figure known as the TPS house, which is shown in Figure 1. The TPS
house shows the roles of the various concepts in the system and underscores the importance of
implementing TPS (Lean) as a holistic system in organizations (Lander & Liker, 2007).

LITERATURE REVIEW
9
Figure 1: The TPS House (source: Herrmann et al., 2008).
The overall purpose of TPS is described on the top of the house in Figure 1, this is to
produce the highest quality products with the lowest costs with short lead time while keeping
individual employees’ performances high. In this house-like figure, the pillars represent two
main characteristics of TPS, Just-in-Time and Jidoka (anglicized as “Autonomation”).
One of the main lean tools illustrated as the left pillar of the TPS House (Figure 1) is
“Just-in-Time (JIT)” processing, which is considered a philosophy rather than a technique. In
this case, Kisembo (n.d.) stated that JIT is a collection of tools and techniques to improve
productivity. In essence, the JIT philosophy aims at reducing Work-in-Process (WIP) and

LITERATURE REVIEW
10
finished goods inventory levels to a minimum by strict use of the minimum required quantity of
parts or materials for every process. The ultimate target for the JIT philosophy is zero
inventories, which would mean a complete elimination of all inventories (Fricke, 2010). In
essence, JIT is about the right quantity of materials, in the right place, at the right time. Womack
and Jones (1996) recall that “Taiichi Ohno found this vantage point in the modern supermarket
so stimulating that inspired him in 1950 to invent the new system of flow management we now
call Just-in-Time (p.37).” Ohno also realized that each process station has to be required to
produce only the exact amount of needed parts that is pulled by the following station (or
process). As a result, the Kanban System was developed to control production volume and flow.
Kanbans carry a message (e.g., information indicating the need for a part) from the end user way
back to all previous work stations involved. Various types of Kanban systems can be found; it
might be a card, a Ping-Pong ball, or an electronic message (White, 2000).
The right-hand pillar of the TPS (Figure 1) describes another major tenet of the TPS and
is called autonomation, or “Jidoka” in Japanese. The term can be defined as “human
autonomation,” or as “automation with a human touch (White, 2000).” According to White
(2000), NUMMI (New United Motors Manufacturing Inc.) defines autonomation as “…The
quality principle or more specifically, taking care of quality issues at the source and not letting
defects travel on to the next operation (p.9).” Thus, Jidoka allows each employee having the
power to stop production if a defect is found. In theory, Jidoka ensures that no defect will reach
customers (Funston, 2013). The foundation of the TPS house, as shown in Figure 1, consists of
four elements:
•Toyota Way Philosophy
•Kaizen (Continuous Improvement)

LITERATURE REVIEW
11
•Stable and Standardized Processes, and
•Heijunka (Production Leveling).
All other elements of the lean philosophy embodied in the TPS are built on this
foundation listed above. These four lean tools (Toyota Way Philosophy, Kaizen, Stable and
Standardized Process, and Heijunka) are crucially important as the foundation for the pillars (for
Just-in-Time, and Jidoka) in this house analogy as they support the roof (highest quality, lowest
cost, and empowered employees). Thus, the component at the bottom, the “Toyota Way
Philosophy” is considered the most substantial element of the TPS as “... It provides guidance
for everyone in the organization regarding the direction the organization is taking and the way
the organization wants to reach the goals (Fricke, 2010, p. 13)."
Another fundamental principle of lean manufacturing is Kaizen or in other words the
practice of continuous improvement. Kaizen is a systematic way to gradually, orderly, and
continuously improve the business through focused, time-limited events involving a subset of the
entire team (Abdullah, 2003). Kaizen, which Hettler (2008) describes as the link between
improvement and lean manufacturing depends on the participation of all employees to provide
continuous improvement with the purpose of eliminating all kinds of waste in an organization
(Haak, 2006).
Another fundamental part of the TPS is an unwavering focus on stable and standardized
processes. Standardized processes can be defined as a set of approaches to the documentation
and application of best practices in a system (Ramalingam, 2008) and encompasses descriptions
as to how tasks are completed, defined, and controlled. The underlying idea of standardization is
creating a basis for improvement (Dennis, 2007), acknowledging the belief that more than one

LITERATURE REVIEW
12
way to complete a job exist, and that workers related to that job are able to develop the best work
design (Dennis, 2007). Additionally, because of efforts and resulting improvements to eliminate
waste (Muda in Japanese), standards are continuously adapted to reflect improvements (Dennis,
2007). In this case, Ramalingam (2008) stated that standardized processes “… Involve[s]
determining the most effective work pattern, so that each team member can perform the work
accurately and consistently until a better method is established (p.16).” Therefore,
standardization of work helps to achieve lean manufacturing goals including increased efficiency
and effectiveness, worker participation, waste elimination, and improved quality.
The third element of the TPS foundation is Heijunka (production leveling). Heijunka
ensures constant supply of customer demands/orders by sequencing the work; thus, production
leveling allows the system to avoid overproduction when demand decreases unexpectedly
(McLeod, 2009). In addition, production leveling balances the workload and prevents over-
production of one item and under-production of another (Kasul & Motwani, 1997).
People, teamwork, and waste reduction are the elements of the TPS which are shown in
the center of the house analogy (Figure 1). According to Sánchez and Pérez (2001), the goal of
teamwork requires complementary skills of team members to transfer responsibilities to
production workers and decrease indirect labor costs. Additionally, Taiichi (1988) gives an
analogy that describes the importance of teamwork by stating that a soccer team may have
talented players, however, it does not mean the team is going to win without teamwork. Another
core element of the TPS (Figure 1), reduction of waste, can come in the form of standardization,
which results in a more productive workforce, or production leveling, which leads to reduced
inventory (Koole, 2005). The last element in the center of TPS (Figure 1), stability, “… Is
established through continuous improvement, an activity that is performed by everybody working

LITERATURE REVIEW
13
for the company or supplying to the company (Fricke, 2010, p.13).” Stability also refers to
having reliable sources such as reliable equipment, workforce, machines, and material (D&I
Partners, Inc., n.d.).
3.1.3. Lean Principles
According to Ramalingam 2008, five major principles of lean have been identified by
Womack and Jones (1996) and are shown in Figure 2.
Figure 2: The five major lean principles attributed by Ramalingam (2008) to Womack
and Jones.

LITERATURE REVIEW
14
3.1.3.1. Value
Various authors describe value as encompassing everything that customers are willing to
pay for (Čiarnienė & Vienažindienė, 2012; Irani, 2011; Quesada-Pineda & Buehlmann, 2011;
Todd, 1998); in contrast, waste is every activity that does not add value to the product or the
service from a customer’s perspective (Quesada-Pineda & Buehlmann, 2011). In fact, only a
small amount of activities undertaken in today’s organizations and production systems add value
for the end customers (Čiarnienė & Vienažindienė, 2012). Therefore, understanding and
producing to customers’ desire and needs is critically important in the pursuit of creating value
for customers. Thus, one should not establish customer value from the producers’ perspectives
(Ramalingam, 2008). Fernando and Cadavid (2007) correctly defined value as: “What customers
want, when and how they want it, and what combination of features, capabilities, availability,
and price they will prefer (p.72).”
3.1.3.2. Value Stream Map
Value stream mapping (VSM) is one of the lean tools that allows an organization to
differentiate between value added and non-value added activities in all processes (Ramalingam,
2008). Thus, value stream mapping facilitates removing waste (e.g., removing all non-value
adding activity) from the processes. Identifying the actions that are truly required for
manufacturing a product based on the current status of technology, is the primary objective of
any value stream map and these actions can be sorted as follows (Ramalingam, 2008, p.12):
• “Actions which create value expected by the customer,”

LITERATURE REVIEW
15
• “Actions which do not create any value for the customer, but are required in the
production system,”
• “Actions which do not create any value and those can be directly eliminated.”
The last type of activities from the list above and mentioned e.g., activities that do not
create any value, are removed incessantly in a lean system. For example, rework on a defective
product is a non-value added activity and needs to be eliminated through improving the
processes to prevent defective products to occur in the first place.
As a base for improvement, the “current” value stream map is taken as a starting point to
develop an “ideal” value stream map, which visualizes the production using only value added
processes (Hettler, 2008). Figure 3 illustrates a current value stream map. According to Huang,
(2008), a value stream map comprises data such as:
• Material and information flow from one process to another
• Inventory level at each process, including raw and work-in-process (WIP)
• Safety stock
• Supplier and customer information
• Conveyance of the product between processes
• IT and information flow
• Cycle time and Lead Time
• Quality level
• Downtime

LITERATURE REVIEW
16
Figure 3: Example of a current state value stream map (source: Conner 2001).
As a rule, a team consisting of employees from a wide range of departments in an
organization performs mapping activities (Ramalingam, 2008). The team collects data by
tracking the product “…As it is manufactured based on the existing conditions on the shop floor
and not based on the old information (Ramalingam, 2008. p.13).”
3.1.3.3. Flow
The power of “flow” is revealed by the application of continuous flow to the assembly
line of Henry Ford (Morgan & Liker, 2006). Ramalingam’s (2008) uses the concept of “flow” to
describe the constant movement of materials through the manufacturing processes to produce
customers’ orders. Similarly, Liker (2004, p.88) stated that flow deals with the process of
supplying raw materials needed for production stations that must start with a customer’s order.

LITERATURE REVIEW
17
Actually, Liker (2004) stated that “…Flow is the heart of the lean message that shortening the
elapsed time from raw materials to finished goods (or services) will lead to the best quality,
lowest cost, and shortest delivery time.”
3.1.3.4. Pull
“Pull” is a method that withdraws the parts needed for the current process from the
preceding process (Monden, 2011). Pull begins with customer demand. Pull production is letting
companies pull the value (products or services) by customers rather than pushing the products to
the customers (Čiarnienė & Vienažindienė, 2012; Ramalingam, 2008). The inspiring idea of pull
production derived from the replenishment of an individual item on supermarket shelves when
the quantity of that item is low or out (Liker, 2004). Translating this idea to a manufacturing
system, McLeod (2009) states that “… Ohno utilized practices of Kanban inventory control,
production smoothing, and set-up time reduction… to facilitate pull (p.26)”. Kanbans are
physical or electronic elements that are used for conveying information that items are needed by
the present process from the previous process (Čiarnienė & Vienažindienė, 2012).
3.1.3.5. Perfection
Upadhye (2010) stated that “There is no end to the process of reducing effort, time,
space, cost, and mistakes (p.131).” Perfection is obtained by continuously removing waste from
the system whenever and wherever waste is detected (Ramalingam, 2008).
The five major principles of lean for guiding the implementation of lean techniques
(identifying value) are illustrated in Figure 4 (Lean Enterprise Institute, n.d.).

LITERATURE REVIEW
18
Figure 4: The five-step thought process for guiding the implementation of lean
techniques (source: Lean Enterprise Institute, n.d.).
3.1.4. Liker’s 14 Principles
In 2004, Liker categorized 14 principles under four categories (Table 1) to illustrate how
to achieve success with the Toyota Production System (TPS). These four categories are: 1)
“Long-term philosophy,” 2) “The right process will produce the right results,” 3) “Add value to
the organization by developing people and partners,” and 4) “Continuously solving root
problems drives organizational learning” (Liker, 2014). These 4 categories (4 Ps -philosophy,
process, people, and problem solving) and 14 principles are illustrated in Table 1 and are
explained in the following paragraphs.

LITERATURE REVIEW
19
The first category of Liker’s principles, Long-Term Philosophy, includes only one of the
fourteen principles. This first principle (“Base your management decisions on a long-term
philosophy, even at the expense of short-term financial goals, Liker, 2006, p.8”) states that a
philosophical sense of purpose is more important than making money. As an example, Liker
(2004) states that Toyota, rather than firing its employees during a temporary downturn, keeps
them employed and the employees work on projects supporting the company’s long-term
philosophical mission. The message in a philosophical sense is “Do the right thing for the
company, its employees, the customers, and society as a whole (Liker, 2004, p. 72).” Having a
philosophical mission is the starting point and the base for all the other thirteen principles. As
part of the first principle, creating a philosophy requires a company to consider as to how they
intend to generate value for the customer, the society, and the economy (Liker, 2004).
The second category of Liker’s principles focusing on processes (“The Right Process Will
Produce the Right Results, Liker, 2006, p.9”) includes seven of the fourteen principles of the
Toyota way (e.g., the Toyota Production System (TPS)). The second principle (“Create
continuous process flow to bring problems to the surface”) deals with problems of the process
regarding the goal of achieving continuous process flow. Within the scope of the third principle
(“Use "pull" systems to avoid Overproduction”), overproduction is prevented by the
implementation of “pull.” Production is triggered by Pull with the consideration of “…What
customers want, when they want it, and in the amount they want it (Liker, 2004, p.37).” Liker
(2004) states that principle four (“Level out the workload or Heijunka”) aims at “… Eliminating
overburden to people and equipment and eliminating unevenness in the production schedule
(p.37).” Principle five (“Build a culture of stopping to fix problems, to get quality right the first
time”) calls for the prevention of the production of defective products. In this case, the Jidoka

LITERATURE REVIEW
20
Table 1: Liker’s 14 management principles based on the Toyota Production System (adapted
from Liker 2004).
Liker's 14 Toyota Way Principles
Category 1: Long-Term Philosophy
Principle 1: Base your management decisions on a long-term philosophy, even at the
expense of short-term financial goals.
Category 2: The Right Process Will Produce the Right Results
Principle 2: Create continuous process flow to bring problems to the surface
Principle 3: Use "pull" systems to avoid overproduction
Principle 4: Level out the workload (Heijunka). (Work like the tortoise, not the hare.)
Principle 5: Build a culture of stopping to fix problems, to get quality right the first
time.
Principle 6: Standardized tasks are the foundation for continuous improvement and
employee empowerment
Principle 7: Use visual control so no problems are hidden.
Principle 8: Use only reliable, thoroughly tested technology that serves your people
and processes.
Category 3: Add Value to the Organization by Developing your People and Partners
Principle 9: Grow leaders who thoroughly understand the work, live the philosophy
and teach it to the others.
Principle 10: Develop exceptional people and teams who follow your company's
philosophy.
Principle 11: Respect your extended network of partners and suppliers by challenging
them and helping them improve.
Category 4: Continuously Solving Root Problems Drives Organizational Learning
Principle 12: Go and see for yourself to thoroughly understand the situation (genchi
genbutsu)
Principle 13: Make decisions slowly by consensus, thoroughly considering all
options; implement decisions rapidly (nemawashi)
Principle 14: Become a learning organization through relentless reflection (hansei)
and continuous improvement (kaizen)
concept, the second pillar of the TPS House (Figure 1), supports the application of this principle.
Jidoka allows stopping machines and equipment when a defect on a product is found. Principle
six (“Standardized tasks are the foundation for continuous improvement and employee
empowerment”) aims to achieve continuous improvement and employee empowerment through

LITERATURE REVIEW
21
standardization. In the lean philosophy, standardized tasks help reduce production related costs
through the removal of waste within the system. In most organizations, large amounts of waste
occur due to random activities and inconsistent methods. To eliminate waste in the system,
variations in methods and processes need to be removed or minimized (Gao & Low, 2014.)
Standardized work also is the foundation for “pull” and “flow” (Liker, 2004). With the
standardization of tasks, predictability in the form of regular timing and output of a process are
maintained (Liker, 2004). Principle seven (“Use visual control so no problems are hidden”) aims
to reveal waste, problems, and unusual conditions in a process. Once problems are uncovered,
they can be fixed. According to Liker (2004), the use of basic visual indicators accelerates the
determination of where employees are in the progress of the production process, e.g., is there a
deviation from the scheduled timeline or the standard? Liker’s eighth principle (“Use only
reliable, thoroughly tested technology that serves your people and processes”) can be described
as a balance between technology and humans. According to Liker (2004) principle eight requires
using reliable and tested technology to support employees rather than technology on its own.
Using a new technology carries a risk of interrupting production processes. Liker (2004) also
pointed out that new technology is usually unreliable and hard to standardize.
The third category of the Liker’s principles (People - “Add Value to the Organization by
Developing People and Partners, Liker, 2006, p.11”) comprises of three of the fourteen
principles. This category refers to adding value to an organization through empowering
employees and partners (e.g. suppliers). Principle nine (“Grow leaders who thoroughly
understand the work, live the philosophy and teach it to the others”) aims to grow leaders in the
organization rather than buying or hiring them from outside of the company (Liker, 2004). The
leaders’ assignments are not only about accomplishing given tasks, but also about being role

LITERATURE REVIEW
22
models for the organization and its philosophy. For example, the Toyota Motor Company does
not look for CEOs or presidents from outside of the company, but they grow their own leaders
which assures more insight and understanding of the Toyota culture and philosophy. Principle
ten (“Develop exceptional people and teams who follow your company's philosophy”)
emphasizes that besides growing leaders in the organization, Toyota also grows “…Exceptional
people, and teams who follow your company’s philosophy (Liker, 2004, p.39).” This principle
underlines the most important assets of any organization, which are its employees (Gao & Low,
2014). Principle eleven (“Respect your extended network of partners and suppliers by
challenging them and helping them improve”) requires the company to consider partners and
suppliers as an extension of the organization; according to Liker (2004), the firm challenge its
partners and helps them to show their value and supports them in improving their operations and
products
According to Liker (2004), category four (problem solving – “Continuously Solving Root
Problems Drives Organizational Learning, Liker, 2006, p.13”) includes the last three principles
of the Toyota Way. Those three principles are about building a culture of continuous problem
solving in an organization. Principle twelve (“Go and see for yourself to thoroughly understand
the situation”) advises all employees to go and see the problem at the source (called “Genchi
Genbutsu” in Japanese, Arumugam et al., 2012). This principle allows for a better understanding
of the problem in question, based upon which a better decision can be made. Principle thirteen
(“Make decisions slowly by consensus, thoroughly considering all options; implement decisions
rapidly”) is defined as consensus-style decision making (“nemawashi”). Even though consensus
style decision-making can be perceived as time consuming, when a decision is made, it is widely
accepted and can be rapidly implemented. Principle fourteen (“Become a learning organization

LITERATURE REVIEW
23
through relentless reflection (hansei) and continuous improvement”) focuses on creating “… a
learning organization through relentless reflection (hansei) and continuous improvement
(kaizen, Gao and Low, 2014, p.84).” Use “hansei” (Anglicized as “Reflection”) to identify
obstacles in a process and make provisions to not encounter these same problems again. In Lean
organizations, hansei is also about taking responsibility for mistakes and explaining again with a
written plan what is needed to be done so that the same problem will not be repeated (Liker &
Morgan, 2006.) Liker (2004) quoted Bruce Browlee, a General Manager at the Toyota Technical
Center, as saying:
“Hansei is really much deeper than reflection. It is really being honest about your own
weaknesses. If you are talking about only your strengths, you are bragging. If you are
recognizing your weaknesses with sincerity, it is a high level of strength. But is does not
end there. How do you change to overcome those weaknesses? That is at the root of the
very notion of Kaizen (continuous improvement). If you do not understand hansei, then
kaizen is just continuous improvement. Hansei is the incubator for change – that whole
process (p.258).”
The fourteen principles discussed above can be interpreted as the way to Toyota’s
success, and these principles will guide companies to become lean organizations. Additionally,
these principles clarify that everyone is a part of the solution and improvement while building a
lean culture.
3.1.5. Waste
As previously mentioned, value is everything that customers are willing to pay for; in
contrast, waste are all activities that do not add value to the product or the service from a

LITERATURE REVIEW
24
customers’ perspective (Quesada-Pineda & Buehlmann, 2011). Womack and Jones, in 1991,
described seven types of waste and Liker in 2004 added an additional one. These eight non-value
added activities in an enterprise are:
“Overproduction” – when more items than needed are produced to meet current
customer demand, it causes increased inventory and holding costs.
“Waiting” – the time when machine do not produce or workers are waiting for
material, maintenance crews, and tools to start production.
“Unnecessary transportation” –transportation of items, data, or parts that are
avoidable.
“Over processing or incorrect processing” – unclear definition of process and
project orders results in producing the wrong output.
“Excess inventories” – costs are incurred for holding, waiting items between
work-stations, and additional transportation is necessary.
“Unnecessary movement” – excess walking and time spent during searching for
equipment and tools by workers.
“Defective products” – a product that does not comply with customers’
expectations.
“Unused employee creativity” – to eliminate this type of waste, managers and
supervisors must listen to employees, obtain their ideas, benefit from their skills
and learn about possible improvements.

LITERATURE REVIEW
25
Figure 5 shows how one can look at assets to find and eliminate waste (Čiarnienė &
Vienažindienė, 2012).
Figure 5: Wastes to be removed (source: Čiarnienė & Vienažindienė, 2012).
According to Ramalingam (2008), typically, less than 5% of all activities performed to
make a product add value to a product. Thus, the elimination of non-value added activities
allows the product to reach the end user without any interruption or delay.
3.1.6. Standardize Work
Whitmore (2008) mentioned what Taiichi Ohno’s said in his article “Without a standard,
there can be no improvement (p.171).” In this case, creating flow and pull is impossible without
standardization of tasks, e.g., if each worker is allowed to choose their own work method and
work sequence to complete the tasks, the outcome cannot be predicted and improvements cannot
be made (Whitmore, 2008). Carrying out different work methods and work sequences by each
worker means completing the same task with varying time requirements, which causes
interruptions of flow. Therefore, differences for a same task are contrary to continuous
improvement and must be eliminated by standardizing work in lean systems.

LITERATURE REVIEW
26
Standardized work can be described as the documentation and implementation of
process/practices of methods on how tasks are defined, organized, and completed (Huang, 2008;
Ramalingam, 2008). Each employee can perform the same tasks consistently in the same way
until a better method is developed and be declared the new standard. Employee participation in
the development of standards facilitates implementation and increases acceptance of the standard
processes (Ramalingam, 2008.)
Several prerequisites are listed for standardization of work by Liker and Meier (2006),
which are:
“The work task must be repeatable.” Description of a work cannot include “if…then”
terms. As an illustration, if situation A occurs then carry out procedure B, if situation
C occurs, carry out procedure D and so on. The condition above makes standardizing
a work impossible unless it is described in a few simple rules.
“The line and equipment must be reliable, and downtime should be minimal.” One of
the obstacles to standardization is the constant interruption of work and distraction of
workers.
“Quality issues must be minimal.” Thus an employee does not struggle and loose
time to fix poor quality issues.
3.2. Reduction of Set-up Time
Set-up time is described as the amount of the time taken between the production of the
last good piece to the completion of the first good piece of the following run (Trevino et al.,
1993). According to Enginarlar (2003), the main goal of set-up time reduction is to minimize

LITERATURE REVIEW
27
machine downtime, minimizing losses of production capacity. Therefore, by minimizing set-up
time, machine downtime and production capacity losses can be minimized and output of the
production overall can be increased. However, as set-ups are indispensable for manufacturers of
discrete products who produces multiple products, the negative impact of set-ups on production
capacity needs to be held to a minimum (Coble & Bohn, 2005).
A higher frequency of producing different products by a manufacturing system increases
the time spent for set-ups. In this case, reducing set-up time becomes a must to minimize the
time loss caused by set-up activities. For example, in 1970, Toyota achieved to reduce the set-up
time required for one of their 800-ton punch press for fenders and hoods from between two to
three hours to three minutes (Monden, 2011). Such a single-minute set-up is widely known as
SMED (Single-Minute Exchange of Die), and refers to a theory and technic that, optimally, set-
up activities are performed within at most 9 minutes 59 seconds (a single digit number of minute,
Shingo, 1985).
Monden (2011) explains that Taiichi Ohno realized that shortening the set-up time allows
Toyota to reduce lot (batch) sizes. Thus, inventory of final and intermediate products can be
reduced, hence, due to the shorter completion time of such smaller batches, producing in small
batch sizes makes companies more responsive to customer needs and actual orders (Albert,
2004). Thus, smaller lot sizes reduce lead time and allows products to reach the customers with
less delay. The Center for Industrial Research and Service (CIRAS, n.d.) lists the benefits of set-
up time reduction, among others, as follows:
Reducing lot sizes, leading to higher frequency of production of different models.

LITERATURE REVIEW
28
Decreased lead time, which increases delivery performance leading to improved
delivery.
Improving documentation for set-up operations, resulting in improved quality.
Reducing costs and inventory while achieving increased capacity.
According to Monden (2011), to shorten set-up time, four major concepts and six
techniques for implementing these four concepts must be considered, as shown in Table 2 and
explained in greater detail in the following sections.
Table 2: The four concepts and six techniques to shorten set-up time according to Monden
(2011).
SET-UP CONCEPTS CONCEPT IMPLEMENATATION
Concept 1: Separate the Internal
Set-up from the External Set-up
Concept 2: Convert as Much as
Possible of the Internal Set-up to
the External Set-up
Concept 3: Eliminate the
Adjustment Process
Concept 4: Abolish the Set-up
Itself
Technique 1: Standardize the external
set-up actions
Technique 2: Standardize only the
necessary portions of the machine
Technique 3: Use quick fasteners
Technique 4: Use supplementary tools
Technique 5: Use parallel operations
Technique 6: Use mechanical set-up
systems

LITERATURE REVIEW
29
3.2.1. Set-up Concepts
3.2.1.1. Concept 1: Separate Internal Set-up from External Set-up
Internal set-up is referred to as set-up activities that can be only performed when the
machine does not run, whereas external set-up refers to set-up actions that can be performed
while the machine runs (Cakmakci, 2009; Monden, 2011). Distinguishing the two types of set-up
activity is easily done by answering the question: “Do I have to shut the machine down to
perform this activity (Cakmakci, 2009, p. 170)?”
3.2.1.2. Concept 2: Convert as Much as Possible of the Internal Set-up to External Set-up
To achieve the goal of single-digit set-up time (SMED), converting as much of the
internal set-up activities to external set-up activities becomes critically important (Cakmakci &
Karasu, 2007; Monden, 2011). When changing internal set-up activities to external set-up
activities, the machine can continue producing during the time that was switched from internal to
external set-up activities. Monden (2011) gives an example that liners (spacers) can be used to
standardize the die heights of a punch press or a molding machine to eliminate stroke adjustment.
Thus, the process can continue to produce without stopping the punch press (or molding
machine) to adjust its die heights. Figure 6 illustrates the example of using a liner to standardize
die height.
3.2.1.3. Concept 3: Eliminate the Adjustment Process
Another concept to shorten set-up time is to minimize the adjustments necessary while
setting up a machine/process, which usually comprise 50-70 percent of the overall internal set-up
time required (Monden, 2011). As an illustration, Monden (2011) gives an example of a punch

LITERATURE REVIEW
30
press producer who may produce a machine which is adjustable to diverse customers’
(companies’) die height requirements, however, each company may refrain from the stroke
adjustment by standardization of its die height at a specific size.
3.2.1.4. Concept 4: Abolish the Set-up Entirely
To remove the need for a set-up entirely, two approaches can be applied (Monden, 2011):
1 - Use uniform products in product design and the same parts for the production of various
products (e.g. the same bracket for all products (Hopp & Spearman, 2011)). Or 2 - produce
various products at the same time (e.g., stamping parts A and B in a single stroke and separating
them later (Hopp & Spearman, 2011)).
Figure 6: Using a liner to standardize die height (source: Monden 2011).

LITERATURE REVIEW
31
3.2.2. Concept Implementation
3.2.2.1. Technique 1: Standardize the External Set-up Actions
To standardize the external set-up actions meant to turn the activities required by external
set-ups into routines and standardize the operations necessary for preparing the dies, tools and
materials (Monden, 2011).
3.2.2.2. Technique 2: Standardize Only the Necessary Portions of the Machine
Monden (2011) stated that standardizing the size/shape of all dies will result in reduced set-
up time. However, the application of this type of standardization will be costly. Therefore, rather
than standardizing all the machines, “Only the portion of the function necessary for set-up is
standardized (Monden, 2011, p.192).”
One of the examples of these techniques is equalizing the dies’ heights (Figure 6).
Standardization of the die height and the die-holders allows elimination of the processes of
removing and inserting of fastening tools, and adjustments. (Monden, 2011).
3.2.2.3. Technique 3: Use a Quick Fastener
Even though a bolt is one of the most frequently used fastening devices, fastening occurs
only during the last turn of the nut, which can be loosened at the first turn. Therefore, fastening
devices that allow fixation after only a single turn should be devised and used (Monden, 2011).

LITERATURE REVIEW
32
3.2.2.4. Technique 4: Use a supplementary Tool
The process of attaching a die to a punch press takes considerable time. Therefore, the
attachment of the die to the punch press should be done in the external set-up stage; following
this, the supplementary tool can be set in the machine at one touch in the internal set-up stage
(Monden, 2011.)
Figure 7: Several examples for of quick fasteners: 1- U-shaped washer; 2- Pear-shaped bolt
hole; 3- nut and bolt with only corresponding portions grinded (source: Monden, 2011).

LITERATURE REVIEW
33
3.2.2.5. Technique 5: Use Parallel Operations
For some machines such as large presses, set-up actions will take a long time for just one
worker. However, by using two or more workers for the set-up of such a machine (e.g. large
punch press), wasteful movements can be eliminated or minimized. Even though total labor
hours may stay the same for the set-up, effective operating time of the machine will increase
(Monden, 2011).
3.2.2.6. Technique 6: Use a Mechanical Set-up System
Doing the attachment of the die, to fasten the die at several positions, oil or air pressure
system could be beneficial. Additionally, electrically operated mechanisms can be used to adjust
the height of a punch press. Even though these systems facilitate above adjustments, it may be an
expensive investment for some manufacturers (Monden, 2011).
3.3. Documented Set-up Time Reduction Studies
Literature comprises of numerous studies relating to lean manufacturing in various
areas/industries as well as to wood manufacturing. Studies of particular interest in wood
manufacturing area, for example, Fricke (2010) who focused on lean manufacturing (and its
tools) and is entitled “Lean Management: Awareness, Implementation Status, And Need for
Implementation Support in Virginia’s Wood Industry.” Also, Erdogan ’s (2015) paper
“Development of a Tool to Measure the Effectiveness of Kaizen Events within the Wood
Products Industry” researches the use of Lean tools by the wood products industry. However, the
relevant literature does not include any study about the use of (Lean) set-up time reduction tools

LITERATURE REVIEW
34
by the wood or the forest products industry while, however, numerous examples exist for other
industries, such as:
Sheri et al. (2005), who wrote about “Set-up time reduction for electronics assembly:
Combining simple (SMED) and IT-based methods.” These authors present information about set-
up time reduction for printed circuit board assembly (PCBA), an electronic component. In their
study, the set-up time improvement achieved resulted in an 85 percent reduction of set-up costs
while the reduction in internal machine set-up time per feeder was reduced to 11 seconds
from1.7 minutes originally and total set-up time was reduced to 24 minutes from 158 minutes.
Yang et al., in 1993, published a study entitled “Set-up time reduction and competitive
advantage in a closed manufacturing cell” examining the relationships between set-up time
reduction, potential competitive benefits of manufacturing cells, and a projected cell
performance by using a queuing model (M/G/1 model). Their paper revealed that with the
reduced product set-up time, optimal product lot size, average and variance of average flow time
can be decreased. Additionally, these authors found a link between set-up time reduction and
potential competitive benefits for the firm in the market place in that the reduction of set-up time
allows firms to increase delivery speed and to respond quicker to changes in the markets.
Bavuluri’s (2012) paper entitled “Set Up Time Reduction and Quality Improvement On
the Shop Floor Using Different Lean and Quality Tools” examined improving set-ups to reduce
set-up time with an application of different lean techniques to reduce set-up time including 5S,
SMED and FMEA (failure modes and effects analysis) in a semi-automated plant. Set-up
improvements in the facility resulted in a nearly 50 percent reduction in inspection time, and
loading and unloading time was reduced by 40 percent by using a newly designed handling for

LITERATURE REVIEW
35
pump housing. At the same time, the cost of rework caused by alignment problems was
eliminated and as a result approximately $13,000 are saved monthly.
Li in 2003, another paper related to set-up time reduction published “Improving the
performance of job shop manufacturing with demand-pull production control by reducing set-
up/processing time variability.” This study was conducted as a simulation modelling experiment
and explored the effects of set-up time reduction and processing time variability on the
manufacturing performance of a job shop with demand-pull production control. This study
revealed that using a Kanban system allows to minimize set-up time variability with appropriate
layout of a job shop.
Above studies show that companies obtain several benefits from reductions in set-ups
time in facilities,
including decreasing costs, improving flow time, faster response to customer demands, and
facilitating employees work during set-ups. With respect to promoting findings from previous
studies relating to set-up time, this study aims to reveal, set-up time reduction efforts and
benefits from set-up time reduction in secondary wood manufacturing facilities.

METHODOLOGY
36
4. METHODOLOGY
This study aims to reveal the success rate of set-up time reduction activities on woodworking
machines (moulder, shaper, table saw, and band saw) in the secondary wood manufacturing
industry of North America over the last decade (from 2005 to 2015). This ten-year period was
chosen since some of the companies involved might not have undertaken any set-up
improvement activities on their woodworking machines in recent years. Therefore, the ten-year
period aims to increase usable responses from the survey and to help reveal general trends in set-
up time reduction efforts in the industry. According to the Encyclopedia of Occupational Health
and Safety from the International Labor Organization (n.d.) wood is typically processed in a
regular facility “…from rough planer, to cutoff saw, to rip saw, to finish planer, to moulder, to
lathe, to table saw, to band saw, to router, to shaper, to drill and mortiser, to carver and then to
a variety of sanders (Woodworking Processes chapter, para. 4)." In this case, the machines listed
below were chosen due to their widespread use in secondary wood products manufacturing
enterprises.
Moulder
Table saw
Shaper
Band Saw
Some more advanced machines, such as CNC (computer numerical control) wood routers,
are not included in this study. The main reason for excluding CNC machines and similar
equipment is their complexity and the variability in set-up requirements. In this case, this variety
makes it difficult to compare the set-up time reduction performance on CNC-routers between
different facilities.

METHODOLOGY
37
4.1. Data Sources
4.1.1. Population of interest
This survey targets industries which widely use moulders, band saws, table saws, shapers,
and require frequent changes in set-up of these machines. Thus, the survey looks at members in
the wood products manufacturing (NAICS 321) and furniture manufacturing (NAICS 337)
industry segment (U.S. Census Bureau, 2012). However, not all the sub-categories of these two
industries are within the scope of this study. For example, sawmills (NAICS 321113), wood
preservation (NAICS 321114), and metal household furniture manufacturing (NAICS 337124)
manufactures, among others, are of no interest to this study. Table 3 displays the NAICS
categories targeted.
Table 3: The targeted NAICS industry categories of this study (sub-categories to main
categories are represented as non-shaded areas to dark-shaded areas).
2012 NAICS
CODE
NAICS Description
1 (NAICS 321) Wood Product Manufacturing
2 (NAICS 32191) Millwork
3 (NAICS 321911) Wood Window and Door Manufacturing
4 (NAICS 321912) Cutstock, Resawing Lumber, And Planning
5 (NAICS 321918) Other Millwork (Including Flooring)
6 (NAICS 337) Furniture and Related Product Manufacturing
7 (NAICS 3371) Household And Institutional Furniture And Kitchen Cabinet
Manufacturing
8 (NAICS 33711) Wood Kitchen Cabinet and Countertop Manufacturing
9 (NAICS 33712) Household, Institutional Furniture Manufacturing
10 (NAICS 337121) Upholstered Household Furniture Manufacturing
11 (NAICS 337122) Nonupholstered Wood Household Furniture Manufacturing
12 (NAICS 337127) Institutional Furniture Manufacturing
13 (NAICS 3372) Office Furniture (Including Fixtures) Manufacturing
14 (NAICS 337211) Wood Office Furniture Manufacturing
15 (NAICS 337212) Custom Architectural Woodwork and Millwork
Manufacturing

METHODOLOGY
38
4.1.2. Online Questionnaire
The online survey questionnaire was created using the Qualtrics survey system
(Qualtrics, 2005). A link of this web-based survey was shared in a trade magazine and its
associated electronic newsletters. The link directed each respondent to the (web-based) survey,
which was hosted on Virginia Tech’s server (https://virginiatech.qualtrics.com/).
4.1.3. Mailing List
Possible respondents from wood manufacturing enterprises were reached through a trade
publication (FDM&CM; http://www.fdmcdigital.com/). The underlying idea of cooperating with
a trade magazine is to benefit from the magazine’s network of industry professionals, hopefully
resulting in an increased number of responses. The higher response rate increases the statistical
validity of the findings of the study by collecting more data from the population (Great Book
n.d.; UMEX 2002)
Other options for collecting responses would be surveying companies by mail, by phone or
face to face. However, these two options were excluded, because conducting online surveys
allows us to reach more companies and obtain more responses in a short time. Table 4
demonstrates the advantages and disadvantages of conducting an online survey. According to
Sue and Ritter (2011), if a study requires a large sample size in a widely distributed geographical
area, conducting online surveys will be a better alternative than surveying by mail and telephone.
Additionally, web based surveys have the advantages of lower cost and quicker responses (fast
data collection with internet) and higher response rate expectancy (Bonometti & Tang 2006, Van
Selm & Jankowski 2006).

METHODOLOGY
39
Table 4: Advantages and disadvantages of conducting an online survey (adapted from Sue and
Ritter 2011).
Advantages Disadvantages
Low cost
Fast
Efficient
Contingency questions effective
Direct data entry
Wide demographic reach
Coverage bias
Reliance of software
Too many digital surveys, causing
overload
4.2. Questionnaire Design
A copy of the final questionnaire can be found in Appendix A. The survey is divided into
four main sections: Objective, Company Information, Set-up Time Reduction Efforts, and
General Questions. The introductory part of the questionnaire comprises introductory
information about the aim of this study and brief explanations of technical terms (set-up time,
and external/internal set-up). The company information section includes the questions that were
created as part of this study to reach the target respondents (e.g. plant/operations/production
manager) and collect general information, including number of employment, type of facility, and
locations. The set-up time reduction efforts section consists of questions related to the set-up
time reduction efforts on selected woodworking machines. The final section, general questions,
comprises questions that ask for information about the most successful set-up time reduced
machine through set-up time reduction and (if any) the bottleneck causing machines in the
respondents’ facilities. Each section is discussed below.

METHODOLOGY
40
4.2.1. Company Information
In the Company Information section, questions are asked to assure that the survey is
answered only by suitable companies and by knowledgeable employees in individual enterprises.
Knowledgeable employees include individuals serving as plant managers, production managers,
operations managers, continuous improvement person, or maintenance crew members (Q1). This
section also asks questions directed to obtain information about:
The main product produced by their facility and whether the product type affects
set-up time reduction in facilities (Q2).
The geographical location of the respondent's facility (Q3, Q4, Q5, and Q6).
To compare the set-up time reduction efforts in the secondary wood
manufacturing firms based on their employment sizes (table 5, and Q7).
During the period 2005 to 2015, did a respondent’s facility make any effort to
reduce set-up time in their facilities (Q8)? Only answered in the affirmative,
respondents from targeted facilities are allowed to continue the questionnaire.
In this study, the sizes of enterprises/facilitates are classified into four types as follows: -
(1) Very small enterprises/facilities which employ fewer than 20 employees – (2) Small
enterprises/facilities, which employ 20 to 99 employees – (3) Medium enterprises/facilities,
which employ 100 to 499 employees – and (4) Large enterprises/facilities which employ 500 or
more employees. This classification is also used in the Statistics of U.S. Businesses report
(2015). Table 5 demonstrates the scales of enterprises/facilities based on their total number of
employees.

METHODOLOGY
41
Table 5: Classification of enterprises based on employment.
Company Category Number of Employees
Very small enterprises/facilities Fewer than 20 employees
Small enterprises/facilities 20 to 99 employees
Medium enterprises/facilities 100 to 499 employees
Large enterprises/facilities 500 or more employees
4.2.2. Set-up Time Reduction Efforts
The second section of this survey is called Set-up Time reduction efforts. In this section,
the primary concern is to find out if companies have used active, directed set-up time reduction
efforts in their facilities. If respondents have used active, directed set-up improvement efforts in
their facility, follow up questions are asked about set-up time reduction efforts on two (of four)
types of basic woodworking machines. The machines selected are: moulder, band saw, table saw,
and shaper. For these four machines, the questions were developed to understand the
effectiveness of a company’s set-up time reduction with the following inquires:
To ensure the respondents’ facilities own (at least one of) the selected
woodworking machines for this study (Q9, Q10, Q11, and Q12) and measure
success rate of the set-up time reduction on these machines.
Between 2005 and 2015, the rate of set-up time improvement (as a percentage) on
the woodworking machines (Q13, Q23, Q31, and Q39). The reason for specifying
the ten-year period is that in recent years, some companies might not have worked
on set-up time improvement on these four woodworking machines.

METHODOLOGY
42
The single most important outcome achieved with the set-up time reduction (Q14,
Q24, Q32, and Q40).
The rank of increasing throughput (productivity) depending on the set-up time
improvement on the woodworking machine (Q15, Q25, Q33, and Q41).
To find out the most successful areas of the set-up time reduction related to the
woodworking machine (Q16, Q26, Q34, and Q42).
To understand the most time consuming part of their woodworking machines’ set-
ups (Q17, Q27, Q35, and Q43).
To learn about how frequent their machines need set-up on a typical day (Q18,
Q28, Q36, and Q44).
To find out the success rate of the set-up time reduction between firms who
trained their workers/operators on how to set-up the woodworking machine and
who did not (Q19, Q29, Q37, and Q45).
To understand the effect of the training provider types (e.g. manufacturer of the
woodworking machine, and company personnel) on the set-up time reduction
success on the woodworking machine (Q20, Q30, Q38, and Q46).
4.2.3. General Questions
The General Questions section (final section) of the survey is prepared to obtain
information about where facilities were the most successful in their set-up time reduction efforts,
and to learn more about their bottleneck problems in their facilities. The aim here is to reveal if

METHODOLOGY
43
there is a connection between the bottleneck and the machine for which the most effective set-up
time reduction has been achieved. To that end, the following information was inquired about:
The machine where the largest set-up time reduction was achieved in their facility
(see Q47).
The most rewarding outcome of the set-up time reduction effort for the
respondent’s company (Q48).
The machine that creates a production bottleneck (if any) (Q49 and Q50) and the
cause of this bottleneck (Q51).
And what solution (if there is any) did they find for this bottleneck (Q52)

RESULTS
44
5. RESULTS
This chapter presents the data obtained from the web-survey and is divided into three
parts according to the sections used in the questionnaire; Company Information, Set-up Time
Reduction Efforts and General Questions.
The web-based survey conducted was accessible online for 73 days (October 06, 2015 –
December 17, 2015). During this (approximately) two and a half months surveying period, 24
completed responses were received. 23 of these responses were considered valid and analyzed.
5.1. Company Information
Respondents were asked to indicate which job positions they held (Q1). Most survey
participants were plant managers (eight of twenty-three total respondents), among the remaining
respondents were seven owners, four continuous improvement persons, two operation/production
managers, one process engineer, and one CEO (Table 6).
Table 6: The statistics on respondents’ job descriptions.
Job Descriptions Number of Participants
Plant Manager 8
Continuous Improvement Person 4
Operations / Production Manager 2
Owner 7
Process Engineering Manager 1
Pres/CEO 1
TOTAL 23
When asked about the main product produced by repondents’ facilities. Six respondents
indicated that they are Wood Kitchen Cabinet and Countertop Manufacturers (NAICS 33711),
followed by four Household, Institutional Furniture Manufacturer (NAICS 33712), four

RESULTS
45
Millwork Manufacturers (NAICS 32191), and one Office Furniture (including Fixtures)
Manufacturer (NAICS 3372). Additionally, eight respondents selected Other product types
manufacturing (Table 7). Respondents who selected the Other product types manufacturing,
specified their main product types as:
o Store fixtures,
o All of the above (note: means all the standardized answers of the question),
o Custom cabinets, furniture, millwork,
o Wood moulding,
o Cabinet Components,
o Custom wood products to customer specs,
o POP display,
o Custom AV related furniture.
When respondents were asked about the location of their facilities in North America, the
most common answer was the U.S. Only one respondent indicated that the location of his/her
facility is in Canada, while no response came from Mexico. Table 8 demonstrates the location of
respondents' facilities by state/province.
When respondents were asked about employment sizes in their facilities, 14 of them
indicated that their employment sizes are between one to 19, followed by six facilities with 20 to
99 employees, two facilities with 100 to 499 employees and one facility with the 500 or more
employees (Table 9).

RESULTS
46
Table 7: The main product category produced in respondents’ facilities.
The main product category Number of
Response
Millwork 4
Wood Kitchen Cabinet and Countertop Manufacturing 6
Household, Institutional Furniture Manufacturing 4
Office Furniture (Including Fixtures) Manufacturing 1
Other 8
Oth
er
1. All of the above
2. Store fixtures
3. Custom cabinets, furniture, millwork
4. Wood moulding
5. Cabinet Components
6. Custom wood products to customer
specs
7. POP display
8. Custom AV related furniture
TOTAL 23
Table 8: Locations of the facilities of respondents.
States/Province Number of Facilities
Th
e U
nit
ed S
tate
s
CA California 2
GA Georgia 1
IL Illinois 1
IN Indiana 1
ME Maine 1
MN Minnesota 2
NC North Carolina 3
NE Nebraska 1
NJ New Jersey 1
NY New York 2
OH Ohio 2
PA Pennsylvania 2
TX Texas 1
VA Virginia 1
WA Washington 1
TOTAL 22
Canada AB Alberta 1
TOTAL 1
TOTAL (USA&CANADA) 23

RESULTS
47
Table 9: Employement sizes in facilities of respondents.
Employment Size Number of Facilities
1 to 19 employees 14
20 to 99 employees 6
100 to 499 employees 2
500 or more employees 1
TOTAL 23
5.2. Set-up Time Reduction Efforts
When asked about any coordinated, targeted set-up time reduction efforts in respondents’
facilities between 2005 and 2015, 16 participants answered Yes while seven of the total 23
participants selected No (Appendix A). Participants who said Yes were allowed to see and
answer the rest of the questions. Of those 16 participants, we inquired about two of four
woodworking machines (moulder, table saw, band saw, and shaper) selected for this survey.
Thus, we obtained data for set-up time reduction efforts on 11 moulders, 15 table saws, 3
shapers, and 2 band saws (Table 10).
Table 10: Numbers of specified machine types.
Machine Type Number of Machines
Moulder 11
Table Saw 15
Shaper 3
Band Saw 2
TOTAL 31
5.2.1. Set-up Time Reduction Efforts: Moulder
This section presents the data obtained about set-up practices on moulders where setup
time reduction efforts have been undertaken based on 11 responses collected through the online
questionnaire. When respondents were asked considering any moulder in their facility, how they

RESULTS
48
rate their set-up time improvement results between 2005 and 2015 (Appendix A, Q13), four
respondents stated that their set-up time improvement was between 5% to 9.9 %, followed by
three respondents with 0 % to 4.9 % improvement, another three respondents with more than
15% improvement and one respondent with no improvement (Table 11).
Table 11: Set-up time improvement where setup time reduction efforts have been undertaken
on the moulder between 2005 and 2015.
Set-Up Time Improvement Number of Responses
None 1
0-4.9 % 3
5-9.9 % 4
10-14.9 % 0
More than 15 % 3
TOTAL 11
When asked about the single most important outcome from reducing the set-up time for
the moulder, five participants (corresponding to 46% of the total) answered Improved
responsiveness to customer demands, followed by two (18%) Reduced batch sizes, two (18%)
Reduction of WIP/inventory, one (9%) Increasing productivity/capacity, and one (9%)
outsourcing (Table 12).
When respondents were asked how they rank the productivity improvement (in terms of
increasing throughput) as related to the set-up time improvement on the moulders in question,
seven participants answered Little, while four of 11 participants selected A lot.
When participants were asked in which area of a moulder's set-up requirements has been
reduced, the most frequent answer was Searching for tools and equipment while doing set-up
(four answers), followed by Mounting and adjusting cutterheads (three responses), Converting

RESULTS
49
internal set-up time to external set-up time (three responses), Adjusting cutting depths and widths
(two responses), Cleaning activities (two responses), and Other (two answers; Table 13).
Table 12: The single most important outcome achieved through set-up time reduction of
moulders.
The Single Most Important Outcome Number of
Responses
Improved responsiveness to customer
demands 5
Increasing productivity/capacity 1
Reduced batch sizes 2
Reduction of WIP/inventory 2
Other - outsourcing 1
TOTAL 11
Table 13: Areas where the set-up time was reduced the most (Moulder).
Areas/places Number of
Responses
Mounting and adjusting cutterheads (knives, cutter etc.) 3
Adjusting cutting depths and widths 2
Searching for tools and equipment while doing set-up 4
Cleaning activities (e.g. removing dirt, oil, saw dust etc. from the machine) 2
Converting internal set-up time to external set-up time 3
Other 2
TOTAL 16
When asked what is the most time consuming part of a respondent’s moulder set-up, four
responses were Mounting and adjusting cutterheads, followed by two Adjusting cutting depths
and widths, two Trial runs, one Searching for tools and equipment while doing set-up, one
Cleaning activities (e.g. removing dirt, oil, saw dust etc. from the machine) and one Other. The
participant who indicated Other did not specify the most time consuming part of their moulder
set-up (Table 14).

RESULTS
50
Table 14: The most time consuming part of a moulder set-up.
The most time consuming part Number of
Responses
Mounting and adjusting cutterheads (knives, cutter etc.) 4
Adjusting cutting depths and widths 2
Searching for tools and equipment while doing set-up 1
Cleaning activities (e.g. removing dirt, oil, saw dust etc. from the machine) 1
Trial runs 2
Other 1
TOTAL 11
All respondents indicated that they train their workers/operators on how to set-up their
moulders. However, when asked about who trained their workers/operators, the most common
answer was Company personnel (nine answers), followed by Manufacturer of the moulder (two
answers) and Experts from outside of the company (two answers).
5.2.2. Set-up Time Reduction Efforts: Table Saw
This section presents the data obtained on table saws based on 15 responses collected
through the online questionnaire. When respondents were asked considering any table saw in
their facility and the respective set-up time improvement achieved between 2005 and 2015 (see
Appendix A, Q23), six respondents (corresponding to 40%) indicated that the set-up time
improvement was 0 to 4.9 percent, followed by three responses (20%) indicating improvement of
more than 15 percent improvement, two responses (13%) with a 5 to 9.9 percent improvement,
and two responses (13%) with no improvement while two other respondents (14%) did not
provide an answer (Table 15).

RESULTS
51
Table 15: Set-up time improvement where setup time reduction efforts have been undertaken
on the table saw between 2005 and 2015.
Set-Up Time Improvement Number of Responses
None 2
0 - 4.9 % 6
5 - 9.9 % 2
10 - 14.9% 0
More than 15% 3
N/A 2
TOTAL 15
When asked about the single most important outcome from reducing the set-up time for
the table saw, five participants (39%) answered Increasing productivity/capacity, followed by
two participants (15%) More frequent set-ups/improve flexibility, two participants (15%)
Reduced batch sizes, one participants (8%) Reduced maintenance due to shorter cycles, one
participants (8%) Improved responsiveness to customer demands, while two participants (15%)
selected Other. One of the participants who indicated Other specified his/her answer as “We run
all parts on a nested based CNC now. much faster” while the other one did not specified any
response (Table 16).
When respondents were asked as to how they rank the productivity improvement (e.g.,
increases in throughput) depending on the set-up time improvement on a specified table saw,
four responded either Little or Some, while two participants responded None and another two
responded A lot.
When respondents were asked as to how they rank the productivity improvement (e.g.,
increases in throughput) depending on the set-up time improvement on a specified table saw,
four responded either Little or Some, while two participants responded None and another two
responded A lot.

RESULTS
52
Table 16: The single most important outcome achieved through set-up time reduction of table
saws.
The single most important outcome Number of
Responses
Improved responsiveness to customer demands 1
Increasing productivity/capacity 5
More frequent set-ups/Improve flexibility 2
Reduced batch sizes 2
Reduced maintenance due to shorter cycles 1
Other 2
TOTAL 13
When participants were asked in which area of the table saw set-up activities time has
been reduced the most, commonly selected answers were Searching for tools and equipment
while doing set-up (four answers) compared to Adjusting cutting depths and widths (three
answers), Mounting and adjusting cutterheads (one answer), Converting internal set-up time to
external set-up time (one answer) Cleaning activities (one answer), and Other (four answers).
Participants who selected Other indicated:
o “Set-up time between parts has been reduced. Our operation runs a mixed-model,
one-piece continuous flow. Batch size of one”
o “Don't use saw much because of CNC,” and
o “Fixturing”
When asked the most time consuming part of a respondent’s table saw set-up, seven
participants (54%) answered Mounting and adjusting cutterheads, followed by two (15%) Trial
runs, two (15%) Adjusting cutting depth and width one (8%) Cleaning activities, and one (8%)
Searching for tools and equipment while doing set-up (Table 17).

RESULTS
53
Table 17: The most time consuming part of a table saw set-up.
The most time consuming part Number of
Responses
Mounting and adjusting a circular saw or a combination cutter 7
Adjusting cutting depth and width 2
Searching for tools and equipment while doing set-up 1
Cleaning activities (e.g. removing dirt, oil, saw dust etc. from the machine) 1
Trial runs 2
TOTAL 13
Except one, all respondents stated that they trained workers/operators about the set-up of
their table saw. When asked about who trained their workers/operators, the most common
answer was Company personnel (twelve answers), followed by Experts from outside of the
company (one answer).
5.2.3. Set-up Time Reduction Efforts: Shaper
This section presents the data about the shaper based on three responses collected through
the online questionnaire. When respondents were asked considering any shaper in their facility
and how they rate their set-up time improvement achieved between 2005 and 2015 (see
Appendix A, Q31), two respondents answered 5 - 9.9 % while one respondent indicated More
than 15%.
When asked about the single most important outcome from reducing the set-up time for
the shaper, one participant answered Increasing productivity/capacity one participant More
frequent set-ups/improve flexibility and the other participant’s answer was Reduced batch size.
When respondents asked how they rank the productivity (increasing throughput)
depending on the set-up time improvement on a specified shaper, two responses were A lot and
one response was Some.

RESULTS
54
When participants were asked in which area set-up time has been reduced, the most
frequent response was Adjusting cutting depth and width (two answers) while the other
participant indicated Mounting and adjusting a cutterhead.
Additionally, when asked on the training of workers/operators about the set-up of their
shapers, two respondents answered No and one respondent answered Yes. Additionally, when
asked about who trained their workers/operators, the respondent’s answer who stated Yes was
Company personnel.
5.2.4. Set-up Time Reduction Efforts: Band Saw
This section presents the data about band saws based on two responses collected through
the online questionnaire. When respondents were asked considering any band saw in their
facility as to how they rate their set-up time improvement between 2005 and 2015 (Appendix A,
Q39), one respondent answered None %, while the other respondent answered More than 15%.
When respondents were asked how they rank the productivity increases achieved (e.g.,
increasing throughput) depending on the set-up time improvement on the band saw in question,
one participant answered A lot while the other respondent did not provide an answer.
When participants were asked which activity reduced set-up time the most, both
respondents answered Other and one explanation was “Fixturing for cutting different
components” while the other respondent did not provide an answer. Similarly, when asked about
the most time consuming part of a respondent’s band saw set-up, one answer was Mounting a
blade in a machine while the other respondent did not provide a response.
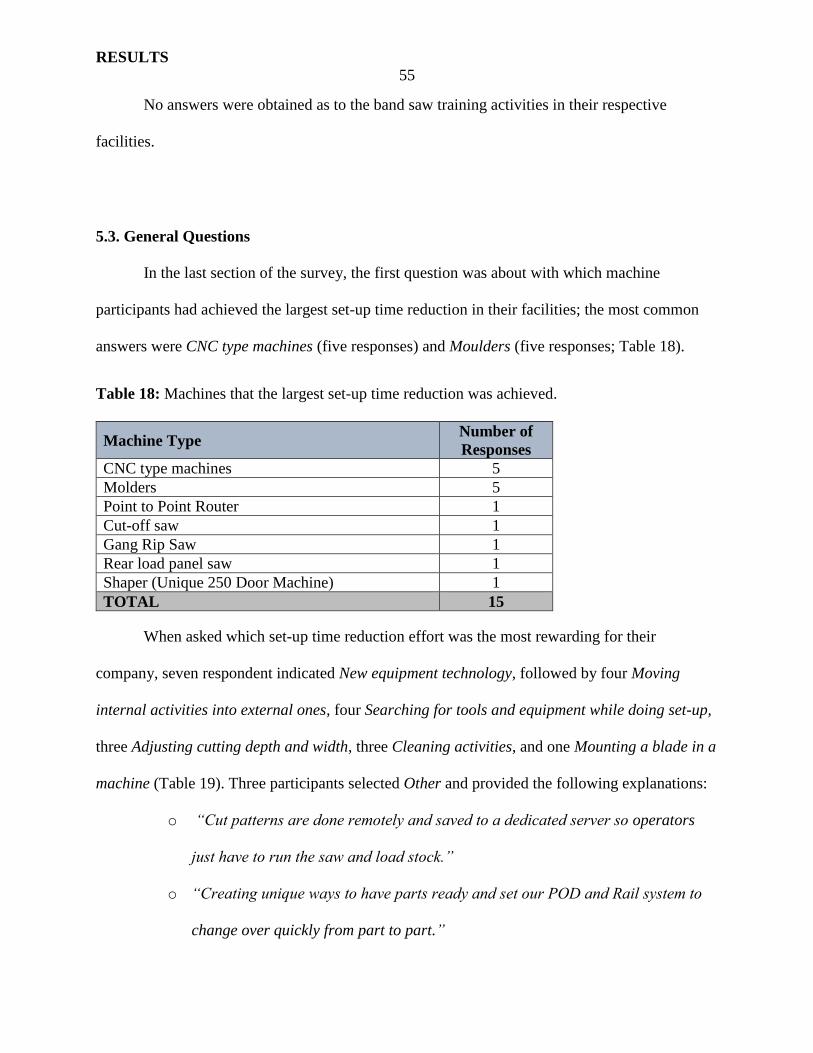
RESULTS
55
No answers were obtained as to the band saw training activities in their respective
facilities.
5.3. General Questions
In the last section of the survey, the first question was about with which machine
participants had achieved the largest set-up time reduction in their facilities; the most common
answers were CNC type machines (five responses) and Moulders (five responses; Table 18).
Table 18: Machines that the largest set-up time reduction was achieved.
Machine Type Number of
Responses
CNC type machines 5
Molders 5
Point to Point Router 1
Cut-off saw 1
Gang Rip Saw 1
Rear load panel saw 1
Shaper (Unique 250 Door Machine) 1
TOTAL 15
When asked which set-up time reduction effort was the most rewarding for their
company, seven respondent indicated New equipment technology, followed by four Moving
internal activities into external ones, four Searching for tools and equipment while doing set-up,
three Adjusting cutting depth and width, three Cleaning activities, and one Mounting a blade in a
machine (Table 19). Three participants selected Other and provided the following explanations:
o “Cut patterns are done remotely and saved to a dedicated server so operators
just have to run the saw and load stock.”
o “Creating unique ways to have parts ready and set our POD and Rail system to
change over quickly from part to part.”

RESULTS
56
o One participant did not indicate his/her response.
Table 19: The most rewarding set-up time reduction effort in respondents’ companies.
The Most Rewarding Set-Up Time Reduction Effort Number of
Responses
Moving internal activities into external ones 4
Adjusting cutting depth and width 3
Searching for tools and equipment while doing set-up 4
Cleaning activities 3
Mounting a blade in a machine 1
New equipment technology 7
Other 3
TOTAL 25
When participants were asked if they do have a machine that creates a production
bottleneck in their facilities, seven respondents answered Yes while nine respondents’ answered
No. Follow up questions, (asking for the bottleneck machine, reasons for bottlenecks, and
solutions for the specified bottleneck) were asked to the respondents who said Yes. Table 20
shows the data for those follow up questions.
Table 20: Bottleneck machines, reason for and solution to the specified bottleneck.
Bottleneck Machine Reason Solution
Drum Sander Set up time required Not specified
Ripsaw Machine failures Manufacturer engineered better parts
Door and panel clamp
machines
Glue drying Fans, and leave gaps between products
for air flow
Moulder Production needs Overtime
Auto Drilling Set up time required SMED set-up reduction
Costa Sander Speed of the
machine
Purchased another machine
CNC Speed of the
machine
Highly scheduling issues, obtained
second CNC

DISCUSSION
57
6. DISCUSSION
6.1. The Survey
The research survey on Set-up Time Reduction in Secondary Wood Manufacturing
Facilities, was conducted from October 06, 2015 to December 17, 2015. Given the importance of
the topic and with the support of one of the leading trade magazines in the U.S. (FDM&CM)
promoting the study, one would have wished for a higher participation rate than the one obtained
(twenty-three valid responses). This low response rate may be due to several reasons. One being
that the response rate of a survey is closely associated with a topic and the time required to
complete the survey (Fan & Yan 2010). Indeed, potential respondents may have avoided to
participate in the survey due to the estimated time required to complete the survey (15-20
minutes). Also, targeting multiple job positions for participants of the survey may have led to a
lower number of possible respondents as not all employees were able to answer all the survey
questions due to a lack of knowledge. Thus, potential respondents working as sales employees,
production employees, or safety employees, to name a few, might not have been able to
participate. Also, a part of possible respondents may not be able to access the Internet during
their work hours and they may not want to spend their personal time to take the survey.
Furthermore, possible respondents may consider set-up time reduction efforts as not necessarily
needed or beneficial for their facilities. Thus, it can be speculated that the Set-up Time Reduction
in Secondary Wood Manufacturing Facilities survey might not have been of considerable interest
to a majority of woodworkers. When consider the low number of responses by larger firms;
possibly larger firms do not use shapers, table saws, and band saws as extensively as smaller

DISCUSSION
58
firms while larger firms can be more likely to use moulders in their facilities than facilities of
smaller firms.
Although only a limited number of participants participated in the survey (twenty-three
participants), respondents were mostly employees in the targeted job positions (plant or
production managers, continuous improvement persons), assuring that the responses obtained
have been given by knowledgeable professionals. Thus, despite the low response rate, the
findings from this study can be considered relevant. However, the conclusions drawn from this
study only apply to the facilities of the survey participants and they do not represent the general
North American secondary wood manufacturing population or subscribers of FDM&CM.
6.1.1. Discussion of Survey Answers
6.1.1.1. Employment Size and Location
In terms of company size by employees, mostly respondents from smaller facilities
participated in the survey. Fourteen respondents out of the total of 23 indicated the employment
size in their facilities to be under 19 employees, and six respondents indicated that they have
between 20 and 99 employees, while two respondents indicated to work in facilities with 99 to
499 employees and one respondent indicated to work in a facility with 500 or more employees.
Although the survey was designed to obtain answers from three countries (the U.S., Canada, and
Mexico), with the exception of one respondent from Canada, all respondents (twenty-two
respondents) indicated that their facility is located in the U.S. Possibly, potential respondents in
Mexico may have been willing to participate if the promotion of the survey and the survey itself
would have been presented in their native language and/or be advertised in their national

DISCUSSION
59
woodworking magazine. Also, advertising the survey in an appropriate Canadian woodworking
magazine may have increased the number of responses from Canada.
6.1.1.2. Frequency of Set-up Time Reduction Efforts
Two-thirds of the respondents (sixteen of twenty-three respondents) indicated that they
made efforts to reduce set-up time in their facilities. Seven respondents (who indicated that they
did not make any efforts to reduce set-up time in their facilities) were displayed a Thank you
message and their survey was terminated. In facilities where respondents did not make any set-
up time reduction effort, managers (of facilities/firms) may not aware of benefits of set-up time
reduction, or managers may be satisfied with the set-up time spent in their facilities. However,
more research is needed to make conclusions about why there were no set-up time reduction
efforts in some facilities. Respondents who indicated that they did not make any set-up time
reduction efforts were not asked any follow up questions (only facilities who made set-up time
reduction efforts were surveyed).
6.1.1.3. Number of Responses for Machines
The survey asked questions about four machines (moulder, table saw, shaper, and band
saw), where each respondent was asked only to respond for two machines. Most data was
collected for table saws with 15 (of sixteen respondents) answering table saw related questions in
the survey. For moulders, data was obtained from 11 of the 16 respondents who indicated to
undertake set-up time reduction efforts. For shapers and band saw, we expected to obtain
somewhat lower numbers of responses as due to the logic of the online survey (respondents were

DISCUSSION
60
able to answer questions for two machines with moulder being presented first, then table saw,
followed by shaper and band saw). Therefore, only a limited number of respondents were able to
see the questions for shapers and band saws. To that end, data was collected from three
respondents for shapers, and two respondents for band saws.
6.1.1.4. Set-up Time and Productivity Improvement
For moulders, only one out of a total of 11 respondents indicated their set-up time
improvement result as None, while all the other respondents indicated that they achieved some
set-up time improvement in their facilities thanks to their set-up time reduction efforts. Set-up
time improvements (where set-up time reduction efforts have been undertaken) achieved ranged
from 0 – 4.9% in three facilities, 5 – 9.9 % in four facilities of respondents, and more than 15 %
in three facilities of respondents.
When respondents were asked about how they would rank the productivity gains
(increasing throughput) related to the set-up time improvement on their moulder, seven
respondents rated the gain as Little, while another four respondent rated the gains as A lot.
Therefore, without any exception, all the respondents who undertook set-up time reduction
efforts on their moulders indicated that they improved their productivity in terms of increasing
throughput.
For table saws, only two out of a total of 13 respondents indicated that their set-up time
improvement efforts resulted in no reduction of set-up time while the 11 remaining respondents
indicated that they achieved set-up time improvement in their facilities. Set-up time
improvement ratings ranged from 0 – 4.9% in six facilities, 5 – 9.9 % in two facilities, and, More
than 15 % in three facilities, while two respondents indicated None.

DISCUSSION
61
When respondents were asked how they would rank the productivity gains based on the
set-up time improvement achieved on their table saw (twelve responses were obtained), two
respondents indicated None was achieved, while four respondents responded that Little
improvement was gained, while another four respondents indicated that Some improvement was
achieved and two respondents rated their improvement as A lot. Overall, a majority of
respondents concerning their table saw set-up time reduction efforts (ten out of total twelve
responses) indicated productivity improvements (in terms of increasing output) related with the
set-up time improvement efforts on their table saws.
For shapers, for which only three responses were obtained, all participants indicated they
achieved at least some set-up time improvement. Two out of the total of three respondents rated
the set-up time improvement achieved between 5-9.9% while another respondent rated the
achievement as More than 15%. When respondents were asked to rate the productivity
improvement achieved thanks to the set-up time improvement on their shapers, one respondent
indicated that Some productivity was gained while another two respondents indicated that A lot
of productivity improvement was achieved.
For bands saws, only two responses were obtained, and one respondent rated their set-up
improvement as None while the other respondent rated their set-up time improvement result as
More than 15%. When respondents were asked to rate the productivity improvement depending
on the set-up time improvement achieved on their band saw the answer was A lot by the only
respondent who achieved a set-up time reduction.

DISCUSSION
62
6.1.1.5. Time Spent
When we asked questions about the most time consuming area for specific machine set-
ups, four of the 11 answers relating to the moulder were Mounting and adjusting cutterheads
(knives, cutter etc.) and for table saws seven of the 13 answers were Mounting and adjusting a
circular saw or a combination cutter. Table 21 demonstrates the number of responses given by
participants for the most time consuming area for their machine set-ups.
With respect to the four different types of woodworking machines specified in this study
(moulder, table saw, shaper, band saw), respondents indicated that the same activity (Mounting
and adjusting) is the most time consuming activity during their set-up for 13 out of a total of 28
machines (Table 21). Mounting and adjusting is being reported as the most time consuming
activity of all the set-up activities may also be related to qualifications of the employees and the
condition of the machines used and their technology in particular.
Table 21: The most time consuming areas for their machine set-ups in respondents’ facilities.
The most time consuming activity Moulder
Table
saw Shaper
Band
saw Total
Adjusting cutting depths and widths 2 2 2 0 6
Cleaning activities 1 1 0 0 2
Mounting and adjusting cutterheads 4 7 1 1 13
Searching for tools and equipment while
doing set-up 1 1 0 0 2
Trial runs 2 2 0 0 4
Other 1 0 0 0 1
TOTAL 11 13 3 1 28

DISCUSSION
63
6.1.1.6. Training
For moulders, all respondents (eleven) indicated that their employees were trained on
moulder set-ups. One question in the survey asked who trained the employees and respondents
were allowed to select more than one training source (including manufacturer of the moulder,
experts from outside of the company, and company personnel). Therefore, 13 answers were
collected from 11 respondents. Only two out of a total of 11 respondents indicated that their
workers/operators obtained training on machine set-up by more than one source; one respondent
indicated their workers/operators were trained by Company personnel as well as Manufacturer of
the moulder while the other respondent with a two-folded training strategy indicated that their
workers/operators were trained by Company personnel and by Experts from outside of the
company. However, when considering the number of answers obtained for each type of training
source, nine responses stated that Company personnel, two responses mentioned Manufacturer
of the moulder, and two responses indicated that Experts from outside of the company were
involved.
For table saws, except for one respondent, all 12 respondents indicated that their
employees were trained on the table saw set-up. The following question concerning who trained
their workers was answered by 12 respondents, who were allowed to select more than one
training source (including manufacturer of the moulder, experts from outside of the company,
and company personnel). Only one out of a total 12 respondents indicated their
workers/operators obtained training of their machine set-up from more than one source; this
respondent indicated that their workers/operators were trained by Company personnel and by the
Manufacturer of the table saw. However, 12 responses (all respondents of the related question

DISCUSSION
64
for table saws) indicated that training was done by Company personnel, and one response
indicated Manufacturer of the table saw.
For shapers, only one out of a total of three respondents indicated that their employees
were trained about the shaper set-up. The respondent also indicated their training source as being
Company personnel.
For band saws, only one respondent indicated that their employees were trained for their
band saw set-up, however, the training source/s was not specified.
Given the frequency of training performed by company personnel, it appears that
manufacturers may be reluctant to outsource set-up training to experts from outside of the
company. This may be because companies do not see a benefit to outsource or to invest their
capital to improve their set-up practices.
6.1.1.7. The Single Most Important Outcome
When respondents were asked about the single most important outcome from their set-up
time reduction efforts achieved on the machines specified (moulders, shapers, table saws, and
band saws), five respondents out of the total of 11 who replied to this question for the moulders
stated that the most important outcome was Improved responsiveness to customer demands while
five of the 13 who replied for their table saws stated that it was Increasing productivity/capacity
of their equipment. To that end, for different types of woodworking machines, respondents
indicated different achievements as the most single important outcome (Table 22). For four of
the five respondents for the moulders, who indicated the single most important outcome was
Improved responsiveness to customer demands, employment sizes in their facilities were 1-19

DISCUSSION
65
while one respondent indicated an employment size of 20-99. Similarly, for three of five
respondents on table saws who indicated the single most important outcome was Increasing
productivity/capacity, employment sizes in their facility was again 1-19 while two other
respondents indicated 20-99 and 100-99, respectively. Interestingly, smaller facilities (e.g., 1-19
facility’s employment size) indicated the same outcome for the same type of machines while
larger companies indicated varied outcomes (Table 22).
Table 22: Employment sizes and the single most important outcome through set-up
improvement in respondents’ facilities
The Single
Most Important Outcome Through
Set-up Improvement
Employment Sizes in Facilities of
Respondents
1 to
19
20 to
99
100 to
499
500 or
more
Total
Mou
lder
s
Increasing productivity/capacity 1 0 0 0 1
Reduced batch sizes 0 2 0 0 2
More frequent set-ups/Improve
flexibility
0 0 0 0 0
Improved responsiveness to
customer demands
4 1 0 0 5
Reduction of WIP/inventory 0 1 1 0 2
Outsourcing 1 0 0 0 1
Reduced maintenance due to
shorter cycles
0 0 0 0 0
Total 6 4 1 0 11
Tab
le s
aw
s
Increasing productivity/capacity 4 1 0 0 5
Reduced batch sizes 1 1 0 0 2
More frequent set-ups/Improve
flexibility
0 1 0 1 2
Improved responsiveness to
customer demands
1 0 0 0 1
Reduction of WIP/inventory 0 0 0 0 0
Reduced maintenance due to
shorter cycles
0 0 1 0 1
Other (please specify): 1 1 0 0 2
Total 7 4 1 1 13

DISCUSSION
66
6.1.2. General Questions
6.1.2.1. The Largest Set-up Time Reduction Achieved On Any Machine in Facilities
When asked about on which machine respondents achieved the largest set-up time
reduction in their shop, five out of the total 15 respondents to this question indicated moulders,
and five respondents indicated CNC type machines (Figure 22).
6.1.2.2. Most Rewarding Outcome
When asked about the most rewarding set-up reduction effort undertaken in their facility
(respondent were able to select more than one answer), the most frequent answer was New
equipment technology (seven out of twenty-five total selections from seventeen respondents)
followed by four responses for Moving internal activities into external ones, four responses for
Searching for tools and equipment while doing set-up, three responses for Adjusting cutting
depth and width, three responses for Cleaning activities, one response for Mounting a blade in a
machine and three responses for Other. Respondents who indicated Other, specified their
answers as “Creating unique ways to have parts ready and set our POD and Rail system to
change over quickly from part to part,” and “Cut patterns are done remotely and saved to a
dedicated server so operators just have to run the saw and load stock,” while other respondent
did not specify the most rewarding set-up time reduction effort in their facility.
6.1.2.3. Bottleneck Machines
Seven responses were received about the question on the existence of a piece of
equipment in their facility that creates a bottleneck. Each of the seven respondents specified a

DISCUSSION
67
different type of machine, ranging from drum sander, ripsaw, door and panel clamp machines, to
moulder, to name a few (Table 20). The follow-up questions then asked about the reasons for the
bottlenecks on these machines. We speculated that a frequent answer would refer to the set-up
time required. However, only two out of the total seven respondents indicated that set-up time
required indeed played a role. Only one of these two respondents answered the question as to
how they solved their bottleneck problem. This respondent stated that they used SMED set-up
reduction efforts to reduce their bottleneck problem (Appendix B).
6.2. Referring to Earlier Literature
While no direct comparisons between this and similar studies about set-up time reduction
efforts in the U.S. wood products industry are possible due to a lack of such studies, comparisons
with findings from set-up time reduction efforts in other manufacturing industries are possible.
The studies conducted by Bavuluri (2012), Yang et al. (1993), and Sheri et al. (2005), indicate
benefits of set-up time reduction efforts and reveal numerous benefits that can be obtained by
reducing set-up time. Yang et al. (1993) show that reducing set-up time allows firms to increase
delivery speed, a finding similar to the one indicated by several participants of this study
(especially for moulders, Table 12). Several respondents of this study on set-up time reduction
efforts in the U.S. wood products industry presented in this thesis also indicated that the single
most important outcome from their set-up time reduction efforts is the Improved responsiveness
to customer demands. Also, several participants in the study discussed in this thesis also
indicated the most successful area for their set-time reduction efforts to be Mounting and
adjusting cutterheads; a finding similar to the one by Bavuluri (2012), who described a reduction

DISCUSSION
68
of the loading and unloading time of products from a machine thanks to newly designed handling
tools.
As Yang et al. (1993) mention in their study, reductions in cell flow time, in the variance
of the cell flow time, and in the optimal product batch sizes obtained by set-up time reduction
allows enterprises to accomplish increased delivery speed and reliability, quicker response to
market changes, and higher flexibility to customization requirements. In the study at hand, in
regards of increasing delivery speed, several respondents indicated that their set-up time
reduction efforts resulted in Improved responsiveness to customer demands. However, when
consider faster responses to market changes and increased flexibility for customer orders, only a
few of respondents of the current study (two responses for table saws, and one response for
shaper) indicated benefits in being able to conduct More frequent set-ups/improve flexibility.
Sheri et al. (2005) also mentioned that they conservatively estimated (due to not having
hard data) that their set-up improvement efforts resulted in reducing the time for searching for
parts (with the use of the feeder management system installed as part of set-up time reduction
effort). Similarly, several respondents in this study indicated that they reduced their machine
setup time the most in the area of Searching for tools and equipment while doing set-up.
Thus, earlier studies such as Sheri et al. (2005) Set-up time reduction for electronics
assembly: Combining simple (SMED) and IT-based methods, Bavuluri (2012) Set Up Time
Reduction and Quality Improvement On the Shop Floor Using Different Lean and Quality Tools,
and Yang et al. (1993) Set-up time reduction and competitive advantage in a closed
manufacturing cell obtained similar results on the benefits of successful set-up time reduction
efforts, including but not limited to reduced set-up time and increased delivery speed.

DISCUSSION
69
6.3. Future Research
To make more generalizable conclusions from this survey, more data points are needed to
allow for statistical evaluation. However, this research serves as a valuable starting point to
conduct further studies about set-up time reduction in secondary wood manufacturing
enterprises. Should such a follow-up study become reality, some questions to consider should be:
Do secondary wood manufacturing enterprises use lean techniques in their facilities, if so
how they approach set-up time reduction tools e.g., do they consider set-up time reduction as
beneficial/useful or not needed?
Do secondary wood manufacturing firms use Lean techniques in their facility? Do they
provide training to their employees to improve implementation of Lean techniques in their
facility? What is the primary source of training and why do they choose this type of training
(e.g., having limited budget may not allow to outsource training)? In which cases do companies
outsource their training (e.g., installation a new production line, and acquiring new equipment)?
Possible problems (e.g., bottlenecks, long lead times, and less frequent set-ups etc.) can
be caused by the set-up time required can be examined. If secondary wood manufacturing firms
have encountered bottleneck problems related with set-ups, how have these problems affected
their production, what was their solution? Also, efforts should be made to discover difficulties of
applying the solutions (e.g., length of the time, the amount of the capital investments, providing
training etc.).
Above questions can be varied and elaborated to conduct further studies to reveal more
information about set-up time reduction efforts in wood manufacturing facilities. Additionally,

DISCUSSION
70
results from further studies may allow wood manufacturing enterprises to obtain benefits from
set-up time reduction applications more effectively.
In terms of widely used woodworking machines in the secondary wood manufacturing
industry, this study intended to understand the set-up time reduction efforts and the benefits
obtained thorough set-up time reduction efforts in North American enterprises. Even though too
little responses were collected for a thorough statistical analysis, helpful insights were obtained.
To that end, in general, participants indicated their set-up time reduction efforts were successful
and resulted in quite sizable degrees of improvement (e.g., 5 – 9.9 %, and More than 15%
savings in time to set-up a particular piece of equipment). Participants also mentioned that their
set-up time reduction efforts returned in the form of productivity gains with the corresponding
increase in throughput. Undertaking successful set-up time reduction efforts and set-up training
in wood manufacturing firms can be done inexpensively when using Company personnel for the
improvement. As this study shows, the vast majority of participants acquired considerable
benefits from their set-up time reduction efforts including Increasing productivity/capacity, and
Improved responsiveness to customer demands.

CONCLUSIONS
71
7. CONCLUSIONS
The main idea behind this study was to explore the set-up time reduction efforts and its
success rate relating to size of firms in secondary wood manufacturing firms in North America.
To that end, four types of widely used woodworking machines (moulder, table saw, shaper saw,
and band saw) were chosen. Based on the four types of woodworking machines, a web-based
questionnaire was designed and released to members of the secondary woodworking industry to
collect the data required. Invitations for the web-based questionnaire were mailed to industry
participants and the survey was accessible for 73 days. During this time period, participation in
this survey was disappointing low and only 23 respondents contributed valid answers. Among 23
participants, 16 participants indicated they made set-up time reduction efforts in their facilities.
Unfortunately, the data obtained was insufficient to statistically test the hypotheses of this study.
However, based on the responses obtained, the following observation can be made for the
participating respondents.
The first hypothesis of this study wanted to test “H01: Small firms are less successful in
reducing set-up time through set-up time reduction efforts than are large firms.” Even though
limited data is available, no relationship between a facility’s employment size and the success
rate of set-up time reduction efforts could be found. In fact, varying success rates for set-up time
improvement were indicated by participants of all firm sizes.
The second hypothesis of this study reads “H02: Small firms achieve lower productivity
gains through set-up time reduction than do large firms.” Unfortunately, not enough data points
were collected to make statistical inferences about the relationship between facility size and
productivity improvement. However, a majority of respondents indicated that they increased
their productivity thorough set-up time improvement on their machines.

CONCLUSIONS
72
The third hypothesis of this study, which reads “H03: Small firms are less concerned with
set-up time reduction through training than are large firms.” While testing this hypothesis was
not possible, the majority of participants from all size groups indicated that their employees are
trained on making set-ups of their machines. Additionally, the majority of respondents indicated
that they used company personnel to train employees. Based on the data obtained, it appears that
the size of a facility was not a criteria influencing the training of employees on set-up time
reduction.
The fourth hypothesis of this study stated “H04: In both large and small firms, bottlenecks
occur at machines with high set-up times.” Based on the limited set of responses to this question,
it appears that set-up time was not a common reason for the occurrence of production
bottlenecks. In fact, of seven respondents who answered the questions related to bottlenecks,
only two respondents indicated that the cause of their bottleneck was the length of their machine
set-ups.

REFERENCES 73
REFERENCES
Abdullah, F. (2003). Lean manufacturing tools and techniques in the process industry with a
focus on steel. (Doctoral dissertation), University of Pittsburgh, Pittsburgh, PA.
Achanga, P., Shehab, E., Roy, R., & Nelder, G. (2006). Critical success factors for lean
implementation within SMEs. Journal of Manufacturing Technology Management, 17(4),
460-471.
Albert, M. (2004). Setup reduction: At the heart of lean manufacturing. Modern Machine Shop,
76(11), 66.
Arumugam, V., Antony, J., & Douglas, A. (2012). Observation: A lean tool for improving the
effectiveness of lean six sigma. The TQM Journal, 24(3), 275-287.
doi:10.1108/17542731211226781
Ayokanmbi, F. M. (2007). Evaluation of setup time reduction alternatives using a real options
approach. Dissertation Abstracts International, 68(11).
Ayokanmbi, F. M. (2007). Evaluation of setup time reduction alternatives using a real options
approach. (Doctoral dissertation), The University of Alabama, Huntsville, AL.
Bavuluri, S. R. (2012). Set up time reduction and quality improvement on the shop floor using
different lean and quality tools. (M.S.), Clemson University, Clemson, SC.
Bonometti, R. J., & Tang, J. (2006). A dynamic technique for conducting online survey-based
research. Competitiveness Review: An International Business Journal, 16(2), 97-105.
Cakmakci, M. (2009). Process improvement: performance analysis of the setup time reduction-
SMED in the automobile industry. The International Journal of Advanced Manufacturing
Technology, 41(1-2), 168-179. doi: 10.1007/s00170-008-1434-4
Cakmakci, M., & Karasu, M. K. (2007). Set-up time reduction process and integrated
predetermined time system MTM-UAS: A study of application in a large size company
of automobile industry. The International Journal of Advanced Manufacturing
Technology, 33(3), 334-344. doi: 10.1007/s00170-006-0466-x
Center for Industrial Research and Service. (n.d.). Lean: Setup Reduction. Retrieved from
http://www.ciras.iastate.edu/productivity/leansetupreduction.asp
Čiarnienė, R., & Vienažindienė, M. (2012). Lean manufacturing: Theory and practice.
Economics & Management, 17(2), 726-732. doi: 10.5755/j01.em.17.2.2205
Conner, G. (2001). Lean Manufacturing for the Small Shop. Dearborn, MI: Society of
Manufacturing Engineers.

REFERENCES
74
D&I Partners, Inc. (n.d.). TPS house [Pdf file]. Retrieved from
http://dipartners.net/TPS_House.pdf
Dennis, P. (2007). Lean Production simplified: A plain-language guide to the world's most
powerful production system. New York, NY: Productivity Press.
Diego Fernando, M. D., & Rivera Cadavid, L. (2007). Lean manufacturing measurement: the
relationship between lean activities and lean metrics. Estudios Gerenciales, 23(105), 69-
83. doi: http://dx.doi.org/10.1016/S0123-5923 (07)70026-8
Enginarlar, E. (2003). Lean buffering in production systems: A quantitative approach. (Doctoral
dissertation). University of Michigan, Ann Arbor, MI.
Erdogan, S. (2015). Development of a tool to measure the effectiveness of kaizen events within
the wood products industry. (M.S.), Virginia Polytechnic Institute and State University,
Blacksburg, VA.
Fan, W., & Yan, Z. (2010). Factors affecting response rates of the web survey: A systematic
review. Computers in human behavior, 26(2), 132-139.
Fricke, C. F. (2010). Lean management awareness, implementation status, and need for
implementation support in Virginia’s wood industry. (M.S.), Virginia Polytechnic
Institute and State University, Blacksburg, VA.
Funston, S. B. (2013). Lean quality: Application of lean tools to non-manufacturing,
transactional office environments in the medical device industry. (M.S.), California State
University, Dominguez Hills, CA.
Gao, S., & Low, S. P. (2014). Lean Construction Management: The Toyota Way. Singapore:
Springer Singapore.
Goldratt, E. M. & Cox, J. 1992. The Goal. Great Barrington, MA: North River Press, Inc.
Great Book. (n.d.). Determining Statistical Confidence in a Survey. Retrieved from
http://www.greatbrook.com/survey_statistical_confidence.htm
Haak, R. (2006). Implementing process innovation—the case of the Toyota Production System
management of technology and innovation in Japan. C. Herstatt, C. Stockstrom, H.
Tschirky and A. Nagahira (Eds.), Management of Technology and Innovation in Japan
(pp. 185-203). Heidelberg, Berlin: Springer.
Herrmann, C., Thiede, S., Stehr, J., & Bergmann, L. (2008). An environmental perspective on
lean production. In M. Mitsuishi, K. Ueda and F. Kimura (EDs.), Manufacturing Systems
and Technologies for the New Frontier (pp. 83-.88). London: Springer.
Hettler, N. (2008, January). Lean means business. Manufacturing Engineering, 140(1), 103-109.
Hill, R. & J. Stewart (2000). Human resource development in small organizations. Journal of
European Industrial Training 24(2/3/4): 105-117.
Hinckley, C. M. (2007). Combining mistake-proofing and Jidoka to achieve world class quality
in clinical chemistry. Accreditation and quality assurance, 12(5), 223-230.

REFERENCES
75
Hopp, W. J., & Spearman, M. L. (2011). Factory physics. Lon Grove, IL: Waveland Press.
Huang, T. (2008). Implementing lean initiative by starting with standardized work. (M.S.),
California State University, Dominguez Hills, CA.
Illinois Manufacturing Excellence Center (IMEC). (n.d.). Solutions Source: Reducing Set-up
Times: A Foundation for Lean Manufacturing. Retrieved from
http://www.imec.org/SS-Reducing-Setup-Times.cfm
International Labor Organization (ILO). (n.d.). Chapter 86 - Woodworking. Retrieved from
http://www.ilocis.org/documents/chpt86e.htm
International Organization of Motor Vehicle Manufacturers (Organisation Internationale des
Constructeurs d’Automobiles or OICA). (2013). World motor vehicle production.
Retrieved from http://www.oica.net/wp-content/uploads/2013/03/ranking-2012.pdf\
Kasul, R. A., & Motwani, J. G. (1997). Successful implementation of TPS in a manufacturing
setting: a case study. Industrial Management & Data Systems, 97(7), 274-279. doi:
10.1108/02635579710191707
Kisembo Michael M. (n.d.). Multi-Professional Consultants LLC (MPC), Just in Time
Management Philosophy & Practice. Retrieved from
http://www.multiprofessionals.com/index.php/consultancy-just-in-time-management-
philosophy-practice/.
Koole, S. E. (2005). Removing borders: The influence of the Toyota production system on an
American office furniture manufacturer. (M.S.), Grand Valley State University,
Allendale, MI.
Lander, E., & Liker, J. K. (2007). The Toyota Production System and art: making highly
customized and creative products the Toyota way. International Journal of Production
Research, 45(16), 3681-3698. doi: http://dx.doi.org/10.1080/00207540701223519
Lean Enterprise Institute. (n.d.). Principles of Lean. Retrieved from
http://www.lean.org/whatslean/principles.cfm
Li, J. W. (2003). Improving the performance of job shop manufacturing with demand-pull
production control by reducing set-up/processing time variability. International Journal
of Production Economics, 84(3), 255-270.
Liker, J. K. (2004). The Toyota Way: 14 management principles from the world's greatest
manufacturer. New York: McGraw-Hill.
Liker, J. K., & Meier, D. (2006). The Toyota way fieldbook: A practical guide for implementing
Toyota’s 4Ps. New York, NY: McGraw-Hill.
Liker, J. K., & Morgan, J. M. (2006). The Toyota way in services: the case of lean product
development. The Academy of Management Perspectives, 20(2), 5-20. doi:
10.2307/4166229

REFERENCES
76
Markgraf, B., & Media, D. (n.d.). How to Identify Bottlenecks in Manufacturing. Retrieved
from http://smallbusiness.chron.com/identify-bottlenecks-manufacturing-72465.html
McIntosh, R., Owen, G., Culley, S., & Mileham, T. (2007). Changeover Improvement:
Reinterpreting Shingo's “SMED” Methodology. Engineering Management, IEEE
Transactions on, 54(1), 98-111.
McLeod, A. A. (2009). An assessment of small to medium size manufacturers practicing lean
manufacturing in Indiana. (Doctoral dissertation), Purdue University, Lafayette, IN.
Meredith, J. R., & McTavish, R. (1992). Organized manufacturing for superior market
performance. Long Range Planning, 25(6), 63-71.
Monden, Y. (2011). Toyota production system: an integrated approach to just-in-time: Boca
Raton, FL: CRC Press.
Morgan, J. M., & Liker, J. K. (2006). The Toyota product development system: Integrating
people, process, and technology. New York: Productivity Press.
Qualtrics. (2005). Qualtrics: Online Survey Software & Insight Platform. Retrieved from
http://www.qualtrics.com/
Quesada-Pineda, H. J., & Buehlmann, U. (2011). Lean Thinking: Examples and Applications in
the Wood Products Industry. Virginia Cooperative Extension, Publication 420-002.
Ramalingam, M. (2008). Standardization of work cells for high variety, low volume
manufacturing. (M.S.), Lamar University, Beaumont, TX.
Rose, A. N. M., Deros, B. M., & Rahman, M. N. A. (2009). A review on lean manufacturing
practices in small and medium enterprises. Proceeding Seminar 2 AMREG, Kajang,
Selangor, Malaysia.
Sánchez, A. M., & Pérez, M. P. (2001). Lean indicators and manufacturing strategies.
International Journal of Operations & Production Management, 21(11), 1433-1452.
Sheri C, T., & Bohn, R. E. (2005). Setup Time Reduction for Electronics Assembly:
Combining Simple (SMED) and IT-Based Methods. Production and Operations
Management, 14(2), 205-217.
Shingo, S. (1985). A revolution in manufacturing: the SMED system: .Portland,OR: Productivity
Press.
Shuker, T. J. (2000). The leap to lean. Paper presented at the Annual Quality Congress
Proceedings-American Society for Quality Control., Indianapolis. Milwaukee: American
Society for Quality.105-112.
Statistics of U.S. Businesses. (2015). Number of Firms, Number of Establishments,
Employment, and Annual Payroll by Enterprise Employment Size for the United States,
All Industries: 2012. Retrieved from http://www.census.gov/econ/susb/index.html
Sue, V. M., & Ritter, L. A. (2011). Conducting online surveys. Los Angeles: Sage Publications.

REFERENCES
77
Taiichi, O. (1988). Toyota production system: beyond large-scale production. Productivity Press,
Cambridge, MA: Productivity Press.
Trevino, J., Hurley, B. J., & Friedrich, W. (1993). A mathematical model for the economic
justification of setup time reduction. International Journal of Production Research,
31(1), 191-202.
U.S. Census Bureau. (2012). 2012 NAICS definition: 321: wood product manufacturing
Retrieved from http://www.census.gov/eos/www/naics/index.html
U.S. Census Bureau. (2012). 2012 NAICS definition: 321113: sawmills. Retrieved from
http://www.census.gov/eos/www/naics/index.html
U.S. Census Bureau. (2012). 2012 NAICS definition: 321114: wood preservation. Retrieved
from http://www.census.gov/eos/www/naics/index.html
U.S. Census Bureau. (2012). 2012 NAICS definition: 32191: millwork. Retrieved from
http://www.census.gov/eos/www/naics/index.html
U.S. Census Bureau. (2012). 2012 NAICS definition: 321911: wood window and door
manufacturing. Retrieved from http://www.census.gov/eos/www/naics/index.html
U.S. Census Bureau. (2012). 2012 NAICS definition: 321912: cutstock, resawing lumber, and
planning. Retrieved from http://www.census.gov/eos/www/naics/index.html
U.S. Census Bureau. (2012). 2012 NAICS definition: 321918: other millwork (including
flooring). Retrieved from http://www.census.gov/eos/www/naics/index.html
U.S. Census Bureau. (2012). 2012 NAICS definition: 337: furniture and related product
manufacturing. Retrieved from http://www.census.gov/eos/www/naics/index.html
U.S. Census Bureau. (2012). 2012 NAICS definition: 3371: household and institutional furniture
and kitchen cabinet manufacturing. Retrieved from
http://www.census.gov/eos/www/naics/index.html
U.S. Census Bureau. (2012). 2012 NAICS definition: 33711: wood kitchen cabinet and
countertop manufacturing. Retrieved from
http://www.census.gov/eos/www/naics/index.html
U.S. Census Bureau. (2012). 2012 NAICS definition: 33712: household, institutional furniture
manufacturing. Retrieved from http://www.census.gov/eos/www/naics/index.html
U.S. Census Bureau. (2012). 2012 NAICS definition: 337121: upholstered household furniture
manufacturing. Retrieved from http://www.census.gov/eos/www/naics/index.html
U.S. Census Bureau. (2012). 2012 NAICS definition: 337122: nonupholstered wood household
furniture manufacturing. Retrieved from
http://www.census.gov/eos/www/naics/index.html
U.S. Census Bureau. (2012). 2012 NAICS definition: 337124: metal household furniture
manufacturing. Retrieved from http://www.census.gov/eos/www/naics/index.html

REFERENCES
78
U.S. Census Bureau. (2012). 2012 NAICS definition: 337127: institutional furniture
manufacturing. Retrieved from http://www.census.gov/eos/www/naics/index.html
U.S. Census Bureau. (2012). 2012 NAICS definition: 3372: office furniture (including fixtures)
manufacturing. Retrieved from http://www.census.gov/eos/www/naics/index.html
U.S. Census Bureau. (2012). 2012 NAICS definition: 337211: wood office furniture
manufacturing. Retrieved from http://www.census.gov/eos/www/naics/index.html
U.S. Census Bureau. (2012). 2012 NAICS definition: 337212: custom architectural woodwork
and millwork manufacturing. Retrieved from
http://www.census.gov/eos/www/naics/index.html
U.S. Census Bureau. (n.d.). Data Tables by Enterprise Employment Size, U.S., all industries.
Retrieved from http://www2.census.gov/econ/susb/data/2012/us_6digitnaics_2012.xls
University of Wisconsin-Extension (UMEX). (2002). Additional PD&E Resources Quick Tips
Numerical List. Retrieved from
http://www.uwex.edu/ces/pdande/resources/quicktipsnumerical.html
Upadhye, N., Deshmukh, S. G., & Garga, S. (2010). Lean manufacturing for sustainable
development. Global Business & Management Research, 2(1), 125-137.
Van Selm, M., & Jankowski, N. W. (2006). Conducting online surveys. Quality and Quantity,
40(3), 435-456.
Verduft, J. (1999). The lean manufacturing enterprise. Paper presented at the Annual Quality
Congress Proceedings-American Society for Quality Control, Anaheim. Milwaukee:
American Society for Quality.
Wadhwa, R. S. (2012). Flexibility in manufacturing automation: A living lab case study of
Norwegian metalcasting SMEs. Journal of Manufacturing Systems, 31(4), 444-454
White, J. H. (2000). Lean manufacturing: An industrywide study in application. (M.S.),
California State University, Dominguez Hills, CA.
Whitmore, T. (2008). Standardized Work. Manufacturing Engineering, 140(5), 171-179.
Womack, J. P., & Jones, D. T. (1996). Lean thinking: Banish waste and create wealth in your
organization. New York: Simon and Shuster.
Womack, J. P., Jones, D. T., Roos, D., & Massachusetts Institute of Technology. (1990). The
machine that changed the world: Based on the Massachusetts Institute of Technology 5-.
million dollar 5-year study on the future of the automobile. New York: Rawson
Associates.
Yang, J., & Deane, R. H. (1993). Setup time reduction and competitive advantage in a closed
manufacturing cell. European Journal of Operational Research, 69(3), 413-423.
doi:10.1016/0377-2217(93)90025-I

REFERENCES
79
Zammori, F., Braglia, M., & Frosolini, M. (2011). A measurement method of routing flexibility
in manufacturing systems. International Journal of Industrial Engineering
Computations, 2(3), 593-616.

APPENDIX
80
APPENDIX A: THE SURVEY QUESTIONS

APPENDIX
81

APPENDIX
82

APPENDIX
83

APPENDIX
84

APPENDIX
85

APPENDIX
86

APPENDIX
87

APPENDIX
88

APPENDIX
89

APPENDIX
90

APPENDIX
91

APPENDIX
92

APPENDIX
93

APPENDIX
94

APPENDIX
95

APPENDIX
96
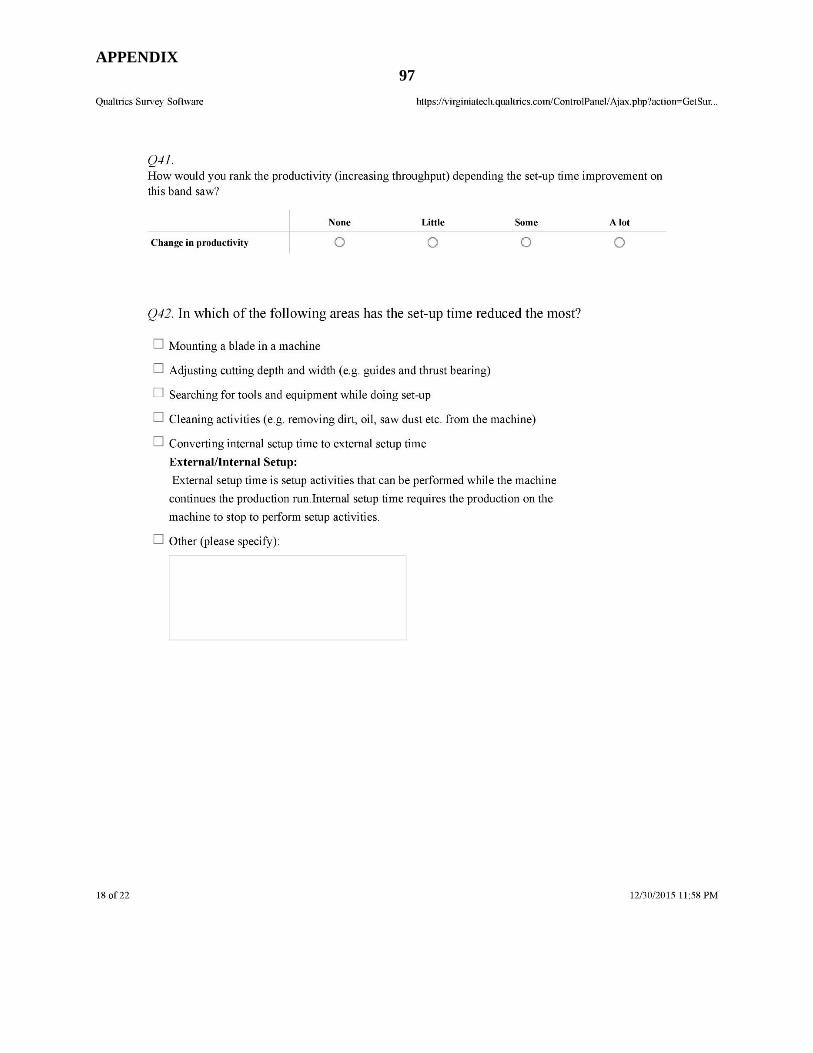
APPENDIX
97

APPENDIX
98

APPENDIX
99

APPENDIX
100

APPENDIX
101

APPENDIX
102
APPENDIX B: COLLECTED DATA, NUMBER OF RESPONSES, ANSWERS
OBTAINED
Please indicate your position (check one):
Number of
responses
Plant Manager 8
Continuous Improvement Person 4
Operations / Production Manager 2
Other = Owner 7
Oher = Process Engineering Manager 1
Other = Pres/CEO 1
TOTAL 23
Please check one of the following categories which describes the main
product produced by your facility (check one):
Number of
responses
Millwork 4
Wood Kitchen Cabinet and Countertop Manufacturing 6
Household, Institutional Furniture Manufacturing 4
Office Furniture (Including Fixtures) Manufacturing 1
Other 8
TOTAL 23
In which country is your facility located?
Number of
responses
Canada 1
The U.S. 22
TOTAL 23

APPENDIX
103
In which state is your facility located? In which province or territory is
your facility located
Number of
responses
USA CA California 2
USA GA Georgia 1
USA IL Illinois 1
USA IN Indiana 1
USA ME Maine 1
USA MN Minnesota 2
USA NC North Carolina 3
USA NE Nebraska 1
USA NJ New Jersey 1
USA NY New York 2
USA OH Ohio 2
USA PA Pennsylvania 2
USA TX Texas 1
USA VA Virginia 1
USA WA Washington 1
USA TOTAL 22
CANADA AB Alberta
TOTAL (USA&CANADA) 23
Please indicate how many employees are currently employed in your facility and, if your
company is a multifacility operation, in your country (incl. your facility) and, if your
company has international facilities, worldwide (incl. your country):
1-19 20-99
100 -
499
500 or
more
Total
Responses
In your facility (please indicate) 14 6 2 1 23
In your country (incl. your facility) 14 4 2 2 22
Worldwide (incl. your country) 13 3 2 2 20

APPENDIX
104
Has your facility made any coordinated, targeted set-up time reduction
efforts during the last 10 years (e.g., formal training, technology investment,
renewing machine/equipment and others)?
Number of
responses
Yes 16
No 7
TOTAL 23
Is your facility using moulders (moulders), table saws, shapers, and band
saws to produce your products?
Number of
responses
Moulder 11
Table saw 15
Band saw 3
Shaper 2
TOTAL 31
Between 2005 and 2015, considering any moulder in your facility (where
setup time reduction efforts have been undertaken), how do you rate the
setup time improvement?
Number of
responses
None 1
0 - 4.9 % 3
5 - 9.9 % 4
More than 15% 3
TOTAL 11
Given your success in reducing the set-up time for the moulder, please check
the single most important outcome from the list below?
Number of
responses
Improved responsiveness to customer demands 5
Increasing productivity/capacity 1
Reduced batch sizes 2
Reduction of WIP/inventory 2
Other (please specify): 1
TOTAL 11

APPENDIX
105
How would you rank the productivity (increasing throughput) depending
the setup time improvement on this moulder?
Number of
responses
None 0
Little 7
A lot 4
Some 0
TOTAL 11
In which of the following areas has the setup time reduced the most?
Number of
responses
Mounting and adjusting cutterheads (knives, cutter etc.) 3
Adjusting cutting depths and widths 2
Searching for tools and equipment while doing set-up 4
Cleaning activities (e.g. removing dirt, oil, saw dust etc. from the machine) 2
Converting internal set-up time to external set-up time 3
Other 2
TOTAL 16
Please indicate what is the most time consuming part of your moulder
setup?
Number of
responses
Adjusting cutting depths and widths 2
Cleaning activities (e.g. removing dirt, oil, saw dust etc. from the machine) 1
Mounting and adjusting cutterheads (knives, cutter etc.) 4
Searching for tools and equipment while doing set-up 1
Trial runs 2
Other 1
TOTAL 11
How often do you setup the moulder on a typical day?
Number of
responses
Yes 11
No 0
TOTAL 11
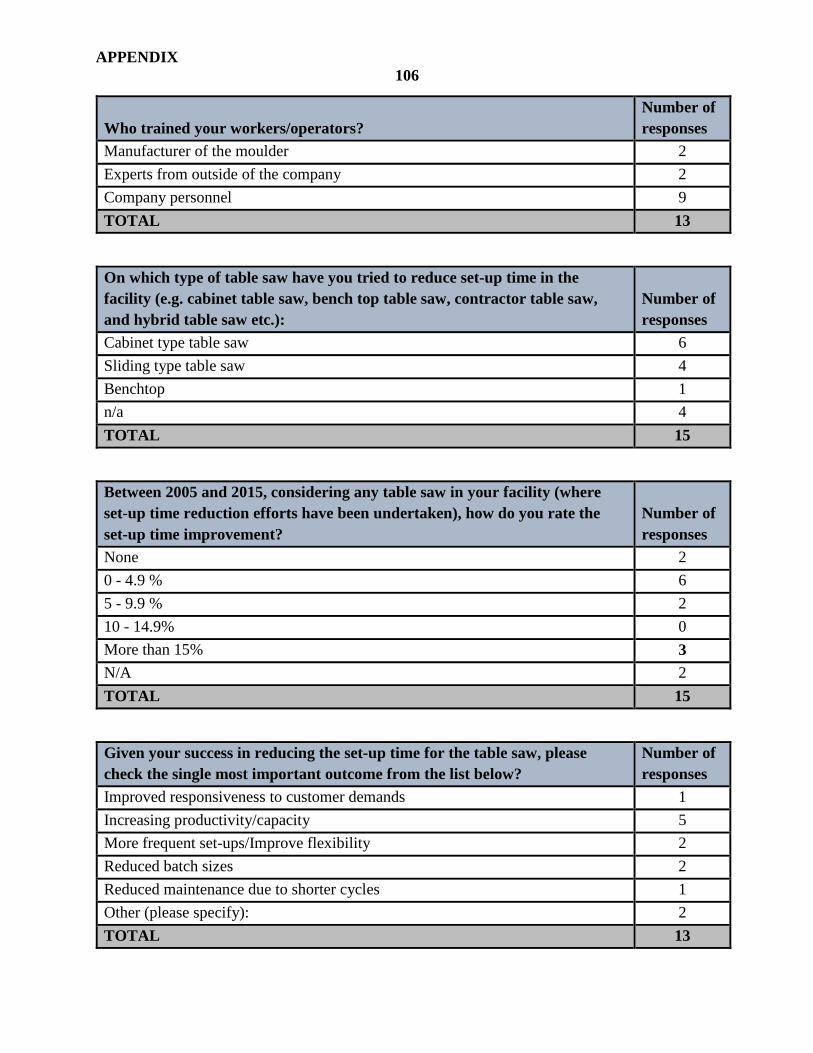
APPENDIX
106
Who trained your workers/operators?
Number of
responses
Manufacturer of the moulder 2
Experts from outside of the company 2
Company personnel 9
TOTAL 13
On which type of table saw have you tried to reduce setup time in the
facility (e.g. cabinet table saw, bench top table saw, contractor table saw,
and hybrid table saw etc.):
Number of
responses
Cabinet type table saw 6
Sliding type table saw 4
Benchtop 1
n/a 4
TOTAL 15
Between 2005 and 2015, considering any table saw in your facility (where
setup time reduction efforts have been undertaken), how do you rate the
setup time improvement?
Number of
responses
None 2
0 - 4.9 % 6
5 - 9.9 % 2
10 - 14.9% 0
More than 15% 3
N/A 2
TOTAL 15
Given your success in reducing the set-up time for the table saw, please
check the single most important outcome from the list below?
Number of
responses
Improved responsiveness to customer demands 1
Increasing productivity/capacity 5
More frequent set-ups/Improve flexibility 2
Reduced batch sizes 2
Reduced maintenance due to shorter cycles 1
Other (please specify): 2
TOTAL 13

APPENDIX
107
How would you rank the productivity (increasing throughput) depending
the setup time improvement on this table saw?
Number of
responses
None 2
Little 4
Some 4
A lot 2
TOTAL 12
In which of the following areas has the setup time reduced the most?
Number of
responses
Mounting and adjusting a circular saw or a combination cutter 1
Adjusting cutting depth and width 3
Searching for tools and equipment while doing set-up 4
Cleaning activities (e.g. removing dirt, oil, saw dust etc. from the machine) 1
Converting internal set-up time to external set-up time 1
Other (please specify): 4
TOTAL 14
Please indicate that what is the most difficult (time consuming) part of your
table saw setup?
Number of
responses
Adjusting cutting depth and width 2
Cleaning activities (e.g. removing dirt, oil, saw dust etc. from the machine) 1
Mounting and adjusting a circular saw or a combination cutter 7
Searching for tools and equipment while doing set-up 1
Trial runs 2
TOTAL 13
How often do you setup the table saw on a typical day? (Respondents answers)
#
2
#
1
#
5
#
20
#
4
#
8
#
0.2
#
10
#
2
#
25
#
8
Up to 1,000 adjustments could be
made during a reduction run
#
5

APPENDIX
108
Have your workers/operators obtained training about "how to setup a table
saw" in your facility?
Number of
responses
Yes 12
No 1
TOTAL 13
Who trained your workers/operators?
Number of
responses
Manufacturer of the table saw 1
Company personnel 12
TOTAL 13
Between 2005 and 2015, considering any shaper in your facility (where setup
time reduction efforts have been undertaken), how do you rate the setup
time improvement?
Number of
responses
None 0
0 - 4.9 % 0
5 - 9.9 % 2
10 - 14.9% 0
More than 15% 1
TOTAL 3
Given your success in reducing the set-up time for the shaper, please check
the single most important outcome from the list below?
Number of
responses
Increasing productivity/capacity 1
More frequent set-ups/Improve flexibility 1
Reduced batch sizes 1
TOTAL 3

APPENDIX
109
How would you rank the productivity (increasing throughput) depending
the set-up time improvement on this shaper
Number of
responses
None 0
Little 0
Some 1
A lot 2
TOTAL 3
In which of the following areas has the setup time reduced the most?
Number of
responses
Adjusting cutting depth and width 2
Mounting and adjusting a cutterhead (knife, cutter etc.) 1
TOTAL 3
Please indicate that what is the most difficult (time consuming) part of your
shaper setup?
Number of
responses
Adjusting cutting depth and width 2
Mounting and adjusting a cutterhead (knife, cutter etc.) 1
TOTAL 3
Have your workers/operators obtained training about “how to setup a
shaper” in your facility?
Number of
responses
Yes 1
No 2
TOTAL 3
Who trained your workers/operators?
Number of
responses
Company personnel 1
TOTAL 1

APPENDIX
110
Between 2005 and 2015, considering any band saw in your facility (where
setup time reduction efforts have been undertaken), how do you rate the
setup time improvement?
Number of
responses
None 1
0 - 4.9 % 0
5 - 9.9 % 0
10 - 14.9% 0
More than 15% 1
TOTAL 2
How would you rank the productivity (increasing throughput) depending
the setup time improvement on this band saw?
Number of
responses
None 0
Little 0
Some 0
A lot 1
TOTAL 1
In which of the following areas has the setup time reduced the most?
Number of
responses
Other (please specify): N/A and
Fixturing for cutting different components 2
TOTAL 2
Please indicate that what is the most difficult (time consuming) part of your
band saw setup?
Number of
responses
Mounting a blade in a machine 1
TOTAL 1

APPENDIX
111
In your shop, on which machine have you achieved the largest setup time
reduction? (Any machine in your facility)
Number of
responses
CNC type machines 5
Moulders 5
Point to Point Router 1
Cut-off saw 1
Gang Rip Saw 1
Rear load panel saw 1
Shaper (Unique 250 Door Machine) 1
TOTAL 15
Which set-up time reduction effort was the most rewarding one for your
company?
Number of
responses
Moving internal activities into external ones 4
Adjusting cutting depth and width 3
Searching for tools and equipment while doing set-up 4
Cleaning activities 3
Other 3
New equipment technology 7
Mounting a blade in a machine 1
TOTAL 25
In your facility, do you have a machine that creates a production bottleneck?
(e.g. any resource whose capacity is equal to or less than the demand placed
upon on it)
Number of
responses
Yes 7
No 9
TOTAL 16

APPENDIX
112
On which machine does your bottleneck occur?
Number of
responses
Drum sander 1
Ripsaw 1
Door and panel clamp machines 1
Moulder 1
Auto Drilling 1
Costa Sander 1
CNC 1
TOTAL 7
What is the main reason for this bottleneck?
Number of
responses
Set up time required 1
Machine failures 1
Other (please specify): 1
Production needs 1
Set up time required 1
Speed of the machine 1
Speed of the machine 1
TOTAL 7
What have you done to solve the bottleneck on this machine? (If you did not
take any action leave blank)
Number of
responses
Manufacturer engineered better parts 1
Fans, and leave gaps between products for air flow 1
Overtime 1
SMED set-up reduction 1
Purchased another machine 1
Highly scheduling issues, obtained second CNC 1
TOTAL 6