lean manufacturing and company integration
TRANSCRIPT
Daniel Carlsson and Peter Fröberg FACULTY OF ENGINEERING AT LUND UNIVERSITY
Lean Manufacturing and
Company Integration
In Swedish and Danish Machining Industry

I
To contact the authors of this master thesis, e-mail: [email protected] © Copyright 2016 by Daniel Carlsson, Peter Fröberg and Division of Production and Materials Engineering Lunds Tekniska Högskola, Lunds Universitet Box 118 221 00 Lund Faculty of Engineering at Lund University Box 118 SE-221 00 Lund Sweden Printed in Sweden, 2016

II
Preface With this master thesis, we conclude our Master of Science in Industrial Engineering and Management at The Faculty of Engineering at Lund University. The report constitutes 30 ECTS out of 300 ECTS in total for the entire degree. Our different Masters in Production and Supply Chain Management respectively, are two skillsets that have complemented each other in a synergistic way. This has given the report a great width, along with insights that would otherwise have been impossible.
The master thesis has been carried out for Sandvik Coromant in collaboration with The Institute of Production and Materials Engineering at the Faculty of Engineering at Lund University. During the course of the master thesis, we have acquired experience of, and insights in, Lean implementation that we are convinced neither could have been read in a book nor learnt in a classroom.
Our work with this master thesis has not only entailed report writing at the campus. It has also involved other people that have given us their much valued time with answers, inputs, feedback and support, without which this master thesis would have been impossible to write. Therefore we would like to extend our sincere thanks and appreciation to:
• Nils Hedar and the other supporting personnel at Sandvik Coromant. For giving us this opportunity and the support that we have needed during the course of the master thesis. We would also like to thank you for the genuine interest that you have shown, both for us and for our work.
• Professor Jan-Eric Ståhl at The Institute of Production and Materials Engineering at the Faculty of Engineering at Lund University. For giving us his trust, by letting us shape the master thesis and giving us valuable inputs and feedback.
• Involved personnel at all the companies that we have visited. For taking time from your crammed schedules, to show us your company and answer our questions. We humbly thank you for this respect between academics, where we never were turned down as mere students. Due to confidentiality agreements, the names of these people and companies, will not be disclosed.
Lund, 2016-04-01

III
Abstract Title Lean Manufacturing and Company Integration in Swedish and
Danish Machining Industry.
Authors Daniel Carlsson and Peter Fröberg, Industrial Engineering and Management, Faculty of Engineering at Lund University.
Supervisors Nils Hedar, Manager Sandvik Coromant Academy EMEA, Sandvik Coromant AB, Sandviken Jan-Eric Ståhl, Division of Production and Materials Engineering, Faculty of Engineering at Lund University.
Purpose To provide: • A sharp and distinct understanding and embodiment of
how Swedish and Danish companies in the Machining industry work with improvements in general and Lean in particular.
• An extended definition of Company Integration and how it plays a critical role in a company’s performance with regard to its internal interaction.
Methodology Collecting data was done by conducting case studies of a total of 17 factories. The data was then compiled and categorized in order to provide a summarized comprehensible representation of all data.
Result The result, in addition to achieving the Purpose above, is two Management Tools that are direct descendants of their respective topics, aiming to solve problems related to them.
Keywords Lean, Lean Production, Lean Manufacturing, the Toyota Way, the two katas, Kata, Improvement kata, Coaching kata, Lean Philosophy, Lean Process, Lean People and Partners, People and Partners, Lean Problem Solving, LPA, Company Integration, CI, Vertical Integration, Cross-functional Integration, Horizontal Integration, CIM.

IV
Master Thesis Structure In order for the reader to be able to grasp this comprehensive master thesis, it is vital that he/she understands its structure, hence follows this outline.
Before the actual master thesis begins, there are introductory sections of practical nature. These are Preface, Summary, Abstract, Master Thesis Structure, Abbreviations and Glossary, Table of Content, List of Figures and Pictures and List of Tables, and are pretty straightforward.
Moving on, the actual master thesis consists out of Parts that in turn each consist out of Chapters. How the Parts and Chapters are divided and distributed, is illustrated in Figure 1 Master Thesis Structure.
PART I PART II
CHAPTERS
PART III
CHAPTER
PART IV
CHAPTERSCHAPTERS
1INTRODUCTION
2FRAME OF REFERENCE
3METHODOLOGY
4DATA
COMPILATION
5ANALYSIS
6RESULT
7DISCUSSION
8REFERENCES
9APPENDICES
Figure 1 Master Thesis Structure.
PART I:
This part provides the Premise for the master thesis. It defines:
• In Chapter 1: Introduction, what the master thesis is all about. • In Chapter 2: Frame of Reference, upon which theories the master thesis is
based. • In Chapter 3: Methodology, how the master thesis has been carried out.

V
PART II:
This part provides the actual Body for the master thesis. It gives:
• In Chapter 4: Data Compilation, the summarization of the outputs from Methodology.
• In Chapter 5: Analysis, a synthesized and sound scrutiny of the Data Compilation with scientifically drawn conclusions.
• In Chapter 6: Result, the continuation with potential uses of the outputs from Analysis.
As one can tell from the description above, the chapters are closely linked together, rendering a clear and logical sequence throughout Part II. This sequence of chapters, when considered as a whole, is in turn divided into two discrete and separate tracks as depicted in Figure 2 The two tracks in Part II as a whole.
The two tracks named Lean Situation (LS) and Company Integration (CI) are together what achieves the purpose (see 1.3) of the master thesis. Looking at each chapter separately in Part II, they are organized as depicted in Figure 3 Representation of the tracks in Part II’s chapters.
This way of organizing Part II, has been found to be preferable to other potential ways. In each chapter there are sections General to Chapter, sections Specific to LS and sections Specific to CI. The risk is that this way might confuse some to feel that Part II is choppy and discontinuous, hence this description and clarification. In order to emphasize and simplify comprehension of Part II, every section Specific to LS begins with the LS-badge and every section Specific to CI begins with the CI-badge in accordance with Figure 4 LS- and CI-badge.
PART II
LEAN
SIT
UAT
ION
COM
PAN
Y IN
TEGR
ATIO
N
PART II
CHAPTERS
4
5
6
CI
LS
CI
LS
CI
LS
SPECIFIC TO LS
SPECIFIC TO CI
GENERALTO CHAPTER
Figure 2 The two tracks in Part II as a whole.
Figure 3 Representation of the tracks in Part II’s chapters.

VI
This solution offers an opportunity, namely to only read one of the tracks and skip the other. This would entail only reading the sections General to Chapter and either the sections Specific to LS or the sections Specific to CI, as opposed to reading everything. Observe that this way of reading the master thesis would only answer to half the purpose.
Note that one can argue that Chapter 2: Frame of Reference (and in some manner also Chapter 3: Methodology), ought to be included in this sequence with its two tracks. This due to it containing theory about LS and CI separately and that it hence would be logical to include. However in reality, it is impossible to solely assign one piece of theory to one track, since the theory behind both LS and CI are used for treating both tracks.
PART III:
This part provides Finalization of- and Future Potential for the master thesis. It gives:
• In Chapter 7: Discussion, space for the authors to freely consider and debate topics in extension of the master thesis, as well as space to debate potential synergies between the tracks from Part II.
PART IV:
This part provides Closing Practicalities for the master thesis. It gives:
• In Chapter 8: References, a list of which information that has been referred to.
• In Chapter 9: Index, an alphabetical list of index words. • In Chapter 10: Appendices, a set of documents that constitute the raw
underlying base for the master thesis along with some additional material.
LS CIFigure 4 LS- and CI-badge.

VII
Abbreviations and Glossary Table 1 Abbreviations and Glossary.
Abbreviation or Expression Meaning ATO Assemble To Order Blue Collar workers (blue collars)
Person who perform manual labor
Bullwhip effect Phenomenon in which forecasts yield supply chain inefficiencies with increasing magnitude further down the supply chain
CEO Chief Executive Officer CFI Cross-functional Integration CI Company Integration CIM Company Integration Model DCPF Name of imaginary company DII Days In Inventory FF Firefighting FG Finished Goods FGW Finished Goods Inventory HI Horizontal Integration LPA Lean Performance Analysis LS Lean Situation MTO Make To Order MTS Make To Stock NOAC Next Operation As Customer OEE Overall Equipment Efficiency PDCA Plan-Do-Check-Act, improvement cycle SC Sandvik Coromant SOP Standard Operating Procedure SWOT-analysis Structured planning method used to evaluate the
strengths, weaknesses, opportunities and threats involved in a project or in a business venture
VI Vertical Integration WIP Work In Progress (pieces under production) WIP cap Restriction in the amount of WIPs allowed White Collar workers (white collars)
Person who perform professional, managerial or administrative work

VIII
Table of Contents Preface ...................................................................................................................... II
Abstract ................................................................................................................... III
Master Thesis Structure .......................................................................................... IV
Abbreviations and Glossary ................................................................................... VII
Table of Contents ................................................................................................. VIII
List of Figures and Pictures..................................................................................... XI
List of Tables ....................................................................................................... XIII
Introduction ....................................................................................................... 1
1.1 Background ............................................................................................... 1
Master thesis issuer ........................................................................... 1
1.2 Problem Description.................................................................................. 2
Adaption of task ................................................................................ 3
1.3 Purpose ...................................................................................................... 4
1.4 Research Methodology and Demarcations ................................................ 4
Research demarcations ...................................................................... 4
1.5 Target Groups ........................................................................................... 5
Frame of Reference ........................................................................................... 6
2.1 Lean ........................................................................................................... 6
The 4P model .................................................................................... 6
Waste ................................................................................................. 7
The 14 principles of Lean ................................................................. 9
The two katas of Lean ..................................................................... 12
Common Lean tools ........................................................................ 15
Disturbance chains .......................................................................... 23
2.2 Company Integration ............................................................................... 24
Vertical Integration ......................................................................... 25
Cross-functional Integration ............................................................ 26
2.3 Structural Capital .................................................................................... 27
Methodology ................................................................................................... 28
3.1 The Research Onion Model .................................................................... 28

IX
Research philosophy ....................................................................... 29
Research methodological choice ..................................................... 29
Research strategy ............................................................................ 30
Time horizon ................................................................................... 32
Research techniques and procedures ............................................... 33
Model for data compilation ............................................................. 36
3.2 Trustworthiness and Quality of the Research ......................................... 40
Achieving credibility ....................................................................... 41
Achieving dependability and confirmability ................................... 41
Achieving transferability ................................................................. 42
3.3 The Research Process .............................................................................. 43
Data Compilation ............................................................................................ 45
4.1 Compilation of LS ................................................................................... 45
Philosophy ....................................................................................... 49
Process ............................................................................................ 54
People and partners ......................................................................... 65
Problem solving .............................................................................. 70
4.2 Compilation of CI ................................................................................... 73
Analysis ........................................................................................................... 76
5.1 Analysis of LS ......................................................................................... 77
General trends and conclusions ....................................................... 77
Lean discrepancies .......................................................................... 83
Cultural differences ......................................................................... 91
5.2 Analysis of CI ......................................................................................... 92
Causes for failing CI ....................................................................... 92
Expanded definition of company integration .................................. 94
Case examples of company integration ......................................... 105
Result ............................................................................................................ 114
6.1 Achievement of Purpose ....................................................................... 114
6.2 Management Tools ................................................................................ 116
LS management tool: Lean Performance Analysis (LPA) ............ 116

X
CI management tool: Company Integration Model (CIM) ........... 119
Discussion ..................................................................................................... 125
7.1 Self-Criticism ........................................................................................ 125
Methodology criticism .................................................................. 125
Management tools not tested in practice ....................................... 127
7.2 Personal Reflections and Further Studies.............................................. 127
The import/copy of Lean ............................................................... 127
How is LS related to CI and vice versa ......................................... 129
Combination of CI and disturbance chains ................................... 130
References ..................................................................................................... 131
Appendices .................................................................................................... 135
9.1 Factory Visit Report and Questionnaire ................................................ 135
9.2 CIM Template ....................................................................................... 140
Index ..................................................................................................................... 141

XI
List of Figures and Pictures Figure 1 Master Thesis Structure. ........................................................................... IV Figure 2 The two tracks in Part II as a whole........................................................... V Figure 3 Representation of the tracks in Part II’s chapters. ..................................... V Figure 4 LS- and CI-badge. ..................................................................................... VI Figure 5 Sandvik Coromant logo (Wikipedia, 2014). ............................................... 1 Figure 6 Sandvik Coromant tools (Sandvik Coromant, 2015). ................................. 1 Figure 7 Division of problem description. ................................................................ 3 Figure 8 The 4P model (K. Liker, 2004). .................................................................. 6 Figure 9 The improvement kata (Rother, 2010). ..................................................... 14 Figure 10 Value stream map (Microsoft Office, 2016). .......................................... 15 Figure 11 The Japanese lake (Xsource, 2016). ....................................................... 16 Figure 12 One-piece-flow (Carlsson & Fröberg, 2015). ......................................... 16 Figure 13 Visual control: Floor markings (Carlsson & Fröberg, 2015). ................. 17 Figure 14 Kanban card (Scruminc, 2015). .............................................................. 17 Figure 15 Takt screens/boards (Carlsson & Fröberg, 2015). .................................. 18 Figure 16 Example of Poka-Yoke (Icym, 2015). .................................................... 18 Figure 17 Andon lights (Welotec, 2016). ................................................................ 19 Figure 18 Status board with BSC and KPIs (Carlsson & Fröberg, 2015). .............. 21 Figure 19 Status board time plan (Carlsson & Fröberg, 2015). .............................. 21 Figure 20 Relation between technical and organizational causes for disturbances. 23 Figure 21 Model for plotting disturbance chains. ................................................... 24 Figure 22 The organizational dimensions. .............................................................. 25 Figure 23 The Research Onion Model (Saunders & Tossey, 2012). ...................... 28 Figure 24 Case study types (Rowley, 2002). .......................................................... 31 Figure 25 Case study design. .................................................................................. 33 Figure 26 The Factory visit. .................................................................................... 34 Figure 27 Matrix for compilation of LS. ................................................................. 37 Figure 28 Level of Implementation. ........................................................................ 38 Figure 29 Division and granulation of data. ............................................................ 45 Figure 30 Division and granulation of Philosophy. ................................................ 47 Figure 31 Division and granulation of Process. ...................................................... 47 Figure 32 Division and granulation of People and Partners. ................................... 47 Figure 33 Division and granulation of Problem Solving. ....................................... 47 Figure 34 Presentation model.................................................................................. 48 Figure 35 Map representing a well though-out strategy, common for the Culture Strategy category (Carlsson & Fröberg, 2015). ...................................................... 51 Figure 36 Lean status board blocked by rack indicating low priority of Lean (Carlsson & Fröberg, 2015). ................................................................................... 52 Figure 37 Lean status board placed inaccessibly indicating low priority of Lean (Carlsson & Fröberg, 2015). ................................................................................... 53

XII
Figure 38 Example of a failing 5S implementation (Carlsson & Fröberg, 2015). .. 59 Figure 39 Example of successful 5S implementation (Carlsson & Fröberg, 2015).61 Figure 40 Non-standardized status board. ............................................................... 62 Figure 41 Standardized, simple and well-structured status boards. ........................ 63 Figure 42 Visualized process chart placed at the machine (Carlsson & Fröberg, 2015). ...................................................................................................................... 64 Figure 43 Process steps visualized with photos (Carlsson & Fröberg, 2015). ........ 64 Figure 44 Pictures showing how something is supposed to look like (Carlsson & Fröberg, 2015). ........................................................................................................ 65 Figure 45 Competence matrix. ................................................................................ 69 Figure 46 Information saturation. ........................................................................... 77 Figure 47 Companies in relation to the fictitious average performance. ................ 79 Figure 48 Examples of distribution of effort. .......................................................... 81 Figure 49 Relationship: worse-, better- and desired practice. ................................. 83 Figure 50 Production facility built without flow in mind (Carlsson & Fröberg, 2015). ................................................................................................................................. 87 Figure 51 Expanded Definition of Company Integration........................................ 94 Figure 52 The three organizational dimensions. ..................................................... 95 Figure 53 Functional oriented organizational structure. ......................................... 96 Figure 54 Divisional oriented organizational structure. ......................................... 96 Figure 55 Matrix oriented organizational structure. ................................................ 97 Figure 56 The vertical organizational dimension. ................................................... 98 Figure 57 Decision making in different echelons. .................................................. 99 Figure 58 Parallel between decision making in a war and a company. ................. 100 Figure 59 The horizontal organizational dimension. ............................................ 101 Figure 60 Horizontal interaction within the same department. ............................. 102 Figure 61 Horizontal interaction within the same division. .................................. 102 Figure 62 The cross-functional organizational dimension. ................................... 104 Figure 63 Scope of cross-functional integration. .................................................. 105 Figure 64 Organizational structure upon which all case examples are based. ...... 106 Figure 65 From unsuccessful to successful interaction. ........................................ 107 Figure 66 Key indicator model. ............................................................................ 118 Figure 67 Case i-iv. ............................................................................................... 118 Figure 68 Locate your problem. ............................................................................ 121 Figure 69 Investigate, track and plot your problem. ............................................. 122 Figure 70 CIM template to be used in Step 2 for the CI Management tool. ......... 140

XIII
List of Tables Table 1 Abbreviations and Glossary. ..................................................................... VII Table 2 5-Why example (K. Liker, 2004). .............................................................. 22 Table 3 Case study alignment with task (Rowley, 2002). ....................................... 31 Table 4 List of companies, censored. ...................................................................... 36

PART I

1
Introduction 1.1 Background There are several different ways to improve a company’s performance, one of which is called Lean. Lean is a company-wide performance improvement philosophy that uses different tools for problem solving, continuous improvements and standardization. While traditional effectiveness focuses on output versus input, "Lean effectiveness" rather focuses on the amount of value adding time, time the customer is actually paying for, in processes. The ultimate goal of Lean is to reduce the non-value adding time, which in Lean terminology is called waste. Although Lean has an ultimate goal, Lean should be viewed as a never ending journey, which can be divided into several implementation projects. The current state of a Lean journey at a company, will in this master thesis be referred to as Lean Situation (LS). The progress of this journey over a period of time, will in this master thesis be referred to as Lean transformation.
While Lean traditionally is focused on the producing departments of a company it is important to understand that if a Lean transformation is to be successful it will require cooperation within, as well as between, departments, functions and hierarchical levels. The process of creating and facilitating this cooperation is, in this master thesis, referred to as Company Integration (CI) and is divided into vertical-, horizontal- and cross-functional integration depending on the parties included.
Master thesis issuer This master thesis has been issued by the company Sandvik Coromant (SC). SC is a global company that produces and sells machining tools and inserts. SC is represented in over 130 countries and employs about 8000 people. The headquarters are located in Sandviken, Sweden, where the parent company, Sandvik, headquarters’ also are located (Sandvik Coromant, 2016). SC products include tools for different machining operation amongst others turning, milling, drilling, parting and grooving (Sandvik Coromant, 2016).
Figure 5 Sandvik Coromant logo (Wikipedia, 2014).
Figure 6 Sandvik Coromant tools (Sandvik Coromant, 2015).

2
1.2 Problem Description The task, along with its supporting assumptions, as issued by SC, reads as follows:
Although Lean is not a new phenomenon it is still highly present in industry today. SC sees a potential to include Lean in their service offer to a greater extent, but will need more information about the spread and trend of Lean in the industry as well as the customers’ needs and problems. This in order to get a clear picture of how a potential future Lean service, provided by SC could look like. With this in mind the below following problem description has been formulated.
Examine how SC’s customers in particular and metal working industry in general, use Lean in their efforts to increase productivity. This is important for SC to know in order to understand if SC’s assumptions are correct, and if so, to develop competence and selling strategies in this area. Typical areas of questioning towards machining companies will be:
• Why, how and where do they use Lean? And if they do not, why? • What Lean tools do they use? • How successful have they been? • What kind of challenges do they encounter? • What parts of the organization is involved? • How do they see machining in relation to Lean? • What kind of support do they need? • How do they look at machining tool suppliers, like SC, in relation to Lean?
Assumptions
Many of SC’s larger customers are performing Lean transformation and are using in-house Lean teams to do this. These customers often perform internal Lean training, in which SC personnel has been invited to partake. As these customers are experienced in Lean, SC believes that if they are to secure business as a future provider of Lean services, it will require that:
• SC can talk the “Lean-language” of the customer. • SC understands the customers’ challenges. • SC can be part of Lean projects. • SC ensures that the customer understands that machining is an important
area for Lean. • SC understands that many of their services and tools are in fact Lean tools
and that they need to be able to explain their benefits from a Lean perspective.
While the larger customers already are performing Lean transformation, many midsize and small companies are introducing or thinking of introducing Lean. When

3
communicating with these customers, it is important that SC, in addition to the bullets above, can:
• Support and help them to understand what Lean is and how it can help them. • Run projects with Value Stream Mapping (VSM) to support the customers
also outside machining. • Use other Lean tools when supporting them.
Adaption of task The problem description, provided by SC, has been deemed appropriate to separate into different reports. Some parts of the problem description, can be directly adapted into a Purpose for this master thesis, while other parts contain company-sensitive information and hence will be covered in a secret report. The resulting approach is to write this master thesis as well as the secret report separately. This approach is illustrated in Figure 7 Division of problem description.
Furthermore, it has become quite noticeable, during the study of Lean, how dependent success is on a company’s ability to cooperate and work across different dimensions of functions and organizational levels, i.e. how well integration is working. Take pull (an explanation of pull can be found in 2.1.5.4) as an example, if a company is going to be able to successfully be pull it will not only require production to be pull but also other parts of the value chain, such as purchasing, will also need to pursue a "pull mindset". Another typical example is how problem solving and continuous improvements work. If problem solving is to work properly it has to have a holistic view across several departments as well as a clear problem escalation process to ensure that problems are captured at the appropriate level in the organization. Insights such as these are what justifies the extension of the scope of this master thesis, to also cover CI. This is done due to the fact that it differs from Lean but still is of interest to the target groups of the master thesis (see 1.5).
TASK AND ASSUMPTIONS FROM SANDVIK COROMANT
DIVIDER:APPROPRIATE FOR
PUBLICATION
ACADEMIC APPLICABILITY-> PURPOSE AND GOAL FOR
MASTER THESIS
COMPANY SENSITIVE-> SECRET OBJECTIVES
YES NO
MASTER THESIS SECRET DOCUMENT FOR SANDVIK COROMANT
Figure 7 Division of problem description.

4
1.3 Purpose The Purpose of this master thesis, can be distinctly divided by the two tracks, LS and CI (as depicted in Figure 2 The two tracks in Part II as a whole). With the problem description (as depicted in Figure 7 Division of problem description) as a foundation, the Purpose, accompanied by its Frame of Question, of this master thesis is to, for the companies in Swedish and Danish machining industry, provide:
• For the LS track: A sharp and distinct understanding and embodiment of the companies’ current LS, answering the Frame of Question:
o How are the companies working with Lean implementation and –transformation? How are they failing and/or succeeding in this endeavor?
o What are the discrepancies between the companies’ implementation/interpretation of Lean and "Lean theory"? How companies, within feasibility, could better themselves in terms of Lean?
• For the CI track: How CI plays a critical role in a company’s performance with regard to its internal interaction, answering the Frame of Question:
o How are companies interacting internally across organizational dimensions? What are the reasons for failing in this endeavor?
o How are companies to interact internally, across organizational dimensions, in order to facilitate favorable cooperation and communication (CI)?
Note that Lean and CI will be thoroughly described in chapter 2.
1.4 Research Methodology and Demarcations To be able to answer the Frame of Question, an appropriate and scientific research methodology will be needed. The chosen research methodology has been to perform case studies constituted by factory walkthroughs and interviews at SC’s customers. To get a better understanding of the methodology in its entirety, see chapter 3.
Research demarcations To be able to perform the research within reasonable boundaries, some demarcations were made. Firstly, the main focus of the Frame of Question is targeted at producing companies that use machining processes in their production. Also, since the research is performed using case studies and the studies are carried out during a couple of months, there must to be some geographical demarcations as well. Since the authors are residents of Lund (in southern Sweden), the geographical demarcations will be southern Sweden and Denmark.

5
1.5 Target Groups Essentially, this master thesis has three target groups; SC, Academics and Companies, that it provides value for.
• SC, for knowledge about, and insight in, how Lean is practiced in the machining industry.
• Academics, that wish to get a deeper understanding of Lean theory, the LS of the machining industry as well as how CI can improve a company’s performance and Lean transformation.
• Companies, that are performing or planning to perform a Lean transformation and/or are having issues related to CI.
Note that in order to be able to fully comprehend this master thesis, some previous knowledge is recommended, but not required. The previous knowledge recommended is a basic understanding of Lean and manufacturing. During the course of the master thesis, the reader will encounter expressions of a non-trivial nature. These are all explained at some point, but to always have a fallback, the reader can refer to Abbreviations and Glossary and/or 9 Index.

6
Frame of Reference This chapter covers the theoretical essentials that the reader will need to understand before reading succeeding chapters of the master thesis. The chapter starts with covering relevant aspects of Lean and then continues to cover relevant aspects of CI.
2.1 Lean The Toyota Production System, or Lean as it will be referred to in thesis master thesis, is the car manufacturer Toyota’s unique approach to manufacturing. Their approach to manufacturing is considered to be one of the best worldwide (K. Liker, 2004). The following section covers the references used for Lean and will focus on the philosophical areas rather than the different tools and methods, commonly associated with Lean. However, the last section will briefly cover the tools and methods that is mentioned in the master thesis. Note that all Lean-, concepts, expressions and technical terms (indicated by cursive text) introduced between 2.1.1-2.1.4, will be described in detail in 2.1.5.
The 4P model According to the book, The Toyota Way (K. Liker, 2004), it is a common phenomenon that companies view Lean as a toolbox. From this toolbox a company can pick and implement the tools and methods that seem most appropriate for a certain problem. However, Lean is rather a business philosophy that focuses on understanding and motivating people to build a "Lean culture". Liker uses the 4P model to characterize his 14 principles of Lean as well as a means for describing his view on Lean (K. Liker, 2004). Figure 8 (K. Liker, 2004), depicts the 4P model, below it, a description of each level, starting with Philosophy moving upwards in the pyramid, will follow.
Figure 8 The 4P model (K. Liker, 2004).

7
Philosophy
The fundamental level, of the 4P model, is Philosophy. This level could be contradictory to today’s business mentality, where it is more important to do well on quarterly reports, than to ensure long-term sustainable profit. Basically what this level focuses on, is that management decisions should be based on a long-term philosophy in mind, even at the expense of short-term financial goals (K. Liker, 2004).
Process
The next level, which is Process, is probably the one that most companies think represent Lean. This level focuses on, what would be considered as, typical Lean tools and methods such as pull systems, 5S, etc. The mistake companies make is that they think they are "Lean", only because they are using a pull system, have 5S deployed, etc. The problem is that they have not understood the entirety of the Lean concept. They believe that this level is what represents Lean, hence not including the other levels (K. Liker, 2004).
People and Partners
The People and Partners level has a deeper focus on individuals, and how to motivate and develop them, both internally and externally (suppliers). Key words that can be found on this level is respect, to challenge and to grow People and Partners (K. Liker, 2004).
Problem Solving
The top level of the model focuses on the way problems are solved and involves methods for solving problems in a scientific way. Key words for this level is continuous improvement and learning (K. Liker, 2004).
Waste At the core of Lean, the concept waste can be found. To define waste the first question to ask is "What does the customer want from this process?” (K. Liker, 2004). This is what defines the value of the product or service that the company offers the customer. By taking a close look at the company’s process of creating a product or service, the activities can be separated into value added, non-value added but necessary and non-value added (K. Liker, 2004). A simple example of this could be to consider an assembly-line of a chair, where examples of value added activities would be fastening the chair’s legs to the seat and applying paint to the chair. All other activities in the assembly process would be considered as non-value added or non-value added but necessary activities. According to The Toyota Way, waste can be categorized into 8 different types (K. Liker, 2004). Descriptions of these follows below.

8
1. Overproduction
Producing products or services for which there are no orders, leading to unnecessary storage-, staffing- and transportation costs (K. Liker, 2004).
2. Waiting (time on hand)
Having people stand idle and wait for different reasons. E.g. waiting for the next processing step, refilling of stock, equipment downtime, etc. (K. Liker, 2004).
3. Unnecessary transport or conveyance
This waste concerns all type of transportation that is unnecessary. Examples of this could be transporting WIPs long distances or moving material into- or out of storage between processes (K. Liker, 2004).
4. Overprocessing or incorrect processing
Processes can be inefficient due to taking unnecessary steps in order to produce a piece or by having a poor product design. Also providing a higher quality than necessary will create waste (K. Liker, 2004).
5. Excess inventory
Normal effects of having excess inventory include longer lead-times, more transportation- and storage costs. Another problem with inventories is that they tend to hide problems such as production imbalances, equipment downtime and long setup-times (K. Liker, 2004).
6. Unnecessary movement
This waste includes all types of movement needed for the employees to perform their work. Examples of this could be looking for- or reaching for parts or tools (K. Liker, 2004).
7. Defects
Producing defect parts is the purest form of waste, which leads to wasted time on repairing-, reworking- and producing replacement products (K. Liker, 2004).
8. Unused employee creativity
Employees can and should be used as more than workforce. They should be encouraged to use their creativity to find improvement ideas, solving problems, etc. Not doing so is waste (K. Liker, 2004).

9
The 14 principles of Lean Principle 1: Base your management decisions on a long-term philosophy, even at the expense of short-term financial goals:
To be truly successful with Lean it is important to understand that a short-term mindset will not be compatible with what it aims to achieve. It will require a philosophical mindset and that a culture is embedded in the entire organization, where every decision made, is aimed towards the ultimate goal of long-term improvement. Also, every function should focus on achieving value for the customer, society and the economy and do so with a high level of responsibility. This in order to enable a company to generate added value for themselves (K. Liker, 2004).
Principle 2: Create continuous process flow to bring problems to the surface
When talking about Lean, one-piece-flow or continuous flow often comes to mind. This principle puts an emphasis on the fact that companies should strive to create processes were no WIP is waiting for someone to finish it. There should also be a quick flow of information that links people and processes together, in order to surface problems right away (K. Liker, 2004).
Principle 3: Use pull systems to avoid overproduction
The pull concept is another popular term within Lean. Pull essentially means that the downstream customers, i.e. the next step in the production process, gets what they want, in the right amount and at the right time. A company should also focus on minimizing the amount of WIPs and inventories. This in order to get a customer-driven production, where restocking frequency is dependent on the frequency to which the customer orders goods or services. Another way to achieve this is to have a dynamic order stock, where customer-demand drives the order queue, in order to avoid unnecessary inventory build-up (K. Liker, 2004).
Principle 4: Level out the workload (Heijunka)
While Lean tends to focus a lot on waste, it is only one part of the equation. It is also important to reduce the level of unevenness in production in order to reduce the workload on employees and the strain on equipment. By having a stable workload, a company can also avoid the, often damaging and time consuming, need to turn on and off production. This is particularly preeminent in batch production (K. Liker, 2004).
Principle 5: Build a culture of stopping to fix problems, to get the quality right the first time
It is of paramount importance to remember that quality is one of the main factors influencing the customers’ satisfaction. Hence, achieving impeccable quality, must be included in a Lean transformation. By building ways of detecting problems into

10
production, such as having visual systems, alerting team- or project leaders that a machine or process needs assistance, will create built-in quality (e.g. Poka-Yoke). Also, having a culture and philosophy of slowing down or stopping production (Jidoka) in order to get the quality right the first time, as well as having appropriate organizational support systems to quickly solve identified problems, will enhance your productivity in the long run (K. Liker, 2004).
Principle 6: Standardized tasks are the foundation for continuous improvement and employee empowerment
Use the knowledge and creativity of the employees to improve processes and then incorporate these improvements into new standards, continuously. This in order to facilitate standardization of best practice (K. Liker, 2004).
Principle 7: Use visual control so no problems are hidden
This principle concerns different support systems that aim to help accomplish Lean implementation. Visual control could be simple indicators that immediately show employees if a process is operating in accordance with set standards or not (K. Liker, 2004).
Principle 8: Use only reliable, thoroughly tested technology that serves the people and processes
Technology should only be used to support people, not to replace them. Furthermore, only tested technology should be used. Focus on creating a manual standardized process and then rigorously test new technology to see if it might be an appropriate support to the process. When the technology has been tested and has proven to be able to improve a process flow, it should be implemented quickly (K. Liker, 2004).
Principle 9: Grow leaders who thoroughly understand the work, live the philosophy, and teach it to others
The Toyota Way argues that leaders should be grown internally rather than recruited externally. It also emphasizes that a leader in a Lean company should do more than just manage people. Leading is about living the Lean philosophy and to be a role model for the company, from which employees can be motivated and learn (K. Liker, 2004).
Principle 10: Develop exceptional people and teams who follow the company’s philosophy
In order to achieve the necessary company culture, the right employees and teams will be needed. The best way to achieve this is to teach and train the employees and teams in how to work within the company’s philosophy. Teams should also strive to be diverse and cross-functional (K. Liker, 2004).

11
Principle 11: Respect the extended network of partners and suppliers by challenging them and helping them to improve
The eleventh principle concerns the supplier relationship. In today’s supply chains, that are becoming more and more complex, it is important to understand that there is no “wall” between the company and its suppliers, meaning that the suppliers are just an extension of the company. By setting difficult targets and hence challenging the suppliers, a company can show that it values its suppliers and wants them to grow (K. Liker, 2004). Furthermore, the lack of downstream and upstream integration in a supply chain (i.e. not involving distributors and suppliers), carries risks like inaccurate forecasts, low capacity utilization, excess inventory, low frequency of inventory turns, high inventory costs, long time to market, low quality and poor customer satisfaction (Maleki & Cruz-Machado, 2013).
Principle 12: Go and see, to thoroughly understand the situation (Genchi Genbutsu)
Many decisions are made based on data presented on a computer screen or on information that has been heard from others. To be able to make good decisions, the source of the problem must be visited. This in order to get a firsthand view on the problem before making a decision. Genchi Genbutsu should include everyone, especially high level managers and executives (K. Liker, 2004).
Principle 13: Make decisions slowly by consensus, thoroughly considering all options; implement decisions rapidly
The Toyota Way argues that the worst way to make a decisions is to adopt a single path and continue down that path without considering other alternatives. It is much more effective to search for every possible path, which includes discussing with all the people involved with a certain decision. This in order to get information and ideas that might broaden the spectrum of alternatives. When all the alternatives have been considered, the most promising alternative should be chosen and then be implemented rapidly, but cautiously (K. Liker, 2004).
Principle 14: Become a learning organization through relentless reflection (Hansei) and continuous improvement (Kaizen)
With stable processes it becomes easier to use continuous improvement tools to find root causes of inefficiencies and implement countermeasures to remove these. By designing processes that require minimal amounts of inventory, different wastes will start to surface. When wastes are surfaced, employees can use a continuous improvement process, also called kaizen, to remove these wastes. Hansei is the process of identifying problems in projects and implementing countermeasures in order to prevent them from occurring in the future. By standardizing best practices,

12
it is also possible to prevent reinventing solutions that already have been invented (K. Liker, 2004).
The two katas of Lean So far the philosophical and fundamental core of Lean has been covered. To complement this, the following section will cover the managerial practices deployed at Toyota by summarizing the book Toyota KATA. The combination of the two katas, the Improvement- and the Coaching-kata, is what explains how management is carried out at Toyota (Rother, 2010). The following sections will start of by explaining why companies fail with Lean implementation, followed by the definition of the two katas, in accordance with Toyota KATA.
2.1.4.1 The Problem In the book Toyota KATA the most common problems companies encounters when implementing Lean is described. The main reason behind these problems, is that companies have been trying to replicate how Toyota is implementing Lean by simply listing different elements and principles, and then trying to copy them. There are essentially three reasons why this is a bad idea.
1. Critical aspects of Toyota are not visible.
Toyota’s tools and methods are built upon invisible routines that are essential in the way Toyota has been implementing Lean. By solely copying the tools and methods, those invisible routines are easily missed (Rother, 2010).
2. Reverse engineering does not make an organization adaptive and continuously improving.
Another reason is that companies tend to look at other companies, like Toyota, to see what incredible solutions they have for different problems. This in order to benchmark themselves and in the long run probably implement the same solutions at their own company. The problem with this approach is that it does not facilitate efficient continuous improvement and that it tends to lead to a static way of working with Lean (Rother, 2010).
3. Trying to reverse engineer puts us in an implementing mode.
"Implementation" is a commonly used word and seems, in many cases, to have a positive tone to it. The problem with using implementation is that companies are trying to force themselves to know and understand how they should proceed and how to act to get from a certain state to another. However, with true problem solving the Lean journey cannot be known, it is rather a journey where continuous improvement and problem solving takes a company from one state to a new desired state, without knowing the exact details on how they should do it (Rother, 2010).

13
2.1.4.2 The word kata By studying Toyota, it becomes clear that their work with Lean is less about principles and tools but rather is constituted by a set of thinking- and behavioral patterns that are to be continuously deployed. This is essentially what kata means. To further understand kata, one can study how the expression can be translated in the following ways:
• A method or routine. • A pattern. • A predefined- or choreographed sequence of movements. • A training method or drill.
For a company, the katas entail having each employee us methods (katas) for working under unpredictable and dynamic conditions. By utilizing the katas, the employees of a company can always stay in harmony with those conditions (Rother, 2010).
2.1.4.3 Improvement kata The first of the two katas is the improvement kata. The improvement kata describes how a person is to achieve continuous improvement by utilizing the same work procedure for improving processes (improvement kata). The improvement kata, can be split into a three step process, which is described below (Rother, 2010).
1. Understand current condition: Firstly, the person must identify the condition state of the process that is to be improved. The current condition must be defined in detail so that all problems are highlighted.
2. Define next target condition: Based on the current condition, a new target condition is to be defined. The target condition, should be defined so that it will be a challenge to reach it. By starting the journey towards the target state, obstacles and problems will arise that will need to be dealt with in order to reach the condition.
3. PDCA towards target condition: To deal with the obstacles and problems that arose in the second step, the plan-do-check-act-cycle (PDCA-cycle) will be used repeatedly on each problem or obstacle. Descriptions of each part of the PDCA-cycle, as described in Toyota KATA, follows below:
o Plan: Define what you expect to do and to happen. This is the hypothesis or prediction.
o Do: Test the hypothesis, that is, try to run the process according to plan. This is often done on a small scale initially. Observe closely.
o Check: Compare the actual outcome with the expected outcome. o Act: Standardize and stabilize what works, or begin the PDCA-cycle
again (Rother, 2010).

14
When applying the improvement kata, with its PDCA-cycle, on a problem, it is important for the individual or team to always go and see for themselves (Genshi Genbutsu). This in order to acquire more than superficial knowledge of the problem. By performing the PDCA-cycle repeatedly, the improvement kata should look something like Figure 9 The improvement kata (Rother, 2010).
Figure 9 The improvement kata (Rother, 2010).
2.1.4.4 Coaching kata Living by the improvement kata is challenging since it involves changing a personal behavior. Due to this, there is a second kata, namely the coaching kata. Its purpose is to teach/coach every employee how to work with the improvement kata. Hence, the coaching kata is built upon a mentor-mentee relationship where everyone in the company should have a mentor, i.e. a more experienced employee that coaches a mentee. This mentor is to coach and coordinate the mentee throughout the process of creating improvements, in accordance with the improvement kata (Rother, 2010).
When implementing the coaching kata on the improvement kata the three step process introduced in 1.1.1.1 Improvement kata, will include the below following responsibilities for the mentor.
1. Understand current condition: Here the mentor’s role is to coach the mentee into, by himself/herself, understanding and identify the current condition of the process. Note that the mentor must not tell the mentee the

15
current condition, since the entire goal of the coaching is to learn the mentee to find it themselves.
2. Define next target condition: Here the mentor’s role is to coach the mentee on how to set the target condition, to understand how the mentee is thinking and to coach the mentee into getting the right mindset on how to set target conditions.
3. PDCA towards target condition: Here the mentor’s role is to coach the mentee in the usage of the PDCA-cycle and needs to be physically involved in every step of the cycles. In this step it can be beneficial to use the A3-report format as a solid foundation to base discussion and coaching on (Rother, 2010).
Common Lean tools By now, it ought to be clear that Lean is much more than a set of tools to use in order to improve processes. However, since this report will concern Lean tools in to some extent, the most common ones will be briefly described in the sections below.
Note that this is a wide selection of tools and that they are of different level and magnitude, i.e. some tools may be used as means to use another tool.
2.1.5.1 Value stream mapping (VSM) VSM is a visualization tool used for analysis on where resources- or on what focus should be put, in order to reduce waste (Patrocinio, 2015). A value stream map is a map over all processes involved in the creation of a product or service. Depending on the VSM’s scope, it could include processes all the way from an external supplier to a final customer. The idea of the map is to get a deeper understanding of how a product or service flows through the different processes and what activities these processes are constituted by. Having created this map, the value adding, non-value adding but necessary and non-value adding activities can be identified. Based on this map, it is possible to know where the non-value adding activities are and to prioritize which of these that are to be eliminated (Patrocinio, 2015). The value stream map is often created as a process that includes following and timing a product or piece throughout its value chain. Having done this it is now possible to draw a map representing the current value stream. The next step is to, based on the map of the current value stream, define and draw a future state value stream map, defining goals for eliminating the non-value added activates (K. Liker, 2004).
Figure 10 Value stream map (Microsoft Office, 2016).

16
2.1.5.2 One-piece-flow The concept of producing in batches has for long been criticized by Toyota. Companies that produce in batches, have a proneness for, every time a problem arises due to production unevenness, simply increase their buffer sizes, in order to create facilitate high machine utilization. The effect of this is that the problem that initially caused the unevenness is hidden by the increased buffer levels. This phenomenon is often illustrated with the Japanese Lake (see Figure 11 The Japanese lake (Xsource, 2016)), where the surface symbolizes the buffer level and the shallows symbolize production problems. To surface these problems (the shallows) the company has to minimize their buffers (the surface level) by reducing the batch sizes. Achieving one-piece-flow is the ultimate goal of reducing the batches. It entails having pieces/products flow separately, as one, throughout their production process. In reality, one-piece-flow is not feasible for some types of manufacturing, e.g. heat treatment. However, aiming at it, by reducing batch sizes, will surface problems (in accordance with the Japanese Lake) that then can be dealt with, all in accordance with eliminating waste and becoming more Lean (Gornicki, 2014).
Figure 11 The Japanese lake (Xsource, 2016).
Figure 12 One-piece-flow (Carlsson & Fröberg, 2015).

17
2.1.5.3 Visual control Visual control is the act of simplifying a process by visualizing it. Examples of visual control is the use of floor markings, which aid production flow, and the use of tool shadows, to show where which tool belongs. Visual control can also be done by having visual operator instructions (i.e. pictures) instead of written instructions (Cox & Ullmer, 2015).
2.1.5.4 Kanban and pull Kanban is a tool used for creating pull and eliminating push in production. By using cards (kanban cards) to send signals indicating what, in what amount and when material is needed, it is possible to reduce the buffer sizes and amount of WIPs to a minimum. This because downstream demand is created once the process is in need of material, as opposed to a push based production, where material is "pushed" to the process. A problem with push based production is that it will result in unnecessary inventories (V, et al., 2007).
2.1.5.5 Kaizen The term kaizen stems from the term Gemba Kaizen which means continuous improvement in Japanese (Singh & Singh, 2009). Kaizen is a management philosophy, rather than a tool, of how a company should work with continuous improvement in small steps. This in order to facilitate long-term sustainable improvement (Singh & Singh, 2009).
2.1.5.6 Takt Takt is the German word for rhythm (K. Liker, 2004). The purpose of takt is to facilitate one-piece-flow by having the processes split up into different takts or stations (each takt should aim to take the same time to do as the other takts). Each operator is either assigned to follow a piece throughout the takts or to stay at one takt and work. The products are then to move from takt to takt without buffer inventories creating a one-piece-flow. The strength in this is that it creates visibility, i.e. if a
Figure 13 Visual control: Floor markings (Carlsson & Fröberg, 2015).
Figure 14 Kanban card (Scruminc, 2015).

18
problem is experienced the entire line will come to a stop. Buffer inventories would instead hide the fact that there exists a problem (Rother, 2010).
Figure 15 Takt screens/boards (Carlsson & Fröberg, 2015).
2.1.5.7 Poka-Yoke Poka-Yoke, or "error proofed design" as it is often paraphrased as, is one way of "building in quality" into a product or service. Poka-Yoke is in essence a way of ensuring detection and/or preventing errors in a process, by making so that the employee cannot perform an error. For instance it could be a screw that only fits in the hole in which it is supposed to be (J. Hopp & L. Spearman, 2011).
2.1.5.8 Andon Andon is the Japanese word for paper lantern (Wikipedia, 2015) and is a Lean tool for visualizing production problems. It is commonly deployed by having so called andon lights (see Figure 17 Andon lights .) in a production facility, with the purpose of getting the attention of team leaders, informing them that a problem has been detected. This in order to quickly be able to solve the problem at its source.
Figure 16 Example of Poka-Yoke (Icym, 2015).

19
Andon works by having machine operators activate the andon light, thus sending a signal light that is either green, yellow or red, like a traffic light. Each station at a production line has an andon light and when one of these are lit, the following occurs:
1. Production at the station, where an andon light was triggered, stops whilst the rest of the production line continuous working.
2. The signal light at the station switches from green to yellow, signaling that a problem has been discovered. This alerts a team leader that his/her attention is needed.
3. If the problem is not solved within a predefined time frame, the entire production line stops. The light switches from yellow to red, to signal where the source of the stop is located (K. Liker, 2004).
Figure 17 Andon lights (Welotec, 2016).
2.1.5.9 5S 5S is a Japanese abbreviation that stands for seiri, seiton, seiso, seiketsu and shitsuke, which translates to:
1. Sort (seiri) – Sort your equipment and only keep the equipment you need. 2. Straighten (seiton) – Have a place for everything and put everything in its
place. 3. Shine (seiso) – Keep the work place clean and keep it that way to avoid
abnormal conditions that could be harmful in the long run.

20
4. Standardize (seiketsu) – Have a systematic approach to 5S, in order to maintain and monitor the first three Ss.
5. Sustain (shitsuke) – Maintaining 5S is a process of continuous improvement (K. Liker, 2004).
2.1.5.10 Just In Time (JIT) JIT is the concept of producing only what is needed. Coined by the Lean legend Taiichi Ohno, the ultimate goal for JIT is to have workstations acquiring the right material, in the right amount at the right time (often aided by kanban cards). This whilst aiming for having zero inventories (buffers) (J. Hopp & L. Spearman, 2011).
2.1.5.11 Jidoka Jidoka is a Japanese term that, roughly translates to "production problem warning system that alerts everyone". The concept of Jidoka is to stop the entire production line if a problem is detected. The reason for stopping the entire line is to avoid the risk for adding value to defective pieces (C. Pegels, 1984) (Berk & Özgür Toy, 2009).
2.1.5.12 A3-report An A3-report is basically a way of conveying all the information needed to make a complex decision on an A3-sized piece of paper. This is achieved by streamlining comprehensive written information and organizing it in an easily understood fashion. A3-reports speeds up a company’s written internal communication by eliminating long complex reports that take vast amount of time deciphering (K. Liker, 2004).
2.1.5.13 Status boards Status boards is not an established concept, but is in this master thesis to be considered as the common term for KPI board, pulse board, BSC board, meeting board, etc. These expressions are common in the industry and are all a visual tool for keeping track of the status for and performance of a current situation or period of time. All status boards have their own design, tailored to fit the company, or specific function, that uses it. Commonly they are constituted by:
• A balanced scorecard (BSC) that define which of the company’s dimensions that are of interest when measuring performance and progress. Common BSC dimensions are: personnel, quality, delivery and cost.
• Sets of key performance indicators (KPIs), each belonging to a certain BSC dimension. These KPIs quantifies and makes each BSC dimension measurable by dividing it into smaller more precise areas. Common KPIs are: delivery on time percentage, production costs for product X, defect percentage for product X, etc.
• A production plan, which in some way conveys what is to be done, when it is to be done and by whom it is to be done.

21
Figure 18 Status board with BSC and KPIs (Carlsson & Fröberg, 2015).
Figure 19 Status board time plan (Carlsson & Fröberg, 2015).

22
2.1.5.14 SMED SMED, Single Minute Exchange of Die, is a Lean tool aiming at reducing setup times in processes in general and machines in particular. When discussing SMED, it is important to differentiate between internal- and external setup times.
• Internal setup times, are the times out of the total setup time, where the machine unconditionally must stand still.
• External setup times, are the rest of the total setup times, where the machine does not have to stand still.
Applying SMED is a methodology containing the following eight steps:
1. Separate internal from external operations. 2. Convert internal to external setup. 3. Standardize function, not shape. 4. Use functional clamps or eliminate fasteners altogether. 5. Use intermediate jigs. 6. Adopt parallel operations. 7. Eliminate adjustments. 8. Mechanization.
(Ståhl, 2012)
2.1.5.15 5-Why 5-Why is a tool for finding the root-cause of a problem. The idea of the tool is that one should always ask the question "Why?" 5 times in order to narrow down the problem to hopefully find its root cause. It also provides an opportunity to undertake countermeasures for each “Why-level” of the problem (K. Liker, 2004). The following table is an example of how 5-Why can be used.
Table 2 5-Why example (K. Liker, 2004).
Level of Problem Corresponding Level of Countermeasure
Origin Oil spill on the production floor. Mop up the oil. Why? Because the machine is leaking oil. Repair the machine. Why? Because the gasket has deteriorated. Replace the gasket. Why? Because we bought gaskets if inferior
material. Change the gasket specifications.
Why? Because we got a good deal (price) on those gaskets.
Change purchasing policies.
Why? Because the purchasing departments get evaluated on short-term cost savings.
Change the valuation policy for purchasing agents.
2.1.5.16 Gemba walks Gemba is a Japanese word that translates to the "real place", which can be described as the place where work happens. The concept of Gemba walk is the act of

23
performing a walkthrough at the place where value is added, i.e. the production floor. This emphasizes the importance of production whilst also creating space for discussion and problem solving through Genchi Genbutsu (Crumpton, 2010).
Disturbance chains To explain how Lean philosophy matters in practice, one can study disturbance chains in production. Firstly, disturbances have to be divided into technical- and organizational causes for disturbance, where:
• Technical causes for disturbance: Considers disturbances related to restrictions and problems with e.g. machines, peripheral products, tools, etc.
• Organizational causes for disturbance: Considers disturbances related to problems with e.g. production management, employee motivation, competence, work routines, etc.
Research has shown that a majority of production disturbances originate from organizational causes. To exemplify, consider a company that is having problems with poor product quality. By asking why 4 times, the following disturbance chain is identified:
• Poor product quality - Why? - The machine is wrongly configured. • The machine is wrongly configured– Why? - The operators' education is not
sufficient. • The operators’ education is not sufficient – Why? - Our employee turnover
is high. • Our employee turnover is high – Why? - Because the work in production is
monotone and the working environment is noisy. As indicated above, moving further down the disturbance chain, problems have a higher proneness to be related to organizational causes rather than technical. This tendency is illustrated in Figure 20 Relation between technical and organizational causes for disturbances.
# Steps from the visible cause for disturbance
Caus
e fo
r dis
turb
ance
Technical
Organization/personnel
100%
Figure 20 Relation between technical and organizational causes for disturbances.
This is not by coincidence, in fact, 85% of companies’ quality problems can be related to problems from organizational causes. Furthermore, research has shown

24
that moving down a disturbance chain (thus moving farther away from the visible problem) will result in a majority of problems being related to organizational causes (Ericsson, 1997).
2.1.6.1 Model for mapping disturbance chains in production In order to map disturbance chains and find the root causes for them, the model depicted in Figure 21 Model for plotting disturbance chains can be used.
A. Disturbance
1.Technical Systems• Tool systems• Handling
equipment• Other machine
systems• Input material• Process data
2. Operator contribution• Competence• Motivation• Flexibility
3. Employee related conditions• Workforce• Working Environment
4. Personnel stability• Employee turnover• Employee absence
5. Other• Customer behaviour• MPS systems• Quality Systems
6. Employee related worldwide environment conditions• Unemployment• Sickness benefits• Sickness epidemics• Amount of double-working
parents
Cause
Effect
External
Internal
Figure 21 Model for plotting disturbance chains.
The model differentiates between internal and external causes for disturbances and illustrates how the different causes are related to each other (as indicated by the arrows in Figure 21 Model for plotting disturbance chains). The model can be used to highlight a disturbance chain by illustrating with numbers (what cause type) and arrows (the cause's relation to another cause). To exemplify, the quality problem exemplified above can be illustrated as the path 1>3>4>2>A (Ericsson, 1997).
2.2 Company Integration CI is an expression that has been formed for this master thesis in order to represent the entity constituted by the theory of Vertical Integration (VI) and Cross-Functional

25
Integration (CFI), together. CI regards how, and to what extent collaboration, coordination, problem solving and communication is carried out within and between the different organizational dimensions of a company. The organizational dimensions are illustrated in Figure 20 The organizational dimensions.
CROSS-FUNCTIONAL
VERT
ICAL
Figure 22 The organizational dimensions.
The vertical dimension refers to the company’s hierarchical levels, whilst the cross-functional dimension refers to the company’s different functions or divisions, depending on organizational layout (departmental, divisional or matrix). These functions or divisions on the same vertical level, are organizationally equal, but might not be equal, in terms of influence, in practice (Ståhl, 2015).
When discussing integration it is important to differentiate it from interaction. Whilst interaction describes a state of cooperation and/or communication (likened by a point on a piece of paper), integration concerns moving towards a better state of cooperation and/or collaboration (likened by an arrow on a piece of paper pointing in the right direction).
Below follows detailed accounts of VI and CFI.
Vertical Integration VI inside a company is not to be confused with vertical integration referring to a company’s integration and/or acquirement of up- and/or downstream functions in their supply chain (Investopedia, 2016). VI inside a company is a relatively new science, initiated by Prof. Jan-Eric Ståhl from The Institute of Production and Materials Engineering at the Faculty of Engineering at Lund University.
The fundamentals of VI inside a company, concerns how to create understanding of- and insight in how decision making from management affects operations in lower

26
situated organizational levels. The decisions in question are primarily decisions that somehow aim to improve and/or save money.
Bad, or low level of, VI is when management decisions are made without insight in- and understanding of lower level operations, resulting in negative effects at this level. These negative effects could for instance be operational impairments, unnecessarily high costs, etc.
Good, or high level of, VI is when management decisions are made with insight in- and understanding of lower level operations, resulting in positive effects at this level. These positive effects could for instance be operational improvements, synergies, lower costs, etc.
The ultimate goal for VI is to integrate and link the opposing forces and wills inside a company, so that they no longer are opposing. In a producing company this refers to the link between technology and finance (Ståhl, 2015).
Cross-functional Integration CFI refers to how a company is able to bridge the solid functional silos that normally exist within a company, i.e. departments/divisions that work independently of other departments/divisions. CFI focuses on information and communication as well as highlights the fact that if a company wants to avoid the risk of having sub-optimized functions, they also need to have shared goals and rewards. The level of integration can have great influence on the performance of the company as a whole (R. Emery, 2009).
The difference between high level of CFI and low level of CFI, is the answers to the following five key questions:
1. Is the company able to set shared goals? o High level of CFI: The company uses clear and shared goals/visions. o Low level of CFI: The company uses strict department specific goals
leading to sub-optimized interaction. 2. What is the level of process understanding?
o High level of CFI: The company is able to, to a greater extent, identify and measure different company processes.
o Low level of CFI: The company fails to successfully identify and measure different company processes.
3. How good is communication? o High level of CFI: The company’s functions, communicate
frequently, facilitating proactive cross-functional problem solving. o Low level of CFI: The company’s functions have poor and tardy
communication, leading to mistrust and reactive problem solving. 4. Are there appropriate reward systems?

27
o High level of CFI: The company bases reward and performance systems on its processes and give frequent feedback to employees.
o Low level of CFI: The company uses traditional reward and performance systems with sporadic feedback.
5. How is the company working with conflict resolution? o High level of CFI: The company has clear and visible collaboration
with rapid problem identification. o Low level of CFI: The company experiences problems with conflicts
that are based on power struggles. Furthermore, functions may hide problems to avoid conflicts with other functions.
(R. Emery, 2009)
2.3 Structural Capital Concerning how Lean and CI is reacted in reality by companies, the expression Structural Capital is central. This expression will be frequently referred to and used throughout the master thesis, why it is of paramount importance that the reader fully understands it.
Structural Capital is one of the three subsets of a company’s Intellectual Capital. It is the collection name of a company’s competitive intelligence, formulas, information systems, policies, processes, etc. that are implemented by the company continuously. Basically it is the transformation, and development, of scientific rational thinking concerning the company’s operations, into something that can be implemented and used be everyone at the company. Structural Capital, as opposed to a company’s other forms of Intellectual Capital (Customer Capital and Human Capital), is not bound to an individual but rather integrated in the company meaning that it will not vanish along with e.g. an employee that is getting laid off (Business Dictonary, 2016) (Aramburu, et al., 2014).

28
Methodology In order to simplify reading and comprehension of the overall Methodology deployed for this master thesis, this chapter has been designed to follow a certain structure containing:
1. Theory about different methodologies, that describe how, what and in what order actions can be performed, in order to scientifically achieve a certain type of goal.
2. Based on the type of goal, decisions on what methodology that has been chosen to be deployed and why.
3. If there are no suitable methodologies to solve a certain issue, one is developed and described.
Note that the master thesis as a whole contains the deployment and use of several methodologies that together constitute the overall Methodology. This where each methodology aims to optimally achieve outputs for a certain subset of the master thesis. Lastly, observe that the overall Methodology is based on how SC has issued the task, i.e. their suggestion to how the authors are to solve it. The suggestion is to visit SC’s customers by performing factory visits, with walkthroughs and interviews. This is what sets the premise for the overall Methodology.
3.1 The Research Onion Model In order to get scientific and academic strength in the research, The Research Onion Model was used. The model explains how different layers in the research contribute to the research’s final analysis and results. It contains five layers where the researchers are to start with the outer layer and then continue inwards all the way to the fifth layer (Saunders & Tossey, 2012). The following sections will cover each layer of the model as depicted in Figure 21 The Research Onion Model.
Research Philisophy
Research Methodological Choice
Research Strategy
Time Horizon
Techniques andProcedures
Figure 23 The Research Onion Model (Saunders & Tossey, 2012).

29
Research philosophy The first layer of the onion is the Research Philosophy layer. It describes how the researcher’s way of viewing the world has an impact on how the research is conducted. More importantly it also concerns how information is processed and what information that is more or less crucial on the journey to reach results. In relation to this, there are four different philosophies: Positivism, Realism, Interpretivism and Pragmatism (Saunders & Tossey, 2012).
• Positivism: The researcher focuses on outcomes such as cause and effect generalizations.
• Realism: The researcher is aware of how his/her own subjectivity might affect the end result of the research. The realist can be a critical realist, meaning that he/she is challenging the result because of subjectivity, or a direct realist, that welcomes subjectivity.
• Interpretivism: The researcher is concerned with gathering insights to subjective meanings rather than finding generalized outcomes.
• Pragmatism: The researcher realizes that an outcome may have several meanings depending on the viewpoint and that these do not have to contradict each other (Saunders & Tossey, 2012).
The philosophy in the research performed throughout this master thesis will be a mix of interpretivism and pragmatism. This because the matter studied is of a subjective and complex nature, making it hard to find generalized outcomes, hence the interpretivism. It will also be important to have a holistic approach to get an extensive cover of the studied subject, hence the pragmatism.
Research methodological choice The next layer in the research onion concerns the choosing of methodologies for data collection and analysis. According to the model, qualitative and quantitative research can be split into mono- or multi methods depending on the amount of techniques used. A research can also be a mix of quantitative and qualitative research (Saunders & Tossey, 2012). The result is the following six possible approaches:
• Monomethod quantitative: E.g. a statistical analysis of a questionnaire. • Monomethod qualitative: E.g. an analysis of in-depth interviews. • Multimethod quantitative: E.g. a questionnaire and a structured
observation. • Multimethod qualitative: E.g. an interview and an inspection.

30
• Mixed method simple: E.g. using a quantitative analysis as base for a deeper qualitative study.
• Mixed method complex: E.g. performing a quantitative analysis based on qualitative data (Saunders & Tossey, 2012).
As previously stated, the subjective nature of the problem makes qualitative methods clearly superior to quantitative methods. At the same time there is also a need of quantitative methods to be able to reach valuable conclusions. Due to this, the approach used will be a mixed method complex design, meaning that a qualitative research will be performed, upon which a quantitative analysis will be made.
Research strategy The next layer of the research onion concerns defining and choosing one or several strategies for the research.
In order to correctly select a strategy(ies), one first needs to clearly define the task at hand, hypotheticals and which possibilities for research that are feasible (Saunders & Tossey, 2012). Hence the choice of Research Strategy, must be based on parameters stated in 1 Introduction. The sections of most relevance and implication to the choice of Research Strategy are:
• Background, why Lean and CI is of interest for SC in the future. • Problem Description, what assumptions that SC has concerning Lean and
CI, and how the authors have adapted the task in accordance with Adaption of task.
3.1.3.1 Selecting a strategy As the task at hand includes visiting companies and performing in depth analysis of their operations with regard to Lean and CI, using case studies seems to be a reasonable approach. Reviewing case study theory, further strengthens the claim that performing case studies is a sound strategy for the task at hand. Below follows a table with statements from the article Using case studies in research (Rowley, 2002) and how these statements are in alignment with the task.

31
Table 3 Case study alignment with task (Rowley, 2002).
Statement (Quote) from Using case studies in research
Alignment with task
"Case studies have often been viewed as a useful tool for the preliminary, exploratory stage of a research project,…"
In order to perform initial diagnosis of the LS and CI at SC’s customers, case studies, with factory visits (as indicated in 1.4 Research Methodology and Demarcations) aiming to grasp the situation, seem to be much needed.
"…case studies are useful in providing answers to ‘How?’ and ‘Why?’ questions, and in this role can be used for exploratory, descriptive or explanatory research."
As defined by the first and the most paramount question in the Frame of Question, see 1.3 Purpose, the goal is to find out: How and where SC’s customers use Lean and CI? The question "How?" is central to the task.
"Case studies are one approach that supports deeper and more detailed investigation of the type that is normally necessary to answer how and why questions."
Visits, walkthroughs and interviews are highly unlikely to be completely "linear", i.e. give exactly the expected answers. Due to the unpredictability of these, performing case studies will assess and enable detection of deep and detailed information that would likely be lost in for example a web survey.
"Typically case study research uses a variety of evidence from different sources, such as documents, artefacts, interviews and observation, and this goes beyond the range of sources of evidence that might be available in historical study."
As suggested by SC, factory visits with interviews and walkthroughs, marks a versatile plan for data collection. This versatility is best suited for a research strategy as flexible as a case study.
In order to further granulate case study theory and specify the optimal case study for the required research strategy at hand, one needs to recognize the different types and dimensions of case studies (Rowley, 2002) as depicted in Figure 22 Case study types.
Type 3
Type 2 Type 4
HOLISTIC
EMBEDDED
Type 1
Figure 24 Case study types (Rowley, 2002).

32
A case study can either be single or multiple in its design.
• A Single Case Design is equivalent to a single experiment and is appropriate when trying out a special case that contradicts what is commonly believed.
• A Multiple Case Design on the other hand is equivalent to multiple experiments and is appropriate when trying to establish a new theory/perception of something (Rowley, 2002).
The second dimension into which case studies can be classified is either as holistic or embedded.
• A holistic approach to case studies is when a case is viewed as one unit from a helicopter perspective. This approach puts focus on a broad issues such as a culture or a strategy.
• This whilst an embedded approach rather divides the case into several sub-units that are analyzed separately at first and then together (Rowley, 2002).
The case study type most appropriate, and hence chosen for the task, is Type 4. Type 4 is applicable and appropriate to the task due to the following reasons:
• Multiple case design is needed since multiple factory visits are to be performed. Furthermore, the goal is to build a theory/perception rather than to follow an already defined theory/perception.
• The embedded case study approach is preferred to the holistic, since it more thoroughly explores the company and then enable a holistic compilation of information.
Time horizon The next layer of the onion concerns the time horizon of the research. As discussed earlier in1.4 Research Methodology and Demarcations, research will be performed over a couple of months, which is a relatively short window but still is enough to conduct the research. The research will mainly focus on trying to capture an understanding of LS and CI at different companies, as described in Master Thesis Structure. Even if the studied topics (i.e. LS and CI) are of changing character, a current situation snapshot will be enough to be able to reach satisfying conclusions since changes concerning these, occur at a slow pace.

33
Research techniques and procedures
Having gone through all other layers, it is now finally possible to tailor the Research techniques and procedures. The following section describes the techniques and procedures used. It is divided into the two sub-sections, Tailored Case Study and Model for Data Compilation.
• Tailored Case Study - Describes how the case study is structured and its different elements.
• Model for Data Compilation - Describes the approach to compiling the data collected from the case studies.
3.1.5.1 Tailored case study As described in 3.1.3, the case study strategy of choice, is multiple case studies with an embedded approach. In order to fit the purpose of this master thesis, a case study design was tailored. Below follows a description of the case study design and its four different subsets.
FACTORYWALK-
THROUGH
PRESENTATIONSAND
INTERVIEWSOBSERVATIONS
ACQUIRED ADDITIONAL
MATERIAL
CASE STUDY
Figure 25 Case study design.
As depicted in Figure 23 Case study design, the tailored case study contains the following four parts; Factory Walkthrough, Presentations and Interviews, Observations and Acquired Additional Material. The combination of these provides the case study with a versatile perspective. It gives the company’s ambition and vison for working with continuous improvement as well as the actual LS. It facilitates the opportunity to perceive the company with basically all senses. This will enable the acquirement of the true condition of the company instead of the glorified picture often presented. Each subset of the case study has a different purpose and approach as described below.
• Factory Walkthrough: A guided tour of the manufacturing site. The tour focuses on the actual manufacturing and the interaction between operations in the facility. During the tour, exhaustive questioning is performed.

34
• Presentations and Interviews: The presentations give the companies an opportunity to show how they plan to and strive to work with improvements. It also provides the future vision for improvement work. The interviews aim to complement with answers not already acquired and to, in a nice way, challenge and confront the companies. This in order to understand and get a perception of LS and CI.
• Observations: During the entire visit, and in particular during the factory walkthrough, notes on observations are taken. These notes are then transcribed and compiled into useful comprehensible information.
• Acquired Additional Material: In order to in retrospect analyze and assess the different methodologies deployed by the companies, additional material will always be requested. This could for example be a Power Point presentation, a project evaluation report or photos of status boards.
The acquirement of these subsets, that together constitute the case study, is not linear due to the unpredictable nature of the visits. While the case study can be considered as theory, the actual Factory Visit can be considered as reality. The following sections schematically describe what and in what order actions were performed when conducting a Factory Visit, from which the final output is a Factory Visit Report.
FACTORYWALK-THROUGH
PRESENTATIONSAND
INTERVIEWSOBSERVATIONS
ACQUIRED ADDITIONAL
MATERIALPart 1-3
FACTORY VISIT REPORT
Part 4
Figure 26 The Factory visit.
Part 1: Company Introduction
An introductory presentation of the company in general and their improvement program/initiative in particular. The purpose of this presentation is for the company to give their own picture of the company and the production site, information that goes beyond what is provided by the homepage, and to get a rudimental understanding and overview of the company’s structural capital in terms of LS and CI.

35
Part 2: Factory Walkthrough
A guided tour through the company’s production site. This tour is, if allowed and feasible, given in the value stream’s order, i.e. it essentially contains the following three consecutive parts: raw-material handling, manufacturing and finished goods handling.
During the guided tour, the goal is to be neutral and objective when questioning and making different observations. The goal of the questioning during the walkthrough is not to determine LS and CI, but rather to understand and deep dive into the visible and invisible Lean and CI that is being applied at the site. This setup is intentional in order to avoid distractions from what is most important during the guided tour, namely the observations. These observations are what provide the naked truth and true condition of the company’s LS and CI. In more detail, the observations are to focus on:
• The 14 principles of Lean (as described in 2.1.3). • The 8 types of waste (as described in 2.1.2). • The relation between blue- and white collar employees. • The specific Lean tools, solutions and methods in use. • The leadership and organizational structure. • Lean gaps, i.e. solutions that could have been implemented but are not. These
will be described in detail in 3.1.6.2 Model for Compilation of LS. • All dimensions of CI.
Part 3: Interview
After the guided tour, an interview takes place. This interview aims to further and deeper determine the company’s LS and CI, and their perception of them. The questionnaire covers all areas of the value stream, however the person being interviewed is often not able to answer all questions because he/she is only involved in an isolated part of the value stream. Hence the questions are designed in a qualitative. The questionnaire can be found in appendix 9.1 Factory Visit Report and Questionnaire.
Part 4: Factory visit report
All observations, impressions and answers are written down, transcribed and complemented with additional thoughts as soon as possible after the visit is done. The material is then compiled into a Factory visit report, containing:
• General information concerning the company such as name, size, location, industry etc.
• First impressions of the Lean initiative, the LS and the company’s culture. • Observations in a more detailed fashion. The observations can be pretty
much anything, ranging from the placement of a kanban card to how the

36
layout of the flow is designed. The observations are made mainly during the factory walkthrough.
• Notes are what is transcribed from general notes written down during the presentations and interviews.
• Questionnaire answers are written down in a template during the interview. • Tools/methods is the part where it is reflected upon the different tools and
methods in use by the specific company. These tools and methods are what one would call a selection from the typical Lean-toolbox, with tools/methods such as status boards, 5S, SMED, A3-report, etc. If these are implemented in a specific way, good, bad, innovative and/or interesting, they are reflected upon in terms of pros and cons.
• Recommendations, concerning what the company ought to do in the future and how, are written down. These recommendations are of course hypothetical and would require further investigation to secure, however when summarized they will illustrate where the most common "Lean gaps" occur.
For a template for the Factory visit report, please refer to appendix 9.1 Factory Visit Report and Questionnaire.
Model for data compilation The Factory Visits Reports cannot be disclosed as appendices in this master thesis due to confidentiality agreements. Furthermore the full content of all 17 Factory Visit Reports (circa 7 pages per report times 17 reports makes 119 pages) can obviously not be presented here due its vastness. It would make little sense to include all this information, why it has been summarized and compiled. Below follows:
• A censored List of companies, that provides an idea of what type of companies that were visited, studied and analyzed. Company names are not disclosed due to confidentiality agreements.
• Model for Compilation of LS. Everything from all case studies is summarized into answers that indicate similarities, differences, correlations, patterns, trends etc.
• Model for Compilation of CI. Ad hoc information and observations are compiled into relevant interactions.
3.1.6.1 List of companies Table 4 List of companies, censored.
Country #Employees Occupation/products Sweden 300 Turning-, milling and drilling tools Sweden 1400 Inserts for milling and turning Sweden 16 Car components and locks Sweden 1600 Submersible water pumps and sewage systems Sweden 140 Mining and construction drills and breakers Sweden 70 Car components
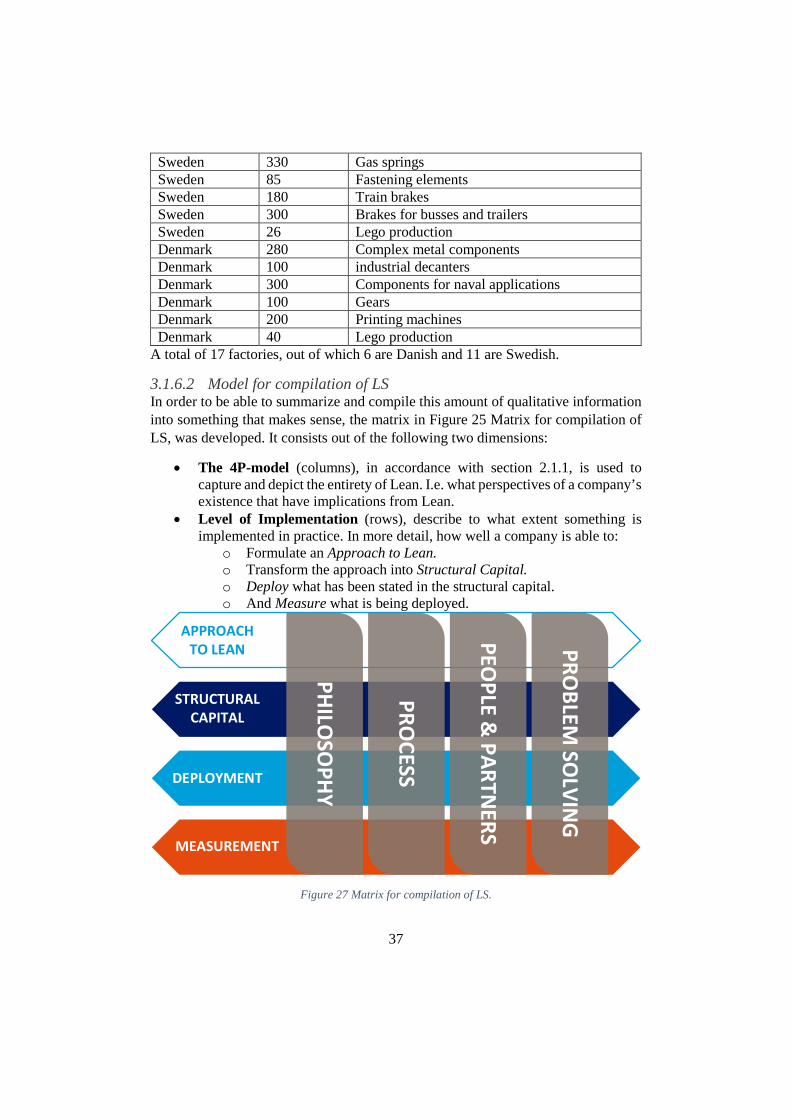
37
Sweden 330 Gas springs Sweden 85 Fastening elements Sweden 180 Train brakes Sweden 300 Brakes for busses and trailers Sweden 26 Lego production Denmark 280 Complex metal components Denmark 100 industrial decanters Denmark 300 Components for naval applications Denmark 100 Gears Denmark 200 Printing machines Denmark 40 Lego production
A total of 17 factories, out of which 6 are Danish and 11 are Swedish.
3.1.6.2 Model for compilation of LS In order to be able to summarize and compile this amount of qualitative information into something that makes sense, the matrix in Figure 25 Matrix for compilation of LS, was developed. It consists out of the following two dimensions:
• The 4P-model (columns), in accordance with section 2.1.1, is used to capture and depict the entirety of Lean. I.e. what perspectives of a company’s existence that have implications from Lean.
• Level of Implementation (rows), describe to what extent something is implemented in practice. In more detail, how well a company is able to:
o Formulate an Approach to Lean. o Transform the approach into Structural Capital. o Deploy what has been stated in the structural capital. o And Measure what is being deployed.
APPROACH TO LEAN
STRUCTURAL CAPITAL
DEPLOYMENT
MEASUREMENT
PHILO
SOPH
Y
PROCESS
PEOPLE &
PARTNERS
PROBLEM
SOLVIN
G
Figure 27 Matrix for compilation of LS.

38
Summarized, one can say that the 4Ps are the different fields in which a company can perform in terms of Lean, whilst the Level of Implementation describe to what extent these fields are executed in reality.
Whilst the 4P-model is an established concept, the Level of Implementation is not. It has been developed and adapted solely for this master thesis, hence follows a detailed description of what the Level of Implementation mean and entail.
APPROACH TO LEAN
STRUCTURAL CAPITAL
DEPLOYMENT
MEASUREMENT
LEANGAP
Figure 28 Level of Implementation.
Figure 26 Level of Implementation symbolize and illustrate how a company takes on the challenge of Lean.
First and foremost and as mentioned before, one must not consider Lean as a reachable destination but rather as a journey towards an unachievable perfect state. Something as intricate and complex as a company’s activity as a whole, can always be improved. Hence the distribution of the figure’s different fields, must be considered as alive and in a continuous state of change. Each field (except Approach to Lean) is to constitute a subset of the parent field(s) "behind". The figure’s fields and bracket have the following meaning:
• Approach to Lean: Describes the grand vision of Lean. This is where the companies ask themselves: What is the definition of Lean? How are we going

39
to use it to our advantage? What does Lean implementation entail? What do we want our Lean initiative to achieve? Answering these kind of big-picture questions is really hard due to Lean being rather unfathomable. However, no matter how hard this is, every company working with Lean has to have an Approach to Lean. As depicted in Figure 26 Level of Implementation, it can be symbolized by a fluffy, somewhat distorted, cloud. The Approach to Lean is hard to define with stringent boarders but an underlying vision and approach to reaching it, has to be defined.
• Structural capital: Having defined an Approach to Lean, the company encounters one of the greatest challenges in Lean implementation, namely how to pass this grand vision on to all parts and all employees of the company. In order to do this, the company needs to build its Structural Capital. Structural Capital for Lean is the Approach to Lean reacted as material that can be taken in by others. Lean Structural Capital can be on a high level such as a strategy and/or a tactic, but it can also be on a low level/scale such as presentations, figures, etc.
• Deployment: After having defined how Lean is to be worked with, the implementation phase commences. The Deployment field of the figure, symbolizes how much of the Lean Structural Capital that is deployed in reality.
• Measurement: In all serious businesses, the ability to measure performance and progress, is paramount to self-improvement. Without knowing how something is performing, it is hard, borderline impossible, to:
o Know for certain if things are improving or getting worse and by how much things are improving or getting worse.
o Define new goals for the future that drive progress. o Convince people that what is being done is either right or wrong.
Hence Measurement should be done on everything that is being deployed. • Lean gaps: As mentioned earlier, achieving Lean should be considered as a
journey, not a destination, hence there will always be gaps between what is envisioned in the Approach to Lean-cloud and reality. As indicated in the figure, there can be several different gaps.
o The gap between Approach to Lean and Structural capital, is constituted by what is not successfully communicated from the grand vision to the rest of the company. Since many aspects of Lean implementation is intangible, diffuse and in many ways personal interpretations, it is essentially impossible to pass on every aspect of one’s grand vision of Lean.
o The gap between Structural capital and Deployment, is constituted by which Lean structural capital that is not being reacted in reality. Defining a strategy with objectives, tactics and methods is one thing, but putting these words into reality is something completely different.
o The gap between Deployment and Measurement, is constituted by what is being deployed but not measured. Due to the intangible

40
nature of Lean, it can be hard to measure every aspect of it in traditional ways. Reducing this gap requires creative and innovative ways of measurement.
3.1.6.3 Model for compilation of CI Data collection and how to investigate the companies’ level of integration, both vertically and cross-functionally, is easier said than done. The reason for this is that the persons that got interviewed and hosted the company visits, simply did not have sufficient insight in the matter. That fact by itself could be considered as an indicator to the level of integration, however some ad hoc questioning (deep dive into the topic when it arose) and observations were directly aimed at CI.
The level of VI was investigated by questioning and observation. The questions concerned interaction with management and how problems got escalated, whilst observation was purely aimed at VI detection. The level of CFI was investigated by observation.
As mentioned above, the data collection concerning CI was difficult and ad hoc, dependent on whether or not the occasion for it arose. This fact resulted in data that was “asymmetric”, as opposed to the data collected concerning pure Lean. Hence the compilation of this data did not entail concentration and summarization, but rather to pick out and highlight all ad hoc answers received concerning the matter.
Definition of Relevant Department/Division Interactions
When structuring and organizing the data concerned with CI, the foundation was constituted by a definition of relevant department/division interactions. The interactions defined were all interactions with the companies’ production function. Furthermore, only the most relevant interactions were considered. The interactions, with their primary integration dimension, were:
• Production vs. Management: VI • Production vs. Purchasing: CFI • Production vs. Quality (as a separate department): CFI • Production vs. Human Resources: CFI • Production vs. IT: CFI • Production vs. Sales: CFI • Division X vs. Division Y: CFI
3.2 Trustworthiness and Quality of the Research In order to assure the quality and trustworthiness of the research, several different means and methods were deployed. But first and foremost the research must be recognized as qualitative as opposed to quantitative. This due to the quite different methods used to decide the trustworthiness of the two different categories.

41
Whilst quantitative research achieves trustworthiness through validity and reliability, qualitative research’s means of achieving it is not quite as linear. Qualitative research is unpredictable and nonlinear, hence it requires a more soulful and imaginative approach when assessing its quality. The quality of qualitative research is commonly assessed by Credibility, Dependability, Confirmability and Transferability (Darawsheh, 2014). Deploying these four criteria, on the rigorous amount of case studies, will ensure a high level of trustworthiness.
Achieving credibility Credibility refers to how believable and dependable the presented findings are. It should give the reader the comfort of, beyond any reasonable doubt, trusting the content. Achieving this is done by conducting the research in a believable fashion and by being able to demonstrate the credibility. To prove these, one can use the following methods: Prolonged engagement and persistent observation, Triangulation, Peer debriefing and Member checking (Darawsheh, 2014). Which of these methods and how they are deployed in this case is described below:
• Prolonged engagement and persistent observation, is essentially the base for the entire data collection. As described in 3.1.3 Research strategy, multiple factory visits will be conducted over a long time period.
• Triangulation of a case study refers to the use of many different methods to assure credibility. As depicted in Figure 23 Case study design, the four parts of each case study will ensure that the data is gathered in a versatile fashion, which will triangulate the findings and provide a credible holistic perception of each company.
• Peer debriefing is when an external expert is asked to review the work and assess its credibility. This method is however questioned by experts due to peoples’ proneness to being biased to their own views. To some extent the master thesis supervisor at Lund University, Professor Jan-Eric Ståhl, will provide peer debriefing.
• Member checking is when the participants from an investigation are allowed to read the transcripts from it. This will not be allowed in this case since the questioning material in not only interview questions, but also questions answered by objective observations. Having the participants review these will not only take a considerable amount of time and energy, it also endangers the objectiveness of the data. Furthermore, member checking would be infeasible due to master thesis’ demarcations (Darawsheh, 2014).
Achieving dependability and confirmability Both dependability and confirmability is what removes the authors’ subjectivity from the findings.

42
Dependability is for qualitative research what reliability is for quantitative research. It targets the stability of the collected data.
Closely associated with dependability is confirmability. Confirmability is the act of assuring that the recording of data is both neutral, unbiased and accurate. The processes used for building these two are Audit trail and Reflexivity (Darawsheh, 2014).
• Audit trail is the act of continuously, throughout the entire research process, keep track of the different methodological choices made. This in order for the readers to be able to assess how the research is performed and whether it is an unbiased approach.
• Reflexivity is essentially a way for the authors to show self-awareness. In qualitative research, the authors’ sense and feel for the findings is important and must not be filtered away. That would likely leave a rather pale report. However the personal reflections of the authors may not be unjust and depend on a temporary mood that changes. In order to assure self-awareness of the findings for this report, the authors will:
o Hold regular discussions, reflecting on whether their mood has had an unjust impact on the findings.
o Debate findings between themselves in order to find common ground with as little bias as possible.
o Reflect on the methodological choices made (Darawsheh, 2014).
Both Audit trail and Reflexivity will be deployed during the course of this master thesis.
Achieving transferability Transferability refers to whether or not the findings of the research can be translated into a theory that can be transferred and/or applied to another similar context or situation. Securing transferability can be achieved by using a method called Thick descriptions.
• Thick descriptions have to be done in order for a reader to be able to decide on whether the theory is transferable to another situation or not. These "thick" descriptions must contain detailed descriptions of the original context of the research and what methods that have been used to get there. In this case this is achieved by providing the reader with detailed descriptions of both method and actual findings.
(Darawsheh, 2014).

43
3.3 The Research Process This section will provide the reader with an overview of how the research has been conducted. Below follows an approximate timeline describing how the research process looked like.
1. The research started with an introductory phase. During this phase all the necessary bureaucracy was sorted out and appropriate supervisors at Lund University and SC were found. Time was also spent on grasping the task and to define what the stakeholders, i.e. SC, the authors and the Institute of Production and Materials Engineering, would expect to gain from the master thesis.
2. The second phase was spent on studying relevant theories and knowledge, in order to be able to perform the research properly. The subjects studied included Lean, CI, Research methodology and basic theory on machining.
3. With the necessary theory studied, an initial case study design was created. During this phase, visits at SC’s headquarters as well as at SC’s production sites in Gimo (a city 110 km north of Stockholm) were made. These visits provided the authors with valuable inputs to the research ahead and the final design of the case study was established.
4. Having fixated the case study design, the next phase was to find appropriate customers and book these for factory visits. In parallel with this, meetings were held with the supervisors at Lund University and SC. Furthermore, phone interviews were carried out with key persons at SC, who had valuable inputs as to how the master thesis should develop and how it might be incorporated with SC’s vision in the future.
5. Now the data collection phase began and ran during a long period of time. On average, a visit, with traveling included, took half a workday. Since this phase had a long time span, some introductory writing of the master thesis could be initiated.
6. With all the data collected, it became apparent that models for compiling the data was needed due to the data’s vastness.
7. The final, and most time consuming, phase of the master thesis, entailed the majority of the writing, ending with the presentation of the master thesis.

44
PART II

45
Data Compilation After having conducted the Methodology as described in chapter 3, the output is as mentioned a vast amount of data. 17 Factory Visit Reports, resulting in circa 120 pages of data, has in this chapter been condensed and summarized into two comprehensible tracks, LS and CI, as described in Master Thesis Structure. These tracks, which run throughout Part II, begin here in chapter 4 with becoming clearly defined into states/situations, that each describe a subset of the reality observed during the visits. All together, these subsets (states/situations), constitute the reality as a whole, concerning LS and CI separately.
Observe that this Data Compilation provides information that is representative of the states/situations that have been investigated/examined for this master thesis. Hence, the compilation, describing different states/situations, must be considered as highly probable but not necessarily true, since there are always exceptions to the rule (discrepancies).
4.1 Compilation of LS As described in 3.1.6.2 Model for compilation of LS, the matrix, as depicted in Figure 25 Matrix for compilation of LS, served as a model for data compilation. Having applied the matrix on the collected data, it was possible to divide and granulate it in a comprehensible fashion. This usage of the matrix, resulting in a division and granulation of data, was schematically conducted as illustrated in Figure 27 Division and granulation of data, and can be described as follows:
DATA
CATEGORYCATEGORY
AREA AREA AREA
PPPP
GRA
NU
LATI
ON
OF
DATA 1
2
3
Figure 29 Division and granulation of data.
LS

46
1. The data as a whole was granulated and divided into data sets representative and relevant for each P from the 4P-model (i.e. each column in the matrix in Figure 25 Matrix for compilation of LS).
2. For each P, from the 4P-model, the data assigned to it was assessed and divided into areas. These areas are the quantifiable subsets of each P from the 4P-model, in other words the areas are the specific "Lean topics" in which distinct measurable differences can be found from the data. To illustrate, consider trying to quantify and measure the Ps Philosophy or Process. It is not that easy due to the ambiguous nature of the concepts. Instead, consider trying to quantify and measure the areas Change Management or Lean Strategy. Still not easy with the concepts alone, but along with their descriptions (as will follow), they become quantifiable and measurable.
3. The third and final step in this process was to divide and granulate the areas ("Lean topics") into categories. These categories represent the different states a company can belong to, with regard to a specific area. A metaphor for this could be considering the human race as an area and considering man and woman as the categories belonging to the area, the human race. These categories were crystallized from the area definitions. It entailed sorting and dividing the case studies (with their factory visit reports) into different piles and then define the categories by characterizing each pile of case studies.

47
Figure 28 to Figure 31 represent the division and granulation of each P into areas and categories.
PHILOSOPHYLEAN STRATEGY ORGANIZATIONTOOLBOX STRATEGY
CULTURE STRATEGY SUPPORTIVE CENTRAL
Figure 30 Division and granulation of Philosophy.
PROCESSLEVEL OF PULL WASTE METHODS & TOOLS SIMPLIFICATION &
VISUALIZATIONABSTRACT &
COMPLICATED
SIMPLE & STRAIGHT-FORWARD
MTO & MTS
ONLY MTOPUSH TOOLBOX
SITEAUTONO-
MOUS SITE5S SITECOMMON
SENCEEXPANDED
SENCE Figure 31 Division and granulation of Process.
PEOPLE & PARTNERSLEAN CHANGE MANAGEMENT
BOTTOM-UP TOP-DOWN
EMPLOYEEEMPOWERMENT
HUMANS= MACHINES
HUMANS= PEOPLE
BLUE- & WHITE COLLAR COOPERATION
NO BRIDGING AMBITION
BRIDGING AMBITION
Figure 32 Division and granulation of People and Partners.
PROBLEM SOLVINGMETHODOLOGY
NO S&S APPROACHS&S APPROACH
TO FF
S&S APPROACH TO FF & CONTINUOUS
IMPROVEMENT Figure 33 Division and granulation of Problem Solving.

48
Each P, area and category will be explored following these models: I. Model for presenting a P:
a. Intro and definition of P. b. Definition of areas under P. c. Table for P.
II. Model for presenting an area: a. Intro and definition of area. b. Definition of categories under area.
III. Model for presenting a category: a. Intro and definition of category. b. Definition of category characteristics, divided by Level of
Implementation. i. Approach To Lean.
ii. Structural Capital. iii. Deployment. iv. Measurement.
The order of these definitions and characterizations will follow the model as illustrated in Figure 32 Presentation model, where the categories range from worse- to better states from left to right (observe that this rule does not apply for the metaphor concerning the human race since the authors consider the sexes to be equal).
ONE OF THE ’P’SAREA AREA
CATEGORY CATEGORY CATEGORY CATEGORY
”WORSE” ”BETTER” ”WORSE” ”BETTER”
Figure 34 Presentation model.
Below follows the definition of each P, from the 4P-model, and each area for each P, along with characterizations of each category belonging to each area belonging to each P.

49
Philosophy The first P from the 4P-model is Philosophy, which describes the long-term mentality of Lean that management should have if a Lean transformation is to be successful. When the data was divided and granulated in this P, two areas were identified, Lean Strategy and Organization.
• Lean Strategy - How Lean is perceived and integrated into the company’s strategy.
• Organization - How the company has chosen to organize the Lean function.
4.1.1.1 Lean strategy Lean strategy is how the different companies have chosen to formulate their strategy for Lean implementation. Generally, this is connected to what the expectations are for the implementation and the "Lean competence level" of the company. When comparing the companies, two distinctly different strategies were identified. The first one is titled Toolbox Strategy which, as it sounds, has the view of Lean as being a set of tools to be implemented in order to gain results. The second strategy is titled Culture Strategy, which focuses on changing behavior and culture to gain long term performance improvements.
4.1.1.1.1 Toolbox strategy The companies belonging to the Toolbox Strategy category are often quite young in their Lean implementation effort. Generally, these companies are on their first attempt to implementing Lean and are experiencing difficulties in gaining improvements that last.
• Approach To Lean o Focuses on tools and methods heard of from books, courses and
videos. o The general expectation is set on quick improvements and
performance gains. • Structural Capital
o Lacks a defined Lean strategy. o Is more or less non-existent. o Is intangible, making it hard to convert the approach to Lean into
real action. • Deployment
o Is unenthusiastic and sometimes completely depleted. o Usually includes a half-hearted 5S attempt and non-standardized
status boards. o Is not continuously reviewed. o Lean is limited to only include production. o Runs improvement projects.

50
o Uses no model or method for working with improvement projects. • Measurement
o Is scarce and without an established method for documentation. o Due to lack of method and documentation, it is hard to track actual
improvements.
4.1.1.1.2 Culture strategy While the Toolbox Strategy is a young and failing implementation of Lean, the Culture Strategy is often of a more fundamental character. Another distinction is that it often stems from an earlier failed Toolbox Strategy that now has been rebooted. This due to the insight that if the goal is to have lasting improvements, the company has to work with changing employee behavior and company culture.
• Approach To Lean o The grand vision is to change behavior and culture of the entire
company. o The company understands that Lean is long-term, hence it will
sacrifice short-term improvements for long-term lasting results. o Uses a methodological and scientific approach that facilitates
continuous creation of structural capital. • Structural Capital
o The approach to Lean is broken down into tangible pieces of how the company is to work with Lean.
• Deployment o Is driven enthusiastically with a sense of the Lean journey being
never ending. o Focuses on visualization by making deployment thorough, clear and
standardized. o Everyone (blue- and white collar) at the company is included in the
Lean implementation. • Measurement
o Uses a BSC that is broken down into several KPIs. o KPIs are documented in a structured way, making performance easy
to measure.

51
Figure 35 Map representing a well though-out strategy, common for the Culture Strategy category
(Carlsson & Fröberg, 2015).
4.1.1.2 Organization The second area under Philosophy, defines how Lean is viewed from an organizational perspective, from a top management point of view. Essentially, there are two different ways of organizing Lean in a company, rendering this area’s two categories. The first category is titled Lean as a Supportive Function, meaning that Lean an isolated function. The second category is Lean as a Central Function, meaning that Lean is included in all important company functions.
4.1.1.2.1 Lean as a supportive function The companies included in this category do not consider Lean to be of companywide concern. They rather believe that Lean should be restricted to production and that Lean should be organized as a supportive function for production.
• Approach To Lean o Lean is organized as an isolated function with the task to support
other functions. o The Lean function supports and drives the Lean implementation in
production.

52
o Lean is not considered when making important decisions. o There is no clear problem escalation process, i.e. escalation from
problem identification to assignment to an appropriate employee/manager, resulting in problems being solved with a low frequency or not at all.
• Structural Capital o N/A.
• Deployment o Lean is a secondary task of an employee or company function. o There is a lack of resources and time for Lean implementation. o Lean does not apply to everyone. o The employees consider Lean as a fad, making implementation
difficult because they do not believe in it. o Lean is not prioritized at all.
• Measurement o N/A.
Figure 36 Lean status board blocked by rack indicating low priority of Lean (Carlsson & Fröberg,
2015).

53
Figure 37 Lean status board placed inaccessibly indicating low priority of Lean (Carlsson &
Fröberg, 2015).
4.1.1.2.2 Lean as a central function This category has realized that Lean is of companywide concern and that it should be included in all functions. In order to perform Lean implementation, they use a central Lean function that has the task of managing it.
• Approach To Lean o Lean is organized as a central function with the task of managing
Lean implementation. o Lean is considered when making important company decisions. o The Lean hierarchy is clearly defined with e.g. team leaders,
production manager, site manager etc. o Low level of Lean cooperation between the company’s hierarchical
levels. • Structural Capital
o N/A. • Deployment
o Lean is a primary task of an employee or company function. o Lean is rarely applied outside of production, but cases of "white
collar Lean" exist.

54
• Measurement o N/A.
Process The second P from the 4P-model is Process. It focuses on Lean’s tools and methods and how companies perceive their purpose as well as how they choose to use them. When the data was divided and granulated for this P, four areas were identified, Level of Pull, Waste, Methods and Tools and Simplification and Visualization.
• Level of Pull - How, and if, the company chooses to embrace pull. • Waste - The company’s knowledge concerning waste and its approach to
eliminate it. • Methods and Tools – How the company uses the different methods and tools
of Lean. • Visualization - The company’s approach to visualize and simplify Lean.
4.1.2.1 Level of pull To become Lean, embracing pull is essential. During the company visits it became clear that the concept of pull is well known but not always understood and hence not taken under serious consideration. For this area, there are three different categories. The first category is the companies that are only using push, whilst not considering pull. The second category is a mixture of make to order (MTO) and make to stock (MTS) and the last category is only MTO.
4.1.2.1.1 Push The companies in this category are often producing standard products, i.e. products with a low level of customization. Production is done in high volumes based on insecure forecasts, creating waste in the form of overproduction as well as excess inventories.
• Approach To Lean o Only uses push due to a lack of Lean understanding. o Uses large finished goods warehouses (FGW) as a security against
production unevenness and forecast errors. • Structural Capital
o Uses simple forms of forecasting together with poor planning software, that impedes pull rather than facilitate it.
• Deployment o No deployment of pull results in stations producing at their own rate,
in disregard of the rate of the production flow as a whole, rendering unwanted unevenness and buffers.
o Inaccurate forecasting and extreme customer demand, e.g. short lead-times, forces the company to have a push mentality.

55
• Measurement o The company is not deploying pull and hence cannot measure it.
4.1.2.1.2 MTO and MTS The second category consists of companies that have understood the concept of pull, but has not been able to fully implement it. Typically these companies are producing both standard products as well as special, customizable products. Standards products are MTS, while customizable products are MTO.
• Approach To Lean o The company wishes to become more pull, but is impeded by
customer demands. o Tries to reduce inventory levels by having special products be MTO
and standard products be MTS. • Structural Capital
o Cases of Kanban cards exist, but are isolated to some parts of production.
o Uses more complex planning software than the push category, which, in some cases, facilitates pull.
• Deployment o Has less unevenness than the push category. o MTS is push, while MTO tries to be pull. o Lacks pull throughout the value chain in its entirety.
• Measurement o Performance is not measured.
4.1.2.1.3 Only MTO This category of companies, are the ones that are using only MTO. The biggest difference between this category and the others, is that it does not use FGWs to the same extent (or at all).
• Approach To Lean o The company has an ambition to become pull throughout the entire
production. o Considers the choice of only MTO as a step in becoming pull.
• Structural Capital o Uses Kanban cards, but only in some parts of production.
• Deployment o Uses no or small FGWs, where the finished goods are temporarily
stored, commonly for one day maximum. o Aims at finishing products at the day of shipment. o One-piece-flow in assembly is common, otherwise controlled
batching (with WIP caps) is used.

56
o Assembly to order (ATO) is the solution for customers demanding short lead-times.
• Measurement o Measurement is done by using space constriction, limiting the buffer
sizes, which creates a need (pull), if the space is empty.
4.1.2.2 Waste The next area, waste, is one of the most fundamental of Lean. It concerns to what extent the companies are aware of the 8 types of waste and how they work with eliminating them. During the company visits, it quickly became apparent that the understanding and knowledge of waste, is one of the biggest differences between the companies. For this area two categories were identified. Either companies that have a common sense of waste, or companies that have an expanded sense of waste.
4.1.2.2.1 Common sense of waste This category includes companies that have a basic knowledge of waste. The result of this is that they essentially only consider defects and unnecessary movement and transportation as waste. They are basically unaware of the other types of waste.
• Approach To Lean o Believes that waste only includes defects and unnecessary
movement and transportation and that the elimination of those do not require a scientific approach, only common sense.
• Structural Capital o Has no structural capital developed for reducing waste. Uses
common sense when eliminating waste, e.g. choosing the shortest way when transporting goods.
• Deployment o Due to the lack of structural capital the deployment is unstructured
and disorganized. o Elimination of defects:
Random sampling for detection. Non-standardized defect-reports that only facilitate keeping
track of the number of defects. o Elimination of unnecessary movement and transportation:
Does not try to improve flow or change behavior. Only entails choosing the shortest path.
• Measurement o Measurement is simple and primitive, e.g. the number of defects as
a percentage of the total number of produced units.

57
4.1.2.2.2 Expanded sense of waste This category represents companies that have an expanded sense of waste. Unlike the previous category, these companies have a deeper conceptual knowledge of waste and are thus more or less aware of all types of waste.
• Approach To Lean o Uses a scientific and standardized approach for waste elimination.
• Structural Capital o Uses thorough and standardized methods together with
documentation of waste elimination, e.g. A3-reports. • Deployment
o Elimination of overproduction and excess inventory: Utilizes inventory management (MTO rather than MTS).
o Elimination of waiting: Uses VSM to identify and reduce waiting.
o Elimination of unnecessary movement and transportation: Analyzes flows to find opportunities for improvement. E.g.
one-piece-flow with activity-based stations, which reduce the amount of required movement.
o Elimination of defects: Uses andon to signal that a problem has been identified or
that a defective part has been found. Has quality checks between stations rather than only on
finished products. Uses branding (e.g. laser imprint of batch number) to
facilitate traceability throughout production and the products’ life.
o Elimination of unused employee creativity: Actively engages blue collars in the problem solving
process. Uses next operation as customer (NOAC) in order to create
a sense of responsibility amongst blue collars. This creates a willingness to experiment and to find ways to improve production by the blue collars.
• Measurement o Uses KPIs as a means for measuring to what extent the company is
able to reduce waste. E.g. days in inventory (DII), for elimination of excess inventory.
4.1.2.3 Methods and tools While it is important to remember that Lean is not to be considered as a toolbox, the tools used within Lean are meant to support a Lean transformation. The next area, Methods and Tools, categorizes how companies choose to incorporate the different

58
Lean tools into their Lean initiative. This area has three categories, the first one is titled The 5S Site, it considers 5S to be the only Lean tool. The second category is titled The Toolbox Site, it represent the companies that have the misconception of Lean being a set of tools. The final category, The Autonomous Site, represents the companies that aim toward having the Lean tools used by the employees as a natural part of every day.
4.1.2.3.1 The 5S site As the name indicates, this category includes the companies that are familiar with the 5S-concept, but are more or less unfamiliar with Lean as a whole. Due to this lack of Lean knowledge, the implementation of 5S is commonly not being fully carried out, due to its lack of some important aspects. Due to this, the 5S implementation is failing.
• Approach To Lean o Has heard of 5S and implemented it with a toolbox mindset. o Only considers straighten and shine, missing the other three Ss. o Does not see the value of 5S due to a lack of understanding, which
makes it hard for the company to keep the 5S implementation alive. • Structural Capital
o Has basic structural capital related to 5S implementation, e.g. tool shadows and/or floor markings.
o Since the 5S implementation is failing, these tool shadows and/or floor markings are not being sustained.
• Deployment o 5S was initiated once as a project, but is now failing. o The lack of follow-ups and frequent revisions is what makes
deployment unsuccessful. • Measurement
o 5S performance is not being measured.

59
Figure 38 Example of a failing 5S implementation (Carlsson & Fröberg, 2015).
4.1.2.3.2 The toolbox site The companies in the second category, The Toolbox Site, are, unlike The 5S Site, familiar with Lean and its tools and methods. However, due to having misunderstood

60
Lean, the companies are trying to implement Lean as a set of tools, which causes issues.
• Approach To Lean o Considers Lean as a bunch of tools and methods that if implemented,
automatically makes a company Lean. o Makes no effort in facilitating usage of the tools and methods for
their employees. • Structural Capital
o Structural capital exists but is not transferred to where it should be, e.g. production does not have access to the problem solving tools that they are supposed to use.
o The structural capital is not customized so that it is easy to comprehend, making it virtually useless.
• Deployment o Deployment of tools is done by the company’s Lean function,
putting no emphasis on transferring the knowledge to the ones that will be using the tools.
o The implementation projects of the tools, are carried out isolated from blue collars and/or other employees, which results in them not being sustained.
• Measurement o Measurement is done by conducting revisions and status checks on
the methods and tools.
4.1.2.3.3 The autonomous site The last category, The Autonomous Site, consists of companies that put emphasis on making Lean tools and methods comprehensible for everyone. The reason for this is that the companies want to reach a state where the tools and methods are being continuously used by the employees, independent of instructions from e.g. a Lean department.
• Approach To Lean o The goal is to have every employee understand that they can benefit
from implementing Lean tools and methods. o The company understands that continuity and patience is key in
getting tools and methods to last and become sustainable. • Structural Capital
o Every tool and method has to be as comprehensible as possible, in order to simplify the use of them. E.g. use of a 5S board with traffic light-like signals that tell if a certain 5S-activity has been carried out or not.
• Deployment

61
o Tools and methods are used continuously and naturally by blue collars without them being asked to do so.
o Tools and methods are included and integrated in instructions, e.g. problem solving instructions.
• Measurement o Captures and measures how well the company is able to use the tools
and methods with KPIs as well as structured and standardized project reports.
Figure 39 Example of successful 5S implementation (Carlsson & Fröberg, 2015).
4.1.2.4 Simplification and visualization Tools and methods are a great support in Lean transformation. However, to get every employee to understand and devote themselves to Lean transformation, Simplification and Visualization will be needed. This area, Simplification and Visualization, categorizes how companies try to create simplicity and visibility of their Processes. The first category is titled Abstract and Complicated, the companies in this category consider Lean to be complex and that it should remain so. The second category, Simple and Straightforward, understands the need for simplicity and visualization and are therefore trying to convert Lean into something simple and comprehensible.

62
4.1.2.4.1 Abstract and complicated Companies in this category consider Lean as complex, hence employees, especially blue collars, should not be concerned with understanding Lean, just "do it".
• Approach To Lean o Has not understood the fundamentals of Lean and will hence not
consider changing behavior or creating an organization that learns by itself.
o Considers Lean to be complex in its nature and that there is no sense in making it simple.
o Employees, especially blue collars, should just do what they are told to do.
• Structural Capital o Does not see any sense in using structural capital in order to
simplify the use of Lean tools and methods, but rather believes that employees should "just do".
• Deployment o Uses status boards, however these are not standardized, making
them hard to grasp. o Does not have any rules on how to use the status boards, resulting
in the boards being virtually unnecessary. • Measurement
o Uses either too many or too abstract KPIs, making measurement complex.
Figure 40 Non-standardized status board.

63
4.1.2.4.2 Simple and straightforward This category includes companies that aim toward converting everything complex with Lean into something simple and comprehensible. These companies have the insight that if every blue collar is to work with Lean, they will also need to understand how and why. Offices with white collars are rarely engaged with creating simplicity and straightforwardness for themselves.
• Approach To Lean o Lean should be simple and straightforward so that every blue collar
understands it. o Everything concerning Lean is tailored to fit the company’s
atmosphere and culture, converting complexity into simplicity. • Structural Capital
o Uses structured capital in order to create simplicity and straightforwardness. E.g. andon screens, takt boards, maps with clearly defined areas and stations, floor markings etc.
o Uses simple, standardized and versatile status boards that are used for frequent meetings.
• Deployment o A majority of the structural capital is deployed and integrated into
the company’s processes. • Measurement
o Simplicity and Straightforwardness themselves are not measured, they are rather what facilitate all other measurement. E.g. andon screens that provide visibility and at the same time is a tool for measuring the amount of breakdowns and their duration.
Figure 41 Standardized, simple and well-structured status boards.

64
Figure 42 Visualized process chart placed at the machine (Carlsson & Fröberg, 2015).
Figure 43 Process steps visualized with photos (Carlsson & Fröberg, 2015).

65
Figure 44 Pictures showing how something is supposed to look like (Carlsson & Fröberg, 2015).
People and partners From the 4P-model, People and Partners concerns how companies are motivating and interacting with their employees (People) and their customers and suppliers (Partners). The data concerning this P, can be divided and granulated into three categories, titled Lean Change Management, Employee Empowerment and Blue- and White Collar Cooperation.
• Lean Change Management - How Lean implementation and transformation is being managed.
• Employee Empowerment - How the employees are being managed. • Blue- and White Collar Cooperation- How the company is working with
facilitating cooperation between blue- and white collars.
4.1.3.1 Lean change management This area, titled Lean Change Management, categorizes how companies have chosen to approach the change that is Lean implementation. There are two different categories, bottom-up and top-down. Companies in the bottom-up category believes that Lean implementations should be built from the bottom of the organization, whilst the companies in the top-down believes that Lean implementation should propagate down from the top of the organization

66
4.1.3.1.1 Bottom-up The first category is titled Bottom-up, companies belonging to this category believes that a Lean implementation should be approached and built from the bottom. When the bottom of the organization has established Lean, the idea is that Lean should then propagate upwards in the organization until the entire company is working with Lean. In reality it stays in the bottom of the organization, never reaching higher up.
• Approach To Lean o Lean should only concern blue collars in production. o Lean is an ad-hoc function with little to no influence on either
production or other parts of the organization. • Structural Capital
o Structural capital is aimed directly towards production, sometimes completely disregarding other parts of the company.
• Deployment o Only blue collars are working with Lean. o Top management is not concerned with Lean, making the blue
collars uncertain about why they should be working with Lean. • Measurement
o Measurement is performed against short-term goals. E.g. cost savings, delivery improvements, etc.
4.1.3.1.2 Top-down This category is essentially the inverse of the Bottom-up category. This means that Lean is supposed to be led by and implemented in, the top of the organization in order to then propagate down to the rest of the organization.
• Approach To Lean o Top management acts as "Lean role-models" and lead the way of the
Lean implementation and transformation. o Has the ambition that Lean should include every employee.
• Structural Capital o Uses status boards with BSCs, with few and relevant KPIs, to create
understanding and direction to the approach to Lean. • Deployment
o Everyone gets involved by the BSC and understands the implications of it.
o Lean organization is not integrated, however responsibility is shared throughout the entire organization so that Lean-responsible employees exist at different hierarchical levels.
o Blue collars are involved in the creation of new structural capital such as documentation, standards, etc.
• Measurement

67
o The BSC is regularly, and with a high frequency, updated to always represent the current situation.
o The company is ready to accept short-term losses in favor of long-term results.
4.1.3.2 Employee empowerment Moving on to the second area, titled Employee Empowerment, which concerns how employees are treated, motivated and inspired by their respective peers. This area has two categories titled Humans = Machines and Humans = People. The first category, Humans = Machines, uses a harsh and result driven approach to management. This whilst the second category, Humans = People, uses empowerment and motivation to create a problem solving mentality amongst their employees.
4.1.3.2.1 Humans = Machines The first category of companies are deeply concerned with achieving quick results. Due to this, they often create an environment where the employees feel that their sole purpose is to only do exactly what they are told, without any room for potential improvement creativity. This results in the company missing out on improvement possibilities that the employees could have provided (essentially the Unused employee creativity waste).
• Approach To Lean o The company is unaware of the fact that they are making the
employees work as machines. o The employees must follow the standards and rules, without any
deviation allowed, not even for improvements. This while keeping the quality as high as possible.
o The company is unaware of the two katas. • Structural Capital
o Visible structural capital in production is virtually non-existent. o The most common way to deal with problems is with a suggestion
box, an extraordinarily inefficient way to deal with problems. • Deployment
o The company does not work with stimulating creativity through e.g. education, courses, company visits, etc.
o The amount of trust given to employees is low, resulting in the need for rigorous control of the operations.
• Measurement o Does not measure how Lean empowers employees. o Measures the number of improvement suggestions in the suggestion
box.

68
4.1.3.2.2 Humans = People The second category titled Humans = People, has the goal of creating an environment where employees are encouraged to create value in ways they seem fit. By doing this the companies in this category are able to capture considerably more improvement possibilities than the Humans = Machines category. I.e. they succeed in eliminating the waste Unused employee creativity.
• Approach To Lean o Employees are encouraged to create value by developing
improvements and/or coming up with improvement ideas. o The companies are not necessarily aware of the kata concept, but
have a similar lighter approach. • Structural Capital
o Uses structural capital such as certifications, education ladders and/or in-house courses in order to motivate employees.
• Deployment o Does not deploy the improvement kata. o Cases of coaching (however not coaching kata) exist, these are
however rare and restricted to small groups. o Motivates and inspires employees with activities, e.g. education and
certification. o Empowers employees by sharing the Lean responsibility, providing
them with new tasks. o Employees are required to have a more holistic perception of the
company as opposed to only knowing what is being done in their function.
• Measurement o Measures the competence level as well as the development of the
employees by e.g. using competence matrices and/or educational ladders.

69
NAM
ES
Figure 45 Competence matrix.
4.1.3.3 Blue- and white collar cooperation The final area of this P is Blue- and White Collar Cooperation, which categorize companies depending on how they are facilitating cooperation between blue- and white collars. This area has two different categories, No Bridging Ambition and Bridging Ambition. No Bridging Ambition include the companies that do not try to facilitate cooperation, whilst the category Bridging Ambition include the companies that do try to facilitate cooperation.
4.1.3.3.1 No bridging ambition These companies often organize white collar functions to be strictly above the blue collar functions. The result of this is a strong, and almost hostile, "us vs. them"-relation between blue- and white collars. This damages the potential for achieving successful synergistic cooperation.
• Approach To Lean o Does not believe that blue- and white collar cooperation is
important, hence does not try to bring them together. • Structural Capital
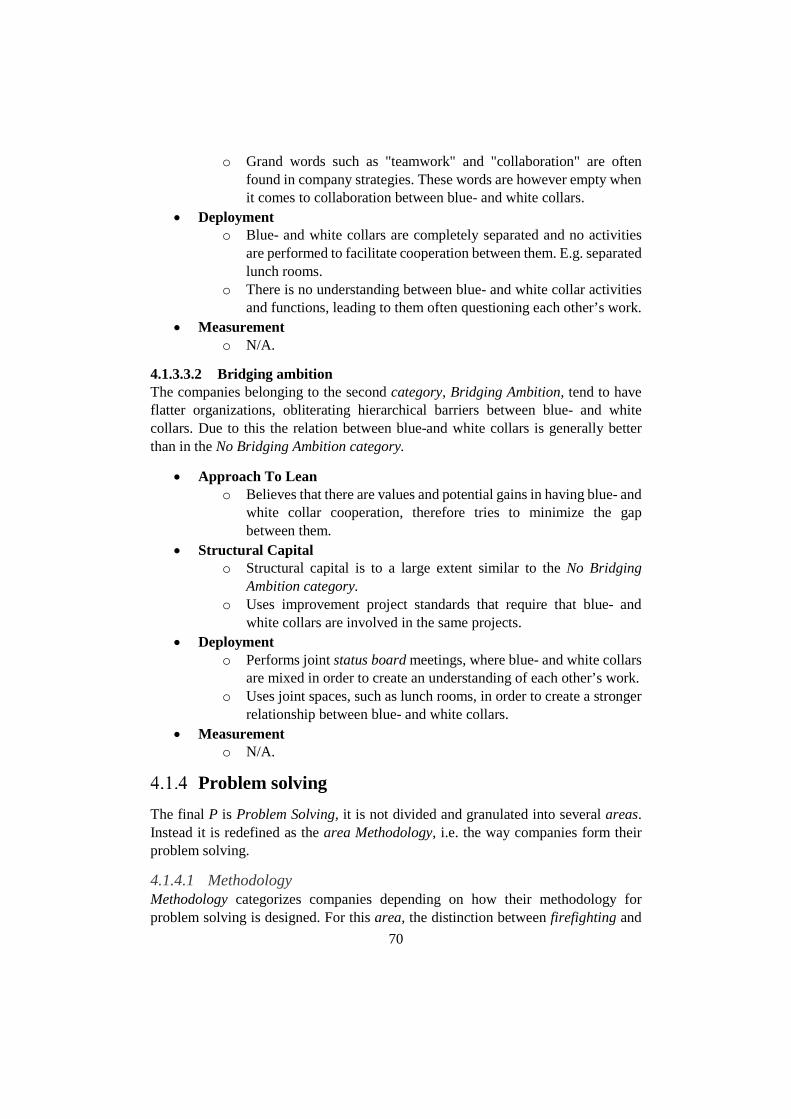
70
o Grand words such as "teamwork" and "collaboration" are often found in company strategies. These words are however empty when it comes to collaboration between blue- and white collars.
• Deployment o Blue- and white collars are completely separated and no activities
are performed to facilitate cooperation between them. E.g. separated lunch rooms.
o There is no understanding between blue- and white collar activities and functions, leading to them often questioning each other’s work.
• Measurement o N/A.
4.1.3.3.2 Bridging ambition The companies belonging to the second category, Bridging Ambition, tend to have flatter organizations, obliterating hierarchical barriers between blue- and white collars. Due to this the relation between blue-and white collars is generally better than in the No Bridging Ambition category.
• Approach To Lean o Believes that there are values and potential gains in having blue- and
white collar cooperation, therefore tries to minimize the gap between them.
• Structural Capital o Structural capital is to a large extent similar to the No Bridging
Ambition category. o Uses improvement project standards that require that blue- and
white collars are involved in the same projects. • Deployment
o Performs joint status board meetings, where blue- and white collars are mixed in order to create an understanding of each other’s work.
o Uses joint spaces, such as lunch rooms, in order to create a stronger relationship between blue- and white collars.
• Measurement o N/A.
Problem solving The final P is Problem Solving, it is not divided and granulated into several areas. Instead it is redefined as the area Methodology, i.e. the way companies form their problem solving.
4.1.4.1 Methodology Methodology categorizes companies depending on how their methodology for problem solving is designed. For this area, the distinction between firefighting and

71
continuous improvement is vital. Firefighting in this case concerns problem solving that entails only dealing with a problem if it occurs and only where it occurred, e.g. to mop up an oil spill. This whilst continuous improvement in this case concerns problem solving that entails preemptive and root cause problem solving, e.g. finding the root cause for the oil spill and ensuring that the cause will not occur in other places (see Table 2 5-Why example (K. Liker, 2004)). Based on this, three categories can be defined, No Scientific and Standardized Approach, Scientific and Standardized Approach to Firefighting and Scientific and Standardized Approach to Firefighting and Continuous Improvement.
4.1.4.1.1 No scientific and standardized approach This category includes companies that use ad-hoc firefighting for Problem Solving. I.e. to solve problems as they occur with solutions made up when they occur. As a result, these companies tend to have a hard time to solve all problems and to prevent the same problems to reoccur.
• Approach To Lean o The company does not believe that improvements can be made to
stop problems from occurring. o The company has not understood that problem solving and
continuous improvement facilitate learning and development of employees.
• Structural Capital o Uses non-standardized and unstructured status boards. o The status board meetings are irregular with a low frequency and is
non-standardized. • Deployment
o Problems are discovered during reviews and quality checks, merely by chance or as a big failure.
o Problems are never solved at the root, making them recurring. o The company lacks a problem escalation process, resulting in
problems not being allocated to the appropriate problem solver, alternatively the problems will not be solved at all.
• Measurement o Only measures the amount of documentation connected to problem
solving.
4.1.4.1.2 Scientific and standardized approach to firefighting Unlike the previous category, these companies use a more thorough process for Problem Solving. Due to this, these companies tend to have a better "solve-rate" of problems than the previous category.
• Approach To Lean

72
o Focuses on solving problems at the root in order to prevent them from recurring.
• Structural Capital o Uses scientific tools and methods to facilitate problem solving, e.g.
A3-reports. o Uses a clearly defined problem escalation process, so that problems
can be allocated and hence solved quickly. o The usage of standardized methods and tools facilitate learning
through problem solving. o Rewrites instructions and standards, continuously developing the
structural capital, so that the same problems may be avoided in the future.
• Deployment o Uses status boards for follow-up and escalation of problems. o Tools and methods are used for problem solving amongst the blue
collars. • Measurement
o Measures the amount of problems that has been solved during a certain time period.
o Tries to have the process of problem solving mirrored in KPIs, such as quality and delivery KPIs.
4.1.4.1.3 Scientific and standardized approach to firefighting and continuous improvement
This category is in many ways similar to the previous category. The difference is that the companies in this category recognize continuous improvement as the preferred way of solving problems instead of firefighting. In addition to what the previous category is able to do, this category is also able to preemptively solve many problems.
• Approach To Lean o Realizes that firefighting and continuous improvements are two very
different ways of solving problems. o Has an ambition to reach a state where continuous improvement is
the only problem solving technique performed. • Structural Capital
o The same as Scientific and Standardized Approach to Firefighting. The difference i.e. continuous improvement is not mirrored in the structural capital since it is more of an intangible mindset.
• Deployment o Problem solving is holistic, i.e. problems can be solved across
functions.

73
o Due to the holistic mindset, the company is able to highlight problems concerning the entire value chain.
• Measurement o Sets ambitious goals and sub-goals for processes, creating a need to
improve processes in order to reach these goals. Due to this, continuous improvement is achieved.
4.2 Compilation of CI Section 4.1 Compilation of LS, defines how companies work with different Lean areas and how they can be categorized and sorted within these. However, the scope of these areas do not extensively and scientifically assess how the company interacts internally across dimensions inside the company. Hence this expansion concerning CI.
As mentioned in section 3.1.6.3 Model for compilation of CI, there are, in terms of CI, a number of relevant department/division interactions. Below follows a compilation of observations of ways in which interaction has been unsuccessful between departments, as well as from which side (which department) of the interaction that the failure stems. Note that these interactions have been studied from production’s perspective and also that the bolded department is the department "responsible" for the specific interaction failure. In this master thesis, only interaction failures have been studied. The reason for this is that signs of failing interaction is what has been observable in practice. Successful interaction is harder to observe since it by working, implicates that it is invisible. Only the interaction between Production and Human Resources will be exemplified highlighting successful interaction. Note that no interaction between Division X and Division Y can be exemplified since none of the companies visited had a divisional organization.
Production vs. Management
This interaction mainly concerns VI.
• Management has a low level of presence in production. This is often due to management not considering production as one of their primary concerns. Instead sales and customer relations are often the primary concern.
• Management issues short-term objectives, in contradiction to Lean Philosophy, with regard to Lean implementation in production. This fact will most likely push Lean transformation in the wrong direction and in worst case cause total failure.
• Management imposes Lean to the company, but are not role models with regard to it. Failing to live as one learns, will naturally not inspire the rest of
CI

74
the organization to exercise Lean, resulting in a disbelief towards Lean and failing to implement it.
• Production feel that they are being run over by management’s decisions and directives, causing huge production disturbances. This in turn causes production to instead disregard the directives they have been provided, with the excuse that it is for the greater good of the company, not to have huge production disturbances. This discrepancy between management directives and what is reacted in reality, especially with regard to Lean implementation, is a huge common internal issue for many companies.
Production vs. Purchasing
This interaction mainly concerns CFI.
• Purchasing is not taking the incoming order demand in production under consideration when making decisions regarding procurement of raw materials. This results in unnecessary inventory as well as waste related to handling of the goods.
• Production is not able to properly relay their needs, such as the required quality of raw material and components, making it impossible for purchasing to actually know what to acquire for the company. This can lead to wastes such as defects, due to low raw material quality, and overprocessing, due to raw material of too high quality.
Production vs. Quality (as separate departments)
This interaction mainly concerns CFI.
• Quality considers their responsibility to only entail ensuring the right quality of products and thus tend to just report when a quality deviation has been spotted without trying to analyze and find out the root cause for the quality deviation.
• Production is not working with preemptively ensuring quality in production by building in quality, by utilizing tools such as Poka-Yoke, visual control, Jidoka, interim quality checks, etc. This leads not only to a higher number of defects in total but also to quality deviations being spotted later in the production process.
Production vs. Human Resources
Note that, unlike the other interactions in this section, the example of this interaction highlights successful interaction. This interaction mainly concerns CFI.
• Human Resources has close collaboration with high schools and/or vocational schools, where students are given training and apprenticeships during the course of their studies. These then result in the synergy where the

75
students get summer jobs and/or full-time employments and the company’s production function secures highly trained manpower for the future. This interaction is particularly relevant in today’s Sweden, where the machining industry is finding it hard to attract young people to come work for them.
Production vs. IT
This interaction mainly concerns CFI.
• IT is not concerned with trying to facilitate production planning processes by adjusting or adapting the company’s enterprise software to better support production planning, making the software unnecessarily complex.
Production vs. Sales
This interaction mainly concerns CFI.
• Sales is only focused on selling and will sign practically any contract they get an opportunity to sign, without taking production into consideration. This commonly entails expected lead-times to be cut down dramatically, which in turn leads to an increased need for inventories and/or that the orders simply will not make it in time. Sales’ promises can also lead to extreme, sometimes unnecessarily high, quality requirements that makes the production process much more complex. In essence, sales can potentially cause huge capacity issues for production.
• Production is primarily interested in producing a small set of different products without any specific details or differences to them. When approached with a customer-specific product, production tend to meet this with great skepticism and be reluctant to the change.

76
Analysis Before going into the actual analysis of the data, something has to be said about the trustworthiness of the data collection and compilation. Being a qualitative study, the differentiation between what data is and what is an analysis of data can be fuzzy. Walking on this fine line, i.e. collecting this type of data without subjectivity, requires continuous questioning of the researchers’ objectiveness. Hence the following question arose: Is the collection of data following the method of achieving research trustworthiness and quality, in accordance with 3.2 Trustworthiness and Quality of the Research?
In order to in the end be able to answer this question honestly, it was asked and answered regularly throughout the entire data collection and compilation. This in order to assure and keep trustworthiness and quality constant.
Another question that arose was: How and when can collection of data stop? The answer to this question came in the form of information saturation, in other words collecting data until the amount of emerging new information is close to zero with regard to the Purpose of the master thesis, see Figure 44 Information saturation. In practice, and in this case:
• The information saturation refers to the four different parts, constituting the Factory visit report, in accordance with section 3.1.5.1 Tailored case study and Figure 24 The Factory visit.
• The actual information saturation, occurred several company visits before the realization of information saturation (see the two crosses in Figure 44 Information saturation).
Hence it is fair to deduce that enough data has been collected to be able to answer the Frame of Question in the Purpose (see section 1.3 Purpose).
Below follows the continuation of the LS and CI tracks that began in chapter 4 Data Compilation. As the title for this chapter indicates, the processing of the tracks will in this chapter entail Analysis of them separately, i.e. section 5.1 will cover Analysis of LS and section 5.2 will cover Analysis of CI.

77
AMO
UN
T O
F EM
ERG
ING
NEW
INFO
RMAT
ION
NUMBER OF COMPANY VISITS
INFORMATION SATURATION
DATA COLLECTIONTERMITATED
Figure 46 Information saturation.
5.1 Analysis of LS Analysis of LS is constituted by three parts:
• General Trends and Conclusions: Based on the collected data, some general trends and conclusions will be presented and analyzed.
• Lean Discrepancies: Cover the Lean discrepancies between real-life companies and Lean theory that can be found in general as well as in each subset of Lean, i.e. Lean areas as described in section 4.1 Compilation of LS.
• Cultural Differences: Highlight and analyze the Cultural Differences present between the two countries Sweden and Denmark, in which companies were visited for this master thesis.
General trends and conclusions As described in section 4.1 Compilation of LS, concerning the areas, the categories represent the different states a company can belong to, with regard to a specific Lean area. These states range from "worse" to "better", as depicted in Figure 32 Presentation model. In order to set these in relation to something (other than their counterpart, worse for better and vice versa), a fictitious average, had to be invented. This fictitious average is not quantifiable and will not be described. It is rather to be
LS

78
considered as an average performance in the middle between the worse- and the better category for each area. Due to this fictitious average performance, which is what is being compared to, it is no longer suitable to refer to the worse and better categories as states and instead they will henceforth be referred to as practices. While a state is suitable to represent a condition, a practice is better suited to represent performance.
Observe that the, now denoted as, worse or better practices are not to be considered as worst or best practices due to:
• The unmeasurable nature of Lean. • The fact that, with regard to Lean, something could always be worse or
better. • The fact that, in relation to Lean practice in theory, the companies visited are
neither fulfilling nor abandoning all Lean theory, hence they are neither worst nor best form a theoretical perspective.
All companies that have been visited can with a surprisingly high level of accuracy be distinctly sorted into one of the categories under each area. In relation to this, one questions how a certain company is sorted into categories across all areas. After having assessed and studied this question, the following general trends emerged, upon which conclusions could be drawn:
Trend: The most prominent trend is that companies are either generally worse or generally better than the fictitious average performance as illustrated in Figure 45 Companies in relation to the fictitious average performance. In other words, when sorting a company into categories, the company tends to be sorted into either the worse- or the better practice categories across all areas. Of course there are some exceptions to this rule, but in general that is the case.

79
PROCESS AREAS
PEOPLE & PARTNERS AREAS
PHILOSOPHY AREAS
PROBLEM SOLVING AREAS
WORSEPRACTICE
BETTERPRACTICE
COMPANIES THAT AREGENERALLY ”GOOD”
COMPANIES THAT AREGENERALLY ”BAD”
FICT
ITIO
US
AVER
AGE
Figure 47 Companies in relation to the fictitious average performance.
Conclusion: It becomes evident that Lean has to be approached as a whole in order to be able to succeed in any area. Lean’s 4Ps are strongly codependent on each other, meaning that in order for one P to work properly all the other Ps must also work. This fact is easily exemplified however not as easily reacted in reality.
Consider for instance that a company wants a more streamlined and efficient Problem Solving procedure. The procedure for accomplishing this for an inexperienced Lean leader, could look something like this:
1. He/she would happily realize that Problem Solving is one of the four Ps and that applying it will make his/her company become more Lean.
2. He/she would then study up on theory concerning what tools to use in order to facilitate Problem Solving, enthusiastically realizing that there are many seemingly simple tools for this e.g. 5-Why.
3. He/she would then construct necessary templates for the tools (the more the merrier).

80
4. Then he/she would go to the blue collars at the production floor, introduce all new templates and papers that are now to be filled out whenever a problem occurs.
5. Having digested the new information, the blue collars will: a. Consider everything new to be extra work and perhaps demand a
pay raise. b. Either only fill the templates just to have had them filled or totally
ignore these new procedures. c. Develop a dislike towards the Lean leader that gives them more
work that is not value adding to them. d. In the future consider this "Lean-thingy" to be a total waste of time.
6. After some reiterations the Lean leader will realize that: a. The implementation of the tools has crashed and burned. b. He/she has spent a vast amount of man-hours on something that did
not create any value, but instead created disharmony between he/she and the blue collars.
7. Finally he/she will develop a disbelief towards Lean and/or his/her ability to implement change.
Accomplishing the same desired output for an experienced Lean leader, could not be described as a linear procedure (i.e. as 1. 2. 3...), but rather as a complex and unpredictable journey. The experienced Lean leader realizes the following facts:
• This new Problem Solving entails changing the behavior of people, something that can neither be done easily nor over a fortnight. Hence the Philosophy, surrounding this work, time and effort, needs to have a long-term scope and be prepared for some short-term losses.
• In order for Problem Solving to work, the company with its employees, must understand why problems need to be solved. In other words, they must have the fundamental understanding for the Process of eliminating waste.
• The new Problem Solving approach will not create value before it is properly implemented and understood by the People of the company. Achieving this will require a slow incremental implementation with innovative ways of creating the "buy-in"-effect amongst the employees. In other words, getting the employees onboard with the implementation and making them understand how their work could in fact be made easier.
• Having the correct Philosophy, Processes and People will facilitate and enable Problem Solving. Only deploying a partial implementation, i.e. what was done by the inexperienced Lean leader in the example above, will not achieve anything. This due to the fact that not having one P in place will contradict implementation of the other Ps.

81
Comparing these opposites highlight how the difference in Lean understanding can affect a company either positively or negatively. Furthermore it shows the level of complexity that must be accepted in order to achieve desired results.
Trend: There are best practices but no best practitioners. In other words, there are companies executing best practice of a certain area, but there is no one company that could be defined as the best practitioner across all areas.
Conclusion: This fact indicates on how and where Lean efforts are made. In relation to Lean implementation, all companies have their own strengths, weaknesses, opportunities and threats (in accordance with SWOT-analysis). These are easy to detect, why many companies tend to use them as a starting point for Lean transformation. This starting point, could be to either further develop a strength, eliminate a weakness, take advantage of an opportunity or mitigate a threat. Either way, companies tend to grab on to the small set of tasks that are most prominent, and then put a disproportionate amount of focus on them. This small set of tasks from the SWOT-analysis tend to have a strong correlation to one of the Ps from the 4P-model. Having this focused approach will often lead to a company developing best practices within a certain P, at the expense of performance in other Ps. I.e. the distribution of effort becomes unbalanced as illustrated by the left example in Figure 46 Examples of distribution of effort.
PHILOSOPHYPROCESS
PEOPLE & PARTNERSPROBLEM SOLVING
BALANCEDUNBALANCED
25%25%
25% 25%55%
Figure 48 Examples of distribution of effort.
Hence, with this approach, there will be best practices but no overall best practitioners. This approach is not necessarily bad, however if allowed to continue over a long period of time, this unbalanced effort distribution can jeopardize long-term success. A more sound approach would be to rejoice the best practices, but then move on to harder tasks where performance is not as good. In other words, to not only work with improving what you are good at doing, but also improve what you

82
are bad at doing, aiming for a balanced effort distribution as illustrated by the right example in Figure 46 Examples of distribution of effort.
Trend: Companies categorized as worse practice are in general small sized companies with little to no capacity to spend time and money on Lean transformation.
Conclusion: Due to having very limited time to spend on Lean, the efforts are often aimed at the parts of Lean theory that are the easiest to understand. In practice, this tendency will entail the Lean effort to be severely misguided and to only cost effort without any gain. A typical scenario for these smaller companies that sort into the worse practice categories, could be as follows:
1. The CEO/owner, with a background in finance, has heard of Lean and wants his/her company to "become Lean" without really knowing what being Lean means.
2. The task of "making the company Lean" is given to the company’s production manager (PM), who is already overburdened with duties.
3. The PM finds a very short period of time to study Lean theory, from which he/she picks the Lean tools that are the easiest to understand and that he/she imagines can generate savings the quickest.
4. The Lean transformation, devised by the PM, is not strategized, but is rather a set of tools that are unorganized and chaotic in their deployment.
5. Deployment of the tools goes through the following phases: a. Head on full deployment of tool. Everything is done without
knowing why anything should be done. b. Due to not creating any apparent value, implementation in not being
sustained. Tool transforms into a half-measure of its original shape. Tool is now only considered as a burden that creates more work.
c. Tool is either continued as a burden or discontinued. 6. CEO/owner and PM starts to argue. The CEO/owner still wants to be Lean
and reap short-term successes whilst the PM says that it is impossible with current resource allocation.
In practice there are, in this type of company, no means in place to make sound Lean transformation feasible, until more resources are allocated to the Lean effort.
Trend: Companies categorized as better practice are in general mid- to big sized companies with capacity to spend time and money on Lean transformation.
Conclusion: These companies have often tried the approach to Lean commonly seen in the worse practice companies. This approach has failed and resulted in a reboot of the Lean initiative. This reboot is much more thorough and extensive, why it also gets allocated more resources. The Lean transformation starts with understanding Lean and getting the foundation right. It continues with making decisions slowly by

83
consensus, thoroughly considering all options and then with rapid implementation decisions, in accordance with Lean Principle 13, see 2.1.3 The 14 principles of Lean.
Lean discrepancies For the companies visited, there are still many missing pieces to the Lean puzzle. These pieces refer to parts of Lean theory that is currently not being implemented at all or is being implemented in the wrong way. To what extent a company is able to add further implementation and/or change current implementation, is greatly dependent on its capacity and capability to change. The missing pieces that are feasible to add in different situations could either be:
• New tools, methods and/or concepts that are added onto a current Lean initiative.
• Changes to implementation that are tweaks and twists of a current Lean initiative.
How these missing pieces relate to the different practices, can be illustrated with Figure 47 Relationship: worse-, better- and desired practice. Note that a third type of practice gets introduced here. It will be further described below.
WORSE PRACTICE
BETTER PRACTICE
DESIRED PRACTICE
Figure 49 Relationship: worse-, better- and desired practice.
In Figure 47 Relationship: worse-, better- and desired practice, the cylinders represent the "amount of Lean" that is being deployed, the colors represent the practice and the block arrows represent changes in implementation. In reality it is not as simple as saying that one company belongs to a certain type of practice, but

84
for practical reasons, let us assume the depicted three practices as three absolute "Lean-conditions".
The transformation from worse- to better practice is in essence to acquire deeper understanding of Lean, beyond the tools, and simply add the missing pieces, in accordance with what is described in the better practice categories for the areas.
The transformation from better- to desired practice is in essence the difference between what is currently being done and what would be feasible (desired) to also do. The most predominant discrepancies between "what is done" and "what could reasonably also be done", are:
• Katas, i.e. actively working with changing behavior. • Objectives that will constantly drive and push continuous improvement
(Kaizen). • White collar Lean.
Observe that these discrepancies are only general and not to be considered as absolute guidelines. Trying to construct detailed guidelines that apply to many companies is unsound due to every company being unique. Hence there will in this master thesis be no detailed explanation of what a desired practice for a specific area would entail.
As stated in the first trend in section 5.1.1, there are only worse- and better practices, no worst or best. This where the imaginary best practice would entail to be able to follow Lean theory in every detail. Following Lean theory in every detail would be virtually impossible due to theory, per definition, not being equal to reality. Reality sets constraints that in some cases can be obliterated, however these constraints are often something that companies must submit to. Consider for instance this real example:
The company (denoted as X in this example) is small in size and located in the southern part of Sweden. It has over 50% of its business with one customer in the automotive industry. This customer’s orders to X are irregular in both frequency and amount. Furthermore the customer has demanded an extremely short delivery lead-time. The customer is most likely aware of X’s dependency on its orders, hence it knows that X is unlikely to drop them as customers despite the absurdity of the orders. X has had to adapt to this reality by having extensive inventories in order to cover up for these orders.
For X to have these inventories is of course not very Lean but it is the reality X is forced to live by. One can argue that X could shorten their lead-times to fit the orders, however this time-cut by circa 70% is in reality infeasible. That is not to say that there are not improvements to be made in order to strive towards a desired practice, just that becoming best practice in accordance with Lean theory is virtually

85
impossible in reality. Making these feasible improvements would result in a practice that is feasible, in other words desired practice as described earlier.
The following sections will concern the discrepancies that exist between Lean theory (best practice) and the different areas’ practices. The analysis will regard the bigger discrepancies rather than going through every category. Furthermore the analysis will highlight some other general situations of reality that companies commonly have to adapt to.
5.1.2.1 Philosophy Lean Strategy
This might be one of the hardest Lean aspects to grasp since it covers many softer intangible values that are hard to define and see. What has been strikingly clear is that companies in the better practice category has had a first go at Lean with a Toolbox Strategy, failed and then rebooted with a Culture Strategy. Furthermore, the companies belonging to the better practice category, even though having a correct approach, still often disregard Lean in the company’s overall strategy. This is contradictory to what Lean is all about since, if a company wants to become Lean, it must be included as a central part of the company’s strategy in order to create a clear direction for Lean.
Lean Organization
When studying Lean in general, and Lean at Toyota in particular, it becomes undoubtable that Lean transformation should not be allocated and organized as a separate function. Instead Lean should be integrated and by that, be practiced everywhere in the company as a mindset. The simplest way to see this is to study the katas, more specific the coaching kata. By having Lean experts deploy coaching kata, Lean can propagate throughout the company, reaping all the benefits from having sound improvement kata deployed. However, this is easier said than done, since it would in many cases require extensive reorganization in order for it to work properly.
5.1.2.2 Process Level of Pull
In many value chains, being pull is unfeasible due to restrictions in parts of the value chain, e.g. a time consuming heat treatment. Some prerequisites to be able to efficiently be pull, are:
• All processes must have similar processing times (no unevenness). • Customers demand for delivery time have to be compatible with pull, i.e. the
production lead-time cannot be extensively longer than the customers expected lead-time.

86
Most of the company’s current situation is that they are restricted by uneven processes and/or customer demands and hence has to use inventories as a security. This is one of the most prominent reasons to why pull is not practiced in reality.
Waste
The concept of waste can be considered as an easy concept to read in a book, however the actual process of eliminating waste is indeed complex. As mentioned earlier, Lean must be considered as a continuous journey, during which, elimination of waste is paramount. Some waste of different kinds and magnitude, will always exist. To exemplify, the following section will discuss different wastes and why companies have issues eliminating them.
• Excess inventory includes inventories for raw material, FG and buffers. In a perfect world, abiding to Lean theory, these inventories would not exist. However, in reality, companies have to use inventories in order to keep machine utilization (OEEs) at a reasonable level and to be able to satisfy customer needs.
• Unnecessary transportation includes transportation of WIPs and FGs over long and unnecessary distances. Unnecessary transportation can be eliminated by e.g. developing flows that facilitate keeping Unnecessary transportation to a minimum. However, for many companies, the production facility layouts were originally organized without thinking of creating flow. Therefore, to now create flow with Lean in mind, would mean extensive investments by the companies in order to change the layout. In many cases, these investments cannot be justified with regard to the expected gain of the investment and hence they will not be made.

87
Figure 50 Production facility built without flow in mind (Carlsson & Fröberg, 2015).
Methods and Tools
As emphasized throughout this master thesis, Lean is not to be considered as a set of tools and methods that just are to be implemented in order to become Lean. The tools and methods are rather what support and facilitate the Lean journey. According to Lean theory, what the Autonomous Tool category is trying to accomplish is something that is very close to an ideal case (best practice). This where everyone at the company has the insight, knowledge and skill to use the tools when they need to rather than forcing it upon them. Ideally it should for example not be needed to have to perform 5S- revisions and evaluations in order to sustain 5S. It should rather be integrated into the organization to a level where 5S is carried out and developed by itself. I.e. development of new improvements that become standards. The same goes for Problem Solving, it should come naturally to use the different tools and methods for solving problems. Furthermore, in order to reach a state where a company has independent self-learning employees, the company must work with behavioral, as well as cultural, factors. This will create a continuous organizational evolution that will never end, just further augment a company for each leap forward.
Simplification and Visualization

88
A central part of Lean is how to work with visualizing and simplifying processes. By making everything as simple and visual as possible, the risk of employees causing problems due to misunderstanding, is dramatically reduced. In a perfect world, an employee being uncertain of how and why he/she should do something in a certain way, should not be a risk. The following sections will discuss:
• Visualization and how it relates to simplification. • Simplification and how it relates to visualization.
Visualization is the act of converting something abstract and/or intangible into a visual representation, e.g. a written description of where and how tools are to be placed at the end of a workday (something abstract), replaced by photos showing how everything is supposed to look (visual representation). This tool is useful when trying to communicate a message or idea. Many of the visited companies are able to perform visualization, however they often miss the fact that visualization and simplification, in most cases, go hand in hand. The reason for this is that making something visible without first making it simple, in most cases, make little sense, e.g. having too many and too detailed pictures describing how something is supposed to look. Simplification is the act of converting something complex and unstructured into something simple, e.g. converting a process description from a body text (something complex) into a numbered list of steps (something simple). This tool is useful when the goal is to communicate something complex and/or unstructured. Simplification is what, to a large extent, separates the better practice companies from the worse practice companies. The worse practice companies do visualize, however due to not simplifying the visualization, it becomes more destructive than helpful. The reason for this is that, visualizing is easier than simplifying. A way these companies could have avoided this would have been to view visualization as a part of simplification.
5.1.2.3 People and partners Lean Change Management
In order to achieve successful Lean implementation, practicing it ought to propagate from the top of the organization downwards. Management must make it clear beyond any doubt that Lean is to be implemented and "lived" by the whole company. This is however not, in most cases, what has been seen in reality. The most common problems and mistakes amongst the companies and the reason for them is discussed in the sections below.
• Lean is managed from the bottom up As Lean, to a large extent, focuses on the core activities of a company, companies believe that Lean only should be of concern in production. As a result, Lean is only discussed from an operational point of view and hence not taken into consideration in strategic decisions. Due to this, the task of managing Lean is put on e.g. production leaders who has a hard time to

89
justify why the blue collars in production should work with Lean, whilst the rest of the company is not.
• Lean is seen as a means to reap short-term gains Companies usually start off with Lean implementation as a project, quickly reaping some improvements from low hanging fruits. Management, having acquired a picture of what they believe can be expected of Lean, then expects this reaping of improvements to continue throughout the entire implementation. However, when these quick improvements need to be sustained and the reaping gets harder, Lean implementation will not seem successful anymore. To be truly successful companies need to realize that they have to be prepared to accept short-term losses in order to gain long-term sustainable results.
Employee Empowerment
By this point it should have become obvious that Lean is all about changing behavior and creating a certain type of culture. In other words, the basics of Lean is focused on people and employees, hence employee empowerment is of paramount importance. The biggest discrepancy between Lean theory and practice, concerning employee empowerment, is the lack of coaching kata amongst the companies. Indeed there are some companies that utilize coaching, however only high up in the organization. Hence there is no coaching kata present throughout the organization. The reason for this is mostly due to the complexity and time needed to conduct and establish the type of coaching that is coaching kata. Developing a complete coaching structure takes several years, since it requires every level of coaches (mentors) to fist themselves learn about the katas, before they can teach their mentees about them.
Blue- and White Collar Cooperation
Blue- and White Collar Cooperation is not explicitly studied and analyzed by the Lean theory acting as the Frame of Reference for this master thesis. However, it is believed to have consequences concerning Lean because without Blue- and White Collar Cooperation it will most certainly be hard to have a successful Lean transformation. In the following section, an analysis will be performed on different ways to strengthen relationship and how to bridge blue- and white collars together.
• Joint activities to enhance communication, e.g. double Gemba Walks To create strong relationships and trust within the organization, communication has to be strong. Throughout the visits, cases of Gemba Walks, or production walkthroughs, has been observed, i.e. white collars walking through production in order to get a feeling of the current situation of the core activity that is production. The intention of these Gemba walks is good, but how will the white collars actually know what to look for? Answering this question has resulted in the idea of having joint "double Gemba Walks", where white collars are guided by blue collars throughout

90
production, discussing the current situation. The roles are then switched so that blue collars are guided by the white collars through the offices in the same fashion. By doing this, communication becomes stronger whilst also creating a deeper understanding between blue- and white collars.
• White collar introduction and internships in production Another way of creating and enhancing Blue- and White Collar Cooperation is to have white collars work a short period in production and afterwards take regular internships. By doing this, white collars get an understanding of how their work affects blue collars in production. It also creates the sense of everyone being on equal hierarchical levels.
• Create "light-blue collars" Companies commonly have a strict differentiation between what work that is to be done by blue- and white collars respectively. I.e. blue collars should only perform manual labor whilst white collars should only perform professional, managerial and/or administrative labor. Consider instead the possibility of having "light-blue collars" (i.e. an employee that perform a mix of blue- and white collar labor). This type of employee would be a perfect intermediary between blue- and white collars that could create possibilities for conveying information and creating deeper understanding between the blue- and white collars.
5.1.2.4 Problem Solving Methodology
As mentioned in section 4.1.4.1, the most vital difference between companies is if they are deploying firefighting or continuous improvement as their means of solving problems. Therefore, the following sections will be separated to focus on companies utilizing firefighting and the companies utilizing continuous improvement separately. These sections will also try to identify the reason for why the companies are utilizing firefighting or continuous improvement.
Companies utilizing firefighting as their problem solving methodology, often have a hard time differentiating between firefighting and continuous improvements. They consider themselves deploying continuous improvements while it in fact is firefighting. The most prominent reason for this, is that these companies tend to lack a methodology for identifying problems and/or deficiencies, resulting in problems only being solved once they appear.
Companies utilizing some level of continuous improvement are, as opposed to the firefighting companies, able to see the difference between firefighting and continuous improvement. They are able to, in an efficient manner, teach their employees the difference, resulting in the employees trying harder to find the root cause for problems. In addition, these companies set ambitious goals that are frequently measured upon. Measurement of these goals is what "forces" and drive processes to

91
improve. Due to these two reasons, i.e. teaching employees and "forcing" processes to improve by setting goals, these companies are, to a certain degree, utilizing continuous improvement rather than firefighting.
However there are still parts that most companies is not able to grasp. A typical example is Genchi Genbutsu (go and see). Solely getting a report about a problem, is rarely enough in order to be able to find a solution to it. To be able to really understand the circumstances, under which the problem arose, one has to go and see the process. This is something many companies tend to miserably fail at, due to their proneness to prioritize getting a problem solved quickly (firefighting), instead of getting it solved properly at its root (continuous improvement).
Cultural differences As mentioned in section 5.1, a part of the analysis of LS is to identify whether there are any cultural differences between how companies in Sweden and Denmark are working with Lean. Note that this analysis of cultural differences is only applicable to the two countries Sweden and Denmark. The differences cannot, with a high level of certainty, be applied to a comparison of any other countries.
The following section will cover the main reasons to why there seems to be no clear geographical cultural differences between the companies studied.
• Lean focuses on changing behavior and culture of a company As Lean, according to Lean theory, is implemented in order to change the culture of a company and the behavior of its employees, it ought not to be dependent on the culture of the country where it is implemented. What instead seem to influence the success of Lean implementation is rather the company’s culture. A company where the culture is open-minded, the attitude is positive and the organization is flat, Lean implementation will be way smoother, compared to a company where change is met with resistance. Hence, cultural differences are more likely to be expected between companies (depending on how good the Lean initiative is), rather than between countries.
• The way organizations are structured and managed are more or less the same in Sweden and Denmark In general, the organizations in Sweden and Denmark are flat, providing a lot of time for discussions and creativity for every employee. Having this setup, can be both harmful and advantageous for the company.
o Harmful when, the lack of a hierarchy creates a situation where every employee always question change suggestions, feeling that they ought to always have a say and an opinion.
o Advantageous when, the employees do not abuse their influence, but rather aid in truly creating new smart Lean solutions.

92
In conclusion, as with the bullet above, whether having a flat organization is harmful or not, seems not to depend on country, but rather on the company.
• The operational challenges of the studied companies are similar Regardless of whether a company produces components of finished products, it will always encounter the same fundamental challenges. These challenges are as always to provide customers with products, with impeccable quality, as cheap and as fast as possible, avoiding having the customers go to a competitor. Having these same fundamental challenges is another reason why there are no geographical cultural differences between Sweden and Denmark.
5.2 Analysis of CI Analysis of CI is constituted by the three sections:
• Causes for Failing Company Integration: Based on thorough analysis of the data from 4.2 Compilation of CI, a set of causes, common for this data, is presented and described here.
• Expanded Definition of Company Integration: Due to CI being a new concept, it has to be expanded and redefined in order to fit further exploration.
• Case Examples of Company Integration: Based on the new Expanded Definition of Company Integration, an unsuccessful- and a successful case example for each integration type is presented. This in order to exemplify and further illustrate and explain CI.
Causes for failing CI Having sorted out in which ways CI is commonly failing, one might wonder which root causes that are behind these failures. When performing a root cause analysis on the failed interactions, the common denominators are:
• The lack of communication: To some extent, communication is always an issue in a company. In general the more people, the worse is the overall communication. A low level of communication will result in uncoordinated actions throughout the company. This in turn will cause a vast amount of issues. Lack of communication vertically is, but is not limited to, when management fails to communicate directives/instructions and/or when employees fail to communicate issues/needs. Lack of communication cross-functionally is, but is not limited to, when one department/division fails to communicate needs/issues concerning cooperation across departments/divisions.
• The lack of knowledge: Consider the scenario of a physician performing surgery with a nurse that is an electrician (and has no nursing education).
CI

93
The scenario is absurd and would only take place in an emergency situation. Now consider the scenario of a purchaser, with a degree from a business school, purchasing raw material that is to be used in production. This scenario is also, to some extent, absurd, however this is not an anomaly, but rather a common case at companies. This lack of knowledge vertically and cross-functionally will ensure discrepancies between all types of interactions.
• The "I know best"-delusion: This mindset is when a person (or group of people) chooses to abandon company SOPs and/or -policies because he/she feels that he/she know a better or more convenient way of solving a certain task. This new unsanctioned approach will ensure that standards are not being followed and that local ad hoc solutions are created. Furthermore, the approach will most likely be more convenient for the person (or group) that invented it, whilst being suboptimal for other parties. Parties that are, in some manner, affected by the task and are dependent on it being performed in a certain way.
• The lack of a holistic perspective: In a company, departments/divisions have a tendency to isolate themselves and build a teams within teams. This isolation will cause narrow-mindedness, which in turn will cause the departments/divisions to strive toward different goals. In practice, this is common in departments/divisions that have contradicting KPIs. It could for instance be when purchasing has a KPI aiming at cutting purchasing costs, whilst production has a KPI aiming at cutting production costs. At first glance these KPIs are not contradicting, but consider what happens when purchasing buys cheap raw material that causes failures in production. Then the KPIs are in clear contradiction of each other.
These denominators are present in interactions between all parties in a company. Interaction between different hierarchical echelons (vertical), interaction between different departments/divisions/functions (cross-functional) and interaction between several parties from/within the same function or of the same type. The first two interactions can easily be linked to VI and CFI, respectively. However the latter interaction has no intuitive link to any type of integration, why the term horizontal integration (HI) is coined and henceforth to be used when considering interaction between several parties from/within the same function or of the same type.
In conclusion, these root causes for failing CI are pitfalls that all companies to some extent fall for. The question is how to mitigate and prevent the effect of these pitfalls, and how they can be turned into strengths. To do this an Expanded Definition of Company Integration is needed.

94
Expanded definition of company integration In order to be able to actually use and make something of this new concept, that is CI, one must understand the new Expanded Definition of Company Integration, as a whole. I.e. definite and understandable definitions of the, now three, different types of integration (recall the addition of HI) and how they relate to each other. These definitions are to be considered as an extension of the descriptions made in section 2.2. The reason for these extensions is simply that the theory behind is not exhaustive enough to properly describe the three types of integration.
As mentioned before, CI regards how, and to what extent, collaboration, coordination, problem solving and communication is carried out in and between the different organizational dimensions of a company. However, when designing the Expanded Definition of Company Integration, one of the primary goals was for it to be applicable to as many situations as possible. As mentioned above and strengthened by this, the old definition of CI, is not sufficient. Therefore the concept of CI and its variations, is henceforth represented by Figure 49 Expanded Definition of Company Integration, and defined as the entirety constituted by the three subsets VI, CFI and HI.
COMPANY INTEGRATION
VERTICAL INTEGRATION
CROSS-FUNCTIONALINTEGRATION
HORIZONTALINTEGRATION
INTER INTER INTRA INTER INTRA INTRA
DEPARTMENT DIVISIONECHELON DEPARTMENT DIVISION
INTE
R-EC
HEL
ON
VI
INTE
R-D
EPAR
TMEN
TAL
CFI
INTR
A-D
EPAR
TMEN
TAL
CFI
INTR
A-D
EPAR
TMEN
T H
I
INTE
R-D
IVIS
ION
AL C
FI
INTR
A-D
IVIS
ION
AL C
FI
INTR
A-D
IVIS
ION
HI
1
2
34
Figure 51 Expanded Definition of Company Integration.
As mentioned, this adds one organizational dimension to the previous two, rendering three organizational dimensions in total. The relation between these is illustrated in Figure 50 The three organizational dimensions.

95
CEO
LOGISTICS 1 LOGISTICS 2 LOGISTICS 3
SALES 1 SALES 2 SALES 3
PURCHASE 1 PURCHASE 2 PURCHASE 3
LOGISTICS 4
SALES 4
PURCHASE 4
PRODUCTION 1 PRODUCTION 2 PRODUCTION 3 PRODUCTION 4
SALES LOGISTICS
PRODUCTION PURCHASE
Figure 52 The three organizational dimensions.
Observe that this figure is just an example and that it is organizationally structured into departments.
Before deep diving into the different integration types, something has to be said about the common different types of organizational structures for which the tool is applicable These common types are the functional oriented structure, the divisional structure and the matrix structure (Hulthén, 2015) as schematically illustrated in Figure 51 to Figure 53.

96
CEO
PRODUCTION PURCHASE LOGISTICSSALES
Figure 53 Functional oriented organizational structure.
CEO
DIVISION 1 DIVISION 2 DIVISION 4DIVISION 3
PRODUCTION
PURCHASE
SALES
LOGISTICS
PRODUCTION
PURCHASE
SALES
LOGISTICS
PRODUCTION
PURCHASE
SALES
LOGISTICS
PRODUCTION
PURCHASE
SALES
LOGISTICS
Figure 54 Divisional oriented organizational structure.

97
CEO
PRODUCTION PURCHASE LOGISTICSSALES
DIVISION 1
DIVISION 2
DIVISION 3
DIVISION 4
Figure 55 Matrix oriented organizational structure.
The Expanded Definition of Company Integration is directly applicable to the functional (departmental) oriented structure and the divisional structure. However for the tool to be applicable to the matrix structure, one needs to combine the use of the two first structures. This combination will not be further assessed since it can differ greatly from organization to organization.
Concerning the organizational structure, it is important to differentiate between departmental or divisional (or the matrix combination) for CFI and HI, as illustrated in the 3rd level of Figure 49 Expanded Definition of Company Integration. For VI, the differentiation is not as relevant. This level will be further assessed in later sections.
Lastly VI, CFI and HI in Figure 49 Expanded Definition of Company Integration, can in turn each be separately divided into a 4th level. The meaning of level 4 for each type of integration will also be assessed in later sections.
5.2.2.1 Expanded definition of vertical integration VI is the act of improving interaction in the vertical organizational dimension, which is illustrated in Figure 54 The vertical organizational dimension.

98
CEO
LOGISTICS 1 LOGISTICS 2 LOGISTICS 3
SALES 1 SALES 2 SALES 3
PURCHASE 1 PURCHASE 2 PURCHASE 3
LOGISTICS 4
SALES 4
PURCHASE 4
PRODUCTION 1 PRODUCTION 2 PRODUCTION 3 PRODUCTION 4
SALES LOGISTICS
PRODUCTION PURCHASE
Figure 56 The vertical organizational dimension.
It is constituted by a number of hierarchical echelons. These echelons can, across all companies, most commonly be divided by level of decision making. The level of decision making can either be strategical, tactical or operational, each belonging to a specific echelon as illustrated Figure 55 Decision making in different echelons.

99
CEO
LOGISTICS 1 LOGISTICS 2 LOGISTICS 3
SALES 1 SALES 2 SALES 3
PURCHASE 1 PURCHASE 2 PURCHASE 3
LOGISTICS 4
SALES 4
PURCHASE 4
PRODUCTION 1 PRODUCTION 2 PRODUCTION 3 PRODUCTION 4
SALES LOGISTICS
PRODUCTION PURCHASE
OPERATIONAL ECHELON
TACTICAL ECHELON
STRATEGICAL ECHELON
Figure 57 Decision making in different echelons.
To sort out on what level of decision making a certain decision belongs to, consider the following example concerning a war:
• Strategical decision making aims to win the war. • Tactical decision making aims to win the battle. • Operational decision making aims to win the combat.
Now consider the analogy with a company competing with its competitors on a market (the war):
• Strategical decision making aims to win the market (by gaining shares, customers and by outcompeting the competition).
• Tactical decision making aims to win against the competition in terms of production, marketing, logistics, quality, etc. respectively.
• Operational decision making aims to win over practical challenges.

100
This parallel is illustrated in Figure 56 Parallel between decision making in a war and a company.
WIN THE MARKET
REDUCING BUFFERS
OPTIMIZING PROCESSES
PRODUCTION
SIGN FAVORABLE
DEALS
REDUCE COSTS
PURCHASE
...
etc...
FIND NEW CUSTOMERS
KEEP OLD CUSTOMERS
SALES
WIN THE WAR
WIN COMBAT
#1.1
WIN COMBAT
#1.2
WIN BATTLE #1
WIN COMBAT
#2.1
WIN COMBAT
#2.2
WIN BATTLE #2
...
etc...
WIN COMBAT
#3.1
WIN COMBAT
#3.2
WIN BATTLE #3
Figure 58 Parallel between decision making in a war and a company.
Moving on to the 4th level under VI in Figure 49 Expanded Definition of Company Integration, the term Inter marks that the interaction under consideration, is the one between (lat. inter) echelons.
5.2.2.2 Expanded definition of horizontal integration HI is the act of improving interaction in the horizontal organizational dimension, which is illustrated in Figure 57 The horizontal organizational dimension.

101
CEO
LOGISTICS 1 LOGISTICS 2 LOGISTICS 3
SALES 1 SALES 2 SALES 3
PURCHASE 1 PURCHASE 2 PURCHASE 3
LOGISTICS 4
SALES 4
PURCHASE 4
PRODUCTION 1 PRODUCTION 2 PRODUCTION 3 PRODUCTION 4
SALES LOGISTICS
PRODUCTION PURCHASE
Figure 59 The horizontal organizational dimension.
As mentioned above, HI concerns interaction between several parties from/within the same function or of the same type in the same echelon. This differentiation appears in the third level under HI in Figure 49 Expanded Definition of Company Integration, where a company either can be departmentally or divisionally organizationally structured. I.e. HI can concern either interaction within the same department, as illustrated in Figure 58, or interaction within the same division, as illustrated in Figure 59, depending on the organizational structure.

102
CEO
LOGISTICS 1 LOGISTICS 2 LOGISTICS 3
SALES 1 SALES 2 SALES 3
PURCHASE 1 PURCHASE 2 PURCHASE 3
LOGISTICS 4
SALES 4
PURCHASE 4
PRODUCTION 1 PRODUCTION 2 PRODUCTION 3 PRODUCTION 4
SALES LOGISTICS
PRODUCTION PURCHASE
ORGANIZATIONAL STRUCTURE =
DEPARTMENTAL
Figure 60 Horizontal interaction within the same department.
CEO
LOGISTICS 1 LOGISTICS 2 LOGISTICS 3
SALES 1 SALES 2 SALES 3
PURCHASE 1 PURCHASE 2 PURCHASE 3
LOGISTICS 4
SALES 4
PURCHASE 4
PRODUCTION 1 PRODUCTION 2 PRODUCTION 3 PRODUCTION 4
DIVISION 2 DIVISION 4
DIVISION 1 DIVISION 3
ORGANIZATIONAL STRUCTURE =DIVISIONAL
Figure 61 Horizontal interaction within the same division.

103
Note that in Figure 59 the horizontal and the cross-functional organizational dimensions have switched places compared to Figure 50.
Concerning the different echelons of a company, the scope for HI decreases the further up the “echelon ladder” one goes. I.e. on the:
• Operational echelon, the scope of HI is large and could for instance (in a departmentally organizationally structured company) encompass interaction between a number of production cells.
• Tactical echelon, the scope of HI is small to non-existent and could for instance (in a departmentally organizationally structured company) encompass interaction between a number of production managers.
• and on the Strategical echelon, the scope of HI is non-existent.
The fact that the interaction occurs within (lat. intra) the same echelon and the same department, alternatively division, gives rise to the classification Intra on the 4th level under HI in Figure 49.
5.2.2.3 Expanded definition of cross-functional integration CFI is the act of improving interaction in the cross-functional organizational dimension as illustrated in Figure 60 The cross-functional organizational dimension.

104
CEO
LOGISTICS 1 LOGISTICS 2 LOGISTICS 3
SALES 1 SALES 2 SALES 3
PURCHASE 1 PURCHASE 2 PURCHASE 3
LOGISTICS 4
SALES 4
PURCHASE 4
PRODUCTION 1 PRODUCTION 2 PRODUCTION 3 PRODUCTION 4
SALES LOGISTICS
PRODUCTION PURCHASE
Figure 62 The cross-functional organizational dimension.
The scope can either regard a company as a whole or a subset of a company e.g. a department or a division, as illustrated in Figure 61.

105
TEAM-MEMBER 1.1
TEAM-MEMBER 1.2
TEAM- LEADER 1
TEAM-MEMBER 2.1
TEAM-MEMBER 2.2
TEAM-LEADER 2
CEO
PRODUCTION PURCHASE LOGISTICSSALES
PRODUCTIONMANAGER
SCOPE=WHOLE COMPANYINTER
SCOPE=DEPARTMENT (DIVISION)INTRA
Figure 63 Scope of cross-functional integration.
Interaction between departments or divisions is denoted by Inter, whilst the interaction inside a department or division is denoted by Intra, in accordance with Figure 49 Expanded Definition of Company Integration.
Case examples of company integration When exemplifying VI, CFI and HI, the figures used as template contains three echelons. Looking across all companies, this is a common and relatable division, with its three different levels of decision making as described 5.2.2.1. Furthermore the case examples discussed, will be based on a departmental organizational structure, see Figure 62 Organizational structure upon which all case examples are based.

106
CEO
LOGISTICS 1 LOGISTICS 2 LOGISTICS 3
SALES 1 SALES 2 SALES 3
PURCHASE 1 PURCHASE 2 PURCHASE 3
LOGISTICS 4
SALES 4
PURCHASE 4
PRODUCTION 1 PRODUCTION 2 PRODUCTION 3 PRODUCTION 4
SALES LOGISTICS
PRODUCTION PURCHASE
Figure 64 Organizational structure upon which all case examples are based.
Note that the figure only exemplifies and must not be considered as a fixed template.
The background scenario for all the case examples is one and the same. It reads as follows:
DCPF is a company that supplies components to the automotive industry. Production is constituted mainly by machining processes and the production batches ranges from 50 to 100 pieces. The production department at DCPF is organized into three functional groups, each with a blue collar group leader. Sales at DCPF is organized with one sales manager that manages a number of account managers (salespersons). Each account manager is responsible for a certain geographical area. No division is done in terms of industry since DCPF only delivers to one industry. The new CEO, with a business degree, has as a part of the company’s new strategy defined a set of new company goals. The goal is to cut costs by 8 % as well as increase sales by 5 %, within the next year.

107
The continuation of the scenario is for each integration type divided into the following three parts:
• CASE 1: Unsuccessful interaction, with regard to the specific dimension. • CASE 2: Successful interaction, with regard to the specific dimension. • SUMMARY: What makes the interaction unsuccessful/successful? How the
company could move from unsuccessful to successful interaction, in other words, integrate with regard to the specific dimension, as illustrated in Figure 63 From unsuccessful to successful interaction.
UNSUCCESSFULINTERACTION
SUCCESSFULINTERACTIONINTEGRATION
STATE STATE
TRANSITION
Figure 65 From unsuccessful to successful interaction.
5.2.3.1 Case example vertical integration CASE 1: After having visited the production floor and gotten a feel for its current situation, the CEO’s specification for how to cut costs in production, reads as follows:
In order to achieve the savings goal of 8 %, production is henceforth to immediately decrease the size of the buffers between operations by 50 %. By doing so the company will bind less capital in WIPs.
Result after a year: The new policy is reluctantly deployed and after a year it has rendered great unevenness in workload between operations. This because the buffer before the bottleneck-operation is the only buffer that is kept down according to the new policy. This has resulted in less work in the upstream operations, which in turn has decreased the overall production rate as well as the OEE in all operations, except for the bottleneck-operation. Needless to say, the goal of saving 8 % is not achieved, instead costs increase by 10 % and the level of dissatisfaction among the production blue collars is at an all-time high.
CASE 2: The CEO sits down with the company’s production managers and some blue collar group leaders to discuss the task at hand. The CEO explains in depth why the savings must be made and says:

108
I realize that this is a difficult task, but I want to challenge you to this. In two weeks we will all meet again for a workshop during an entire day. During these two weeks I want you to separately come up with at least 5 concrete ideas on how to cut costs in production. During the workshop we will then synthesize these ideas into a concrete functional solution which is to be deployed immediately. I urge you to:
• Have an open mind and think outside the box. Do not let your ideas get limited by feasibility. Maybe we can make something unfeasible feasible.
• Seek inspiration from new and perhaps unexpected sources. Ask the operators for ideas, read a book, visit a supplier, ask a university, etc.
• Utilize your different areas of expertise within Lean manufacturing, machining, etc.
• Go and see for yourself. A great idea for production improvements is seldom created in an office.
Since I am in no way a production expert, I need you to do this. My role in this is only to facilitate interaction and creativity.
Having been thoroughly inspired, the production managers and group leaders set off. After two weeks, during the workshop, a combination of inputs from the different hierarchical echelons and skill-sets, gives a solution that is both "outside the box" and feasible. When the CEO asks for feedback for this type of problem solving, the following opinions come up:
• From a blue collar group leader: I was surprised and very inspired to be involved in this process. Previously we have never been involved in this kind of work.
• From one of the production managers: Acquiring inputs from people that are the closest to the actual work has proven to be priceless. I have never gotten more inspiration nor have I ever spent so little time in my office as I have during these past two weeks.
• I find that the synergetic effects from closely collaborating between white and blue collars have been invaluable. Why have we not done this before?
Result after a year: The goal is achieved and surpassed. By keeping the solution flexible and adaptable, it was possible to apply changes and in some cases reiterate parts of the approach. The production managers and the team leaders continued to collaborate to an even greater extent and found new smart solutions along the way.
SUMMARY: Essentially, the interaction is unsuccessful due to people on the strategic echelon (the CEO in this case), trying to make sound operational decisions. A break-down of Case 1 into the bullets presented in 5.2.1, follows below:

109
• The lack of communication is apparent in the way the CEO orders his/her subordinate personnel. The interaction is one-way and without questioning, i.e. it is not done by communicating between involved parties.
• The lack of knowledge is apparent in the solution the CEO presents. Heavily and immediately decreasing buffers in any type of production will cause issues, something the CEO obviously did not know.
• The "I know best"-delusion is apparent in the way that the CEO, who is new to the company, in an almost arrogant way bosses and micromanages all parts of the company that he/she does not know nor understand. As indicated by the results, the CEO did not know best.
• The lack of a holistic perspective is apparent in the way that the CEO sees an opportunity without considering what effects taking the opportunity might have. In this case the opportunity he saw was to decrease buffer levels and hence save money, while the effects actually were decreased production rates and OEEs.
In contrast to Case 1, the CEO in Case 2 knows what his/her role ought to be, i.e. to inspire and build problem solving personnel. Furthermore the CEO states that he/she does not know best and that he/she is not an expert in this field (i.e. not suitable to make operational decisions), hence some serious communication is in order. Finally the CEO in Case 2 manages to utilize the blue collar leaders whilst empowering them, resulting in a win-win situation.
5.2.3.2 Case example horizontal integration CASE 1: One of the outcomes from the workshop in 5.2.3.1 Case 2, was that the buffers between operations were to be continuously incrementally decreased. The blue collar group leaders (all three of them) took this information (without having a discussion) and started to act on it separately with different approaches. Result after a year:
1. Group leader one, with his/her operations being the furthest upstream in manufacturing, had simply removed a fixed amount of pieces from the buffers each month, thus reaching the goal of incrementally decreasing buffer levels.
2. Group leader two, with his/her operations being in the middle of the manufacturing value chain, suffers from operation starvation. I.e. there are not enough WIPs coming from upstream operations to keep the group leader’s operations occupied. He/she does not want his/her OEEs to suffer, so he/she disregards the directives for buffer sizes and instead basically eliminate all buffers by producing in the same rate as before, minus some stand stills due to total starvation.
3. Group leader three, with his/her operations being the furthest downstream in manufacturing and containing the bottleneck operation, is experiencing

110
serious bottleneck starvation. Since the overall production rate is measured by the production rate of the bottleneck operation, the overall production rate decreases. As one might see the decreasing of buffers creates issues that are larger further down the value chain, which commonly is called the bullwhip effect (see glossary).
CASE 2: Having been issued with continuously incrementally decreasing the buffers between operations, in accordance with one of the outcomes from the workshop in 5.2.3.1 Case 2, the three group leaders from production sat down to discuss an implementation plan. During this discussion they managed to conclude the following undisputable fact, namely that changes made anywhere in the value chain will affect the rest of it. Hence the value chain must be considered as one organism and in order for it to work, the three groups have to work together and collaborate to a high extent. However they were uncertain as to how to approach this issue. Then they remembered that one of the production managers from the workshop earlier had mentioned something about "creating pull". Having finally decided that trying to apply theory to manufacturing might not be such a bad idea, the group leaders contacted the production manager with pull expertise. Together they were able to develop a pull model for the company that was not overly complicated, but rather simple and easy to understand. Result after a year: Having been able to closely collaborate and continuously communicate issues has proven to be vital. This because, according to Lean theory, buffer reduction entails discovery of hidden issues. These issues have through the collaboration been dealt with in a sound way and the result after the year was an average buffer reduction of 25 %, without any change in production rate.
SUMMARY: This interaction between the company’s three production groups is horizontal. The interaction becomes unsuccessful when the parties fail to communicate and collaborate. Instead they strive in different directions, not taking each other into consideration. It is like a soccer team, where each player has his/her own perception of where the goal is without passing the ball to anyone. A break-down of Case 1 into the bullets presented in section 5.2.1, follows below:
• The lack of communication is apparent in the way the group leaders dive into the problem separately without any regard of each other. Ignoring to communicate between parties in the same echelon is a prominent example of lack of horizontal integration.
• The lack of knowledge is apparent in the unscientific solutions the group leaders adapt. The solution does not have to entail an overly complex analytical solution with computer simulation and statistical calculations. However it should at least be based and adapted upon some kind of proven theory, something missing in this case.

111
• The "I know best"-delusion is apparent in the way that the group leaders without any apparent uncertainty dives into a problem, convinced that they have the solution. "I know best" must be converted into "We understand". "We", as in all covered by the horizontal task and "understand", as in having a deep understanding of the task and realizing that the optimal solution might not be the first that comes to mind.
• The lack of a holistic perspective is apparent in the way that the group leaders totally disregards the fact that there is ONE value chain and that it needs to work as ONE.
As opposed to Case 1 the group leaders in Case 2 will not rush to any conclusions. They appreciate the challenge and by doing that they realize that the only way to find consensus is to collaborate, communicate and have a scientific approach.
5.2.3.3 Case example cross-functional integration CASE 1: As part of the CEO’s strategic goals was, except for cutting costs by 8 %, to increase sales by 5 %. Achieving this goal, will obviously greatly depend on the actions of the sales department, why they are made owners of this challenge. Sales’ approach to the challenge was to gather all account managers and discuss how they could improve the company’s value proposition toward the customers, hence enabling increased sales. After having synthesized personal experience of customer needs and other sound thinking, they came up with the following ideas that would improve the value proposition:
• Having a well-developed JIT mentality, the automotive industry is very keen on having short lead-times from their suppliers and hence the company will now offer shorter lead-times.
• How low the tolerance of pieces in a car is, is often in direct correlation with the car’s overall quality and performance. Hence the company will now offer a lower tolerance on its products than any of its competitors.
Having established these two bullets as most valuable to the improvement of the value proposition, the account managers include them into their new sales pitch and continues to try to increase sales.
Result after a year: The promises made by the account managers to the customers have caused colossal issues. In production the shorter lead-times and lowered tolerances have resulted in the need for an extra work shift that is just about to be deployed. This in order to compensate for the longer operation times (caused by lowered tolerance) and the production uncertainty (caused by the shorter lead-times). The need for the new work shift is not in any way to increase the production rate, but rather to be able to keep it stable. Furthermore the company’s FGW has been forced to grow in order to cope with the new short lead-times. This in turn has caused an alarming lack of space in the FGW and there are now small FGWs all over the

112
factory. In conclusion, the production costs have increased dramatically. Lastly, sales has dropped as a result of that DCPF has not been able to deliver on their promises. Some customers have even chosen to end their relation with DCPF.
CASE 2: In order to increase sales with 5 %, the account managers, who are all experienced salesmen, realize that they need to somehow change the company’s value proposition toward its customers. To do this they immediately realize that increasing the value proposition by promising customers something that will not be delivered is a very bad idea. Hence the sales department arranges a workshop with representatives from other departments such as production, logistics, IT etc. Together during the workshop the collaboration between the departments are able to find a couple of smart solutions that will increase the value proposition without actually increasing costs. As an example one relatively new account manager, that was not present in Case 1, mentioned that some of his/her customers had pointed out that they cannot understand why DCPF has the same low tolerance on all of their products. Some of the products have unnecessarily low tolerances. From this fact the company was able to review their tolerance policy and adapt the demands depending on the product.
Result after a year: Through the collaboration and communication between the departments, the company was able to implement smart solutions and utilize opportunities without causing any relevant cost increases. Having established the workshop as a success, the representatives from the departments decided to have similar workshops regularly in the future. The goal of increasing sales with 5 % was achieved. Some costs were increased whilst other were decreased leaving the net change in costs to practically 0 %.
SUMMARY: Failing in cross-functional interaction is primarily caused by company ignorance and department-/division egoism. Where these fit in with the general model and a break-down of Case 1 into the bullets presented in 5.2.1, follows below:
• The lack of communication is apparent in the way that the sales department fails to ask other departments if and, if so, how changes in the value proposition will affect them. Not asking whether the changes will negatively affect other departments and/or functions of the company, but only focusing on achieving one owns department’s goals, is egoistic.
• The lack of knowledge is apparent in the way that the sales department evidently has no understanding whatsoever of what their new sales promise/pitch will entail for other parts of the company. Had they only known what the outcome of the new pitch in Case 1 would likely be in a year, they would most probably have gone in a different direction.
• The "I know best"-delusion is apparent in the way that the sales department, naturally with good intentions in mind, goes ahead and decides how the new value proposition, affecting the whole company, must look like.

113
This decision is made without consulting other departments, suggesting that sales lives under the delusion that they are to ultimately decide upon such matters as a new value proposition.
• The lack of a holistic perspective is apparent in the way that the sales department in a department-egoistic manner, totally disregards the fact that changes in the value proposition, will affect other parts of the company.
To be successful in cross-functional interaction, as in Case 2, communication and mutual respect is key. Through cross-functional communication and mutual respect the company can gain integration through:
• Sorting out whether a change is feasible or not and what affects it will likely entail.
• Discovering previously unknown opportunities and potential synergies, that for example could render cost savings.
• Avoid causing frictions between functions that will only worsen company atmosphere.
• Ensuring sound, holistic and realistic decision making.
5.2.3.4 Case example combination integration To some extent, one can argue that all previously mentioned cases of the three different integration types, are combinations of two or all three, even though one of the types has been highly emphasized. This fact is of course true and even more prominent in reality. In reality, cases can to a high extent include two or all three integration types, this is due to the nature of these types of problems. The purpose of each separate case above was solely to exemplify and illustrate cases where one of the integration types was prominent.
Let us, now consider this generic scenario of combination integration:
1. A need/request emerges on the operational echelon in department X. 1. The need/request is passed on to the manager for department X in the tactical
echelon. 2. The manager passes on the need/request to the CEO on the strategical
echelon, who finds it to be reasonable and decides that it is to be fulfilled. 3. New directives are now sent from the strategical- to the tactical-, and finally,
to the operational echelon. 4. Result: Department X is happy with the change. However the other
departments are not, due to complications from the change.
In this case, there is obviously a lack of both CFI and VI, which leads to question: How can a company overcome these kind of problems? The answer to this question follows in 6.2.2 CI Management Tool: Company Integration Model (CIM).

114
Result Chapter 6, Result, constitutes the finalization of the LS and CI tracks. Beginning with chapter 4, Data Compilation, it was possible to attain a thorough understanding of how LS and CI is reacted in reality. By then also achieving information saturation, Data Compilation enabled chapter 5’s Analysis of the tracks. The Analysis, then provided a complete scrutiny of the complexity from Data Compilation in order to find meaning and context of it. Finally, the Result is the summarized output of the master thesis, aiming to answer its Purpose, see 1.3. Furthermore, the Result also provides two useful Management Tools.
Result is hence divided in the following way:
• Achievement of Purpose, provides a summary of the outputs from the Analysis and how this fulfills the master thesis’ Purpose.
• Management Tools, one for LS and one for CI, are direct descendants of their respective tracks and aim to solve problems related to each track.
6.1 Achievement of Purpose As described in 1.3 Purpose, the purpose can be distinctly divided by the two tracks, LS and CI. In this section, each track’s Frame of Question will first be repeated and then answered.
For the LS track, the purpose was to provide a sharp and distinct understanding and embodiment of the companies’ current LS, answering the Frame of Question:
• Question: How are the companies working with Lean implementation and –transformation?
• Answer: As described in chapter 4 Data Compilation, in section 4.1 Compilation of LS, how companies work with Lean is divided and granulated into areas that represent subsets of Lean as a whole. These areas are in turn divided and granulated into categories that describe performance with regard to a specific area. These categories for all areas answers/describes how companies are working with Lean- implementation and transformation.
• Question: How are they failing and/or succeeding in this endeavor? • Answer: The characteristics for each category (see section 4.1 Compilation
of LS) provide the answer to this question. How companies are failing, is commonly constituted by the characteristics of the worse practice categories. How companies are succeeding, is commonly constituted by the characteristics of the better practice categories.
LS

115
• Question: What are the discrepancies between the companies’ implementation/interpretation of Lean and "Lean theory"?
• Answer: These discrepancies are defined and put under scrutiny in chapter 5, Analysis (see section 5.1 Analysis of LS). This where Lean theory’s (best practice) feasibility is compared to constraints in reality (desired practice).
• Question: How companies, within feasibility, could better themselves in terms of Lean?
• Answer: How companies sorted in the worse practice categories can better themselves, is constituted by the characteristics for the better practice categories (see section 4.1 Compilation of LS). How companies sorted in the better practice categories can better themselves, is constituted by the discrepancies between Lean theory (best practice) and better practice (limited by practical constraints) (see section 5.1.2 Lean discrepancies), aiming at a feasible desired practice. In order to identify these discrepancies and to find what category a company currently belongs to, the LS Management Tool (see section 6.2.1), can be used.
For the CI track, the purpose was to provide how CI plays a critical role in a company’s performance with regard to its internal interaction, answering the Frame of Question:
• Question: How are companies interacting internally across organizational dimensions?
• Answer: As described in chapter 4 Data Compilation (see section 4.2 Compilation of CI), all companies are to some extent having issues with internal interaction.
• Question: What are the reasons for failing in this endeavor? • Answer: As described in chapter 5, Analysis (see section 5.2.1 Causes for
failing CI), companies tend to commit the same mistakes without any clear perception of them or how to deal with them.
• Question: How are companies to interact internally, across organizational dimensions, in order to facilitate favorable cooperation and communication (CI)?
• Answer: By avoiding and having awareness of the most prominent causes for failing CI, it can be improved. Furthermore, studying the case examples of bad and good CI, provides insight in how not to do and how to do (see section 5.2 Analysis of CI). Lastly, using the Management Tools for CI (see section 6.2.2) will highlight where and how CI is failing, and how to improve on it.
CI

116
6.2 Management Tools As with all theoretical tools and methodologies related to Lean, they themselves, as a condensed version, only describe actions and in what order these ought to be made. Behind these schematic actions are obviously a lot of material that more thoroughly describe what taking each action actually entails and how it is done properly.
This is also the case for the Management Tools that have been developed as a part of the Result of this master thesis. Below will follow descriptions of the Management Tools’ ultimate goal, purpose, benefit and a schematic description of the actions. In order to fully understand and deploy each action properly, they will refer to some specific piece of material described previously in the master thesis.
These tools have been developed in order to solve common problems. For this master thesis, the problems have been recorded and studied in great detail. It is based on these studies that the tools have been developed with the goal to help solve a reoccurring problem. However, it is important to note that they have not been thoroughly tested on the specific problem, only engineered based on one.
LS management tool: Lean Performance Analysis (LPA)
When a company decides that it is to begin-, reboot- or just diagnose its Lean initiative, it is faced with an enormous challenge, due to it being exceedingly hard to know where to begin. What is common for such challenges, is to somehow determine a current situation, in order to know what the premise for future actions is. To aid in this endeavor, the Management Tool LPA was developed and it reads as follows.
ULTIMATE GOAL: To acquire a diagnosis of a company’s current Lean-performance.
PURPOSE: The purpose of LPA is to streamline the otherwise highly time-consuming process of measuring and defining how a company is performing in terms of all relevant Lean aspects. In addition the purpose is to indicate where and on what efforts should be put.
BENEFIT: The benefits that can be reaped from the ULTIMATE GOAL are:
• Opportunity to gain new insights of a company. What is good vs. what is bad?
• Acts as a basis for new Lean initiatives. What must be improved? What should continue vs. discontinue?
LS

117
DESCRIPTION OF THE STEPS:
The general idea is to quickly find out in which categories (the categories being the subsets of the areas, which in turn are subsets to the four Ps of Lean as described in section 4.1) a company belong to.
1. Below follows statements that are key indicators, indicating the company as either belonging to the worse- or the better practice categories for each specific P. Beginning with finding the statement that best matches the company. This is what indicates the company as either belonging to the worse or the better practice. See Figure 64 Key indicator model.
i. Key Indicator Philosophy: • Lean is constituted by tools and methods, and is organized
as an isolated supportive function => WORSE. • Lean is to change the behavior and culture of the entire
company, and is hence organized as a central function having implications everywhere in the company => BETTER.
ii. Key Indicator Process: • Has a push-mentality with large buffers between
operations. Has no ambition to change behavior and culture. Views Lean as the elimination of defects, unnecessary movement and transportation as well as the deployment of the two Ss, straighten and shine. Everything else with Lean is too complex and can hence not be understood by all employees => WORSE.
• The company strives towards becoming pull and has a scientific approach to eliminating most types of waste. It aims to simplify everything to an extent where everybody understands how they can benefit from Lean => BETTER.
iii. Key Indicator People and Partners: • Lean is an ad hoc function that only concerns blue collars
in production. These blue collars are not interacting with any white collars and are only to do what they are told to do, no more no less => WORSE.
• Lean is company-wide, meaning that it includes every employee. It facilitates open-mindedness and creativity, and knows no borders between blue- and white collars => BETTER.
iv. Key Indicator Problem Solving: • The company views problems as a "necessary evil" that
cannot be stopped, only dealt with when encountered => WORSE.

118
• Solves a problem at its root and deploys measures for preventing future potential problems to occur by utilizing scientific methods => BETTER.
P FROM THE 4P-MODELKEY INDICATOR KEY INDICATOR
WORSE BETTER
Figure 66 Key indicator model.
2. For each of the four Ps’ areas, begin with the category, either the worse or better, as indicated in #1 and analyze if the description matches with the company in reality. This analysis can result in 4 different cases as illustrated in Figure 64 Case i-iv and described below:
i. If the description mostly matches the category indicated in #1 => The company has won the benefits as indicated above.
ii. If the description partly matches the category indicated in #1 => Analyze the other category(-ies) and highlight all bullets that match => The company has won the benefits as indicated above, to the cost of more time.
iii. If the description does not match the category indicated in #1 => Analyze the other category(-ies) and highlight all bullets that match => If the bullets mostly match the other category, #1 was wrong, but
AREA: Case iWORSE
CATEGORYBETTER
CATEGORY
AREA: Case iiWORSE
CATEGORYBETTER
CATEGORY
AREA: Case iiiWORSE
CATEGORYBETTER
CATEGORY
AREA: Case ivWORSE
CATEGORYBETTER
CATEGORY
MATCH MISMATCH
Figure 67 Case i-iv.

119
=> The company has won the benefits as indicated above, to the cost of more time.
iv. If the description does not match any of the area’s categories => Either the research performed on the company is faulty or the tool is simply not applicable.
3. Reiterate #2 for every P’s every area. 4. Having performed all iterations of #2, the streamlined analysis ought to have
provided a diagnosis of the company’s Lean performance (in accordance with the ULTIMATE GOAL), upon which (in accordance with BENEFIT):
i. New insights can be found, such as which Lean gaps that are present, see Figure 26 Level of Implementation.
ii. The company can base future Lean initiatives.
CI management tool: Company Integration Model (CIM)
In order to enable CI, a model, containing a methodology and a tool, has been developed. The model is based on the challenges for CI, as previously described, and on studies of low and high levels of CI. The name and abbreviation of the model is: The Company Integration Model (CIM).
CIM is relevant to use when:
A problem, due to a recent change in the company, has been detected.
Clarification:
• "A problem...": Can be harder to detect than one thinks. People often accept a complicated situation without questioning what might be the cause of the complexity. Hence it is important to always question problems, by e.g. deploying the 5-Why-rule.
• "...recent change...": The word recent is of course relative, but it emphasizes on the importance of dealing with problems as soon as possible. A CI related problem that has been allowed to live for 2 years, is much harder to eliminate than a problem that only surfaced 2 months ago. Whilst the 2-year scenario might include having to change implemented standards, the 2-month scenario might only entail a simple reiteration with small changes. For elimination of issues, as the one from the 2-year scenario, CI might not suffice. A reorganization might be the only solution.
• "...in the company...": Of course there are company problems caused by external factors. However the CIM only applies to solving internal problems.
CI

120
ULTIMATE GOAL: To, in the company, find the origin for different problems related to the lack of CI.
PURPOSE: Companies have in the past and will in the future struggle with getting everybody in the company to avoid creating internal problems. These internal problems are often due to conflicting internal interests, lack of communication and/or lack of collaboration. The purpose of CIM is to illustrate and enable improvement of this bad interaction.
BENEFIT: The benefits that can be reaped from the ULTIMATE GOAL are:
• To find where, in the company, interaction is bad and hence, where integration is needed.
• To stimulate communication, collaboration and integration vertically, cross-functionally and horizontally in the company.
• To help avoid the most prominent causes for failing interaction.
DESCRIPTION OF THE STEPS:
STEP 1 Define your problem: Should answer the question: What problem does my company have that has been caused by change? It is important to handle each problem separately since different problems might stem from different places. Exceptions can be made if one can identify a cluster of closely related problems.
STEP 2 Locate your problem: Using the CIM-template, see appendix 9.2 CIM Template, locate your problem to where it has the biggest and original impact in your organization. See Figure 66 Locate your problem.

121
PROBLEM
STEP 2
Figure 68 Locate your problem.
STEP 3 Investigate, track and plot your problem: Ask: What directive caused this bad change and who/what issued it? Place the answer in the model and start plotting and describing the information flow. Reiterate this process until the source for the problem has been found, as exemplified in Figure 67 Investigate, track and plot your problem. This is essentially to backtrack the problem and illustrate its path.

122
CAUSE
PROBLEM
STEP 3
Figure 69 Investigate, track and plot your problem.
Note that the arrows’ direction describe the flow of the directives that caused the problem. The backtracking begins in the Problem-cube (where the problem occurs) and finishes in the Cause-cube (the problem’s source). The arrows 3.1, 3.2 and 3.3 each need a description, at least answering the questions: What? Why? Who?
STEP 4 Begin integration: Now that the problem is defined and the cause for it has been identified, the real work with integration begins. The difference is that now it is known between which parts of the company that integration is needed.
How to integrate is hard to give a general answer to since this process must be tailored to each unique case. However, some general guidelines are:
• Immediately start collaborating. Establishing ways of collaborating is the first step of CI.
• Avoid the four Causes for Failing Company Integration as described in 5.2.1.

123
• How can I/we become better at communicating? • How can I/we become more knowledgeable of other parts of
my/our company? • Am I/Are we being misguided into believing that I/we know more
than what I/we really do? • Am I/Are we just concerned with my/our part of the company?
In essence, critically review yourself or your part of the company.
• Study other examples of both good and bad integration and learn from both. Visit other companies for inspiration on integration.

124
PART III

125
Discussion This section will, as opposed to the rest of the master thesis, contain personal pronouns. This due to it being more sound reasoning, by the authors, than linear conclusions from proven facts.
This chapter contains:
• Self-Criticism concerned with in what way(s) we might have not fully succeeded in following our Methodology as well as a disclaimer for the Management Tools.
• Personal Reflections and Further Studies, dealing with out-of-scope line-of-thoughts that could be subjects for Further Studies.
7.1 Self-Criticism In order to strengthen the quality of the research and its result, this section will take a critical stance against the chosen methodology and how we have assured quality of the information gathered from it. Furthermore, this section will critically review the potential practical use of the Management Tools described in 6.2 Management Tools.
Methodology criticism As described in chapter 3 Methodology, we thoroughly explored appropriate research methodologies and how they could obtain reliable information. This section will critically review the chosen general research strategy. Furthermore it reviews to what extent the different aspects of achieving trustworthiness and quality of the research, has been achieved.
General
The chosen strategy for the research has been to use a Multiple Case Design with an embedded approach, see section 3.1.3.
• The Multiple Case Design was chosen because it enables the possibility of building theories/perceptions about the studied subject. This has proven to be an excellent choice, since the company visits together have generated enough data to reach valuable insights and conclusions of the current situation. It has also provided us with a strong foundation to establish theories concerning both LS and CI.
• The embedded approach has also proven to be a favorable choice as the case study division into sub-parts has provided valuable insights into details that otherwise could have been overlooked. These detailed insights have made it possible to study how Lean tools and methods will fail if the overall Lean approach is misdirected. Furthermore, the embedded approach has

126
enabled us to find relevant areas of interaction as well as how CI can be used to improve these areas.
In conclusion, the chosen strategy for the research has proven to be favorable. It has provided us with the opportunity to collect data properly and summarize it into something comprehensible. This whilst it also has been possible to acquire detailed insights that would otherwise have been missed if the strategy had had a helicopter perspective.
Achieving credibility, dependability, confirmability and transferability
This section is a critical review of to what extent we have used the means of achieving quality and trustworthiness of the research, as described in section 3.2.
• Achieving Credibility o Prolonged engagement and persistent observation has indubitably
been achieved. The research has been conducted during circa six months (prolonged engagement), during which we have performed 17 case studies (persistent observation).
o Triangulation has been achieved by utilizing the versatile case study design that was created for the master thesis. Furthermore, the methods for compiling data have ensured further triangulation.
o Peer debriefing has been utilized by having our supervisor, Jan-Eric Ståhl, review our work. Furthermore, two master thesis students, at the division of Production and Materials Engineering, have also provided peer debriefing of our work.
• Achieving Dependability and Confirmability o Audit trailing has been performed by continuously checking that the
steps taken, are only taken without bias to what we want the research to result in.
o Reflexivity has been achieved by deploying several means throughout the research. We have regularly held discussions on whether or not the research needs to change due to new circumstances or insights. Also we have continuously reflected on the different methodological choices made, in order to avoid bias in the findings from the choices.
• Achieving Transferability o Thick descriptions has been a major part in the research as a whole.
We have aimed at describing methodologies as well as findings at such a detailed level, that the reader never should find him- or herself uncertain of what we are trying to explain. By doing so, the reader should find it possible to transfer and/or apply our findings to other contexts or situations. This renders a high level of transferability of the master thesis.

127
Management tools not tested in practice As stated in section 6.2, the Management Tools developed in this master thesis has not been tested in practice. Rather than developing the tools and then test them on a problem, these tools have been developed based on a specific problem related to either LS or CI. Hence, the following potential issues might arise when reacting them in reality:
The tools applicability to the problems described: The first issue that might arise, is whether or not the tools will be applicable to the problems that they are developed for. It could be that the tools need adjustments that would only be detected once the tools have been tested in practice. Hence, the tools need further studies before they are to be definitely considered as successful.
The time required vs. potential gains of using the tools: Currently, it is uncertain how much time the tools will require to be used in reality. Furthermore, it is hard to measure the potential gain of obtaining the outputs from the tools. Therefore, it could be questioned whether the tools are to be used in an actual company setting or if they are better utilized as tools for describing LS or CI in a theoretical context.
The tools applicability is highly dependent on the user: Deploying the tools in reality might require a person or persons that have superior abilities when it comes to changing people. This is not an ability gifted to everybody, hence there is a risk that the tools will only be useful for a small set of users.
7.2 Personal Reflections and Further Studies In this section follows a list of topics that are the authors’ Personal Reflections. All of these topics are also potential subjects for Further Studies. These topics have not been fully investigated in the master thesis due its demarcations.
The topics are: • The import/copy of Lean: How Lean was/is being imported/copied from
Japan? • How is LS related to CI and vice versa: How is LS and CI associated?
How can CI facilitate LS?
The import/copy of Lean Lean manufacturing is widely considered to be the next manufacturing generation, succeeding Taylorism (mass production). As mentioned before, Lean’s origin can be traced to Japan in general and the Japanese car manufacturer Toyota in particular. This raises the question: How Lean was/is being imported/copied from Japan?
Importing is most often associated with bringing goods from an external source into one owns jurisdiction. But how does one import/copy something as intangible and intricate as Lean? This question must have been one of the first questions asked by

128
the pioneering manufacturing westerners (Americans and Europeans) that visited, read and studied Lean, and recognized its greatness. Having studied a wide array of Lean theory, as well as how it is being reacted in reality, we dare us to try to answer this question.
Lean theory for westerners by westerners is basically transcribed synthesized observations. The depth and insightfulness of these observations have developed over time. This ability to gain and transcribe in-depth insights of Lean, is dependent of the observer’s ability to comprehend abstractness. Gaining this ability has taken a long time for western observers, it can be described as a process that roughly contain two consecutive phases, where each phase has resulted in distinctly different literature.
THE FIRST PHASE
has a low level of abstractness. Here the observers have observed and transcribed what has been most obvious, namely the tools and methods. These require no deciphering and can essentially be translated into a list of very concrete means of improving manufacturing. These books are typically structured to have a brief introductory part, where Lean is described as a “philosophy” that has to “be lived”. However no effort is put into exploring/explaining how a company is to “live by the Lean philosophy”. This due to it being exceedingly abstract and hence very difficult to describe. Instead the rest of the book systematically goes through and explains different Lean tools/methods and how to use them.
This literature, derived from these observers with a low level of abstractness, is very popular due to it being so concrete and easy to comprehend. This is the reason why this type of literature is adapted by universities, teaching students about Lean, as well as by companies that are new to Lean. The result is people and companies with a “toolbox understanding” of Lean. I.e. people believing that to “be Lean” is simply to implement some of the tools/methods described in this type of literature. These peoples’ and companies’ approach to Lean can be characterized by the inexperienced Lean leader in the second trend under 5.1.1 General trends and conclusions.
THE SECOND PHASE
has a high level of abstractness. These observers have gone through the first phase, tried it out in reality and then slowly, reluctantly and painstakingly concluded that their version of Lean, does not seem to work the way it did in Japan. The majority of these observers gave up Lean, saying that it is embedded in the Japanese culture and hence impossible to copy. However some persisted and continued to study Lean, aiming at truly comprehending its abstractness, i.e. culture, philosophy, etc. This pursuit has resulted in books that severely tone down the importance of Lean tools/methods, simply denoting them as measures to support a Lean journey. Instead focus is put on exploring the “hidden” truths of Lean. These truths are for example

129
how a company can change its employees’ behavior and behavioral patterns in order to facilitate efficient Lean.
Acquiring and describing these truths, with their high level of abstractness, is awfully difficult and time consuming due to them being virtually invisible. Imagine being faced with the task of describing a company’s (Toyota’s) culture and why and how it is successful. To make things even more complex, imagine that you are to do this in a, for you, completely new country with vast cultural differences compared to your home country. Our experience and perception is that the books The Toyota Way (K. Liker, 2004) and Toyota KATA (Rother, 2010), have, at least to our understanding, succeeded in this endeavor.
The result of people and companies that are able to absorb this information and react it in reality, is a holistic and philosophical understanding of Lean. This where people are central, as opposed to tools/methods. These peoples’ and companies’ approach to Lean can be characterized by the experienced Lean leader in the second trend under 5.1.1 General trends and conclusions.
IN CONCLUSION
• The FIRST PHASE in importing/copying Lean from Toyota, went way easier and faster than the SECOND PHASE. Westerners are still struggling with it.
• People and companies that do not deploy Lean in reality, continue to perceive Lean as described in the FIRST PHASE.
• People and companies that deploy Lean in reality, will eventually realize that there is more to it than what is described in the FIRST PHASE. They will then either quit Lean or continue as described in the SECOND PHASE.
• This is a hard topic to study. It could maybe be done by studying the different types of literature and interviewing its authors.
How is LS related to CI and vice versa Even though they have not been tested together, one can speculate how LS and CI would coexist. We believe that CI must be considered as a subset of Lean and not the other way around. This due to the nature of the two, where CI is a concept dealing with some certain issues, whilst Lean is more omnipotent with issues.
Since Lean is all about eliminating waste, we feel that CI fits perfectly as a supplement to Lean, as it actually is a method for eliminating waste. The waste of course being the time wasted when a company fails with its internal interactions: vertically, cross-functionally and horizontally. Whilst the traditional time waste elimination methods/tools tend to focus on a single position in a company, CI will add a new dimension. By deploying CI and CIM we feel that a company’s Lean pursuit will be augmented by:

130
• Finding and eliminating problems across organizational dimensions (time waste).
• Facilitating collaboration that will birth unknown synergies. • Uniting the company into realizing it has to work as one.
Note that these currently only are speculations (with a high probability of being true), hence it would be an excellent topic for Further Studies.
Combination of CI and disturbance chains It does not require any higher level of imagination to realize that there are obvious similarities between CI and disturbance chains. They both aim at plotting the path of different issues, ultimately finding the root cause for it. What differs is the perspective of the problems/causes. Whilst disturbance chains plots a problem’s path between technical and/or organizational causes, CI plots the path between and inside different functions and organizational echelons.
With regard to this fact, i.e. that they are similar but view a problem from different perspectives, it would be interesting to explore how to combine the both. These further studies could for instance aim to answer:
• Which synergies can be reaped from the combination of CI and disturbance chains?
• Can they be integrated into one model, where CI plots the path and disturbance chains categorizes the steps of the path?
• Do these two models (and the combination of them) reflect reality, i.e. are they applicable in a real situation?

131
References Aramburu, N., Sáenz, J. & E. Blanco, C., 2014. Structural capital, innovation capability, and company performance in technology-based colombian firms. [Online] Available at: http://eds.a.ebscohost.com/eds/pdfviewer/pdfviewer?sid=91d24047-dd0b-472e-ad93-322e12f24822%40sessionmgr4002&vid=1&hid=4205 [Använd February 2016].
Berk, E. & Özgür Toy, A., 2009. Quality control chart design under Jidoka. [Online] Available at: http://resolver.ebscohost.com/openurl?sid=EBSCO%3ainh&genre=article&issn=0894069X&ISBN=&volume=56&issue=5&date=20090801&spage=465&pages=465-77&title=Naval+Research+Logistics&atitle=Quality+control+chart+design+under+jidoka&aulast=Berk%2c+E.&id=DOI%3a10.10 [Använd February 2016].
Business Dictonary, 2016. Structural capital. [Online] Available at: http://www.businessdictionary.com/definition/structural-capital.html [Använd February 2016].
C. Pegels, C., 1984. The Toyota production system-Lessons for American management. [Online] Available at: http://www.emeraldinsight.com/doi/pdfplus/10.1108/eb054703 [Använd February 2016].
Carlsson, D. & Fröberg, P., 2015. Photo. u.o.: u.n.
Cox, C. R. & Ullmer, J. M., 2015. Lean Manufacturing: An analysis of process improvement techniques. [Online] Available at: http://eds.b.ebscohost.com/eds/pdfviewer/pdfviewer?sid=b1262938-3f7d-4cbb-adea-2cf8138efc00%40sessionmgr115&vid=1&hid=117 [Använd February 2016].
Crumpton, M. A., 2010. The Bottom Line: The importance of visibility. [Online] Available at: http://www.emeraldinsight.com/doi/pdfplus/10.1108/08880451011104090 [Använd February 2016].
Darawsheh, W., 2014. Reflexivity in research: Promoting rigour, reliability and validity in qualitative research. [Online] Available at: http://eds.a.ebscohost.com/eds/pdfviewer/pdfviewer?sid=4525a6e8-c955-4129-a058-34ec31ca2b1d%40sessionmgr4004&vid=1&hid=4205 [Använd February 2016].

132
Ericsson, J., 1997. Störningsanalys av tillverkningssystem: Ett viktigt verktyg inom Lean production. 1st red. Lund: Lund University.
Gornicki, B., 2014. A better way of production: Small-batch and one-piece-flow. [Online] Available at: http://eds.b.ebscohost.com/eds/detail/detail?sid=6e222ef4-43f3-4a9a-89b9-d4dd9a63b809%40sessionmgr102&vid=1&hid=117&bdata=JnNpdGU9ZWRzLWxpdmUmc2NvcGU9c2l0ZQ%3d%3d#AN=96269154&db=bth [Använd February 2016].
Hulthén, H., 2015. Cross-functional integration, Lund: u.n.
Icym, 2015. Poka-Yoke. [Online] Available at: http://www.icym.edu.my/v13/images/pokayoke_fa931.jpg [Använd February 2016].
Investopedia, 2016. Vertical Integration. [Online] Available at: http://www.investopedia.com/terms/v/verticalintegration.asp [Använd February 2016].
J. Hopp, W. & L. Spearman, M., 2011. Factory Physics. 3rd red. Long Grove: Waveland Press Inc..
K. Liker, J., 2004. The Toyota Way. 1st red. New York: McGraw Hill.
Maleki, M. & Cruz-Machado, V., 2013. A review on supply chain integration: Vertical and functional perspective and integration models. [Online] Available at: http://eds.b.ebscohost.com/eds/pdfviewer/pdfviewer?sid=6d84f8e4-50ec-43f2-a214-ee32615f337a%40sessionmgr102&vid=1&hid=117 [Använd February 2016].
Microsoft Office, 2016. Create a value stream map. [Online] Available at: https://support.office.com/en-us/article/Create-a-value-stream-map-35a09801-999e-4beb-ad4a-3235b3f0eaa3 [Använd February 2016].
Patrocinio, E., 2015. Value Stream Mapping: Operationalizing Lean Manufacturing. [Online] Available at: http://eds.a.ebscohost.com/eds/pdfviewer/pdfviewer?sid=82fc3a90-d7a4-4085-ad79-1242ace4d940%40sessionmgr4003&vid=1&hid=4205 [Använd February 2016].
R. Emery, C., 2009. A cause-effect-cause model for sustaining cross-functional integration. [Online] Available at:

133
http://www.emeraldinsight.com/doi/pdfplus/10.1108/14637150910931488 [Använd February 2016].
Rother, M., 2010. Toyota KATA. 1st red. New York: McGraw Hill.
Rowley, J., 2002. Using case studies in research. [Online] Available at: http://www.emeraldinsight.com/doi/pdfplus/10.1108/01409170210782990 [Använd February 2016].
Sandvik Coromant, 2015. Sandvik Coromant Product news. [Online] Available at: http://productnews.sandvik.coromant.com/us/#start [Använd February 2016].
Sandvik Coromant, 2016. Sandvik Coromant in brief. [Online] Available at: http://www.sandvik.coromant.com/en-us/aboutus/sandvik_coromant_in_brief/pages/default.aspx [Använd February 2016].
Sandvik Coromant, 2016. Tools for metal cutting. [Online] Available at: http://www.sandvik.coromant.com/en-us/products/pages/tools.aspx [Använd February 2016].
Saunders, M. & Tossey, P., 2012. The layers of research design. [Online] Available at: http://www.academia.edu/4107831/The_Layers_of_Research_Design [Använd February 2016].
Scruminc, 2015. Kanban cards. [Online] Available at: https://www.scruminc.com/wp-content/uploads/2011/11/kanbancardfromliker-300x142.jpg [Använd February 2016].
Singh, J. & Singh, H., 2009. Kaizen philosophy: A review of literature. [Online] Available at: http://eds.b.ebscohost.com/eds/pdfviewer/pdfviewer?sid=9badd7a0-1c08-4ecf-8556-6ec9f881465d%40sessionmgr114&vid=1&hid=117 [Använd February 2016].
Ståhl, J.-E., 2012. Industriella Tillverkningssystem del II. 2nd red. Lund: Lunds Universitet.
Ståhl, J.-E., 2015. Development of Manufacturing Systems. 1st red. Lund: Lunds Universitet.
Ståhl, J.-E., 2015. Vertically Integrated Production, Lund: u.n.
V, C., N, R. P. & S, I. K., 2007. Simple kanban technique for better inventory management. [Online]

134
Available at: http://eds.a.ebscohost.com/eds/pdfviewer/pdfviewer?sid=e1ca55f3-98e5-4709-9685-f9bc2f67d2df%40sessionmgr4002&vid=1&hid=4205 [Använd February 2016].
Welotec, 2016. Products. [Online] Available at: http://www.welotec-solutions.com/wp-content/uploads/2014/04/andon.jpg [Använd February 2016].
Wikipedia, 2014. Wikipedia Sandvik Coromant logo. [Online] Available at: https://en.wikipedia.org/wiki/File:Sandvik_Coromant_Logo.png [Använd February 2016].
Wikipedia, 2015. Traditional lighting equipment of Japan. [Online] Available at: Traditional lighting equipment of Japan [Använd February 2016].
Xsource, 2016. Five Ideas to Improve Your Office Productivity. [Online] Available at: http://xsource.com.au/five-ideas-to-improve-your-office-productivity/ [Använd February 2016].

135
Appendices 9.1 Factory Visit Report and Questionnaire About the company ‘Logotype’
Company name Factory name Location Number of employees Products Production layout E.g. functional Production processes with SC tools E.g. turning and milling Contacts
First impressions Short list of the initial thoughts about the company and the visit e.g.:
• Large amounts of structural data. • Strong internal knowledge about Lean.
Observations
Different observations, categorized under the different principles (see section 2.1.3 The 14 principles of Lean):
• Waste (P-Multi). • One-piece-flow (P2). • Push or pull (Kanban) (P3). • Leveling? Heijunka (P4). • Standardization (P6). • Andon/built in quality/visual control (P7). • 5S (P7). • Employee empowerment/grow leaders (P9-10). • Manufacturing involvement by management, Genchi Genbutsu (P12).
Notes
Notes taken during the introduction and the factory walkthrough, can be a mix of observations, discussions, answers to questions and explanations, e.g.:
• Uses Andon screens for visualization. • No FGW, only MTO.

136
• Floor markings. • Yellow=an area no forklifts allowed. • Orange= incoming goods. • Green= outgoing goods. • Blue= WIP and stuff that belongs to the specific station.
Questionnaire QandA Answer to the questionnaire, which is used in the final part of the company visit.
General Questions
1. What is Lean to you except the tools? (Detect how deep the knowledge is of Lean)
2. For how long have you been implementing Lean? 3. Do you think/feel that your company will have to implement Lean in order
to survive/compete in the long run? 4. What is the opinion of management and shareholders? 5. What expectations/deliverables do your stakeholders (shareholders,
managers etc.) have/expect? (short- or long-term view) a. Time horizon for this?
6. Do you work with changing behavior and if so, how? (improvement kata) 7. Do you have any mentoring/coaching initiatives? (coaching kata)
a. If yes, how is it done and who are involved?
Answers
Why, how and where do you use Lean and if you do not, why not? Questions
1. Do you have a systematic approach to a problem? (e.g. "Station 5 has 10 % more scraps than any other station, why?")
2. Are you ever truly satisfied with how a process is operating? (Example: Do you challenge an operation even though it is running smoothly e.g. remove buffer inventory or Kanban cards?)
a. If no, how do you improve a process that is already running smoothly?
3. What is your general philosophy when dimensioning inventories between processes? (show must go on philosophy or learning by mistake)

137
4. Do you produce according to a specific predetermined sequence or do you have planning tools/software that plans production based on incoming orders? (Heijunka)
5. Do you measure overcapacity and if so, how? (OEE or Lean? Takt?) 6. Does a piece always go through a predetermined sequence of machines or
could its machines downstream in the value chain differ? (In order to do VSM)
7. Do you have any quality assurance measures in your production? (Poka Yoke and Andon)
8. Are you using any other process development tools than Lean? (E.g. Six Sigma, SandOP, TQM etc.)
a. Is there any specific reason for this (complementing Lean)? b. How successful have you been?
Answers
What Lean tools do you use?
Questions
1. Could you list the Lean tools you are currently using? 2. Which of these do you feel is more or less important in your work with
Lean?
Answers
How successful have you been?
Questions
1. How would you describe your success in implementing Lean? 2. Do you have any specific numbers on the performance improvements?
Answers
What kind of challenges do you encounter?
Questions
1. Where have the majority of your challenges been encountered? (Management, employees, knowledge, complexity, implementation etc.)
2. What has these challenges been? 3. Which challenges has been most problematic?
Answers

138
Which parts of the organization are involved?
Questions
1. How are other parts of the organization working with Lean? (Horizontally) 2. What is the general opinion of the Lean initiatives?
a. Shareholders. b. Management. c. Employees.
3. Where is the production manager’s office located in relation to the "floor"? (genchi genbutsu)
4. How often do the production managers visit the "floor"?
Answers
How do you see machining in relation to Lean?
Questions
1. Machining is often at the core of the value adding activities, how do you see Lean being an important tool in relation to machining?
Answers
How do you look at a machining tool suppliers, like SC, in relation to Lean?
Questions
2. When approached by SCs sellers how do you perceive their intentions? 3. What are the main selection criteria for your suppliers? (price, quality,
efficiency, reliability etc.) 4. How are other factors like rebates affecting your supplier selection? 5. Has this recently changed (e.g. has quality been replaced with better prices
etc.)? 6. Would you say that your suppliers plays a critical role in improving your
work with Lean (work, operations)? 7. Has your supplier strategy changed since you started your Lean
implementation effort? a. If yes, how?
8. How do you feel that your cutting tool suppliers needs to develop to meet your demands?
Answers

139
What kind of support do you need?
Questions
1. Are you using any consultancy services in your lean implementation effort? a. (if yes)Are you experiencing that these service providers has a good
enough understanding of your processes (machining)? b. (if no) Why do you not use external consultancy services?
2. Do you feel like you want to go deeper in your lean efforts but lack specific know-how on how to do so?
3. Which SC services do you use? 4. If none, why?
Answers
Education
Questions 1. How are you working with educating your employees within Lean and/or
other improvement initiatives?
Answers
Tools/methods Different Lean tools and methods used by the company, includes a description of the method/tool, the pros or cons of the method/tool and other info about the method/tool.
Description
Pros
Cons
Other
Recommendations
Recommendations about what the company might do to "improve" their Lean implementation effort.

140
9.2 CIM Template
Figure 70 CIM template to be used in Step 2 for the CI Management tool.

141
Index
5S, 19 5-Why, 22 A3-report, 20 Abstract & complicated, 62 Achieving credibility, 41 Achieving dependability &
confirmability, 41 Achieving transferability, 42 Acquired Additional Material, 34 Andon, 18 Approach to Lean, 38 Area, 46 Balanced scorecard, 20 Best practice, 84 Blue- & white collar cooperation, 69 Bottom-up, 66 Bridging ambition, 70 BSC, 20 Categories, 46 Causes for failing CI, 92 CFI, 26 Coaching kata, 14 Common sense of waste, 56 Company Integration, 1, 24 Continuous improvement, 71 Cross-functional Integration, 26 Cultural differences, 91 Culture strategy, 50 Defects, 8 Deployment, 39 Desired practice, 84 Disturbance chains, 23 Embedded approach, 32 Employee empowerment, 67 Excess inventory, 8 Expanded sense of waste, 57 Factory Visit, 34 Factory Walkthrough, 33 Firefighting, 71 Genchi Genbutsu, 11 Hansei, 11 Heijunka, 9
Holistic approach, 32 Humans = Machines, 67 Humans = People, 68 Improvement kata, 13 Information saturation, 76 Integration, 25 Interaction, 25 Interpretivism, 29 Japanese Lake, 16 Jidoka, 20 JIT, 20 Just In Time, 20 Kaizen, 17 Kanban, 17 kanban cards, 17 Katas, 12 Key performance indicators, 20 KPI, 20 Lean, 6 Lean as a central function, 53 Lean as a supportive function, 51 Lean change management, 65 Lean discrepancies, 83 Lean gaps, 39 Lean Situation, 1 Lean strategy, 49 Lean transformation, 1 Level of pull, 54 List of companies, 36 Measurement, 39 Methodology, 70 Methods & tools, 57 Mixed method complex, 30 Mixed method simple, 30 Model for compilation of CI, 40 Model for compilation of LS, 37 Monomethod qualitative, 29 Monomethod quantitative, 29 MTO & MTS, 55 Multimethod qualitative, 29 Multimethod quantitative, 29 Multiple Case Design, 32

142
No bridging ambition, 69 No scientific & standardized
approach, 71 Observations, 34 One-piece-flow, 16 Only MTO, 55 Organization, 51 Organizational causes for
disturbance, 23 Overprocessing or incorrect
processing, 8 Overproduction, 8 PDCA-cycle, 13 People & partners, 65 People & Partners, 7 Philosophy, 7, 49 Poka-Yoke, 18 Positivism, 29 Pragmatism, 29 Presentations and Interviews, 34 Problem solving, 70 Problem Solving, 7 Process, 7, 54 pull, 9, 17 Push, 54 Realism, 29 Research Methodological Choice, 29 Research Philosophy, 29 Research Process, 43 Research Strategy, 30 Research techniques & procedures, 33 Sandvik Coromant, 1 Scientific & standardized approach to
firefighting, 71 Scientific & standardized approach to
firefighting & continuous improvement, 72
Simple & straightforward, 63 Simplification & visualization, 61 Single Case Design, 32 SMED, 22 Status boards, 20 Structural capital, 39 Structural Capital, 27 Tailored case study, 33 Technical causes for disturbance,
23 The "I know best"-delusion, 93 The 4P model, 6 The 5S site, 58 The autonomous site, 60 The lack of a holistic perspective, 93 The lack of communication, 92 The lack of knowledge, 92 The Research Onion Model, 28 The toolbox site, 59 The two katas, 12 The word kata, 13 Time horizon, 32 Toolbox strategy, 49 Top-down, 66 Tracks, V Unnecessary movement, 8 Unnecessary transport or
conveyance, 8 Unused employee creativity, 8 Value stream mapping, 15 Vertical Integration, 25 VI, 25 Visual control, 17 VSM, 15 Waiting, 8 Waste, 7, 56
