lean, green and resilient practices influence on supply
TRANSCRIPT
ORIGINAL PAPER
Lean, green and resilient practices influence on supply chainperformance: interpretive structural modeling approach
K. Govindan • S. G. Azevedo • H. Carvalho •
V. Cruz-Machado
Received: 6 August 2012 / Revised: 19 August 2013 / Accepted: 22 October 2013 / Published online: 16 November 2013
� Islamic Azad University (IAU) 2013
Abstract Nowadays, companies are struggling to find
an appropriate supply chain strategy to achieve compet-
itiveness. Among the available strategies lean, green and
resilient are considered as a new management strategies
for the supply chain management to achieve competi-
tiveness. The major issues with theses strategies are the
integration and identification of critical issues related to
the strategies. This paper aims to identify the critical
lean, green and resilient practices on which top man-
agement should focus in order to improve the perfor-
mance of automotive supply chains. The systematic
analysis of the lean, green and resilient practices is
expected to be of great value for their effective imple-
mentation by the automotive companies. The interpretive
structural modeling approach is used as a useful meth-
odology to identify inter-relationships among lean, green
and resilient practices and supply chain performance and
to classify them according to their driving or dependence
power. According to this research, the practices with the
main driving power are just-in-time (lean practice),
flexible transportation (resilient practice) and
environmentally friendly packaging (green practice).
Customer satisfaction is the performance measure with
strong dependence and weak driving power; that is, it is
strongly influenced by the other researched variables but
does not affect them.
Keywords Lean � Green � Resilient � Supply chain
performance � Interpretive structural modeling �Automotive supply chain
Introduction
Supply chain management is considered as a strategic
factor for increasing organizational effectiveness and better
attainment of organizational goals such as enhanced com-
petitiveness, better customer service and increased profit-
ability (Gunasekaran et al. 2001). Among the various
supply chain management paradigms, the lean, green and
resilient are considered critical to supply chain competi-
tiveness and success (Carvalho et al. 2010, 2011; Azevedo
et al. 2010).
Many organizations throughout the world are using the
lean principles and methods to reduce costs, improve
product quality and increase customer responsiveness.
Lean paradigm strives to identify and eliminate all non-
value-added activities, or waste, involved in any kind of
business process (Anand and Kodali 2008). Organiza-
tions, however, do not necessarily integrate environ-
mental concerns into the implementation of lean
paradigm. Research on organizational experience with
lean and green paradigms suggests that while lean and
green have different drivers and approaches, they can be
compatible and even synergistic systems. Lean paradigm
can add value to green efforts by reducing many types of
K. Govindan (&)
Department of Business and Economics, University of Southern
Denmark, Odense, Denmark
e-mail: [email protected]
S. G. Azevedo
Department of Business and Economics, University of Beira
Interior, Polo IV, Edifıcio Ernesto Cruz, 6200-209 Covilha,
Portugal
H. Carvalho � V. Cruz-Machado
UNIDEMI, Departamento de Engenharia Mecanica e Industrial,
Faculdade de Ciencias e Tecnologia, FCT, Universidade Nova
de Lisboa, Campus Universitario, 2829-516 Caparica, Portugal
123
Int. J. Environ. Sci. Technol. (2015) 12:15–34
DOI 10.1007/s13762-013-0409-7
environmental impacts, connecting green practices to
stronger financial drivers and improving the effectiveness
of green procedures (Tice et al. 2005). Environmental
wastes and risks are not explicitly included in the wastes
targeted by lean. However, lean practices contribute to
reduce some of these environmental impacts because of
their intrinsic focus on waste elimination (Tice et al.
2005). There is evidence that many organisations tend to
seek out low-cost solutions. This is because the pressure
on margins may have led to leaner but also made supply
chains more vulnerable (Azevedo et al. 2008). In a global
economy, with supply chains crossing several countries
and continents, the risk of critical and unexpected events
is higher; this can create large-scale disruptions. These
disruptions are propagated throughout the supply chain,
causing severe and negative effects in all partners (Zsi-
disin et al. 2005). It seems that what can be good, from
the competitive point of view, can cause a disaster in
crisis situations; organizations must be resilient and
robust to sustain their competitiveness (Carvalho et al.
2012).
From the literature review, it is clear that most of the
researches have focused on studying individual para-
digms in supply chain management with the focus on
lean or green or resilience (Anand and Kodali 2008;
Hong et al. 2009; Glickman and White 2006) or on the
integration of only a couple of them, e.g., lean versus
green (Kainuma and Tawara 2006) or resilience versus
green (Rosic et al. 2009; Azevedo et al. 2013a).
Although studies on simultaneous integration of lean,
green and resilient paradigms in supply chain manage-
ment are unknown, they are considered crucial to help
supply chains to become more efficient, streamlined and
sustainable (Carvalho et al. 2011). This work intends to
fulfill the research gap that exists on this topic and to
improve the knowledge as regards the simultaneous
influence of lean, green and resilient paradigms on supply
chain performance.
Based on the research gap, this study aims to address the
following issues: (1) identify the critical lean, green and
resilient practices affecting automotive supply chain per-
formance; (2) evolve a hierarchical relationship among
lean, green and resilient practices and supply chain per-
formance measures, their driving powers, and dependence;
(3) synthesis of a conceptual interpretive structural model
(ISM) of lean, green and resilient, and performance mea-
sures for automotive supply chain.
The paper is organized as follows. After the introduc-
tion, a brief review of literature concerned to lean, green
and resilient paradigms is presented; then, the ISM
approach is described and after that the main results are
highlighted and discussed. Finally, conclusions are drawn.
Review of literature
In this section, the review is classified into following areas
such as review of lean, green and resilient supply chain
management paradigms highlighting their synergies and
divergences. The literature reviewed follows a purposive
sample of articles, i.e., the literature included in this study
was based on central and pivotal articles published in the
academic journals in the field.
Lean management approach, developed by Ohno (1988)
at Toyota Motor Corporation in Japan, forms the basis of
the Toyota Production System with two main pillars:
‘‘autonomation’’ and ‘‘just-in-time’’ (JIT) production. The
focus of lean paradigm has essentially been on the waste
reduction used for increasing actual value adding activities,
to fulfill customer needs and maintaining profits. Reichhart
and Holweg (2007) had extended the concept of lean
production to the downstream or distribution level: ‘‘we
define lean distribution as minimizing waste in the down-
stream supply chain, while making the right product
available to the end customer at the right time and loca-
tion’’. To Vonderembse et al. (2006), a lean supply chain is
the one that employs continuous improvement efforts that
focus on eliminating waste or non-value steps along the
chain. The internal manufacturing efficiency and setup
time reduction are the enablers of the economic production
of small quantities, cost reduction, profitability and man-
ufacturing flexibility (Vonderembse et al. 2006).
Green supply chain management has emerged as an
organizational philosophy to achieve corporate profit and
market share objectives by reducing environmental risks
and impacts while improving the ecological efficiency of
these organizations and their partners (Zhu et al. 2008a,
b; Rao and Holt 2005). Several factors lead firms to
pursue green supply chain practices in a global context,
including common global environmental standards such
as ISO 14000 (Rondinelli and Berry 2000; Miles and
Russell 1997), policies from corporate headquarters
(Hanson et al. 2004), effects of environmental perfor-
mance on organizations’s global reputations (Christmann
1998), cost reduction (Zhu et al. 2005; Brito et al. 2008),
and pressures from stakeholders (Zhu et al. 2008a, b,
Christmann and Taylor 2001) and competitors (Walker
et al. 2008). To improve the sustainability and competi-
tiveness of supply chains, it is necessary to integrate
environmental management practices into the entire
supply chain (Zhu et al. 2005; Linton et al. 2007). Sri-
vastava (2007) referred that green supply chain man-
agement can reduce the ecological impact of industrial
activity without sacrificing quality, cost, reliability, per-
formance or energy utilization efficiency, meeting envi-
ronmental regulations to not only minimizing ecological
16 Int. J. Environ. Sci. Technol. (2015) 12:15–34
123
damage, but also leading to overall economic profit. The
green supply chain management practices should cover
all the supply chain activities, from green purchasing to
integrate life cycle management, through the manufac-
turers and customers and closing the loop with reverse
logistics (Zhu et al. 2005). According to Bowen et al.
(2002), green supply practices include: (1) greening the
supply process—representing adaptations to supplier or
management activities, including collaboration with sup-
pliers to eliminate packaging and implementing recycling
initiatives; (2) product-based green supply—managing the
by-products of supplied inputs such as packing; (3)
advanced green supply—proactive approaches such as the
use of environmental criteria in risk sharing, evaluation
of buyer performance and joint clean technology pro-
grams with suppliers.
Today’s marketplace is characterized by higher levels
of turbulence and volatility. As a result, supply chains
are more vulnerable to disruptions and, in consequence,
the risk of business continuity has increased (Azevedo
et al. 2008). Whereas in the past, the principal objective
in supply chain design was cost minimization or service
optimization, and the emphasis today has to be upon
resilience (Tang 2006). Resilient supply chains may not
be the lowest-cost supply chains, but they are more
capable of coping with the business environment uncer-
tainty. Resilience refers to the ability of the supply chain
to cope with unexpected disturbances. In supply chain
systems, the objective is to react efficiently to the neg-
ative effects of disturbances (which could be more or less
severe) (Zobel 2011). The aim of the resilient strategies
has two manifolds (Haimes 2006): (1) to recover the
desired values of the states of a system that has been
disturbed, within an acceptable time period and at an
acceptable cost; and (2) to reduce the effectiveness of the
disturbance by changing the level of the effectiveness of
a potential threat. Tang (2006) proposes the use of robust
supply chain strategies based on (1) postponement; (2)
strategic stock; (3) flexible supply base; (4) make-and-
buy trade-off; (5) economic supply incentives; (6) flexi-
ble transportation; (7) revenue management; (8) dynamic
assortment planning; and (9) silent product rollover.
Christopher and Peck (2004) propose the following
principles to design resilient supply chains: (1) selecting
supply chain strategies that keep several options open;
(2) re-examining the ‘‘efficiency versus redundancy’’
trade-off; (3) developing collaborative working; (4)
developing visibility; (5) improving supply chain velocity
and acceleration. Iakovou et al. (2007) refer the follow-
ing resilient interventions: (1) flexible sourcing; (2)
demand-based management; (3) strategic emergency
stock; (4) total supply chain visibility; and (5) process
and knowledge backup.
There is no agree upon a definition of lean, green or
resilient paradigm in the supply chain, and formulations for
the overall purpose of each paradigm and respective
management practices are divergent (Pettersen 2009; Sri-
vastava; 2007; Ponomarov and Holcomb 2009). Formu-
lating a definition that captures all dimensions of lean,
green and resilience supply chain management paradigms
is challenging. Carvalho et al. (2011) provide a useful
comparison of lean, green and resilient paradigms.
According to these authors, each paradigm follows the
following purpose: (1) Lean—looks for cost reduction and
flexibility, for already available products, through contin-
uous elimination of waste or non-value added activities
across the chain. (2) Green—focuses on sustainable
development, this is in the reduction in ecological impacts
on industrial activity. (3) Resilient—is related to the sys-
tem’ ability to return to its original state or to a new, more
desirable, after experiencing a disturbance, and avoiding
the occurrence of failure modes. Attending to the literature
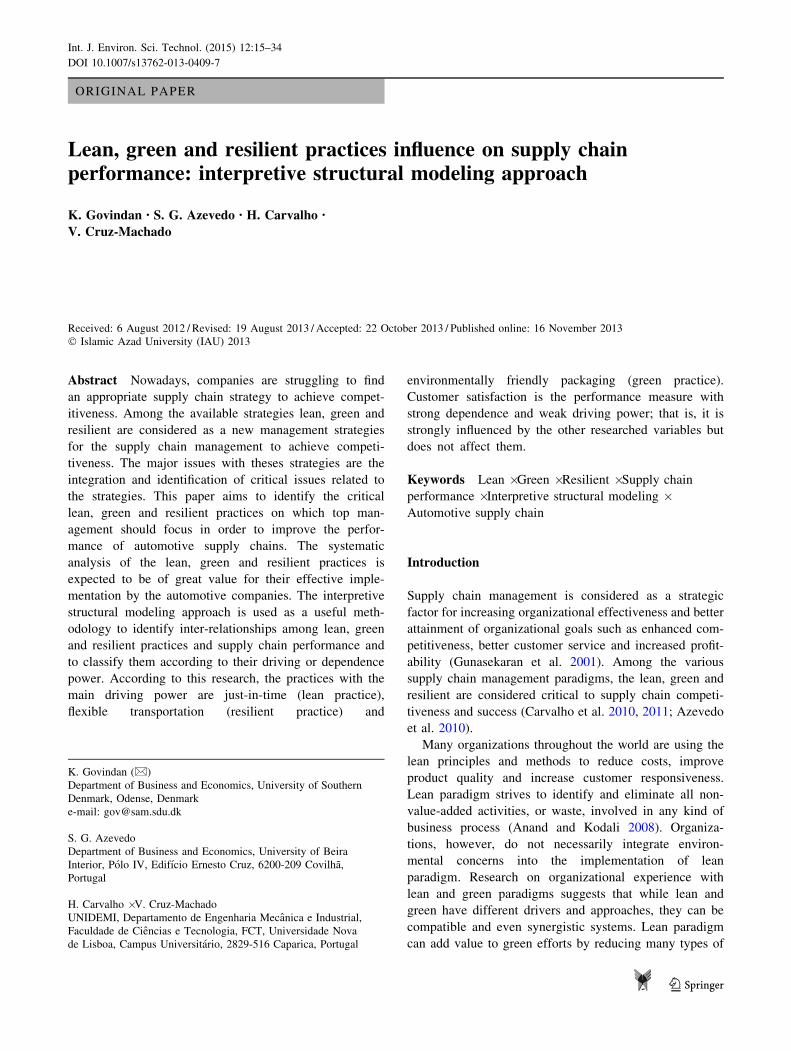
review, the Fig. 1 illustrates a summing up of the main
characteristics of the lean, green and resilient paradigms
with their joint positive influence on supply chain
performance.
LEAN
GREEN RESILIENT
Strategic stockFlexible transportation
ISO 14001 certificationEnvironmentally friendly packaging
Just-in-timeTotal quality management
Increase inventory levels
Decrease inventorylevels
Decrease energy consumption
Increase energyconsumption
Reduce materialwastage and resource
consumption
Waste reductionMantain the
material flow
Increase fuel consumption
Improve supplychain performance
Fig. 1 Lean, green and resilient
main characteristics and their
influence on SC performance
Int. J. Environ. Sci. Technol. (2015) 12:15–34 17
123
In literature, it is possible to find an extensive set of
practices associated with these paradigms and also some
works on the comparison between them, namely green and
resilient practices (Carvalho et al. 2012); lean, green and
resilient practices (Carvalho et al. 2011); and lean and
green practices (Carvalho et al. 2010). Table 1 contains the
paradigms characterization considering four dimensions:
manufacturing focus, alliances with suppliers and cus-
tomers, organizational structure, and materials manage-
ment, in addition the practices associated with each one of
these dimensions.
Cabral et al. (2012) argue that there are synergies and
divergences between the lean, green and resilient para-
digms. Carvalho et al. (2011) argue that the implementa-
tion of these paradigms in the supply chain creates
synergies promoting improvements on ‘‘information fre-
quency’’, ‘‘integration level’’, ‘‘production lead-time’’ and
‘‘transportation lead-time’’. However, they found some
apparent divergences in the paradigms deployment, namely
in what is concerned to the ‘‘capacity surplus’’, ‘‘replen-
ishment frequency’’ and ‘‘inventory level’’. For example,
the presence of strategic inventory, which reduces the
companies’ vulnerability to unexpected events that may
interrupt materials supply, could hide the causes of a bad
supply chain performance and generate material obsoles-
cence; for that reason, the lean and green paradigms pre-
scribe the minimization of inventory levels.
In a recent study, Carvalho and Cruz-Machado (2014)
verify that in companies belonging to different automo-
tive supply chain echelon presented different behaviors:
(1) the manufacturer is more lean, while the first-tier
suppliers deploy resilient practices with higher imple-
mentation degree, being more resilient; (2) all companies
present a similar green behavior. This suggests that, in a
supply chain context, not all companies need to have a
higher implementation score for all paradigms practices:
some companies can be more resilient than others; and
the same happens with the lean paradigm not all com-
panies in a supply chain need to be totally lean.
Therefore, supply chains, and respective companies, can
comprise various degrees of lean, green and resilient
behaviors.
The definition of lean, green and resilient constructs also
must take in consideration the practices interaction. One
example of these interactions is concerned with the practice
lead-time reduction (resilient) which is promoted by the
JIT practice (lean) but could reduce the practice energy
consumption (green) since it demands higher fuel cost from
urgent transportation utilization. The following constructs
and respective variables (practices) are proposed for the
automotive supply chain as defined in Table 2:
• Lean paradigm: JIT and total quality management
(TQM) programs.
Table 1 Lean, green and resilient supply chain paradigms characterization
Paradigms Lean Green Resilient
Dimensions
Manufacturing
focus
Objective: High average utilization
rate
Practices: Just-in-time
Pull flow
Objective: Eco efficiency and waste
reduction
Practices: Reduce energy consumption
Minimize waste and pollution emissions
Objective: Improve flexibility and
build capacity redundancies
Practices: Lead-time reduction
Strategic disposition of additional
capacity
Alliances with
suppliers and
customers
Objective: Long-term partnerships and
joint ventures at the operational level
Practices: Supplier relationships/long-
term business relationships
Customer relationship programs
Objective: Transfer or/and disseminate
green knowledge
Practices: Environmental collaboration
with suppliers and customers
Environmental monitoring of suppliers
Objective: Develop security
practices and share knowledge
Practices: Creating total supply
chain visibility
Flexible supply base/flexible
sourcing
Organizational
structure
Objective: Improve process and
product quality
Practices: Total quality management
(TQM) programs
Objective: Environmental management
system
Practices: ISO 14001 certification
Objective: Risk management
culture
Practices: Risk management
programs
Materials
management
Objective: Streamline material flow
Practices: Lot-size reduction
Inventory minimization
Objective: Reduce material wastage and
resource consumption along the supply
chain
Practices: Reuse/recycling materials
Environmentally friendly packaging
Reverse logistics
Objective: Maintain the material
flow after a disturbance
occurrence
Practices: Strategic stock
Flexible transportation
18 Int. J. Environ. Sci. Technol. (2015) 12:15–34
123
• Green paradigm: ISO 14001 certification and environ-
mentally friendly packaging.
• Resilient paradigm: Strategic stock and flexible
transportation.
The lean, green and resilient paradigms are deployed
with the intention of improving supply chain and company’
performance. The choice of the appropriate set of perfor-
mance measures to be part of a supply chain performance
measure system is not a trivial task (Azevedo et al. 2013b).
In this study, to define the construct ‘‘supply chain per-
formance,’’ the introduction of complex relationships
among performance measures was avoided. Only autono-
mous performance measures (i.e., measures having a weak
influence on others performance measures) were consid-
ered. According to Azevedo et al. (2013b), these measures
are operational costs, business wastage, environmental
costs, customer satisfaction and delivery time. To assure
the validity of the construct ‘‘supply chain performance’’,
the performance measure ‘‘customer satisfaction’’ was
considered being defined in the following way: the degree
to which customers are satisfied with the product and/or
service received along the supply chain. A satisfied cus-
tomer will repeat the purchases of the goods or services;
therefore, it is a measure of the company’s competitive-
ness. Since in the supply chain context, each company must
satisfy the demand of next level, this measure is not related
exclusively to the end consumer but with all customers
along the supply chain. It includes several dimensions such
as after-sales service efficiency, rates of customer com-
plaints, stock-out ratio, quality, cost and delivery; therefore
is related to the measure delivery time proposed by Az-
evedo et al. (2013b).
Table 2 Variables considered in the case study
Constructs Variable Clarification
Lean Just-in-time A production scheduling concept that calls for all raw materials, work in process and finished
goods to be available precisely when needed. It promotes the use of minimal inventories of raw
materials, work in process and finished goods. Therefore, it is expected to reduce the inventory
levels, quality and throughput levels (Kannan and Tan 2005)
TQM An integrative organization-wide approach focused on continuous improvement. It is associated
with higher levels of product quality; it is a driver for customer satisfaction and improves
efficiency in organization’s operations function (Kannan and Tan 2005)
Green ISO 14001 certification A systematic approach to reduce organization’s environmental impacts. In supply chain context,
it can act indirectly to influence all partners to adopt more environmentally friendly practices. It
promotes the reduction in resource usage and waste reduction, and contributes to quality
improvement (Nawrocka et al. 2009)
Environmentally
friendly packaging
The term is used in the broader sense to include reusable, returnable, degradable or easy to
recycle packing materials (boxes, bags, pallets, racks, containers, among others). It is expected
that the application of environmentally friendly packaging initiatives will reduce environmental
costs and business waste (Huang and Matthews 2008) while improving customer satisfaction
(Nair and Menon 2008)
Resilient Strategic stock It is used as buffers between demand fluctuating and/or product variety and smooth production
output (Naylor et al. 1999). It increases materials availability reducing the stock-out ratio and
improvements in service level are expected (Jeffery et al. 2008)
Flexible transportation It comprises the rapid change of transport mode, multimodal transportation or use of multiple
routes. It ensures a continuous flow of materials and sustains supply chain performance in case
of disruptions (Rosic et al. 2009; Tang 2006)
Supply chain
performance
Operational cost It is related to the expenses of running a business; it includes production costs, transportation
costs and inventory holding costs, among others. It is an important aid to making judgments and
decisions, because its purpose is to evaluate, control and improve operational processes (Jeffery
et al. 2008)
Business wastage It is used in its broader sense including typical lean wastages, e.g., effects in products, excessive
inventory, excessive lead-time, excessive scrap, excessive transportation (Singh et al. 2010) and
also solid and liquid wastes, percentage of materials remanufactured, recycled and re-used,
hazardous and toxic material output
Environmental cost It is crucial to have information about environmental practice’s costs to scrap/rework
(Christiansen et al. 2003), disposal (Tsai and Hung 2009) and purchasing environmentally
friendly materials (Zhu et al. 2005), certification, among others
Customer satisfaction The degree to which customers along the supply chain are satisfied with the product and/or
service received, (Beamon 1999). It includes after-sales service efficiency, rates of customer
complaints, stock-out ratio, delivery time, among others indicators.
Int. J. Environ. Sci. Technol. (2015) 12:15–34 19
123
Considering these arguments, the supply chain perfor-
mance construct is composed by four measures as defined
in Table 2: operational costs, business wastage, environ-
mental costs and customer satisfaction.
Attending to the literature review and the research gap,
the identification of the relationships between lean, green
and resilient practices and supply chain performance is
critical to a better understanding of the main characteristics
of supply chain performance.
Keeping in mind the literature review and also the main
characteristics of the automotive supply chain, the
addressed research questions are as follows:
• Which practices deployed by the automotive supply
chain are most important to it be considered as lean,
green and resilient?
• Which measures are considered most important to
assess the influence of lean, green and resilient
practices on the automotive supply chain performance?
• What relationships are there between lean, green and
resilient practices and supply chain performance in the
automotive supply chain?
Materials and methods
The ISM approach is used to identify the relationships
between lean, green and resilient practices and also supply
chain performance measures. This methodology was cho-
sen because it supports the identification of the main
relationships among specific variables, which define a
problem or an issue (Charan et al. 2008; Sage 1977). It
allows in the identification of the main research variables,
and also it can act as a tool for imposing order and direc-
tion on the complexity of relationships among variables
(Kannan and Haq 2007).
The ISM approach was first proposed by Warfield in
1973 (Warfield 1974a, b; Sage 1977) to analyze the com-
plex socioeconomic systems. ISM is a graph-theoretic
method that belongs to the causal mapping family of
approaches. It can be used to address problems that are
complex and subjective. The ISM approach is useful when
a multilevel research design is required and where the
outcome of the research cannot be predicted based on
available research (Klein and Kozlowski 2000). Its basic
idea is to use expert’s practical experience and knowledge
to decompose a complicated system into several sub-sys-
tems (elements) and construct a multilevel structural model
(Anantatmula and Kanungo 2005; Warfield 1976).
ISM can also be used for identifying and the summa-
rizing relationships among specific variables, which defines
a problem or an issue (Sage 1977; Warfield 1974a, b). It
provides a means by which order can be imposed on the
complexity of such variables Mandal and Deshmukh 1994;
Jharkharia and Shankar 2004). This section deals with the
discussion of ISM methodology. The ISM approach has
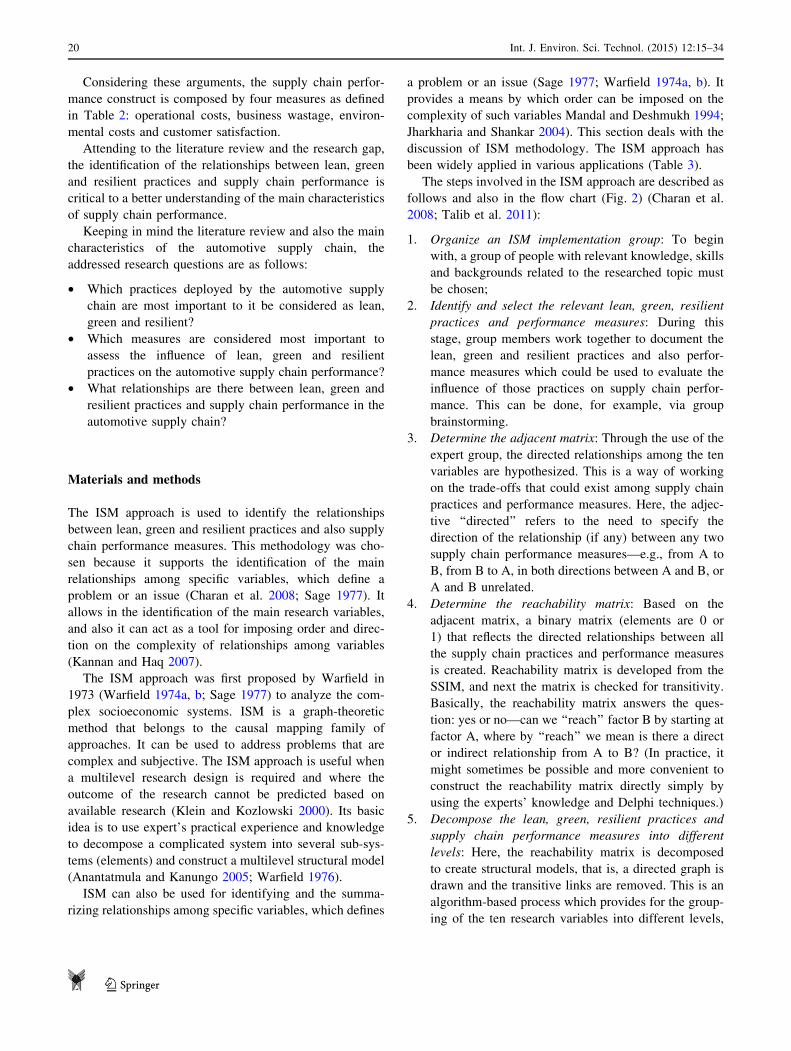
been widely applied in various applications (Table 3).
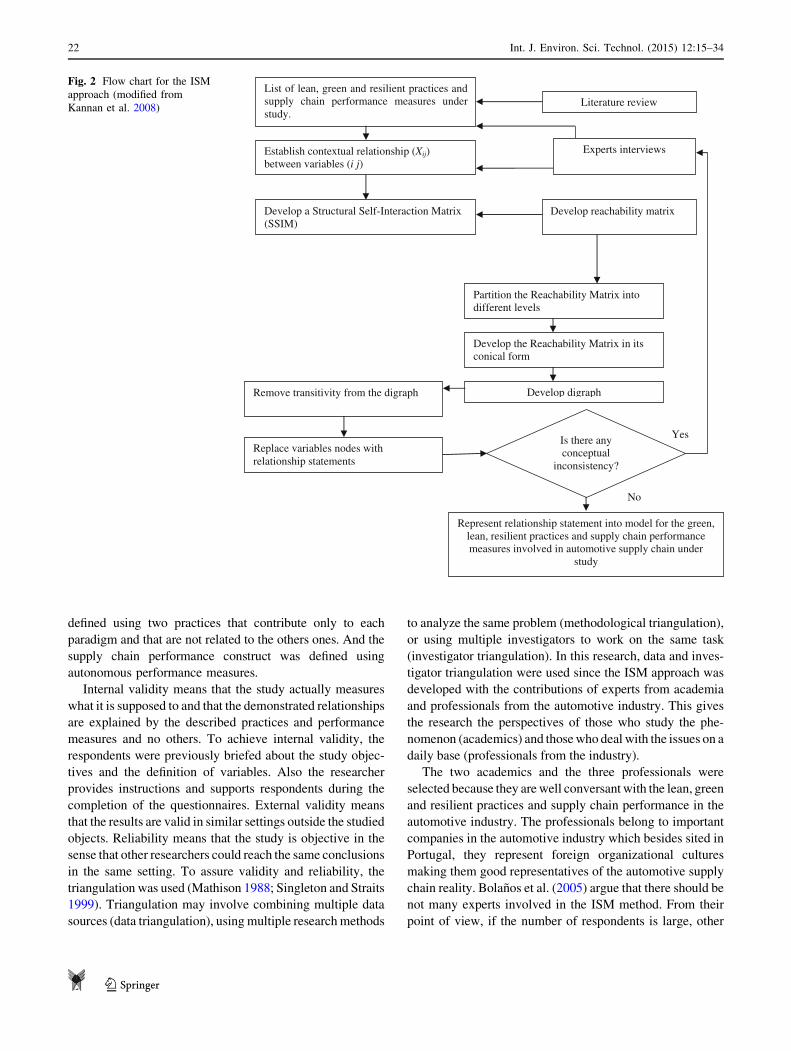
The steps involved in the ISM approach are described as
follows and also in the flow chart (Fig. 2) (Charan et al.
2008; Talib et al. 2011):
1. Organize an ISM implementation group: To begin
with, a group of people with relevant knowledge, skills
and backgrounds related to the researched topic must
be chosen;
2. Identify and select the relevant lean, green, resilient
practices and performance measures: During this
stage, group members work together to document the
lean, green and resilient practices and also perfor-
mance measures which could be used to evaluate the
influence of those practices on supply chain perfor-
mance. This can be done, for example, via group
brainstorming.
3. Determine the adjacent matrix: Through the use of the
expert group, the directed relationships among the ten
variables are hypothesized. This is a way of working
on the trade-offs that could exist among supply chain
practices and performance measures. Here, the adjec-
tive ‘‘directed’’ refers to the need to specify the
direction of the relationship (if any) between any two
supply chain performance measures—e.g., from A to
B, from B to A, in both directions between A and B, or
A and B unrelated.
4. Determine the reachability matrix: Based on the
adjacent matrix, a binary matrix (elements are 0 or
1) that reflects the directed relationships between all
the supply chain practices and performance measures
is created. Reachability matrix is developed from the
SSIM, and next the matrix is checked for transitivity.
Basically, the reachability matrix answers the ques-
tion: yes or no—can we ‘‘reach’’ factor B by starting at
factor A, where by ‘‘reach’’ we mean is there a direct
or indirect relationship from A to B? (In practice, it
might sometimes be possible and more convenient to
construct the reachability matrix directly simply by
using the experts’ knowledge and Delphi techniques.)
5. Decompose the lean, green, resilient practices and
supply chain performance measures into different
levels: Here, the reachability matrix is decomposed
to create structural models, that is, a directed graph is
drawn and the transitive links are removed. This is an
algorithm-based process which provides for the group-
ing of the ten research variables into different levels,
20 Int. J. Environ. Sci. Technol. (2015) 12:15–34
123
depending upon their interrelationships. This provides
a multilevel ISM model in which the relationships
among variables are clarified.
The ISM approach suggests the use of the expert opin-
ions, using some management techniques such as brain
storming or nominal group techniques, to develop the
contextual relationships among the variables (Kannan et al.
2010). To collect data about the relationships between lean,
green and resilient practices, and supply chain performance
measures, a questionnaire was administered to each expert
(section ‘‘Appendix’’). Initially, the study objective was
presented and each variable meaning clarified to the panel
of experts. This step provides the necessary support to
ensure that the respondent concentrated on the direct
relationships between each pair of performance measures.
The written opinions of experts were taken separately, to
avoid possible influence of one expert over another. In a
subsequent phase, the answers were combined, analyzed
and convergence identified in the relationships. The results
were then discussed with the experts and a final matrix was
achieved reflecting the experts’ consensus on their
judgement.
Construct validity, internal validity, external validity and
reliability are important issues in overall research design and
hence in the overall effectiveness of a research study (Yin
2002; Voss et al. 2002). Construct validity means that the
operational measures used to translate the constructs actually
measures the concepts that they are meant to measure. To
guaranty, the construct validity is necessary to assure (Car-
mines and Zeller 1979): (1) convergent validity—means that
multiple items of a construct are related; (2) discriminant
validity—assesses the extent to which the individual items
of a construct are unique and do not measure any other
constructs. The proposed lean, green and resilient practices
and supply chain performance measures were derived from
the literature review in the area of supply chain management
and performance measurement systems in the automotive
industry. To guaranty construct validity, each paradigm is
Table 3 Applications of ISM approach
Year Author Application
1975 Hawthorne and Sage
(1975)
Higher-education program planning
1977 Sage (1977) Modeling on complex situations presented by large systems
1980 Jedlicka and Mayer
(1980)
Exploring factors involved in a cross-cultural context
1992 Saxena et al. (1992) Determining the hierarchy and class of elements in cement industry
1993 Mandal and Deshmukh
(1994)
Vendor selection in supply chain
1999 Kanungo et al. (1999) To develop an information system effectiveness framework
2004 Ravi and Shankar
(2004)
Barriers of reverse logistics
2005 Jharkharia and Shankar
(2004)
Enablers of IT implementation in supply chain
2005 Ravi et al. (2005) Identifying key reverse logistic variables
2006 Faisal et al. (2006) Modeling the enablers for supply chain risk mitigation
2006 Sahney et al. (2006) Identifying the set of minimum design characteristics/quality components that meet the requirements of the
students as an important customer in institutions offering professional courses
2007 Thakkar et al. (2007) Integrated approach with ISM and ANP to develop a balanced score card
2008 Thakkar et al. (2008) A mathematical solution based on interpretive structural modeling and graph theory matrix to determine the
supply chain relationship index.
2009 Pandey and Garg
(2009)
Identifying the key supply chain variables, on which the practitioner should focus, to make supply chains of
manufacturing enterprises more agile
2010 Manoharan et al.
(2010)
Analyzing inter-relationships among performance appraisal factors to design and plan a training program for
employees
2010 Kannan et al. (2010) Identifying and ranking the criteria used for the supplier development
2011 Talib et al. (2011) Analysing interactions among the barriers to total quality management (TQM) implementation in organisations
2012 Kannan et al. (2012) Third party reverse logistics provider selection
2013 Mathiyazhagan et al.
(2013)
Barrier analysis for green supply chain management implementation
Int. J. Environ. Sci. Technol. (2015) 12:15–34 21
123
defined using two practices that contribute only to each
paradigm and that are not related to the others ones. And the
supply chain performance construct was defined using
autonomous performance measures.
Internal validity means that the study actually measures
what it is supposed to and that the demonstrated relationships
are explained by the described practices and performance
measures and no others. To achieve internal validity, the
respondents were previously briefed about the study objec-
tives and the definition of variables. Also the researcher
provides instructions and supports respondents during the
completion of the questionnaires. External validity means
that the results are valid in similar settings outside the studied
objects. Reliability means that the study is objective in the
sense that other researchers could reach the same conclusions
in the same setting. To assure validity and reliability, the
triangulation was used (Mathison 1988; Singleton and Straits
1999). Triangulation may involve combining multiple data
sources (data triangulation), using multiple research methods
to analyze the same problem (methodological triangulation),
or using multiple investigators to work on the same task
(investigator triangulation). In this research, data and inves-
tigator triangulation were used since the ISM approach was
developed with the contributions of experts from academia
and professionals from the automotive industry. This gives
the research the perspectives of those who study the phe-
nomenon (academics) and those who deal with the issues on a
daily base (professionals from the industry).
The two academics and the three professionals were
selected because they are well conversant with the lean, green
and resilient practices and supply chain performance in the
automotive industry. The professionals belong to important
companies in the automotive industry which besides sited in
Portugal, they represent foreign organizational cultures
making them good representatives of the automotive supply
chain reality. Bolanos et al. (2005) argue that there should be
not many experts involved in the ISM method. From their
point of view, if the number of respondents is large, other
List of lean, green and resilient practices and supply chain performance measures under study.
Establish contextual relationship (Xij) between variables (i j)
Literature review
Experts interviews
Develop reachability matrix
Remove transitivity from the digraph Develop digraph
Develop the Reachability Matrix in its conical form
Partition the Reachability Matrix into different levels
Develop a Structural Self-Interaction Matrix (SSIM)
Replace variables nodes with relationship statements
Represent relationship statement into model for the green, lean, resilient practices and supply chain performance measures involved in automotive supply chain under
study
Is there any conceptual
inconsistency?
Yes
No
Fig. 2 Flow chart for the ISM
approach (modified from
Kannan et al. 2008)
22 Int. J. Environ. Sci. Technol. (2015) 12:15–34
123

methodologies are required to compute distances between
pairs of structures, or agreements on the distance and char-
acteristics of relations, leading to the identification of clusters
of respondents with substantial shared knowledge with the
analysis becoming much more complex. The panel members’
profiles are described in Table 4.
The following ten variables to study the influence of
lean, green and resilient practices on supply chain perfor-
mance were considered:
1. JIT
2. Total quality management (TQM)
3. Strategic stock
4. Flexible transportation
5. Environmentally friendly packaging
6. ISO 14001
7. Operational cost
8. Business wastage
9. Environmental cost
10. Customer satisfaction
Results and discussion
In this section, the interactions between lean, green and
resilient paradigms and supply chain performance are
identified for the Portuguese automotive supply chain. This
paper focuses the companies belonging to the automotive
supply chain which are situated in Portugal. The automo-
tive supply chain was chosen because of its importance for
the Portuguese economy. The automotive industry in Por-
tugal has 40 years of tradition and presents an annual
turnover of around 4.8 billion euros and delivering about
170,000 passenger cars, light and heavy commercial
vehicles, per year. This industry is a center pillar of the
Portuguese economy representing 4 % of the total GDP
(Gross Domestic Product) and mobilizes a workforce of
about 40,000 people and is one of the main exporting
Portuguese sectors (AICEP 2013). Also the automotive
supply chain seems to be the most developed in terms of
environmental issues and sustainability and it is also more
vulnerable to supply chain disruptions. The automotive
industry experiences great expectations from customers
and society concerning environmental performance, as its
products are by nature resource-burning products (Thun
and Muller 2010). Moreover, it is also under pressure to
become more sustainable and, therefore, more environ-
mentally friendly while achieving the expected economic
benefits from a more greening behavior (Koplin et al.
2007). Also, the tendency of many automotive companies
to seek out low-cost solutions may have led to leaner but
also more vulnerable supply chains (Svensson 2000; Az-
evedo et al. 2008).
Ta
ble
4P
rofi
leo
fp
rofe
ssio
nal
san
dac
adem
ics
Pro
du
ctL
ines
Po
siti
on
inth
esu
pp
lych
ain
Co
mp
any
size
(em
plo
yee
s)In
terv
iew
ed
Pro
fess
ion
als
Co
mp
any
1C
arF
oca
lco
mp
any
(au
tom
aker
)3
,20
7S
up
ply
chai
nan
aly
st
Co
mp
any
2S
eats
Fir
st-t
ier
sup
pli
er1
30
Qu
alit
yen
gin
eer
Co
mp
any
3A
uto
rad
ios
and
air
con
dit
ion
erfr
on
tp
anel
sS
eco
nd
-tie
rsu
pp
lier
80
0Q
ual
ity
eng
inee
r
Ex
per
ien
ceE
xp
erti
seA
ffili
atio
n
Aca
dem
ics
Aca
dem
ic1
18
Yea
rsM
emb
ero
fa
rese
arch
pro
ject
on
lean
,ag
ile,
resi
lien
tan
dg
reen
SC
Min
the
auto
mo
tiv
esu
pp
lych
ain
Un
iver
sity
of
Bei
raIn
teri
or
Aca
dem
ic2
12
Yea
rsR
esil
ien
tan
dg
reen
SC
Min
auto
mo
tiv
eco
mp
anie
sU
niv
ersi
tyN
ov
ad
eL
isb
oa,
FC
T
Int. J. Environ. Sci. Technol. (2015) 12:15–34 23
123

Structural self-interaction matrix (SSIM)
ISM methodology suggests the use of the expert opinions
based on some management techniques such as brain-
storming, nominal technique, among others, in developing
the contextual relationship among the variables (Talib et al.
2011). For analyzing all the variables, the contextual
relationship of ‘‘leads to’’ type is chosen.
This means that one variable leads to another variable.
Based on this, contextual relationship between the vari-
ables is developed. Keeping in mind the contextual rela-
tionship for each variable, the existence of a relation
between any two variables (i and j) and the associated
direction of the relation is questioned. Four symbols are
used to denote the direction of the relationship between the
variables (i and j):
Table 5 Structural self-interaction matrix, Initial and Final Reachability Matrix
Variables 10 9 8 7 6 5 4 3 2 1
(a): Structural self-interaction matrix—SSIM
1. Just-in-time V V V X O A X A V
2. Total quality management V V V A X O A A
3. Strategic stock V O A A O O V
4. Flexible transportation V V V V O A
5. Environmentally friendly packaging O V V A X
6. ISO 14001 V X V A
7. Operational cost O A X
8. Business wastage O X
9. Environmental cost V
10. Customer satisfaction
Variables 1 2 3 4 5 6 7 8 9 10
(b): Initial reachability matrix
1. Just-in-time 1 1 0 1 0 0 1 1 1 1
2. Total quality management 0 1 0 0 0 1 0 1 1 1
3. Strategic stock 1 1 1 1 0 0 0 0 0 1
4. Flexible transportation 1 1 0 1 0 0 1 1 1 1
5. Environmentally friendly packaging 1 0 0 1 1 1 0 1 1 0
6. ISO 14001 0 1 0 0 1 1 0 1 1 1
7. Operational cost 1 1 1 0 1 1 1 1 0 0
8. Business wastage 0 0 1 0 0 0 1 1 1 0
9. Environmental cost 0 0 0 0 0 1 1 1 1 1
10. Customer satisfaction 0 0 0 0 0 0 0 0 0 1
Variables 1 2 3 4 5 6 7 8 9 10 Driving power
(c): Final reachability matrix
1. Just-in-time 1 1 1 1 1 1 1 1 1 1 10
2. Total quality management 0 1 1 0 1 1 1 1 1 1 8
3. Strategic stock 1 1 1 1 0 1 1 1 1 1 9
4. Flexible transportation 1 1 1 1 1 1 1 1 1 1 10
5. Environmentally friendly packaging 1 1 1 1 1 1 1 1 1 1 10
6. ISO 14001 1 1 1 1 1 1 1 1 1 1 10
7. Operational cost 1 1 1 1 1 1 1 1 1 1 10
8. Business wastage 1 1 1 1 1 1 1 1 1 1 10
9. Environmental cost 1 1 1 0 1 1 1 1 1 1 9
10. Customer satisfaction 0 0 0 0 0 0 0 0 0 1 1
Dependence power 8 9 9 7 8 9 9 9 9 10
24 Int. J. Environ. Sci. Technol. (2015) 12:15–34
123
• V—variable i will help to achieve variable j;
• A—variable j will be achieved by variable i;
• X—variable i and j will help to achieve each other; and
• O—variable i and j are unrelated.
The following would explain the use of the symbols V,
A, X and O in SSIM (Table 5a):
• Variable 1 helps achieve variable 10. This means that
as the level of ‘‘just-in-time’’ deployment increases, it
increases the ‘‘customer satisfaction’’. Thus, the rela-
tionship between variable 1 and 10 is denoted by ‘‘V’’
in the Table 5a.
• Variable 2 can be achieved by variable 7, i.e., variable
2, namely ‘‘total quality management’’ would help
achieve variable 7 ‘‘operational costs’’. Total quality
management would improve the operational costs.
Thus, the relationship between these variables is
denoted by ‘‘A’’ in the Table 5a.
• Variable 6 and 9 help achieve each other. Variable 6, namely
‘‘ISO 14001’’, and variable 4, namely ‘‘environmental cost’’,
help achieve each other. Thus, the relationship between these
variables is denoted by ‘‘X’’ in the Table 5a.
• No relationship exists between ‘‘strategic stock’’ (var-
iable 3) and ‘‘environmental cost’’ (variable 9), and
hence, the relationship between these variables is
denoted by ‘‘O’’ in the Table 5a.
Based on similar contextual relationships, the SSIM is
developed for all the ten variables associated with the lean,
green and resilient supply chain management practices and
also supply chain performance measures (Table 5a).
Reachability matrix
The SSIM is transformed into a binary matrix, called the
initial reachability matrix by substituting V, A, X and O by
1 and 0 as per the case. The rules for the substitution of 1’s
and 0’s are the following:
• If the (i, j) entry in the SSIM is V, then the (i, j) entry in
the reachability matrix becomes 1 and the (j, i) entry
becomes 0.
• If the (i, j) entry in the SSIM is A, then the (i, j) entry in
the reachability matrix becomes 0 and the (j, i) entry
becomes 1.
• If the (i, j) entry in the SSIM is X, then the (i, j) entry in
the reachability matrix becomes 1 and the (j, i) entry
becomes 1.
• If the (i, j) entry in the SSIM is O, then the (i, j) entry in
the reachability matrix becomes 0 and the (j, i) entry
also becomes 0.
Following these rules, initial reachability matrix for the
variables is shown in Table 5b. The final reachability
matrix is obtained by incorporating the transitivities as
enumerated in Step 4 of the ISM methodology.
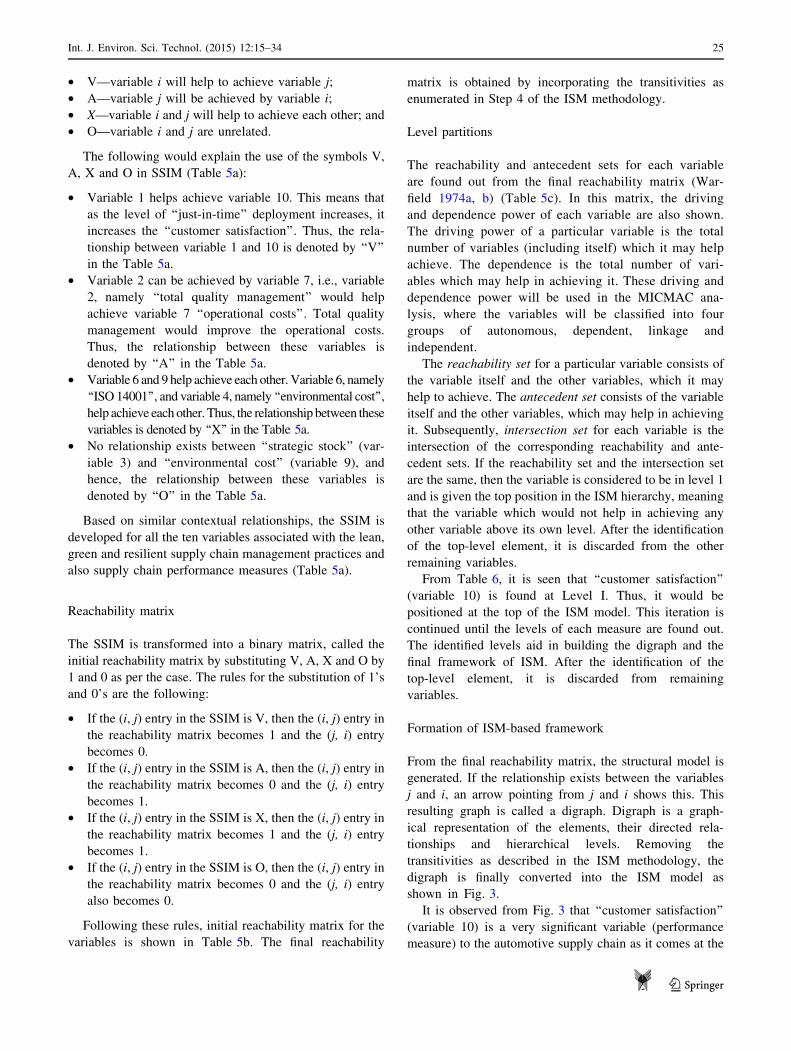
Level partitions
The reachability and antecedent sets for each variable
are found out from the final reachability matrix (War-
field 1974a, b) (Table 5c). In this matrix, the driving
and dependence power of each variable are also shown.
The driving power of a particular variable is the total
number of variables (including itself) which it may help
achieve. The dependence is the total number of vari-
ables which may help in achieving it. These driving and
dependence power will be used in the MICMAC ana-
lysis, where the variables will be classified into four
groups of autonomous, dependent, linkage and
independent.
The reachability set for a particular variable consists of
the variable itself and the other variables, which it may
help to achieve. The antecedent set consists of the variable
itself and the other variables, which may help in achieving
it. Subsequently, intersection set for each variable is the
intersection of the corresponding reachability and ante-
cedent sets. If the reachability set and the intersection set
are the same, then the variable is considered to be in level 1
and is given the top position in the ISM hierarchy, meaning
that the variable which would not help in achieving any
other variable above its own level. After the identification
of the top-level element, it is discarded from the other
remaining variables.
From Table 6, it is seen that ‘‘customer satisfaction’’
(variable 10) is found at Level I. Thus, it would be
positioned at the top of the ISM model. This iteration is
continued until the levels of each measure are found out.
The identified levels aid in building the digraph and the
final framework of ISM. After the identification of the
top-level element, it is discarded from remaining
variables.
Formation of ISM-based framework
From the final reachability matrix, the structural model is
generated. If the relationship exists between the variables
j and i, an arrow pointing from j and i shows this. This
resulting graph is called a digraph. Digraph is a graph-
ical representation of the elements, their directed rela-
tionships and hierarchical levels. Removing the
transitivities as described in the ISM methodology, the
digraph is finally converted into the ISM model as
shown in Fig. 3.
It is observed from Fig. 3 that ‘‘customer satisfaction’’
(variable 10) is a very significant variable (performance
measure) to the automotive supply chain as it comes at the
Int. J. Environ. Sci. Technol. (2015) 12:15–34 25
123
top of the ISM hierarchy. Customer satisfaction is the
performance measure on which the competitiveness of
automotive supply chain depends.
The ISM model also suggests that ‘‘just-in-time’’,
‘‘flexible transportation’’ and ‘‘environmentally friendly
packaging’’ are very significant practices for the
automotive supply chains as they come as the base of
the ISM hierarchy. The ‘‘total quality management’’,
‘‘strategic stock’’, ‘‘ISO 14001’’, ‘‘operational cost’’,
‘‘business wastage’’ and ‘‘environmental cost’’ lead to
‘‘customer satisfaction’’ and are practices and perfor-
mance measures on which the leanness, greenness and
Table 6 Partition of reachability matrix
Variable Reachability set Antecedent set Intersection Level
Interaction 1
1. Just-in-time 1,2,3,4,5,6,7,8,9,10 1,3,4,5,6,7,8,9 1,3,4,5,6,7,8,9
2. Total quality management 2,3,5,6,7,8,9,10 1,2,3,4,5,6,7,8,9 2,3,5,6,7,8,9
3. Strategic stock 1,2,3,4,6,7,8,9,10 1,2,3,4,5,6,7,8,9 1,2,3,4,6,7,8,9
4. Flexible transportation 1,2,3,4,5,6,7,8,9,10 1,3,4,5,6,7,8 1,3,4,5,6,7,8
5. Environmentally friendly packaging 1,2,3,4,5,6,7,8,9,10 1,2,4,5,6,7,8,9 1,2,3,4,5,6,7,8,9
6. ISO 14001 1,2,3,4,5,6,7,8,9,10 1,2,3,4,5,6,7,8,9 1,2,3,4,5,6,7,8,9
7. Operational cost 1,2,3,4,5,6,7,8,9,10 1,2,3,4,5,6,7,8,9, 1,2,3,4,5,6,7,8,9
8. Business wastage 1,2,3,4,5,6,7,8,9,10 1,2,3,4,5,6,7,8,9, 1,2,3,4,5,6,7,8,9
9. Environmental cost 1,2,3,5,6,7,8,9,10 1,2,3,4,5,6,7,8,9, 1,2,3,5,6,7,8,9
10. Customer satisfaction 10 1,2,3,4,5,6,7,8,9,10 10 I
Interaction 2
1. Just-in-time 1,2,3,4,5,6,7,8,9 1,3,4,5,6,7,8,9 1,3,4,5,6,7,8,9
2. Total quality management 2,3,5,6,7,8,9 1,2,3,4,5,6,7,8,9 2,3,5,6,7,8,9 II
3. Strategic stock 1,2,3,4,6,7,8,9 1,2,3,4,5,6,7,8,9 1,2,3,4,6,7,8,9 II
4. Flexible transportation 1,2,3,4,5,6,7,8,9 1,3,4,5,6,7,8 1,3,4,5,6,7,8
5. Environmentally friendly packaging 1,2,3,4,5,6,7,8,9 1,2,4,5,6,7,8,9 1,2,4,5,6,7,8,9
6. ISO 14001 1,2,3,4,5,6,7,8,9 1,2,3,4,5,6,7,8,9 1,2,3,4,5,6,7,8,9 II
7. Operational cost 1,2,3,4,5,6,7,8,9 1,2,3,4,5,6,7,8,9 1,2,3,4,5,6,7,8,9 II
8. Business wastage 1,2,3,4,5,6,7,8,9 1,2,3,4,5,6,7,8,9 1,2,3,4,5,6,7,8,9 II
9. Environmental cost 1,2,3,5,6,7,8,9 1,2,3,4,5,6,7,8,9 1,2,3,5,6,7,8,9 II
Interaction 3
1. Just-in-time 1,4,5 1,4,5 1,4,5 III
4. Flexible transportation 1,4,5 1,4,5 1,4,5 III
5. Environmentally friendly packaging 1,4,5 1,4,5 1,4,5 III
2.Total quality management
3.Strategic stock
1. Just in time
8. Flexible transportation
5. Environmentally friendly-packaging
10. Customer satisfaction
6. ISO14001
7. Operational cost
8. Business wastage
9. Environmental cost
Fig. 3 Final digraph depicting the relationships among variables
26 Int. J. Environ. Sci. Technol. (2015) 12:15–34
123
resilience of automotive supply chains depend. These
variables have appeared at the middle level of the
hierarchy.
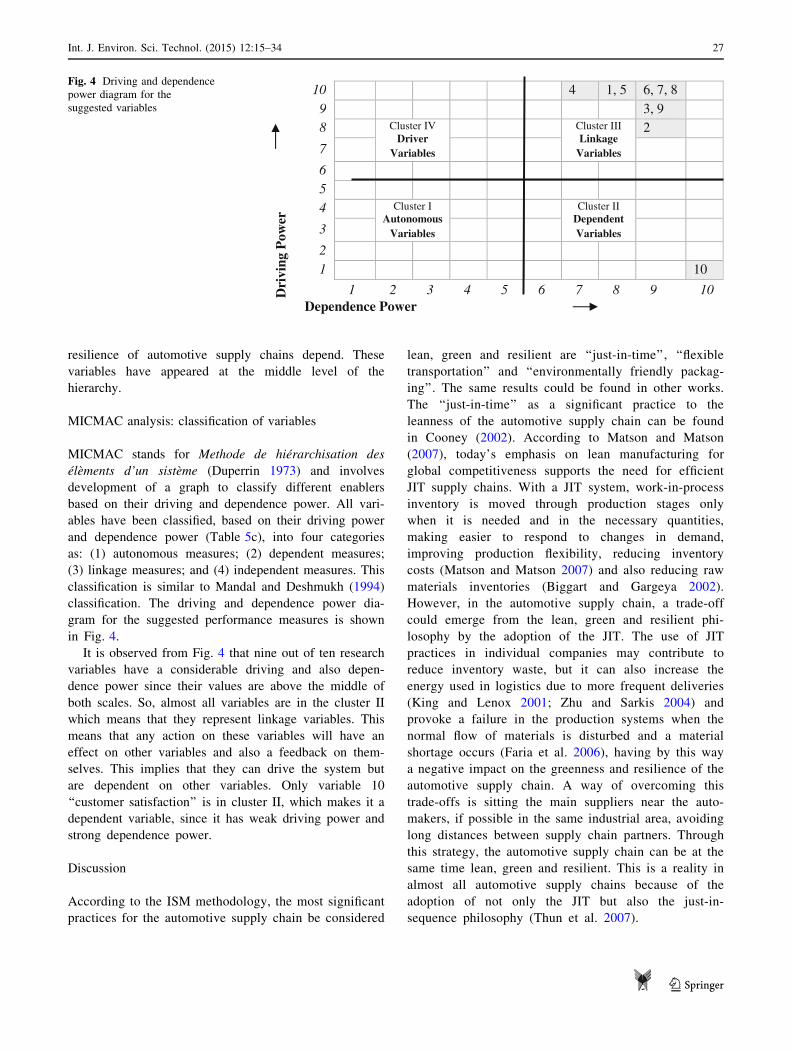
MICMAC analysis: classification of variables
MICMAC stands for Methode de hierarchisation des
elements d’un sisteme (Duperrin 1973) and involves
development of a graph to classify different enablers
based on their driving and dependence power. All vari-
ables have been classified, based on their driving power
and dependence power (Table 5c), into four categories
as: (1) autonomous measures; (2) dependent measures;
(3) linkage measures; and (4) independent measures. This
classification is similar to Mandal and Deshmukh (1994)
classification. The driving and dependence power dia-
gram for the suggested performance measures is shown
in Fig. 4.
It is observed from Fig. 4 that nine out of ten research
variables have a considerable driving and also depen-
dence power since their values are above the middle of
both scales. So, almost all variables are in the cluster II
which means that they represent linkage variables. This
means that any action on these variables will have an
effect on other variables and also a feedback on them-
selves. This implies that they can drive the system but
are dependent on other variables. Only variable 10
‘‘customer satisfaction’’ is in cluster II, which makes it a
dependent variable, since it has weak driving power and
strong dependence power.
Discussion
According to the ISM methodology, the most significant
practices for the automotive supply chain be considered
lean, green and resilient are ‘‘just-in-time’’, ‘‘flexible
transportation’’ and ‘‘environmentally friendly packag-
ing’’. The same results could be found in other works.
The ‘‘just-in-time’’ as a significant practice to the
leanness of the automotive supply chain can be found
in Cooney (2002). According to Matson and Matson
(2007), today’s emphasis on lean manufacturing for
global competitiveness supports the need for efficient
JIT supply chains. With a JIT system, work-in-process
inventory is moved through production stages only
when it is needed and in the necessary quantities,
making easier to respond to changes in demand,
improving production flexibility, reducing inventory
costs (Matson and Matson 2007) and also reducing raw
materials inventories (Biggart and Gargeya 2002).
However, in the automotive supply chain, a trade-off
could emerge from the lean, green and resilient phi-
losophy by the adoption of the JIT. The use of JIT
practices in individual companies may contribute to
reduce inventory waste, but it can also increase the
energy used in logistics due to more frequent deliveries
(King and Lenox 2001; Zhu and Sarkis 2004) and
provoke a failure in the production systems when the
normal flow of materials is disturbed and a material
shortage occurs (Faria et al. 2006), having by this way
a negative impact on the greenness and resilience of the
automotive supply chain. A way of overcoming this
trade-offs is sitting the main suppliers near the auto-
makers, if possible in the same industrial area, avoiding
long distances between supply chain partners. Through
this strategy, the automotive supply chain can be at the
same time lean, green and resilient. This is a reality in
almost all automotive supply chains because of the
adoption of not only the JIT but also the just-in-
sequence philosophy (Thun et al. 2007).
Dri
ving
Pow
er
10 4 1, 5 6, 7, 8 9 3, 9 8 Cluster IV
Driver Variables
Cluster III Linkage
Variables
2
7
6 5 4 Cluster I
Autonomous Variables
Cluster II Dependent Variables3
2 1 10
1 2 3 4 5 6 7 8 9 10Dependence Power
Fig. 4 Driving and dependence
power diagram for the
suggested variables
Int. J. Environ. Sci. Technol. (2015) 12:15–34 27
123

As in this study, the ‘‘flexible transportation’’ is iden-
tified by Tsiakouri (2008) and Azevedo et al. (2013a) as a
significant resilient practice to the automotive supply
chain. This is because this practice contributes to a
reduction in the transportation lead-time (Carvalho et al.
2011) and consequently an increase in the customer sat-
isfaction. Moreover, it is critical that the transportation
system has the ability to accommodate also changing
demands and traffic patterns allowing flexibility in traffic
patterns, which reduces the amount of excess capacity
needed at any point in the system to accommodate
increased demand (Morlok and Chang (2004) and con-
tributes to reduce the CO2 emissions through more effi-
cient transportation (Barany et al. 2011). This implies that
the ability to shift travel routes, times, modes and desti-
nations, through transportation demand management, can
increase capacity to deal with sudden increases in peak
demand, becoming supply chain more resilient, lean and
green.
In Azevedo et al. (2011) and Thun and Muller (2010)
the ‘‘environmentally friendly packaging’’ is identified
also as a practice contributing to the greenness of the
automotive supply chain. This practice is already
deployed by some automotive players that have environ-
mental concerns and want to avoid waste associated with
packaging materials and its disposal. For example, the
Toyota company improved packing and reusable metal
shipping containers rather than disposable cardboard and
wood pallets. Also, the Volkswagen company reduced the
use of cardboard packaging in-house logistics (Nunes and
Bennett 2010).
As regard the researched performance measures, the
ones considered most important to assess the influence of
lean, green and resilient practices on the automotive
supply chain performance are operational cost, business
wastage, environmental cost and customer satisfaction.
Ghalayini and Noble (1996) consider that it is crucial to
incorporate the ‘‘operational cost’’ in any supply chain
performance measurement system, since it will make
possible control and improve operational processes. This
measure allows the identification of wastes across the
several processes that are developed in automotive com-
panies. The ‘‘business wastage’’ is highlighted by several
authors (Srivastava 2007; Rao and Holt 2005; Linton
et al. 2007, Zhu et al. 2008a, b) since it is considered
important to integrate environmental thinking into supply
chain management. This measure makes possible to ana-
lyze the influence of the environmental behavior of
organizations and corresponding supply chain on their
performance. The business wastage is a supply chain
performance measure suggested also in many researches
(Zhu et al. 2005; Tsai and Hung 2009; Pochampally et al.
2009). As regard the ‘‘environmental cost’’, this measure
is considered extremely important to monitor the influence
of green practices on supply chain performance. Accord-
ing to Zhu et al. (2005), besides the environmental con-
cerns, the economic performance must be monitored
because it is the most important driver for organizations
which seek to implement environmental management
practices. Consequently, it is crucial to have information
about costs associated, for example, to scrap/rework
(Christiansen et al. (2003); disposal (Tsai and Hung
(2009) and purchasing environmentally friendly materials
(Zhu et al. 2005).
Andersson et al. (1989) believe that a supply chain
performance measurement system should include a bal-
anced collection of four to six performance measures in
which the customer satisfaction should be part. So the
decision on to include the ‘‘customer satisfaction’’ as a
supply chain performance measure to assess the influence
of lean, resilient and lean practices on supply chain per-
formance is consistent with the literature. This performance
measure is also in the top of the ISM hierarchy, which
means that it is a very significant measure to the automo-
tive industry. This is because automotive companies face
stiff competition and demanding customers. The imple-
mentation of mass production, which is based on a fore-
cast-driven strategy, leads to overstocking, extra marketing
expenses and low profitability (Holweg and Pil 2004).
Hence, many vehicle manufacturers adopt mass custom-
ization and customer-order-driven strategy in the hope that
the drawbacks of mass production can be overcome. In this
context, it is important to evaluate whether the customers
are still satisfied and whether the different lean, green and
resilient practices that have been deployed by automotive
companies are not jeopardizing the satisfaction level of
their customers.
Managerial implications
Being as reference the results reached by the application of
the ISM approach, the following managerial implications
can be inferred from this study:
1. Key lessons for auto company management—the
supply chain practices, namely ‘‘just-in-time’’, ‘‘flex-
ible transportation’’ and ‘‘environmentally friendly
packaging’’ are strong drivers and may be treated as
the root of leanness, greenness and resilience of the
automotive supply chain, so decision makers should
target these practices so that the desired level of
customer satisfaction objectives could be attained;
2. Supply chain function—these three supply chain
management practices (JIT, flexible transportation
and environmentally friendly packaging) being con-
sidered drivers, not only for the deployment of the
28 Int. J. Environ. Sci. Technol. (2015) 12:15–34
123
other research supply chain management practices but
also for the suggested performance measures, should
present high levels of implementation across the
various supply chain partners; this is only possible if
there is a closer relationship between them. So the
individual companies should develop a closer relation-
ship with their suppliers and customers;
3. Operations function—the JIT being a pillar of the
suggested supply chain management practices and
performance measures forces companies to speed
their operations not only inward but also across
supply chain partners. Also, the production and
inventory planning should be adapted to this philos-
ophy since it involves more frequent deliveries but in
less quantities. So, as the inventory levels are too
small or not exist, the failures in terms of quantity or
quality could lead a stoppage in the production. To
smooth the risk associated with this practice, the
companies should also implement the total quality
management and strategic stock practices; for com-
panies, as a way of ensuring a continuous flow of
materials in case of a disruption, the flexible
transportation practice can be deployed. This practice
could involve a rapid change of transport mode,
multimodal transportation or even multiple routes.
Moreover, automotive companies should also deploy
the environmentally friendly packaging practice
using reusable, returnable, degradable or easy-to-
recycle packing materials;
4. Marketing function—the results obtained from the
application of the ISM model highlights the customer
satisfaction as critical for the competitiveness of the
automotive supply chain. So considering that the ISO
14001 is a green practice that leads also to customer
satisfaction, and the automotive companies’ marketers
should still associate a green image to this sector in
order to improve its competitiveness catching envi-
ronmental-concern consumers;
5. Customer groups—the suggested lean, green and
resilient practices make possible to respond in a more
efficiently way to customers requirements along the
supply chain. Implementing the suggested practices,
this industry is prepared to respond to different
customers’ needs offering eco-products (ISO 14001),
in short lead-times (flexible transportation, strategic
stocks) with high levels of quality (total quality
management).
Conclusion
The implementation of lean, green and resilient practices
and supply chain performance measures creates
considerable challenges for managers from the automotive
supply chain. Some of the main lean, green and resilient
practices and also performance measures have been high-
lighted here and put into an ISM model, to analyze the
interaction between them. These practices are: JIT, TQM,
environmentally friendly packaging, ISO 14001, strategic
stock and flexible transportation
A major contribution of this research lies in the
development of linkages among various lean, green and
resilient practices and performance measures through a
single systemic framework. The utility of the proposed
ISM methodology in imposing order and direction on the
complexity of relationships among elements of a system
assumes a handy research method to the decision
makers.
Some of the observations from the ISM model, which
give important managerial implications, are discussed
below. The following supply chain practices are considered
very significant: ‘‘just-in-time’’ (lean practice), ‘‘flexible
transportation’’ (resilient practice) and ‘‘environmentally
friendly packaging’’ (green practice). These supply chain
practices are at the bottom level of the hierarchy, implying
higher driving power (Fig. 2). Therefore, top management
from automotive supply chains should focus on them in
order to become their companies and corresponding supply
chain leanness, greenness and resilient. Only the ‘‘customer
satisfaction’’ measure is not found under the linkage ele-
ment category. This means that almost all the practices and
performance measures possess a strong driving power with
strong dependence.
The driver-dependence diagram gives some valuable
insights about the relative importance and the interde-
pendencies among both practices and performance
measures.
The main implication of using ISM for researchers is
that the use of such approaches can form an extremely
effective and efficient method for capturing interactions
among lean, green and resilient practices and supply
chain performance. It allows researchers to perform
research that is interpretive and grounded in data effi-
ciently. This is important because, in many instances,
supply chain phenomena are so dynamic and changes
occur so fast that it is unreasonable to expect researchers
to study stable phenomena and replicate or disconfirm
results obtained by other researchers. Hence, it is
important to employ methodologies like ISM that effi-
ciently allow the capture and synthesis of practitioner’s
viewpoints.
Considering that the relationships and hierarchy among
practices and performance measures were identified
according to the perceptions of academics and profes-
sionals from the Portuguese automotive industry and they
will not be so different from the perceptions of a panel
Int. J. Environ. Sci. Technol. (2015) 12:15–34 29
123
from a different country, these findings could be general-
izable to other realities.
Moreover, besides the importance of the study, some
limitations could be pointed out.
A hypothetical model of lean, green and resilient prac-
tices and supply chain performance measures were devel-
oped based upon experts and professionals’ opinions. The
model may be tested in real-world setting to check that the
researched practices and their relationships with supply
chain performance measures exist as in the literature. The
results of model may vary in real-world setting. The lean,
green and resilient practices may be incomplete or their
relationships between them and with supply chain perfor-
mance measures may be different from the derived model.
Despite the fact that the ISM model developed in this
research is management paradigms and also performance
measures in the automotive supply chain, some general-
ization of results are still possible. Thus, the identification
of both supply chain practices and performance measures
in any supply chain assumes great importance. This can aid
the top management in deciding the priority so that it can
proactively take steps in deploying these practices and
performance measures.
At the end, we examine the scope of further research. In
this research, using the ISM methodology, a relationship
model among lean, green and resilient practices and per-
formance measures in Portuguese companies belonging to
the automotive supply chain have been developed. But this
model has not been statistically validated. Structural
equation modeling has the capability of testing the validity
of such hypothetical models. Thus, this approach can be
applied in future research to test the validity of the research
ISM model.
Acknowledgments The authors are thankful to the anonymous
reviewers for their valuable comments which give the opportunity to
improve this paper. The first author was supported by a Grant from
Forsknings-og Innovationsstyrelsen for ‘‘The International Network
programme’’ (2211916).
Appendix: Protocol for experts
The following table intends to register the perception of
professionals from automotive industry and academics on
the relationships between lean, green and resilient practices
and supply chain performance measures.
30 Int. J. Environ. Sci. Technol. (2015) 12:15–34
123
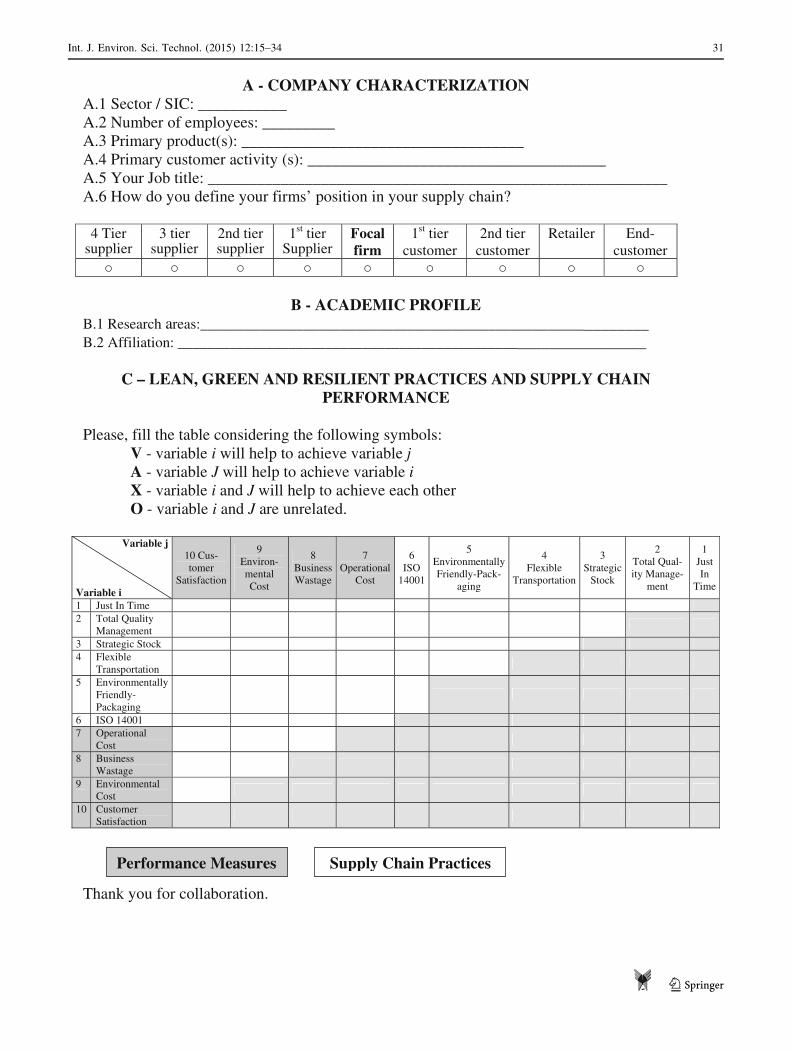
A - COMPANY CHARACTERIZATION A.1 Sector / SIC: ___________ A.2 Number of employees: _________ A.3 Primary product(s): ___________________________________ A.4 Primary customer activity (s): _____________________________________ A.5 Your Job title: _________________________________________________________ A.6 How do you define your firms’ position in your supply chain?
4 Tier supplier
3 tier supplier
2nd tier supplier
1st tier Supplier
Focal firm
1st tier customer
2nd tier customer
Retailer End-customer
B - ACADEMIC PROFILE B.1 Research areas:____________________________________________________________B.2 Affiliation: ______________________________________________________________
C – LEAN, GREEN AND RESILIENT PRACTICES AND SUPPLY CHAIN PERFORMANCE
Please, fill the table considering the following symbols: V - variable i will help to achieve variable jA - variable J will help to achieve variable iX - variable i and J will help to achieve each other O - variable i and J are unrelated.
Variable j
Variable i
10 Cus-tomer
Satisfaction
9 Environ-mental Cost
8 Business Wastage
7 Operational
Cost
6 ISO
14001
5 Environmentally Friendly-Pack-
aging
4 Flexible
Transportation
3 Strategic
Stock
2 Total Qual-ity Manage-
ment
1 Just In
Time
1 Just In Time 2 Total Quality
Management 3 Strategic Stock 4 Flexible
Transportation 5 Environmentally
Friendly-Packaging
6 ISO 14001 7 Operational
Cost 8 Business
Wastage 9 Environmental
Cost 10 Customer
Satisfaction
Thank you for collaboration.
Performance Measures Supply Chain Practices
Int. J. Environ. Sci. Technol. (2015) 12:15–34 31
123
References
AICEP—Portugal Global (2013) Portuguese automotive world. http://
www.portugalglobal.pt/EN/InvestInPortugal/ProminentSectors/
Sectors/Pages/Portugueseautomotiveworld.aspx. Accessed at
July 2013
Anand G, Kodali R (2008) A conceptual framework for lean supply
chain and its implementation. Int J Value Chain Manage
2:313–357
Anantatmula V, Kanungo S (2005) Establishing and structuring
criteria for measuring knowledge management efforts. In:
Proceedings of the 38th annual Hawaii international conference
on system sciences, p 8
Andersson P, Aronsson H, Storhagen NG (1989) Measuring Logistics
Performance. Eng Costs Prod Econ 17:253–262
Azevedo S, Machado V, Barroso A, Cruz-Machado V (2008) Supply
chain vulnerability: environment changes and dependencies. Int
J Logist Trans 1(2):41–55
Azevedo S, Carvalho H, Cruz-Machado V, Grilo F (2010) The
influence of agile and resilient practices on supply chain
performance: an innovative conceptual model proposal. In:
Innovative process optimization methods in logistics: emerging
trends, concepts and technologies. Erich Schmidt Verlag GmbH
& Co. KG, Hamburg, Germany, pp 265–281
Azevedo S, Carvalho H, Machado V-C (2011) The influence of green
practices on supply chain performance: a case study approach.
Trans Res Part E Logist Trans Rev 47(6):850–871
Azevedo S, Kannan G, Carvalho H, Cruz-Machado V (2013a)
Ecosilient index to assess the greenness and resilience of the
upstream automotive supply chain. J Clean Prod 56(1):131–
146
Azevedo S, Carvalho HV, Cruz-Machado V (2013b) Using interpre-
tive structural modelling to identify and rank performance
measures: an application in the automotive supply chain. Baltic J
Manage 8(2):208–230
Barany M, Bertok B, Kovacks Z, Friedler F, Fan L (2011) Solving
vehicle assignment problems by process-network synthesis to
minimize cost and environmental impact of transportation. Clean
Technol Environ Policy 13(4):637–642
Beamon BM (1999) Measuring supply chain performance. Int J Oper
Prod Manage 19(3):275–292
Biggart T, Gargeya V (2002) Impact of JIT on inventory to sales
ratios. Ind Manage Data Syst 102(3/4):197–202
Bolanos R, Fontela E, Nenclares A, Pastor P (2005) Using interpre-
tive structural modelling in strategic decision-making groups.
Manage Decis 43(6):877–895
Bowen F, Cousins P, Lamming R, Faruk A (2002) Horses for courses:
explaining the gap between the theory and practice of green
supply. Greener Manage Int 35:41–59
Brito M, Carbone V, Blanquart C (2008) Towards a sustainable
fashion retail supply chain in Europe: organisation and perfor-
mance. Int J Prod Econ 114(2):534–553
Cabral I, Grilo A, Cruz-Machado V (2012) A decision-making model
for Lean, Agile, Resilient and Green supply chain management.
Int J Prod Res 50(17):4830–4845
Carmines EG, Zeller RA (1979) Reliability and validity assessment.
Sage university paper series on quantitative applications in the
social sciences. Sage Publications, Newbury Park, pp 07–
017
Carvalho H, Azevedo S, Cruz-Machado V (2014) Trade-offs among
lean, agile, resilient and green paradigms in supply chain
management: a case study approach. In: Xu J, Fry JA, Lev B,
Hajiyev A (eds) Proceedings of the seventh international
conference on management science and engineering manage-
ment. Springer Berlin, pp 953–968
Carvalho H, Azevedo S, Cruz-Machado V (2010) Supply chain
performance management: lean and green paradigms. Int J Bus
Perform Supply Chain Model 2(3/4):151–179
Carvalho H, Duarte S, Cruz-Machado V (2011) Lean, agile, resilient
and green: divergencies and synergies. Int J Lean Six Sigma
2(2):151–179
Carvalho H, Maleki M, Cruz-Machado V (2012) The links between
supply chain disturbances and resilience strategies. Int J Agile
Syst Manage 5(3):203–234
Charan P, Shankar R, Baisya R (2008) Analysis of interactions among
the variables of supply chain performance measurement system
implementation. Bus Process Manage J 14(4):512–529
Christiansen T, Berry E, Bruun P, Ward P (2003) A mapping of
competitive priorities, manufacturing practices, and operational
performance in groups of Danish manufacturing companies. Int J
Oper Prod Manage 23(10):1163–1183
Christmann P (1998) Environmental strategies of multinational
chemical companies: global integration or national responsive-
ness?. The Anderson School at UCLA, University of California
Los Angeles, Los Angeles, CA
Christmann P, Taylor G (2001) Globalization and the environment:
determinants of firm self-regulation in China. J Int Bus Stud
32(3):439–458
Christopher M, Peck H (2004) Building the resilient supply chain. Int
J Logist Manage 15(2):1–14
Cooney R (2002) Is ‘‘lean’’ a universal production system? Batch
production in the automotive industry. Int J Operat Prod Manage
22(9/10):1130–1147
Duperrin J-C (1973) Methode de hierarchisation des elements d’un
systeme
Faisal M, Banwet D, Shankar R (2006) Supply chain risk mitigation:
modeling the enablers. Bus Process Manage J 12(4):535–552
Faria J, Matos M, Nunes E (2006) Optimal design of work-in-process
buffers. Int J Prod Econ 99(1/2):144–155
Ghalayini A, Noble J (1996) The changing basis of performance
measurement. Int J Operat Prod Manage 16(8):63–80
Glickman T, White S (2006) Security, visibility and resilience: the
keys to mitigating supply chain vulnerabilities. Int J Logist Syst
Manage 2:107–119
Gunasekaran A, Patel C, Tirtiroglu E (2001) Performance measures
and metrics in a supply chain environment. Int J Operat Prod
Manage 21(1/2):71–87
Haimes Y (2006) On the definition of vulnerabilities in measuring
risks to infrastructures. Risk Anal Off Publ Soc Risk Anal
26(2):293–296
Hanson J, Melnyk S, Calantone R (2004) Core values and environ-
mental management: a strong inference approach. Greener
Manage Int 46:29–40
Hawthorne R, Sage A (1975) On applications of interpretive
structural modeling to higher education program planning. Socio
Econ Plann Sci 9(1):31–43
Holweg M, Pil F (2004) The second century: reconnecting customer
and value chain through build-to-order: moving beyond mass
and lean production in the auto industry. MIT Press, Cambridge,
MA
Hong P, Kwon H-B, Roh J (2009) Implementation of strategic green
orientation in supply chain: An empirical study of manufacturing
firms. Eur J Innov Manage 12(4):512–532
Huang Y, Matthews H (2008) Seeking opportunities to reduce life
cycle impacts of consumer goods-An economy-wide assessment.
In Proceedings of the 2008 IEEE international symposium on
electronics and the environment, 2008, pp 1–6
Iakovou E, Vlachos D, Xanthopoulos A (2007) An analytical
methodological framework for the optimal design of resilient
supply chains. Int J Logist Econ Glob 1(1):1–20
32 Int. J. Environ. Sci. Technol. (2015) 12:15–34
123
Jedlicka A, Mayer R (1980) Interpretive structural modeling cross
cultural uses. IEEE Trans Syst Man Cybern 10(1):49–51
Jeffery M, Butler R, Malone L (2008) Determining a cost-effective
customer service level. Supply Chain Manage Int J
13(3):225–232
Jharkharia S, Shankar R (2004) IT enablement of supply chains:
modeling the enablers. Int J Prod Perform Manage
53(8):700–712
Kainuma Y, Tawara N (2006) A multiple attribute utility theory
approach to lean and green supply chain management. Int J Prod
Econ 101(1):99–108
Kannan G, Haq A (2007) Analysis of interactions of criteria and sub-
criteria for the selection of supplier in the built-in-order supply
chain environment. Int J Prod Res 45(17):3831–3852
Kannan V, Tan K (2005) Just in time, total quality management, and
supply chain management: understanding their linkages and
impact on business performance. Omega 33(2):153–162
Kannan G, Haq A, Sasikumar P, Arunachalam S (2008) Analysis and
selection of green suppliers using interpretative structural
modelling and analytic hierarchy process. Int J Manage Decis
Mak 9(2):163–182
Kannan G, Kannan D, Haq A (2010) Analyzing supplier development
criteria for an automobile industry. Ind Manage Data Syst
110(1):43–62
Kannan G, Murugesan P, Zhu Q, Devika K (2012) Analysis of third
party reverse logistics provider using interpretive structural
modeling. Int J Prod Econ 140(1):204–211
Kanungo S, Duda S, Srinivas Y (1999) A structured model for
evaluating information systems effectiveness. Syst Res Behav
Sci 16(6):495–518
King A, Lenox MJ (2001) Lean and green? An empirical examination
of the relationship between lean production and environmental
performance. Prod Oper Manage 10(3):244–256
Klein K, Kozlowski S (2000) Multilevel theory, research, and
methods in organizations: foundations, extensions, and new
directions, 1st ed. Pfeiffer
Koplin J, Seuring S, Mesterharm M (2007) Incorporating sustain-
ability into supply management in the automotive industry—the
case of the Volkswagen AG. J Clean Prod 15(11/12):1053–1062
Linton J, Klassen R, Jayaraman V (2007) Sustainable supply chains:
an introduction. J Oper Manage 25(6):1075–1082
Mandal A, Deshmukh S (1994) Vendor Selection Using Interpretive
Structural Modelling (ISM). Int J Oper Prod Manage
14(6):52–59
Manoharan T, Muralidharan C, Deshmukh S (2010) Analyzing the
interaction of performance appraisal factors using interpretive
structural modeling. Perform Improv 49(6):25–32
Mathison S (1988) Why triangulate? Educational Res 17(2):13–17
Mathiyazhagan K, Kannan G, Noorul Haq A, Yong G (2013) An ISM
approach for the analysis of barriers in implementing green
supply chain management. J Clean Prod 47:283–297
Matson JE, Matson JO (2007) Just-in-time implementation issues
among automotive suppliers in the southern USA. Supply Chain
Manage Int J 12(6):432–443
Miles M, Russell G (1997) ISO 14000 total quality environmental
management: the integration of environmental marketing, total
quality management, and corporate environmental policy. J Qual
Manage 2(1):151–168
Morlok E, Chang D (2004) Measuring capacity flexibility of a
transportation system. Transp Res Part A 38(6):405–420
Nair S, Menon C (2008) An environmental marketing system—a
proposed model based on Indian experience. Bus Strate Environ
17(8):467–479
Nawrocka D, Brorson T, Lindhqvist T (2009) ISO 14001 in
environmental supply chain practices. J Clean Prod
17(16):1435–1443
Naylor B, Naim M, Berry D (1999) Leagility: integrating the lean and
agile manufacturing paradigms in the total supply chain. Int J
Prod Econ 62(1–2):107–118
Nunes B, Bennett D (2010) Green operations initiatives in the
automotive industry: An environmental reports analysis and
benchmarking study. Benchmark Int J 17(3):396–420
Ohno T (1988) Toyota production system: beyond large-scale
production, 1st ed. Productivity Press, Oregon
Pandey V, Garg S (2009) Analysis of interaction among the enablers
of agility in supply chain. J Adv Manage Res 6(1):99–114
Pettersen J (2009) Defining lean production: some conceptual and
practical issues. TQM J 21(2):127–142
Pochampally K, Gupta S, Govindan K (2009) Metrics for perfor-
mance measurement of a reverse/closed-loop supply chain. Int J
Bus Perform Supply Chain Model 1(1):8–32
Ponomarov SY, Holcomb MC (2009) Understanding the concept of
supply chain resilience. Int J Logist Manage 20(1):124–143
Rao P, Holt D (2005) Do green supply chains lead to competitiveness
and economic performance? Int J Oper Prod Manage
25(9):898–916
Ravi V, Shankar R (2004) Analysis of interactions among the barriers
of reverse logistics. Technol Forecast Soc Chang
72(8):1011–1029
Ravi V, Shankar R, Tiwari M (2005) Productivity improvement of a
computer hardware supply chain. Int J Prod Perform Manage
54(4):239–255
Reichhart A, Holweg M (2007) Lean distribution: concepts, contri-
butions, conflicts. Int J Prod Res 45:3699–3722
Rondinelli D, Berry M (2000) Environmental citizenship in multi-
national corporations: social responsibility and sustainable
development. Eur Manage J 18(1):70–84
Rosic H, Bauer G, Jammernegg W (2009) A framework for economic
and environmental sustainability and resilience of supply chains.
In: Rapid modelling for increasing competitiveness, pp 91–104
Sage A (1977) Interpretive structural modeling: methodology for
large scale systems. McGraw-Hill, New York, pp 91–164
Sahney S, Banwet D, Karunes S (2006) An integrated framework for
quality in education: application of quality function deployment,
interpretive structural modelling and path analysis. Total Qual
Manage Bus Excell 17(2):265–285
Saxena J, Sushil P, Vrat S (1992) Scenario building: a critical study of
energy conservation in the Indian cement industry. Technol
Forecast Soc Chang 41(2):121–146
Singh B, Garg SK, Sharma SK (2010) Development of index for
measuring leanness: study of an Indian auto component industry.
Meas Bus Excell 14(2):46–53
Singleton RA, Straits BC (1999) Approaches to social research.
Oxford University Press, New York, NY
Srivastava S (2007) Green supply-chain management: a state-of-the-
art literature review. Int J Manage Rev 9(1):53–80
Svensson G (2000) A conceptual framework for the analysis of
vulnerability in supply chains. Int J Phys Dist Logist Manage
30(9):731–750
Talib F, Rahman Z, Qureshi M (2011) Analysis of interaction among
the barriers to total quality management implementation using
interpretive structural modeling approach. Benchmarking Int J
18(4):563–587
Tang C (2006) Robust strategies for mitigating supply chain
disruptions. Int J Logist Res Appl 9(1):33–45
Thakkar J, Deshmukh G, Gupta A, Shankar R (2007) Development of
a balanced scorecard: an integrated approach of Interpretive
Structural Modeling (ISM) and Analytic Network Process
(ANP). Int J Prod Perform Manage 56(1):25–59
Thakkar J, Kanda A, Deshmukh G (2008) Evaluation of buyer-
supplier relationships using an integrated mathematical approach
of interpretive structural modeling (ISM) and graph theoretic
Int. J. Environ. Sci. Technol. (2015) 12:15–34 33
123

matrix: the case study of Indian automotive SMEs. J Manuf
Technol Manage 19(1):92–124
Thun J-H, Muller A (2010) An empirical analysis of green supply
chain management in the German automotive industry. Bus
Strategy Environ 19(2):119–132
Thun J-H, Marble R, Silveira-Camargos V (2007) A conceptual
framework and empirical results of the risk and potential of just
in sequence: a study of the German automotive industry. J Oper
Logist 1(2):1–13
Tice J, Ahouse L, Larson T (2005) Lean production and EMSs:
aligning environmental management with business priorities.
Environ Qual Manage 15(2):1–12
Tsai W, Hung S (2009) A fuzzy goal programming approach for
green supply chain optimisation. Int J Prod Res
47(18):4991–5017
Tsiakouri M (2008) Managing disruptions proactively in the supply chain:
the approach in an auto-manufacturing production line in proceed-
ings of the POMS 19 Conference, May, 9–12. California, USA
Vonderembse MA, Uppal M, Huang SH, Dismukes JP (2006)
Designing supply chains: towards theory development. Int J Prod
Econ 100(2):223–238
Voss C, Tsikriktsis N, Frohlich M (2002) Case research in operations
management. Int J Oper Product Manage 22(2):195–219
Walker H, Di Sisto L, McBain D (2008) Drivers and barriers to
environmental supply chain management practices: lessons from
the public and private sectors. J Purch Supply Manage
14(1):69–85
Warfield J (1974a) Developing interconnected matrices in Structural
modeling. IEEE Trans Syst Men Cybern 4(1):51–81
Warfield J (1974b) Developing subsystem matrices in structural
modeling. IEEE Trans Syst Man Cybern 4(1):74–80
Warfield J (1976) Societal systems: planning, policy and complexity.
Wiley, New York
Yin R (2002) Case study research: design and methods, applied social
research methods series, vol 5. Sage, Thousand Oaks, CA
Zhu Q, Sarkis J (2004) Relationships between operational practices
and performance among early adopters of green supply chain
management practices in Chinese manufacturing enterprises.
J Oper Manage 22:265–289
Zhu Q, Sarkis J, Cordeiro J, Lai K-H (2008a) Firm-level correlates of
emergent green supply chain management practices in the
Chinese context. Omega 36(4):577–591
Zhu Q, Sarkis J, Geng Y (2005) Green supply chain management in
China: pressures, practices and performance. Int J Oper Prod
Manage 25(5):449–468
Zhu Q, Sarkis J, Lai H-K, Geng Y (2008b) The role of organizational
size in the adoption of green supply chain management practices
in China. Corp Soc Responsib Environ Manage 15(6):322–337
Zobel C (2011) Representing perceived tradeoffs in defining disaster
resilience. Decis Support Syst 50(2):394–403
Zsidisin G, Ragatz G, Melnyk S (2005) The dark side of supply chain
management. Supply Chain Manage Rev 9(2):46–52
34 Int. J. Environ. Sci. Technol. (2015) 12:15–34
123