leading the homag group to its full potential · leading the homag group to its ... csil. good...
TRANSCRIPT

www.durr.comwww.durr.com
LEADING THE HOMAG GROUP TO ITS FULL POTENTIALOverview, integration and optimization
Ralf W. Dieter (CEO), Ralph Heuwing (CFO)
Hanover, May 12, 2015
DÜRR AG

© Dürr AG, CCI, Leading HOMAG Group to its full potential, Hanover, May 12, 2015 2
HOMAG GROUP AT A GLANCE
Headquarters in Schopfloch, Germany, 90 km from Bietigheim
Areas of application:
Furniture industry, Wood-based panel-processing
Construction supplies and timber home construction industries
Key customers products:
Home and office furniture, kitchens
Parquet and laminate flooring, windows, doors, stairs
30% market share, biggest customer: IKEA (~ 5% of sales)
International group with 37 locations worldwide; only 20% of sales in Germany
5,700 employees worldwide, thereof 3,900 in Germany
Solid financials: Equity ratio 33%, net financial debt € 43 m as of March 31, 2015
Operating result clearly improved in recent years, 4.0% EBIT margin in 20141
1incl. extraordinary costs (e.g. PPA costs Stiles takeover)
World market leader in woodworking machinery and systems

CNC technology
Storage system
Edge banding
Machines 49% (49%)
Cells and production lines 30% (34%)
Service 21% (17%)
Stationary technology/CNCEdge processingPanel dividing saws
Sales revenue split 2014 (2013)
Services/project management
Product range
Broad offering for service, spare parts and training
Engineering capacity for integrated solutions from manufacturing cellsup to complete production lines including software
Consulting services
Drilling/fitting/assemblyHandling/packagingLaminating and sanding
HOMAG GROUP COMPANY PROFILEProducts and services
© Dürr AG, CCI, Leading HOMAG Group to its full potential, Hanover, May 12, 2015 3

HOMAG GROUP: A GLOBAL MARKET LEADERMarket share increased to 30% in 2014
49% 50% 51% 48%
5% 5% 4%5%
10%10% 10%
10%
8% 7% 7%7%
28% 28% 28% 30%
2011 2012 2013 2014
Relevant market2
1 Own estimation; market share based on estimated global sales in the relevant market 2 Source: VDMA, Acimall, own calculations3 Wood processing only; adjustment of market share 2011 due to updated information4 Wood processing only
Others
3
4
€ 2.8 bn € 2.8 bn € 2.8 bn € 3.0 bn
© Dürr AG, CCI, Leading HOMAG Group to its full potential, Hanover, May 12, 2015 4

24%(22%)
Central Europe
Western Europe
Eastern Europe
North America
Asia/Pacific
South America
18%(19%)
20%(26%)
12%(9%)
2% (4%)
24%(20%)
GROWTH MOMENTUM IN ASIA, NORTH AMERICA AND CENTRAL EUROPEIncoming orders split HOMAG Group 2014 (2013)
2014: € 803 m (+9%)
2013: € 734 m
© Dürr AG, CCI, Leading HOMAG Group to its full potential, Hanover, May 12, 2015 5

INCREASING GLOBALIZATION OF BUSINESS
Rest of World
Europe
2014
€ 915 m
2010
€ 718 m
30%
39%
70%
61%
4,981
Rest of World
5,482
Europe
20142010
12% 18%
88%
82%
€ 558 m
€ 357 m
€ 214 m
4,469
4,383
5981,013
€ 504 m
CAGR 2.6%
CAGR 13.6%
CAGR 0.5%
CAGR 14.1%
Sales Employees
© Dürr AG, CCI, Leading HOMAG Group to its full potential, Hanover, May 12, 2015 6

GROWTH IN THE FURNITURE MARKET COMPARABLE TO GLOBAL GDP GROWTH
© Dürr AG, CCI, Leading HOMAG Group to its full potential, Hanover, May 12, 2015 7
0
100
200
300
400
500
04 05 06 07 08 09 10 11 12 13 14 15
in USD bn
Global furniture market CAGR: 5%
Source: Center of Industrial Studies, Csil
Growth drivers of the furniture market: rising disposable income, growing global population, rising number of households
Key drivers for the woodworking machinery industry: automation and industrialization in furniture production, batch-size 1, linking and digitalization along the value chain

CHINA ACCOUNTS FOR ALMOST 50% OF GLOBAL FURNITURE PRODUCTION
© Dürr AG, CCI, Leading HOMAG Group to its full potential, Hanover, May 12, 2015 8
Similar trends as in the car industry: low growth in Europe, steady growth in North America and strong growth in EM (~ 6%)
EM account for more than 60% of world furniture market, China most important single market
Clear focus of HOMAG Group to address these markets, HOMAG will benefit from Dürr‘s experience
44%
10%5%4%
3%2%
2%
30%
China
USA
Germany
Italy
India
Poland
Brazil
Others
Global furniture production (2013)
Source: Center of Industrial Studies, Csil

GOOD START INTO 2015 (I)
© Dürr AG, CCI, Leading HOMAG Group to its full potential, Hanover, May 12, 2015 9
2013 2014 ∆ in % Q1 2014 Q1 2015 ∆ in %
Incoming orders (€ m) 734.3 802.6 +9.3 260.02 287.22 10.5
Sales revenues (€ m) 788.8 914.8 +16.0 204.8 253.7 23.9
EBIT3 (€ m) 34.6 36.7 +6.1 5.6 11.5 105.4
EBIT margin3 (%) 4.4 4.0 -0.4 ppts 2.7 4.5 +1.8 ppts
Net income (€ m) 18.4 18.9 +2.7 2.5 4.1 64.0
HOMAG Group: FY and Q1 figures1
1 HOMAG Group figures2 including merchandise machines 3 after employee participation
Strong improvement in incoming orders and sales; push in project business
Order backlog increased by € 60 m to € 354 m
Earnings increase due to productivity improvements, higher utilization and currency effects

GOOD START INTO 2015 (II)
© Dürr AG, CCI, Leading HOMAG Group to its full potential, Hanover, May 12, 2015 10
2013 2014 ∆ in % Q1 2014 Q1 2015 ∆ in %
Capex (€ m) 24.4 32.6 +33.6 4.4 6.2 40.9
Op. cash flow (€ m) 46.5 90.3 +94.2 20.8 -5.5 -
Free cash flow (€ m) 28.5 50.1 +19.8 2.2 -11.1 -
Equity (€ m) 177.7 194.7 +9.6 179.3 206.7 15.3
Equity ratio in % 32.7 31.9 -0.8 ppts 29.1 32.6 3.5 ppts
Net financial status (€ m) -69.2 -28.5 - -69.7 -43.1 -
NWC (€ m) 71.8 42.0 -41.5 76.3 66.6 -12.7
HOMAG Group: Typical NWC pattern in Q1 but equity ratio further improved
Increase in NWC in Q1 due to business expansion; slightly negative cash flow
Equity ratio close to 33%

HOMAG INTEGRATION ON TRACK
© Dürr AG, CCI, Leading HOMAG Group to its full potential, Hanover, May 12, 2015 11
Fast-paced process, very collaborative atmosphere
Oct 2014
14 Takeover closing (transfer of HOMAG shares from public offer)
24 Changes in Supervisory Board, Ralf W. Dieter becomes Chairman
27 Ralph Heuwing appointed as member of HOMAG BoM
31 Integration kick-off
Nov 2014 24 Announcement of domination + profit transfer agreement
Dec 20141 Ralph Heuwing becomes HOMAG CEO
17 Announcement of listing change: from Prime Standard to Entry Standard
Jan 2015 15 Compensation amount fixed, invitation for extraordinary shareholders´ meeting
Mar 2015
5 Extraordinary shareholders´ meeting
11-14 First joint Dürr/HOMAG management meeting
17 Domination + profit transfer agreement effective
Apr 20151 Franz Peter Matheis becomes CFO
22 HOMAG syndicated loan terminated effective May 29

HOMAG SHAREHOLDER STRUCTURE AS OF MARCH 31, 2015
© Dürr AG, CCI, Leading HOMAG Group to its full potential, Hanover, May 12, 2015 12
22%
22%56%
FamiliesSchuler &KlessmannFreeshareholders
Dürr
Dürr owns 78% of voting rights (voting pool agreement with Schuler & Klessmann families)
According to the IFRS free shareholders and family shareholders are only entitled to guarantee dividend, no minorities any longer

SYNERGIES EXPECTED TO REACH € 5 TO 10 MILLION
© Dürr AG, CCI, Leading HOMAG Group to its full potential, Hanover, May 12, 2015 13
22 integration areas – key examples
ITJoint purchasing of software and hardware, license management
Group-wide infrastructure and service
FinancingReplacement of syndicated loan with I/C loan
Capital efficiency through group-wide cash-pooling
Patents / IP Professional IP management
SourcingAutomation equipment (drives, controls, sensors)
General purchasing (logistics, insurance)
Technology Know-how transfer in visualization, robotics, virtual commissioning
Others
Talent managementCompliance, internal auditTravel managementSales and service locations
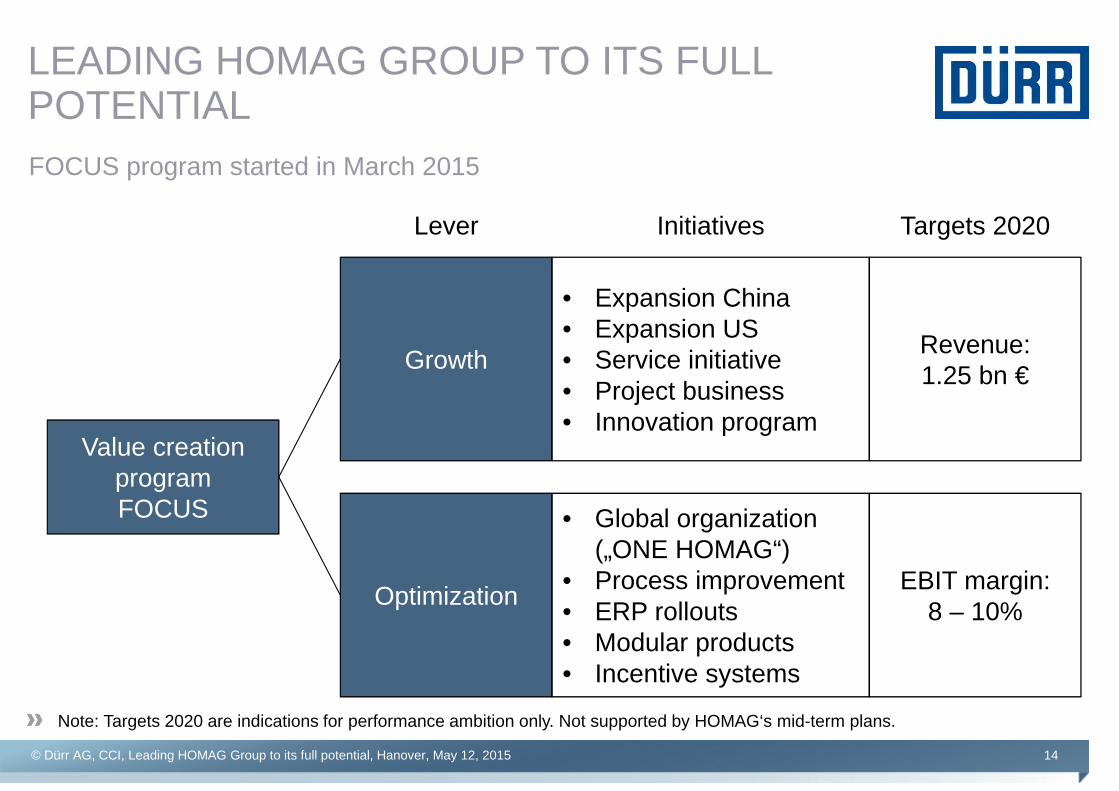
LEADING HOMAG GROUP TO ITS FULL POTENTIAL
© Dürr AG, CCI, Leading HOMAG Group to its full potential, Hanover, May 12, 2015 14
FOCUS program started in March 2015
Value creation program FOCUS
Growth
Optimization
• Expansion China • Expansion US• Service initiative• Project business• Innovation program
• Global organization („ONE HOMAG“)
• Process improvement• ERP rollouts• Modular products• Incentive systems
Revenue:1.25 bn €
EBIT margin:8 – 10%
Lever Initiatives Targets 2020
Note: Targets 2020 are indications for performance ambition only. Not supported by HOMAG‘s mid-term plans.

KEY ELEMENTS OF THE FOCUS PROGRAM (I)
© Dürr AG, CCI, Leading HOMAG Group to its full potential, Hanover, May 12, 2015 15
Growth
Expansion ChinaIncrease and further localize production in China
Establish localized R&D for mid-end products
Expansion USLeverage Stiles potential (project business)
Further localize production and design
Service initiativeIncrease awareness (CustomerExcellence@Dürr)
Strengthen organization
Project businessImprove cross-divisional collaboration
Make use of Dürr project management know-how
Innovation programIncrease/re-allocate R&D budget, especially in automation, digitalization and CNC

KEY ELEMENTS OF THE FOCUS PROGRAM (II)
© Dürr AG, CCI, Leading HOMAG Group to its full potential, Hanover, May 12, 2015 16
Optimization
Global organization
Improve collaboration across HOMAG Group entities („ONE HOMAG“)
Establish global business units
Process improvement
Efficiency improvement in order execution processes
Process harmonization across HOMAG Group
ERP rolloutsIncrease use of modern ERP systems
Productivity enhancement in order execution
Modular productsModular product structure to increase part commonality
Use of product configurator
Incentive systemsAlignment of incentives with global business objectives

HOMAG ORGANIZATION: „ONE HOMAG“ AS GUIDING PRINCIPLE
© Dürr AG, CCI, Leading HOMAG Group to its full potential, Hanover, May 12, 2015 17
PC
Decisions too slow, no clear accountabilities, implementation difficult
PC SC SC …
Global business units with clear responsibilities, focus on functional excellence
PC
PC
SC
SC
…
Strategy
Manufacturing
R&D
Sales
…BUPanel Divid-
ing
BUCNC
BUThru-feed
Old company structure New company structure
PC = production company SC = sales company BU = business unit
BU Systems
BU Service

2015 AND 2016 IMPACT FROM TAKEOVER
© Dürr AG, CCI, Leading HOMAG Group to its full potential, Hanover, May 12, 2015 18
€ m 2015e 2016e
EBIT (consensus estimate) 57 67
Optimization costs ~ -10
PPA costs - 17.5 -8.7
EBIT 29.5 58.3
Financial result impact (IFRS) -12.5 -7.0
Refinancing syn loan with I/C Loan -3.9 +2.3
EBT1 13.1 53.6
Biggest P&L effects in Woodworking Machinery and Systems (WMS) division
No HOMAG minorities any more in Dürr P&L statement
1 This overview is simplified and does not contain the negative financial result of HOMAG

www.durr.comwww.durr.com
LEADING HOMAG GROUP TO ITS FULL POTENTIALOverview, Integration and Optimization
Ralf W. Dieter (CEO), Ralph Heuwing (CFO)
Hannover, May 12, 2015
DÜRR AG