leading edge activated carbon technology the …leading edge activated carbon technology for every...
TRANSCRIPT

The value of values cannot be overstated. In deploying our core values – innovation, technical superiority, customer centricity and environmental consciousness – we were able to build the resilience, strength and stability of the Company, all of which have allowed us to achieve significant growth and performance this year.
The Value of Values
CONTENT
01 Global Presence
02 Strategy
04 Joint Statement from the Chairman and the Managing Director
12 Financial Review16 Corporate Social Responsibility
21 Governance and Compliance
22 Board of Directors24 Management Team25 Corporate Governance44 Annual Report of the Board of Directors on the
Affairs of the Company48 Statement of Directors’ Responsibility49 Related Party Transactions Review
Committee Report50 Audit Committee Report52 Financial Calendar
53 Financial Statements
54 Independent Auditors’ Report58 Income Statement59 Statement of Comprehensive Income60 Statement of Financial Position62 Statement of Changes in Equity64 Statement of Cash Flows66 Notes to the Financial Statements
120 Statement of Group Value Added121 Investor Information124 Ten Year Financial Review126 Group Profile128 Glossary129 Notice of Meeting
Form of ProxyCorporate Information
HAYCARB PLC
Annual Report 2018/19
HA
YC
AR
B P
LC
Annual Report 2018/19
“Better livingthrough Carbon”
Our Vision
Leading edge Activated Carbon Technology for every industry and purpose
“To be the leading global brand for Activated Carbonand foremost provider for Water Purification Systems in Sri Lanka and the Region, renowned for technical excellence, customer centricity, innovation and sustainable business practices”
Haycarb PLC400, Deans Road, Colombo 10, Sri Lanka.Phone: +94 11 262 7000, +84 11 267 7364 (Finance)Fax: +94 11 269 9630E-mail: [email protected]

The value of values cannot be overstated. In deploying our core values – innovation, technical superiority, customer centricity and environmental consciousness – we were able to build the resilience, strength and stability of the Company, all of which have allowed us to achieve significant growth and performance this year.
The Value of Values
CONTENT
01 Global Presence
02 Strategy
04 Joint Statement from the Chairman and the Managing Director
12 Financial Review16 Corporate Social Responsibility
21 Governance and Compliance
22 Board of Directors24 Management Team25 Corporate Governance44 Annual Report of the Board of Directors on the
Affairs of the Company48 Statement of Directors’ Responsibility49 Related Party Transactions Review
Committee Report50 Audit Committee Report52 Financial Calendar
53 Financial Statements
54 Independent Auditors’ Report58 Income Statement59 Statement of Comprehensive Income60 Statement of Financial Position62 Statement of Changes in Equity64 Statement of Cash Flows66 Notes to the Financial Statements
120 Statement of Group Value Added121 Investor Information124 Ten Year Financial Review126 Group Profile128 Glossary129 Notice of Meeting
Form of ProxyCorporate Information
HAYCARB PLC
Annual Report 2018/19
HA
YC
AR
B P
LC
Annual Report 2018/19
“Better livingthrough Carbon”
Our Vision
Leading edge Activated Carbon Technology for every industry and purpose
“To be the leading global brand for Activated Carbonand foremost provider for Water Purification Systems in Sri Lanka and the Region, renowned for technical excellence, customer centricity, innovation and sustainable business practices”
Haycarb PLC400, Deans Road, Colombo 10, Sri Lanka.Phone: +94 11 262 7000, +84 11 267 7364 (Finance)Fax: +94 11 269 9630E-mail: [email protected]
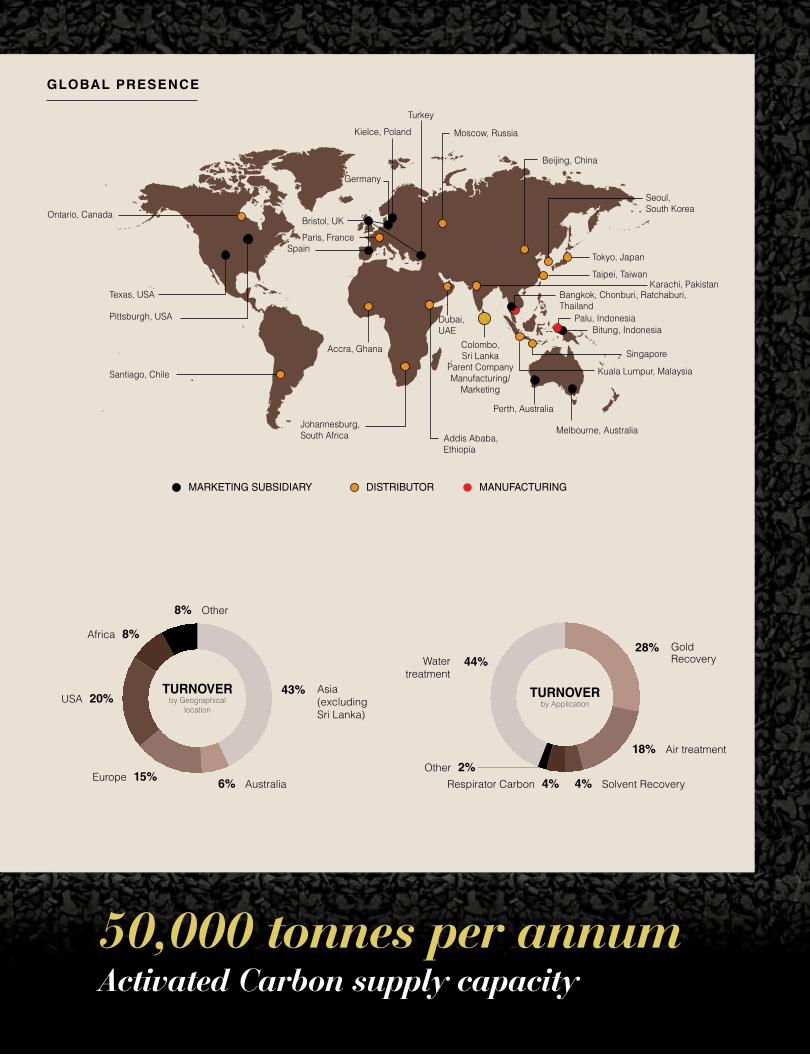
GLOBAL PRESENCE
TURNOVERby Application
4% Solvent Recovery
18% Air treatment
28% Gold RecoveryWater
treatment 44%
Other 2%Respirator Carbon 4%
8% Other
Africa 8%
USA 20%
Europe 15%6% Australia
TURNOVERby Geographical
location
43% Asia (excluding Sri Lanka)
MARKETING SUBSIDIARY DISTRIBUTOR MANUFACTURING
Santiago, Chile
Pittsburgh, USA
Texas, USA
Ontario, Canada
Kielce, Poland Moscow, Russia
Dubai, UAE
Tokyo, Japan
Taipei, Taiwan
Bangkok, Chonburi, Ratchaburi, Thailand
Kuala Lumpur, Malaysia
Palu, IndonesiaBitung, Indonesia
Singapore
Seoul, South Korea
Beijing, China
Colombo, Sri Lanka
Parent CompanyManufacturing/
Marketing
Addis Ababa, Ethiopia
Melbourne, Australia
Perth, Australia
Germany
Bristol, UK
Paris, FranceSpain
Johannesburg, South Africa
Accra, Ghana
Turkey
Karachi, Pakistan
50,000 tonnes per annumActivated Carbon supply capacity
Name of CompanyHaycarb PLC
Legal FormA Quoted Public Company with limited liability. Incorporated in Sri Lanka in 1973
Company NumberPQ 59
Stock Exchange ListingThe ordinary shares of the Company are listed with the Colombo Stock Exchange of Sri Lanka
SecretariesHayleys Group Services (Pvt) Ltd.400, Deans Road, Colombo 10, Sri LankaTelephone: +94 11 2627650
Registered Office400, Deans Road, Colombo 10, Sri Lanka.Telephone: +94 11 2627000, 2677364Fax: +94 11 2699630E-mail: [email protected]
BankersBank of CeylonCitibank N.A.Commercial BankDeutsche BankDFCC Vardhana BankHatton National BankHongkong & Shanghai Banking CorporationNations Trust BankNDB BankPan Asia Bank PLCPeople’s BankSampath BankSeylan BankStandard Chartered Bank
AuditorsMessrs Ernst & Young,Chartered Accountants,201, De Saram Place, Colombo 10Sri Lanka
Parent CompanyHayleys PLC
Accounting Year End31st March
CORPORATE INFORMATION
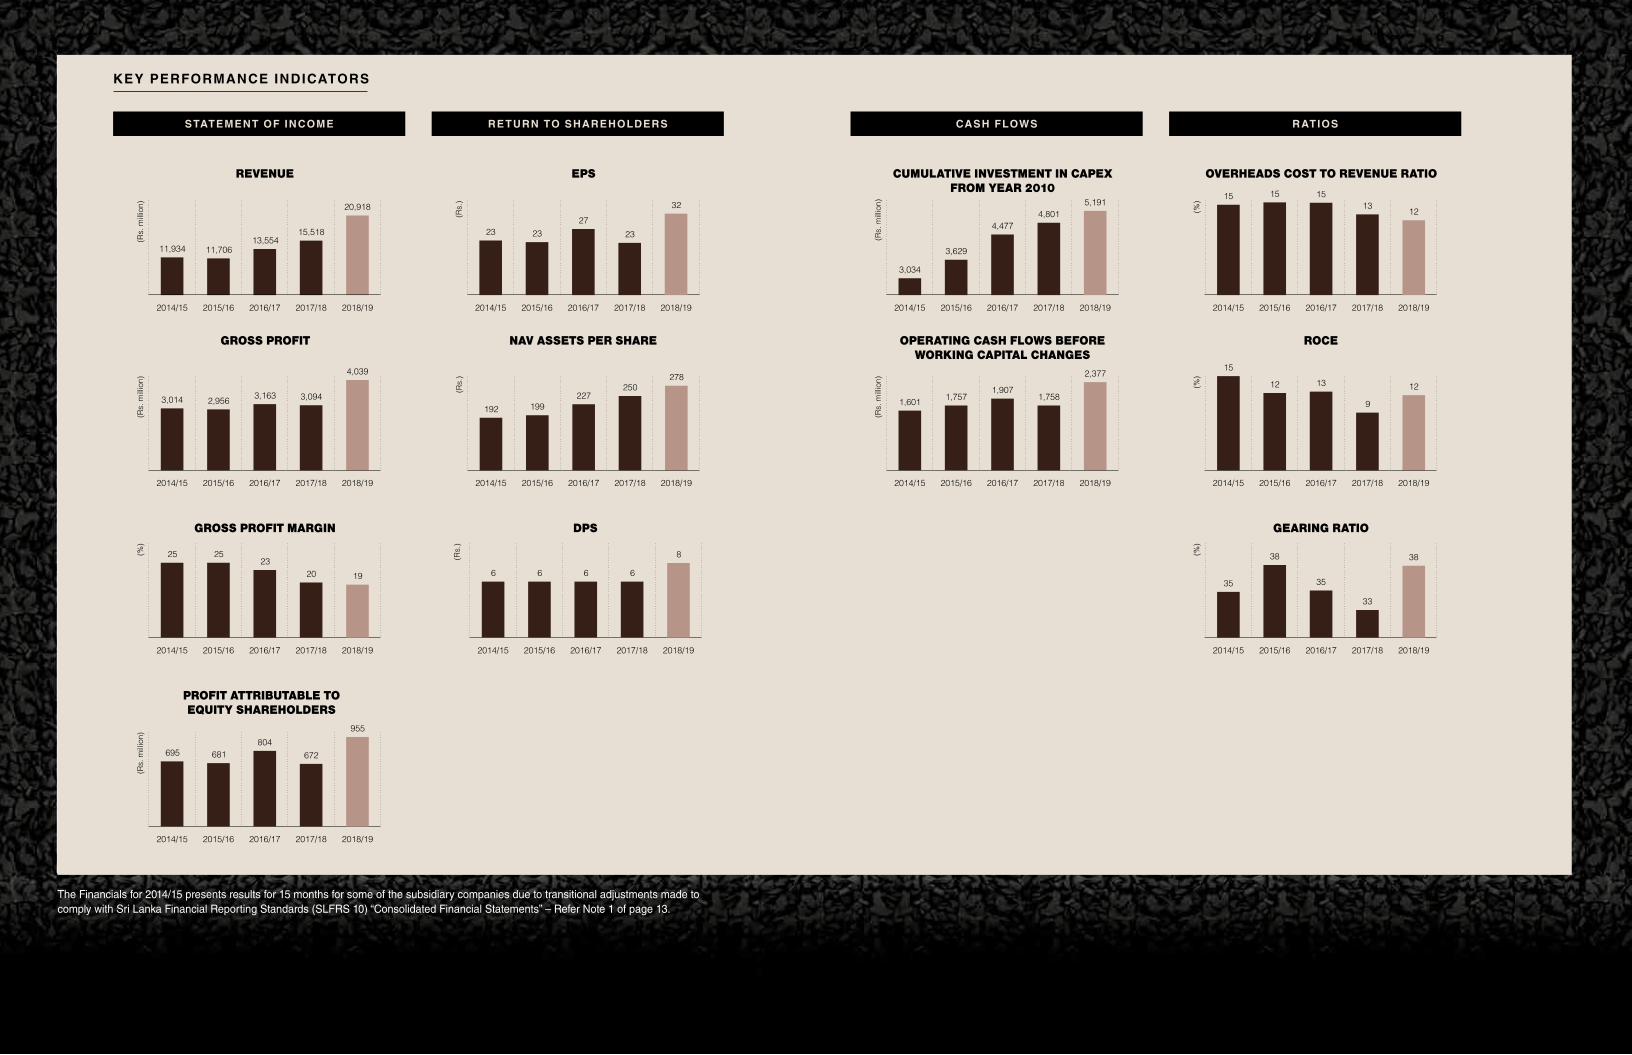
KEY PERFORMANCE INDICATORS
STATEMENT OF INCOME
REVENUE
11,934 11,70613,554
15,518
20,918
(Rs.
mill
ion)
2014/15 2015/16 2016/17 2017/18 2018/19
GROSS PROFIT
2014/15 2015/16 2016/17 2017/18 2018/19
(Rs.
mill
ion)
3,014 2,956 3,163 3,094
4,039
2014/15 2015/16 2016/17 2017/18 2018/19
(%)
25 2523
20 19
GROSS PROFIT MARGIN
(Rs.
mill
ion)
2014/15 2015/16 2016/17 2017/18 2018/19
PROFIT ATTRIBUTABLE TO EQUITY SHAREHOLDERS
695 681804
672
955
RETURN TO SHAREHOLDERS
2014/15 2015/16 2016/17 2017/18 2018/19
(Rs.
)
192
NAV ASSETS PER SHARE
199227
250278
(Rs.
)
2014/15 2015/16 2016/17 2017/18 2018/19
6 6 6 6
8
DPS
2014/15 2015/16 2016/17 2017/18 2018/19
(Rs.
)
EPS
23 2327
23
32
RATIOS
2014/15 2015/16 2016/17 2017/18 2018/19
15 15 1513
12(%)
OVERHEADS COST TO REVENUE RATIO
2014/15 2015/16 2016/17 2017/18 2018/19
15
12 13
9
12(%)
ROCE
GEARING RATIO
2014/15 2015/16 2016/17 2017/18 2018/19
(%)
35
38
35
33
38
CASH FLOWS
CUMULATIVE INVESTMENT IN CAPEX FROM YEAR 2010
(Rs.
mill
ion)
2014/15 2015/16 2016/17 2017/18 2018/19
3,034
3,629
4,4774,801
5,191
OPERATING CASH FLOWS BEFORE WORKING CAPITAL CHANGES
(Rs.
mill
ion)
2014/15 2015/16 2016/17 2017/18 2018/19
1,601 1,7571,907
1,758
2,377
The Financials for 2014/15 presents results for 15 months for some of the subsidiary companies due to transitional adjustments made to comply with Sri Lanka Financial Reporting Standards (SLFRS 10) “Consolidated Financial Statements” – Refer Note 1 of page 13.

GLOBAL PRESENCE
TURNOVERby Application
4% Solvent Recovery
18% Air treatment
28% Gold RecoveryWater
treatment 44%
Other 2%Respirator Carbon 4%
8% Other
Africa 8%
USA 20%
Europe 15%6% Australia
TURNOVERby Geographical
location
43% Asia (excluding Sri Lanka)
MARKETING SUBSIDIARY DISTRIBUTOR MANUFACTURING
Santiago, Chile
Pittsburgh, USA
Texas, USA
Ontario, Canada
Kielce, Poland Moscow, Russia
Dubai, UAE
Tokyo, Japan
Taipei, Taiwan
Bangkok, Chonburi, Ratchaburi, Thailand
Kuala Lumpur, Malaysia
Palu, IndonesiaBitung, Indonesia
Singapore
Seoul, South Korea
Beijing, China
Colombo, Sri Lanka
Parent CompanyManufacturing/
Marketing
Addis Ababa, Ethiopia
Melbourne, Australia
Perth, Australia
Germany
Bristol, UK
Paris, FranceSpain
Johannesburg, South Africa
Accra, Ghana
Turkey
Karachi, Pakistan
50,000 tonnes per annumActivated Carbon supply capacity

H
AYC
AR
B P
LCA
nnua
l Rep
ort 2
018/
19
2
Haycarb PLC treads a well mapped strategic path that allowed us to post noteworthy results in a challenging year. As a pioneering manufacturer of coconut shell derived activated carbon, a key area of challenge has been sourcing adequate supplies of raw material. Here, the Company’s strategic approach has been to support and retain existing supply bases, promote green charcoaling technology and broad-base our procurement network across key coconut growing countries in the region.
Whilst reinforcing its pre-eminent position both locally and internationally as a premium solutions provider, Haycarb enacted vital marketing strategies to access new geographies and penetrate new market segments, offering an enhanced, value added portfolio bolstered by successful product development initiatives and stringent quality assurance protocol. These measures are aligned with Haycarb’s strategy to innovate and achieve technical excellence across its product portfolio.
The Company’s Environmental Engineering business continued to consolidate its position as a prime provider of water/wastewater purification systems with a selective regional presence.
The vibrancy and proactiveness of Haycarb in the areas of Research and Development, Marketing and Business Development and Manufacturing Technologies resulted in a range of new product and process innovations, which enhanced as well as expanded our existing portfolio. These include special grades of Catalytic Carbon for the
removal of Monochloramine, a process to remove Formaldehyde from air filters, specialty Respirator Carbons, carbon for human consumption and enhanced carbon properties for supercapacitors.
We continue to seek ever greater levels of sustainability through projects that allow us to reduce the carbon footprint in all our manufacturing facilities; activities such as the operation of vertical kilns for environmental friendly charcoaling in Thailand and the expansion of the Haritha Angara project in Sri Lanka. Our flagship Corporate Social Responsibility initiative “Puritas Sath Diyawara” provides much needed purified drinking water to villages afflicted by Chronic Kidney Disease in Sri Lanka.
By continuing to focus on our core business segments of activated carbon and environmental engineering, implementing lean initiatives, leveraging new technology, and aggressively expanding our market reach, we were able to maintain our position as a world leader in the manufacture of coconut shell based activated carbon and a highly credible provider of innovative purification solutions.

Strategy A
nnual Report 2018/19
HAYC
AR
B P
LC
3
Strategy
Joint Statement from the Chairman and the Managing Director 04
Financial Review 12
Corporate Social Responsibility 16
Strategy Joint Statement from the Chairman and the Managing DirectorH
AYC
AR
B P
LCA
nnua
l Rep
ort 2
018/
19
4
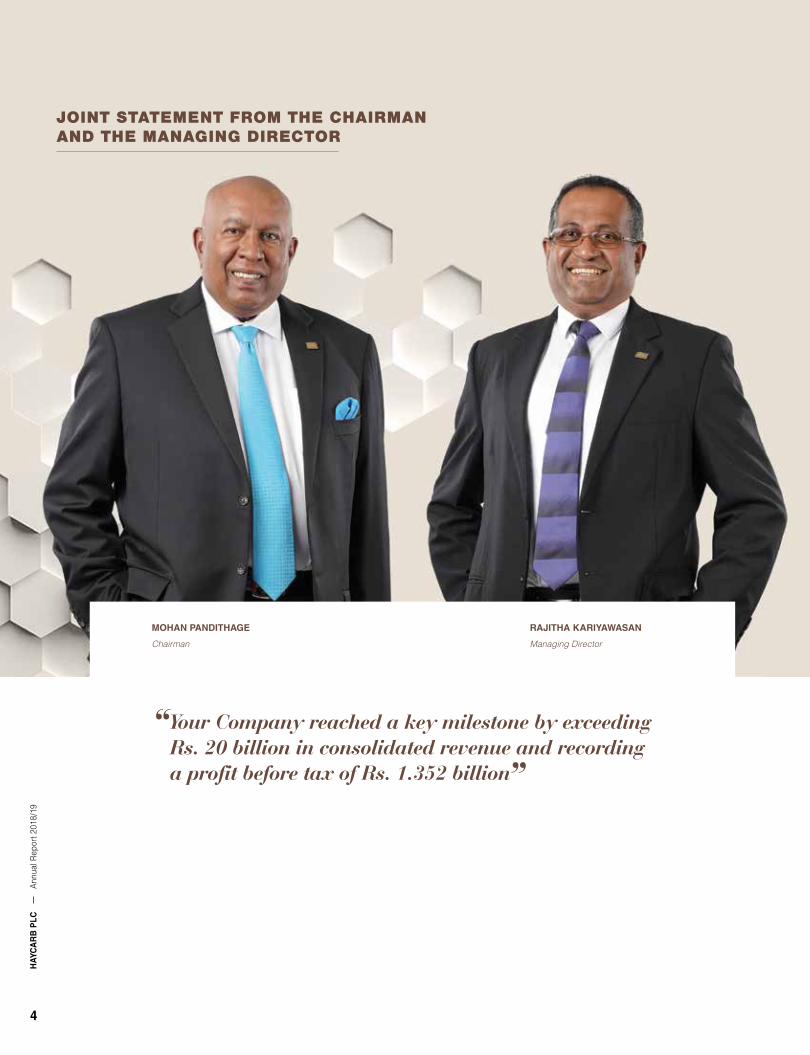
Your Company reached a key milestone by exceeding Rs. 20 billion in consolidated revenue and recording a profit before tax of Rs. 1.352 billion
MOHAN PANDITHAGE
Chairman
RAJITHA KARIYAWASAN
Managing Director
JOINT STATEMENT FROM THE CHAIRMAN AND THE MANAGING DIRECTOR

Strategy Joint Statement from the Chairman and the Managing DirectorA
nnual Report 2018/19
HAYC
AR
B P
LC
5
It is with pleasure that we table the Annual Report and the Audited financials for the year ended 31st March 2019 of Haycarb PLC.
Your Company reached a key milestone by exceeding Rs. 20 billion in consolidated revenue and recording a profit before tax of Rs. 1.352 billion. We present below the review of performance and the initiatives implemented to overcome the challenges faced during the year, and position Haycarb for future growth.
REVIEW OF OPERATIONS
Financial PerformanceThe Group turnover increased by 35% to Rs. 20,917 million whilst profit before and after tax was recorded at Rs. 1,352 million and Rs. 1,081 million respectively. The earnings per share increased to Rs. 32.16 and net assets per share increased to Rs. 277.68. As part of the investment portfolio rationalisation of the Hayleys Group, a leisure property was divested which contributed a capital gain of Rs. 114 million to the above results.
Dividends Taking into consideration the performance for the year and future prospects of the Company, the Board recommended and paid two interim dividends of Rs. 2.00 per share on 23rd January 2019 and Rs. 6.00 per share on 18th April 2019, totalling Rs. 8.00 per share.
Activated Carbon Operation The activated carbon turnover increased by 27% to Rs. 18,027 million in 2018/19, crossing the USD 100 million milestone for this business segment. The growth in revenue is mainly attributable to increase in the value added products portfolio and the adjustment of sales prices in the first half of the year to partially compensate for the sharp increases in raw material cost. Even though the profit before tax improved to Rs. 927 million, the business segment could not reach target levels of profit margin due to the time lag between cost increases and sale price adjustments.
Haycarb’s extensive procurement network spread across all major coconut shell charcoal producing countries in the region, ensured sufficient availability of raw material to optimise the utilisation of manufacturing capacities to fulfil its sales commitments, in spite of considerable challenges in the supply chain.
The year under review was unfavourable to Sri Lanka operations due to the drought conditions of 2016 and 2017 that affected charcoal production well into the 3rd quarter of the financial year 2018/19. The impact of the resultant raw material cost increases will be drawn over a longer period of time due to the significant raw
material inventory held by the Company as a strategy to offset uncertainties in raw material availability and provide supply security to our loyal customers. Thailand continued to face shortages and high cost of raw material throughout the year, compelling the Group’s Thailand subsidiary Carbokarn Co. Ltd., to import raw materials from Indonesia and the Philippines at even higher landed costs.
In Indonesia, the supply chain dynamics remained stable which enabled the Indonesian entities to operate at competitive levels. The PT Haycarb Palu Mitra factory was closed temporarily due to the earthquake and tsunami that impacted the Palu region in Indonesia in September 2018. The speedy recovery and re-commencement of the production facility was only possible due to the tireless efforts of the engineering and operations teams that minimised the downtime and the adverse impact to the top and bottom line of the Group.
Haycarb continued to protect and strengthen its relationships built across the coconut shell charcoal supply network in Sri Lanka, Thailand, Indonesia, India, and the Philippines. Taking a long-term view on sustainability and environmental concerns, the Company further invested in the “Haritha Angara” green charcoaling project in Sri Lanka and the Vertical Kiln Environmental friendly Charcoaling Project in Thailand.
The demand for activated carbon remained strong during the year though there was a slight down turn in the 3rd quarter. With the improving availability of charcoal and reducing purchase cost, Haycarb commenced reduction of carbon prices to support our valued customers even though large inventories of raw material held at higher average cost continued to impact our margins in the in short term.
During the year, the marketing teams focused on initiatives to acquire new customer accounts, access new geographies and expand the value added product portfolio. Special efforts were made to expand value added product segments in Point of Use (POU)/Point of Entry (POE) water applications, monochloramine removal (MCA) carbons, respirator carbons and impregnated carbons to bring better balance and diversity to the sales mix. The Company’s efforts to expand its market reach outside the traditional markets has borne fruit with satisfactory growth in markets such as North, East and West Africa, South East Asia, China and South Korea.
The acquisition of new customer accounts and markets and the consequent increase in revenue resulted in higher investment in debtor financing. The overall increase in raw material prices coupled with the strategic increase of the raw material inventory, significantly increased Haycarb Group’s working capital. The resultant increase in short-term borrowing levels contributed to the 66% increase in interest paid by the Group.

Strategy Joint Statement from the Chairman and the Managing DirectorH
AYC
AR
B P
LCA
nnua
l Rep
ort 2
018/
19
6
“The activated carbon turnover increased by 27% to Rs. 18,027 million in 2018/19, crossing the USD 100 million milestone for this business segment...
Even though the profit before tax improved to Rs. 927 million, the business segment could not reach target levels of profit margin due to the time lag between cost increases and sale price adjustments”
The R&D and Technical Teams worked to develop new products and anchor process innovations and optimisation. One of the key initiative was the development of a range of both coconut shell based and wood based MCA carbons that could well be an industry benchmark on performance and wide capacity range.
Cross functional teams launched over 50 initiatives across seven factories through the lean platform to improve efficiencies and reduce cost. 5S and continuous improvement philosophies are promoted and reinforced as a way of life. Maximum priority is accorded to Quality Assurance and Quality Management Systems. Safety, Health and Environment (SHE) systems and practices were enhanced while related training sessions were frequently carried out systematically on both quality and SHE to embrace the importance of these disciplines on the shop floor.
The positive impact of depreciation of rupees against the USD dollar during the year was offset significantly as Sri Lanka was compelled to import a considerable part of its charcoal requirement, which is the main cost element of activated carbon manufacturing process.
Environmental EngineeringThe environmental engineering segment recorded a revenue of Rs. 2,890 million and a profit before tax of Rs. 295 million. The challenges in the political/economic environment that resulted in the postponement of projects in Sri Lanka and in the Maldives which are the two key markets for water and waste water treatment solutions, delayed the achievement of the expected revenue and net income targets for the current year. The Company has continued to bid for and execute a number of projects across Sri Lanka under the Water Supply and Sanitation Improvement Projects Initiative of the Government of Sri Lanka that is funded by the World Bank. The collaboration with Veolia Water France has continued to yield expected synergies and generate income during the year under review.
Sustainability Initiatives
Social EmpowermentPuritas continued to support the upkeep of the “Puritas Sath Diyawara” water purification plants established by the Hayleys Group of Companies that currently provides 160,000 litres of safe drinking water across 19 villages in the Northern and North Central Provinces of Sri Lanka that were at risk of Chronic Kidney Disease (CKD). The Company also plays the leading role in the book distribution project under the “Going Beyond” initiative that uplifts the quality of life in the said villages. Hayleys Group delivered school books and other requisites for the academic year 2019 to over 2,500 schoolchildren in 11 schools creating a conducive environment for the education to children in these rural communities. This flagship Corporate Social Responsibility platform of our Parent Company Hayleys PLC grows from strength to strength by helping many villages to eradicate CKD. Haycarb/Puritas takes pride in playing a leading role in the facilitation and implementation of this key CSR initiative of the Hayleys Group.
Strategy Joint Statement from the Chairman and the Managing DirectorA
nnual Report 2018/19
HAYC
AR
B P
LC
7
PT Haycarb Palu Mitra, our Indonesian subsidiary donated food, water, and other essential items to victims of the earthquake and tsunami in Palu, Indonesia, helping the community in close proximity to the factory to return to normalcy.
HealthHaycarb continued to donate medical grade activated carbon to the National Hospitals of Sri Lanka through the Ministry of Health for the treatment of patients who have ingested poisonous substances. The Company continues supporting this initiative over the years to save many lives through our own activated carbon products.
EnvironmentHaycarb strives to reduce its carbon footprint by promoting sustainable processes in manufacturing operations and supply chain network. It holds the patent for the premium green charcoaling process through Recogen – the lowest carbon footprint technology for charcoaling where the pollutant gases and heat generated in the process is used to generate electricity for the national grid. Haycarb also continued its efforts at promoting green charcoal in a less capital intensive process in Sri Lanka through the Haritha Angara project providing technology and financial assistance to charcoal suppliers to build and operate environment friendly closed charcoal pits. The Company has helped to construct and launch over 170 environment friendly charcoaling pits to date. Carbokarn, the Thailand subsidiary expanded the vertical charcoaling kilns that promote green charcoaling.
Sustainability of in-house processes were improved in a number of ways including introduction of flash drying technology for powder carbons, reduction of oil usage in the pelletised activated carbon plant and recovery of charcoal and carbon from waste material.
WAY FORWARD
The Company remains confident of its business model and the strategic position it holds in the coconut shell based activated carbon industry, regeneration services and the environmental engineering segment, to continue its growth trajectory in an expanding global market for purification solutions backed by emphasis placed on environmental sustainability standards and regulations globally.
Activated Carbon OperationsDiversification to specialised and value added products and service segments whilst consolidating the existing business offering will be the two pronged strategy that will be pursued by the activated carbon segment.
“Diversification to specialised and value added products and service segments whilst consolidating the existing business offering will be the two pronged strategy that will be pursued by the activated carbon segment”

Strategy Joint Statement from the Chairman and the Managing DirectorH
AYC
AR
B P
LCA
nnua
l Rep
ort 2
018/
19
8
Next year will be challenging, with margin pressure expected on our standard product portfolio. However, Haycarb will implement optimum cost reductions in all supply chains whilst recognising the need to ensure continuity and loyalty of its supplier network. Its commitment to manufacturing excellence and the QA and QMS systems are expected to enable the Company to retain a globally leading position for quality, consistency, and timely delivery. The increase in penetration into the North American market is an important initiative that is executed by the Haycarb USA Inc.’s marketing team supported by the Group’s central marketing and technical teams. Concurrently the Eurocarb team is expanding the markets in Europe in traditional as well as new and value added segments including impregnated, premium cabin air and human consumption carbons. Domiciled in UK, Eurocarb has assessed the risk and impact of ongoing Brexit negotiations with standby plans for the transition as required. The efforts of business development teams to acquire new customer accounts and expand the business in geographies such as CIS countries, China, Africa, South East Asia, South America and the Middle East will be pursued as awareness on environmental protection and sustainability in these geographies continue to increase the demand for purification products and solutions. Haycarb will continue to invest in new product development to expand its value added and specialised product offering and explore new technologies and process improvements to increase efficiencies and reduce cost. Haycarb seeks to expand the regeneration services offered in Thailand and opportunities to acquire new accounts for this business in Thailand, Indonesia, Europe and USA. It also has been considering opportunities to enter the activated carbon services segment in a developed market, as its next step in the diversification strategy and move up the value chain. The ability to command a broad based charcoal procurement network at competitive pricing remains a key driver in the coconut shell based activated carbon industry. Therefore emphasis will be placed on the protection and expansion of the procurement networks established in Sri Lanka, India, Thailand, Indonesia and Philippines. Haycarb will promote the environmental friendly charcoaling technologies to ensure the long term sustainability of the business. Adequate buffer stocks of raw materials at selected locations will be maintained to ensure supply security to valued customers. The Company will strengthen the procurement network established to source coconut shell activated carbon for value addition and expand the product range of coal and wood based carbons. Haycarb will continue to expand its capacity in line with its strategic growth plan of the activated carbon business by augmenting value added processes in its existing locations and expanding into new locations to cater to growth in demand.
“Puritas will leverage on its proven technical know-how and service record as a premium solutions provider for water and wastewater treatment systems for growth in the medium to long term”

Strategy Joint Statement from the Chairman and the Managing DirectorA
nnual Report 2018/19
HAYC
AR
B P
LC
9
Environmental EngineeringPuritas will leverage on its proven technical know-how and service record as a premium solutions provider for water and wastewater treatment systems for growth in the medium to long term. The Company will continue to pursue opportunities for new projects in the Government and private sector in Sri Lanka and in the Maldives, being markets in which the Company enjoys a strong brand presence. Concerted efforts are under way to penetrate and expand into other countries in the region including Bangladesh and Thailand.
Obtaining further large scale water projects through its valued collaboration with Veolia Water France is pursued as an important avenue of stability and growth.
The Company will invest on increasing market penetration of its activated carbon end products which include industrial and home protective face masks and odour removal products in the local and export markets.
Sustainability Haycarb is committed to sustainable business practices and social responsibility as a way of life and continues to abide by the triple bottom line philosophy.
APPRECIATION
Our colleagues on the Board join us in thanking our employees at all levels for working with commitment as a team to overcome challenges and achieve creditable performance during the year. The Board wishes to convey thanks and appreciation to all our stakeholders including our customers and suppliers for their contribution in our story of success this year and look forward to working together in the ensuing years.
MOHAN PANDITHAGE
Chairman
RAJITHA KARIYAWASAN
Managing Director
14th May 2019
“The Company remains confident of its business model and the strategic position it holds in the coconut shell based activated carbon industry, regeneration services and the environmental engineering segment, to continue its growth trajectory in an expanding global market for purification solutions backed by emphasis placed on environmental sustainability standards and regulations globally”

Strategy Joint Statement from the Chairman and the Managing DirectorH
AYC
AR
B P
LCA
nnua
l Rep
ort 2
018/
19
10
Our journey during the 46 years of existence has not been without challenging times. However, Haycarb has always withstood these challenges and emerged a winner due to our core values, that lay at the heart of the Company. Haycarb prides itself in its global supply chain and marketing network, which is a testimony to our core brand value of customer centricity. This network allows flexibility to deliver and serve our customers anywhere in the world, encompassing risk mitigation strategies that ensure reliability of supply. Our product quality and customer centricity have created an unwavering trust and loyalty in our customers, that has laid a strong foundation which Haycarb continues to build upon.
HAYCARB PLC
Madampe, Sri Lanka13,000 TPA
HAYCARB PLC
Badalgama, Sri Lanka7,000 TPA
PT Mapalus Makawanua Charcoal Industry
Bitung, Indonesia9,000 TPA
CARBOKARN Ltd.
Chonburi, Thailand8,500 TPA
SHIZUKA Co. Ltd.
Ratchaburi, Thailand3,500 TPA
GLOBAL MANUFACTURING LOCATIONS
Customer Centricity
PT HAYCARB Palu Mitra
Palu,Indonesia 4,000 TPA
Strategy Joint Statement from the Chairman and the Managing DirectorA
nnual Report 2018/19
HAYC
AR
B P
LC
11
350
280
210
140
70
02011 2013 2015 2017 2019
GROWTH OF CUSTOMER BASE
No.
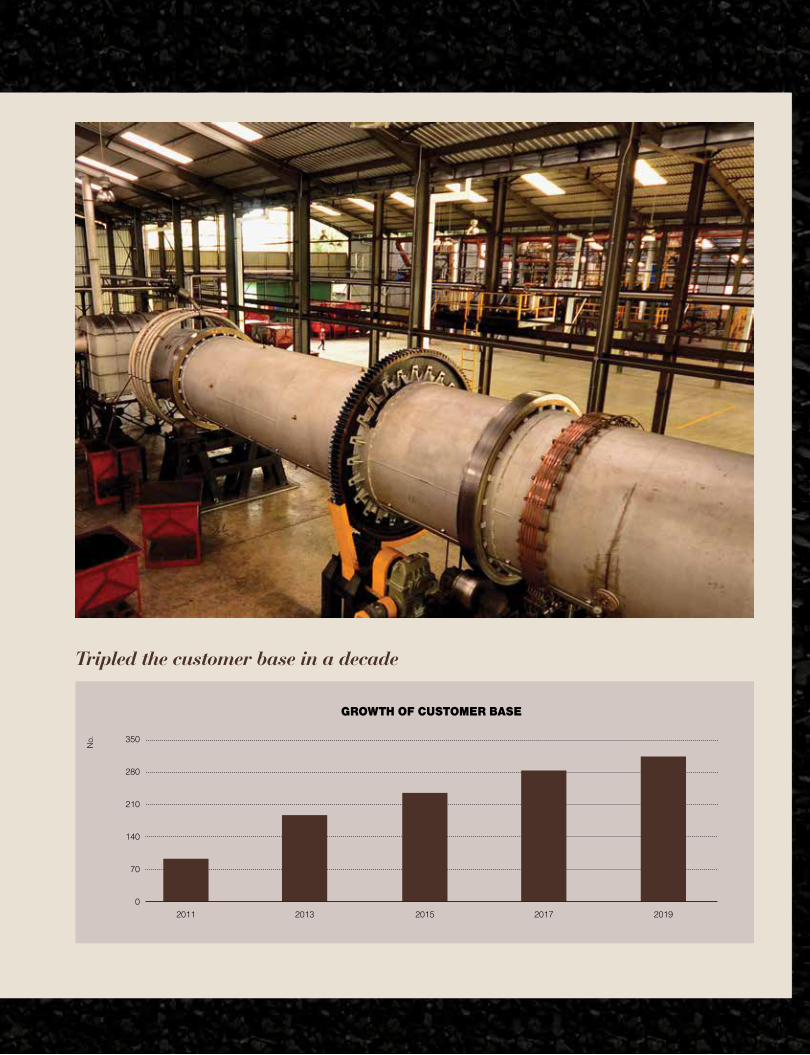
Tripled the customer base in a decade

HAY
CA
RB
PLC
Ann
ual R
epor
t 201
8/19
12
Strategy
FINANCIAL REVIEW
TURNOVER
REVENUE
(Rs.
mill
ion)
2014/15 2015/16 2016/17 2017/18 2018/19
24,000
20,000
16,000
12,000
8,000
4,000
The Haycarb Group recorded a significant increase in revenue of 35% to Rs. 20.9 billion (2017/18 – Rs. 15.5 billion). When discounted for the depreciation of the reporting currency, revenue has grown by 23% in USD terms. The activated carbon segment recorded a growth of 27% attributable to the increase in sales of the value added product portfolio and the increase in sales prices which were adjusted to compensate for the escalation of raw material costs during the year.
The Environmental Engineering sector recorded a significant growth of 113% in revenue over the last year in water and waste water treatment plants in Sri Lanka and the region.
GROUP PROFITABILITY
GROSS PROFIT
(Rs.
mill
ion)
2014/15 2015/16 2016/17 2017/18 2018/19
4,200
3,500
2,800
2,100
1,400
700
The GP increased by 31% compared to 2017/18 and the GP margin recorded was 19%. The inability to increase selling prices on par and on time with increasing raw material cost in Sri Lanka and Thailand impacted profit margins negatively in 2018/19. However, the stability in Indonesia cost structures, R&D and marketing initiatives to develop and commercialise value added products and the continued focus on lean initiatives supported the bottom line of the Group. On a macroeconomic context the depreciation of the Sri Lankan Rupee against the US Dollar resulted in higher revenue for Sri Lanka export sales although this impact was significantly offset by the importation of almost 40% of raw materials to Sri Lanka to mitigate the supply shortage during the year.
EBIT
(Rs.
mill
ion)
2014/15 2015/16 2016/17 2017/18 2018/19
2,000
1,600
1,200
800
400
0
Haycarb Group reported a profit before tax of Rs. 1,352.8 million (2017/18 – Rs. 926.4 million) and earnings before interest and tax of Rs. 1,649.1 million (2017/18 – Rs. 1,108.3 million).
OVERHEAD TO REVENUE RATIO(%
)
2014/15 2015/16 2016/17 2017/18 2018/19
15
12
9
6
3
0
The overhead cost to revenue ratio improved to 12% during the year under review due to the significant increase in revenue.
PAT
(Rs.
mill
ion)
2014/15 2015/16 2016/17 2017/18 2018/19
1,250
1,000
750
500
250
0
The interest cost has increased by 66% compared to FY 2017/18 to Rs. 311.9 million (2017/18 – Rs. 187.9 million).
The increase in revenue that resulted in higher debtor financing and substantial increases in inventory holding costs due to higher raw materials costs and strategic increases in raw material inventory to maintain stability of supplies to customers led to higher interest costs during the year.
Strategy Financial ReviewA
nnual Report 2018/19
HAYC
AR
B P
LC
13
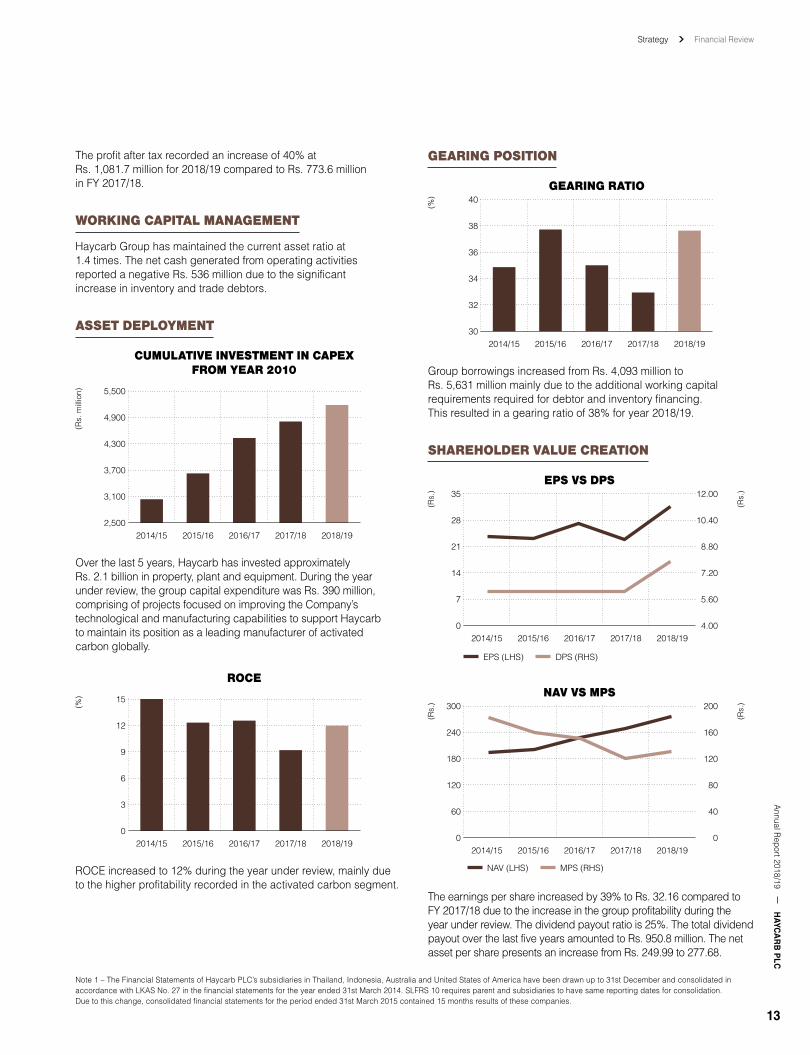
The profit after tax recorded an increase of 40% at Rs. 1,081.7 million for 2018/19 compared to Rs. 773.6 million in FY 2017/18.
WORKING CAPITAL MANAGEMENT
Haycarb Group has maintained the current asset ratio at 1.4 times. The net cash generated from operating activities reported a negative Rs. 536 million due to the significant increase in inventory and trade debtors.
ASSET DEPLOYMENT
CUMULATIVE INVESTMENT IN CAPEX FROM YEAR 2010
(Rs.
mill
ion)
2014/15 2015/16 2016/17 2017/18 2018/19
5,500
4,900
4,300
3,700
3,100
2,500
Over the last 5 years, Haycarb has invested approximately Rs. 2.1 billion in property, plant and equipment. During the year under review, the group capital expenditure was Rs. 390 million, comprising of projects focused on improving the Company’s technological and manufacturing capabilities to support Haycarb to maintain its position as a leading manufacturer of activated carbon globally.
ROCE
(%)
2014/15 2015/16 2016/17 2017/18 2018/19
15
12
9
6
3
0
ROCE increased to 12% during the year under review, mainly due to the higher profitability recorded in the activated carbon segment.
GEARING POSITION
GEARING RATIO
(%)
2014/15 2015/16 2016/17 2017/18 2018/19
40
38
36
34
32
30
Group borrowings increased from Rs. 4,093 million to Rs. 5,631 million mainly due to the additional working capital requirements required for debtor and inventory financing. This resulted in a gearing ratio of 38% for year 2018/19.
SHAREHOLDER VALUE CREATION
(Rs.
)
(Rs.
)
EPS VS DPS
2014/15 2015/16 2016/17 2017/18 2018/19
35
28
21
14
7
0
12.00
10.40
8.80
7.20
5.60
4.00
EPS (LHS) DPS (RHS)
(Rs.
)
(Rs.
)
NAV VS MPS
2014/15 2015/16 2016/17 2017/18 2018/19
300
240
180
120
60
0
200
160
120
80
40
0
NAV (LHS) MPS (RHS)
The earnings per share increased by 39% to Rs. 32.16 compared to FY 2017/18 due to the increase in the group profitability during the year under review. The dividend payout ratio is 25%. The total dividend payout over the last five years amounted to Rs. 950.8 million. The net asset per share presents an increase from Rs. 249.99 to 277.68.
Note 1 – The Financial Statements of Haycarb PLC’s subsidiaries in Thailand, Indonesia, Australia and United States of America have been drawn up to 31st December and consolidated in accordance with LKAS No. 27 in the financial statements for the year ended 31st March 2014. SLFRS 10 requires parent and subsidiaries to have same reporting dates for consolidation. Due to this change, consolidated financial statements for the period ended 31st March 2015 contained 15 months results of these companies.
Strategy Financial ReviewH
AYC
AR
B P
LCA
nnua
l Rep
ort 2
018/
19
14
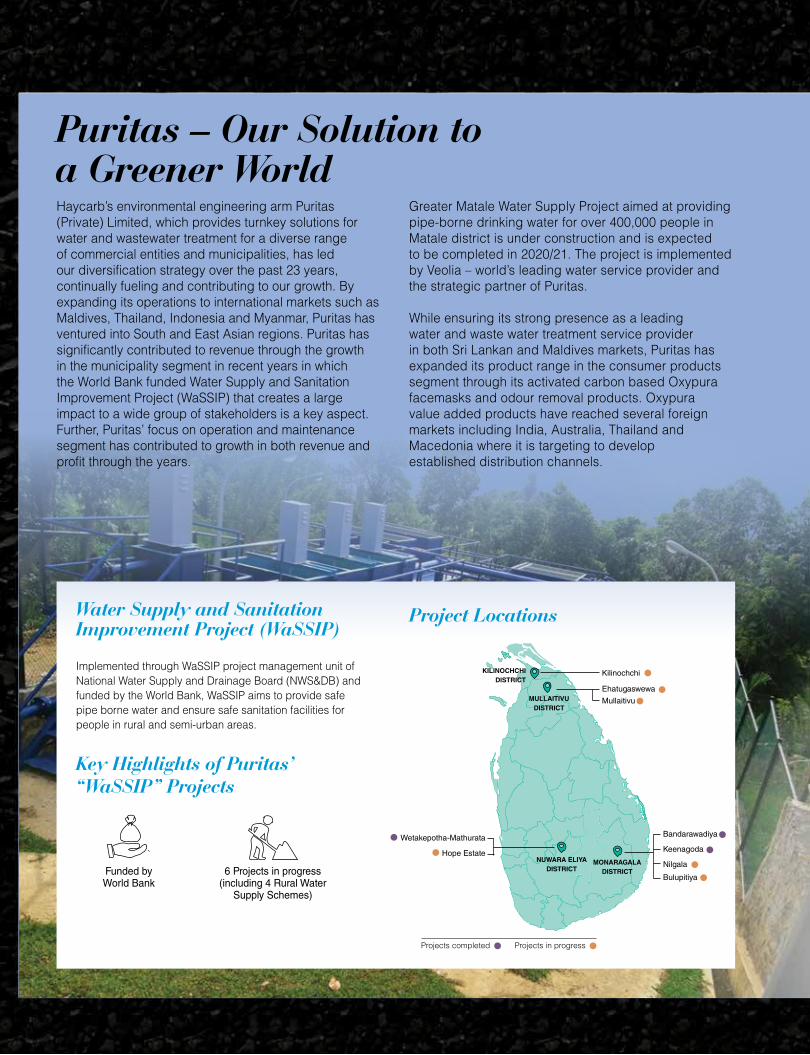
Project Locations
Wetakepotha-Mathurata
Hope Estate
Bandarawadiya
MONARAGALA DISTRICT
MULLAITIVU DISTRICT
KILINOCHCHI DISTRICT
NUWARA ELIYA DISTRICT
Keenagoda
Ehatugaswewa
Kilinochchi
Mullaitivu
Nilgala
Bulupitiya
Projects completed Projects in progress
Haycarb’s environmental engineering arm Puritas (Private) Limited, which provides turnkey solutions for water and wastewater treatment for a diverse range of commercial entities and municipalities, has led our diversification strategy over the past 23 years, continually fueling and contributing to our growth. By expanding its operations to international markets such as Maldives, Thailand, Indonesia and Myanmar, Puritas has ventured into South and East Asian regions. Puritas has significantly contributed to revenue through the growth in the municipality segment in recent years in which the World Bank funded Water Supply and Sanitation Improvement Project (WaSSIP) that creates a large impact to a wide group of stakeholders is a key aspect. Further, Puritas’ focus on operation and maintenance segment has contributed to growth in both revenue and profit through the years.
Puritas – Our Solution to a Greener World
Greater Matale Water Supply Project aimed at providing pipe-borne drinking water for over 400,000 people in Matale district is under construction and is expected to be completed in 2020/21. The project is implemented by Veolia – world’s leading water service provider and the strategic partner of Puritas.
While ensuring its strong presence as a leading water and waste water treatment service provider in both Sri Lankan and Maldives markets, Puritas has expanded its product range in the consumer products segment through its activated carbon based Oxypura facemasks and odour removal products. Oxypura value added products have reached several foreign markets including India, Australia, Thailand and Macedonia where it is targeting to develop established distribution channels.
Water Supply and Sanitation Improvement Project (WaSSIP)
Implemented through WaSSIP project management unit of National Water Supply and Drainage Board (NWS&DB) and funded by the World Bank, WaSSIP aims to provide safe pipe borne water and ensure safe sanitation facilities for people in rural and semi-urban areas.
Key Highlights of Puritas’ “WaSSIP” Projects
`Funded byWorld Bank
6 Projects in progress(including 4 Rural Water
Supply Schemes)

Strategy Financial ReviewA
nnual Report 2018/19
HAYC
AR
B P
LC
15
Global Presence of Oxypura Products
Maakurathu
Kaashidhoo
Omadhoo
Feeali
Maavah
Naifaru
Dharavandhoo
Gaafaru
Thoddoo Dhiffushi
Thulusdhoo
Maafushi
Rasdhoo
Mathiveri
Maamigili Felidhoo
DhiggaruNilandhoo
Meedhoo
Vilufushi
Guraidhoo
Thimarafushi
Gan
Fonadhoo
Muli
Thulhaadhoo
HanyaameedhooOxypura facemasks
Oxypura odour removal products
Macedonia
Sri Lanka
Thailand
Maldives
Australia
India
Oxypura Clipit car odour remover
On-going Infrastructure Development Projects in MaldivesProjectDescription
: Installation of Sewerage Systems for the six islands of Adh. Omadhoo, Adh. Hanyaameedhoo, F. Feeali, R. Maakurath, K. Kaashidhoo, and L. Maavah in the Republic of Maldives.
Client : Ministry of National Planning and Infrastructure
Status : On-going
Sewerage System in R. MaakurathuState: Raa Atoll
Sewerage System in K. KaashidhooState: Kaafu Atoll
Sewerage System in L. MaavahState: Laamu Atoll
Sewerage System in F. FeealiState: Faafu Atoll
Sewerage System in Adh. HanyaameedhooState: Alifu Dhaalu Atoll
Sewerage System in Adh. OmadhooState: Alifu Dhaalu Atoll

Strategy Financial ReviewH
AYC
AR
B P
LCA
nnua
l Rep
ort 2
018/
19
16
Puritas Sath Diyawara is an initiative providing clean drinking water for people in Northern and North Central Provinces, aiming at eradicating Chronic Kidney Disease (CKD). The initiative is Hayleys Group’s flagship CSR project and different sectors of the Group have contributed to reach more villages and cater the people in need of clean drinking water. Project includes setting up a 10,000 litres/day Reverse Osmosis drinking water treatment unit together with docking stations around the village, and a bowser mounted tractor. A library, Internet centre and model organic farms were also established at selected villages.
Rs. 64 million
Investment
1,162Number of CKD
Patients Benefited
33,593Number of People
Served
16Number of Projects
160,000Number of Litres ofWater Purified/Day
19Number of Villages
Catered

Strategy Financial ReviewA
nnual Report 2018/19
HAYC
AR
B P
LC
17
Puritas Sath Diyawara Projects in Operation
Village Number of FamiliesBenefited
Number of PeopleBenefited
Investment Status
D10, Maithreepura 500 1,542 Rs. 3.2 million Opened on 15th August 2014
Balayawewa 350 1,557 Rs. 3.5 million
Opened on 10th March 2015Kiriketuwewa and Sinhala Ataweerawewa 600 2,495 Rs. 3.6 million
Pihimbiyagollewa 300 2,153 Rs. 3.6 million
Nikawewa – Left 320 1,600 Rs. 4.2 millionOpened on 3rd September 2015
Billewa 450 1,953 Rs. 3.5 million
Thanthrimale 600 2,500 Rs. 3.9 million Opened on 15th November 2015
Parangiyawadiya 300 1,250 Rs. 3.5 million Opened on 20th November 2015
Ananthapuram, Sivanagar, Iranapalai 900 3,004 Rs. 4.3 million Opened on 11th March 2016
Neriyakulam 700 2,243 Rs. 4.3 million Opened on 30th April 2016
Nelumwewa 350 1,442 Rs. 4.3 million Opened on 29th April 2016
Rathmalgahawewa 700 2,112 Rs. 3.9 million Opened on 10th June 2016
Ulukkulama 500 1,579 Rs. 3.9 million Opened on 7th January 2017
Meegassegama 470 2,500 Rs. 4.65 millionOpened on 14th July 2017
Pahala Kedithokkuwa 400 2,097 Rs. 4.65 million
Dutuwewa 750 3,500 Rs. 4.65 million Opened on 25th August 2017
Total 7,990 33,593 Rs. 64 million
Strategy Financial ReviewH
AYC
AR
B P
LCA
nnua
l Rep
ort 2
018/
19
18
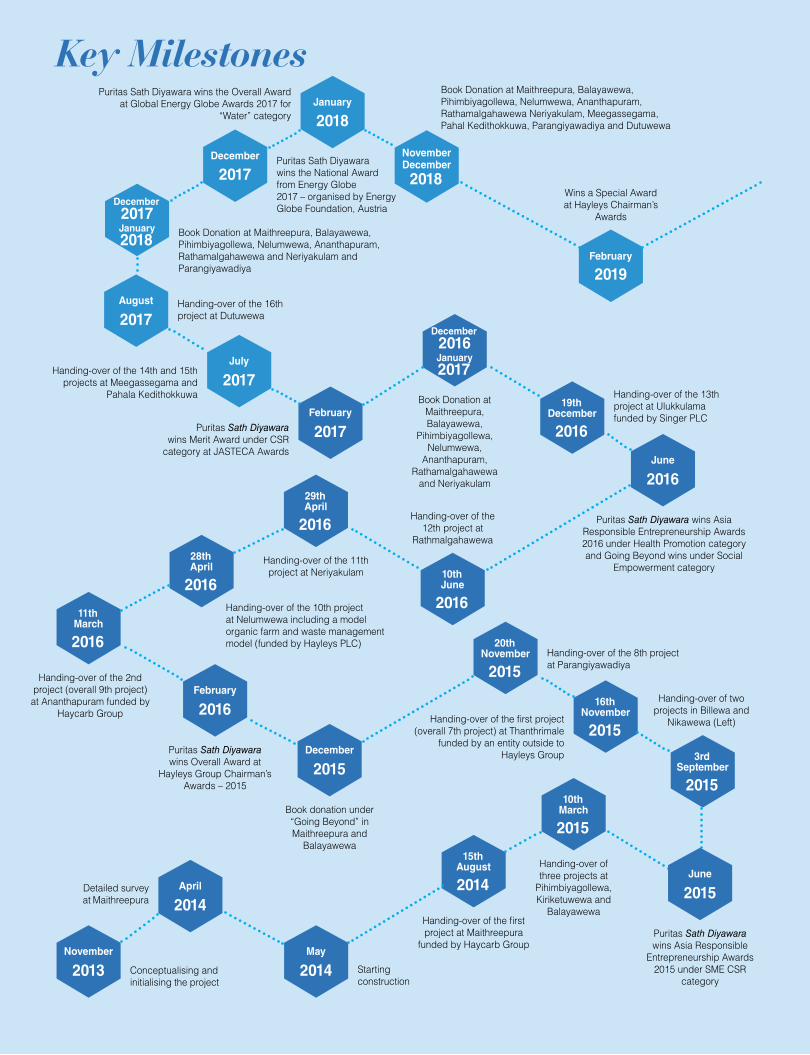
Key Milestones
November
2013
April
2014
May
2014
15th August
2014
3rd September
2015
16th November
2015
19th December
2016
20th November
2015
December
2015
10th June
2016
February
2016
June
2016
11th March
2016
28th April
2016
29th April
2016
December2016January2017
December2017January2018
February
2017
July
2017
August
2017
December
2017
January
2018
NovemberDecember
2018
February
2019
Conceptualising and initialising the project
Starting construction
Handing-over of three projects at
Pihimbiyagollewa, Kiriketuwewa and
Balayawewa
Puritas Sath Diyawara wins Asia Responsible
Entrepreneurship Awards 2015 under SME CSR
category
Puritas Sath Diyawara wins Overall Award at
Hayleys Group Chairman’s Awards – 2015
Handing-over of the 2nd project (overall 9th project) at Ananthapuram funded by
Haycarb Group
Handing-over of the 10th project at Nelumwewa including a model organic farm and waste management model (funded by Hayleys PLC)
Handing-over of the 11th project at Neriyakulam
Handing-over of the 12th project at
Rathmalgahawewa
Handing-over of the 13th project at Ulukkulama funded by Singer PLC
Book Donation at Maithreepura, Balayawewa,
Pihimbiyagollewa, Nelumwewa,
Ananthapuram, Rathamalgahawewa
and Neriyakulam
Puritas Sath Diyawara wins Merit Award under CSR
category at JASTECA Awards
Handing-over of the 14th and 15th projects at Meegassegama and
Pahala Kedithokkuwa
Handing-over of the 16th project at Dutuwewa
Book Donation at Maithreepura, Balayawewa, Pihimbiyagollewa, Nelumwewa, Ananthapuram, Rathamalgahawewa and Neriyakulam and Parangiyawadiya
Puritas Sath Diyawara wins the Overall Award at Global Energy Globe Awards 2017 for
“Water” category
Book Donation at Maithreepura, Balayawewa, Pihimbiyagollewa, Nelumwewa, Ananthapuram, Rathamalgahawewa Neriyakulam, Meegassegama, Pahal Kedithokkuwa, Parangiyawadiya and Dutuwewa
Puritas Sath Diyawara wins the National Award from Energy Globe 2017 – organised by Energy Globe Foundation, Austria
Wins a Special Award at Hayleys Chairman’s
Awards
Puritas Sath Diyawara wins Asia Responsible Entrepreneurship Awards 2016 under Health Promotion category and Going Beyond wins under Social
Empowerment category
Handing-over of two projects in Billewa and
Nikawewa (Left)
Book donation under “Going Beyond” in Maithreepura and
Balayawewa
Handing-over of the 8th project at Parangiyawadiya
Handing-over of the first project (overall 7th project) at Thanthrimale
funded by an entity outside to Hayleys Group
Handing-over of the first project at Maithreepura
funded by Haycarb Group
Detailed survey at Maithreepura
10th March
2015
June
2015

Strategy Financial ReviewA
nnual Report 2018/19
HAYC
AR
B P
LC
19
Haritha AngaraHaritha Angara is a community service project initiated by Haycarb which started in 2014 to propagate and empower our local charcoal suppliers to adopt pollution free charcoaling in Sri Lanka. The programme encourages converting traditional open pit charcoaling sites to environment-friendly manufacturing which eliminates the release of harmful gaseous emissions such as Carbon Dioxide (CO2 ), Methane and smoke to the environment, which are otherwise emitted during the traditional charcoaling process. Over the years Haycarb has supported 117 suppliers providing technical support and interest free funding to build new pits with combustion chambers and improve existing pits. This initiative has been wholeheartedly embraced by our suppliers, which is continuing on its successful 5th year.
Progress of Haritha Angara as at 2018/19
Total number of suppliers supported 117
Total number of pits constructed 170
Total investment Rs. 33.7 million
Going beyond...“Going Beyond” includes provision of school essentials to children living in the villages affected by Chronic Kidney Disease (CKD). The initiative was implemented for the third consecutive year in villages that benefited under Puritas Sath Diyawara and is funded by eight of Hayleys’ business sectors.
11Number of
Schools Catered
14Different items in
one pack on average
2,533Number of Children
Served
11Number of Villages
Catered
Rs. 4.5 million Investment for FY 2018/19
Haritha Angara charcoaling pit
Vertical kilns at Carbokarn Ltd., ThailandThe concept of promoting environment-friendly charcoaling was extended to Thailand through the vertical charcoaling kiln projects which commenced in 2015. Designed and built by Carbokarn and Haycarb in-house engineering teams,the project was initiated in Ratchaburi, Thailand with the capacity to manufacture 75 MT charcoal a day. It has now successfully expanded to several other locations in Thailand. At present, there are 32 kilns in Ratchaburi, 2 kilns in Chonburi and 4 kilns in Prachuap Province (owned by a supplier) in Thailand, totalling 38 kilns. Carbokarn plans to further broad base the environment-friendly charcoaling kilns to more locations in Thailand in the future.

Strategy Financial ReviewH
AYC
AR
B P
LCA
nnua
l Rep
ort 2
018/
19
20
Haycarb PLC maintains exemplary governance, sustainability and ethics within its core and its every strategy and action is informed by these fundamentals.
Governance and Compliance Financial ReviewA
nnual Report 2018/19
HAYC
AR
B P
LC
21
Board of Directors 22
Management Team 24
Corporate Governance 25
Annual Report of the Board of Directors on the Affairs of the Company 44
Statement of Directors’ Responsibility 48
Related Party Transactions Review Committee Report 49
Audit Committee Report 50
Governance and Compliance

HAY
CA
RB
PLC
Ann
ual R
epor
t 201
8/19
22
Governance and Compliance
BOARD OF DIRECTORS
MOHAN PANDITHAGEChairman & Chief Executive
Joined Hayleys Group in 1969. Appointed to the Board of Haycarb PLC in November 2007. Chairman & Chief Executive of Hayleys PLC since July 2009.
Fellow of the Chartered Institute of Logistics and Transport (UK). Honorary Consul of the United Mexican States (Mexico) to Sri Lanka. Council Member of the Employers’ Federation of Ceylon. Member of the Advisory Council of the Ceylon Association of Ships’ Agents. Recipient of the Best Shipping Personality award by the Institute of Chartered Shipbrokers; Excellence Leadership Recognition – Institute of Chartered Accountants of Sri Lanka; Honoured with lifetime achievement award at Sea-trade – Sri Lanka Ports, Trade and Logistics; Life time award for most outstanding Logistics and Transport personality of the year – Chartered Institute of Logistics & Transport.
RAJITHA KARIYAWASAN
Joined Haycarb and appointed to the Board in January 2010. Has overall responsibility for the Purification Products sector as the Managing Director of Haycarb PLC. Is also the Managing Director of Eco Solutions Sector whilst functioning as a Director of Dipped Products PLC and Hayleys Fibre PLC.
Appointed to the Hayleys Group Management Committee in February 2010 and to the Board of Hayelys PLC in June 2010. Appointed to the Board of Sri Lanka Institute of Nanotechnology (Private) Ltd., (SLINTEC) as a Nominee Director of Hayleys PLC in March 2019.
Holds a BSc Engineering (Electronics and Telecommunications) from the University of Moratuwa, Sri Lanka. Fellow Member of the Chartered Institute of Management Accountants, UK. Also a Six Sigma (Continuous Improvement Methodology) Black Belt, certified by the Motorola University, Malaysia. Before joining Hayleys, held the position of Director / General Manager of Ansell Lanka (Pvt) Ltd. Served as the Chairman of the Manufacturing Association of Export Processing Zone, Biyagama.
DHAMMIKA PERERA
Mr. Dhammika Perera is the quintessential strategist and business specialist with interests in a variety of key industries including manufacturing, banking & finance, leisure, aluminum extrusion, packaging, plantations, lifestyle, healthcare, consumer and hydropower generation. He has over 30 years of experience in building formidable businesses through unmatched strategic foresight and extensive governance experience gained through membership of the Boards of quoted and un-quoted companies.
Mr. Perera is the Chairman of Vallibel One PLC, Royal Ceramics Lanka PLC, Lanka Tiles PLC, Lanka Walltiles PLC, The Fortress Resorts PLC, Vallibel Power Erathna PLC, Greener Water Ltd, Unidil Packaging Ltd, Delmege Ltd, and LB Microfinance Myanmar Company Ltd. He is the Co-Chairman of Hayleys PLC, The Kingsbury PLC and Singer (Sri Lanka) PLC. Executive Deputy Chairman of LB Finance PLC, Deputy Chairman of Horana Plantations PLC. He is also an Executive Director of Vallibel Finance PLC and serves on the Boards of Amaya Leisure PLC, Haycarb PLC, Hayleys Fabric PLC & Dipped Products PLC.
ARJUN SENARATNA
Appointed to the Board in November 2005. Previously held senior positions with Amsterdam based TNT / TPG; including membership in the TNT Logistics Global Business Development Board. Has also been in senior / strategic roles with Celestica (former IBM Manufacturing), Ryder, Rockwell International, Canada Steamship Lines and Pepsi Cola. Holds a Bachelor of Science (BSc) from the University of Ceylon and is a Chartered Public Accountant CPA, CMA Canada.
SARATH GANEGODA
Joined Hayleys in March 2007 and was appointed to the Hayleys Group Management Committee in July 2007. Appointed to the Haycarb Board in November 2009. Fellow of the Institute of Chartered Accountants of Sri Lanka and
a Member of the Institute of Management Accountants of Australia. Holds a MBA from the Postgraduate Institute of Management, University of Sri Jayawardenepura. Worked for the Hayleys Group between 1987 and 2002. Subsequently he held several Senior Management Positions in large private sector entities in Sri Lanka and Overseas. Has responsibility for the Strategic Business Development unit of Hayleys PLC.
MS. JEEVANI ABEYRATNE
Served as the Chief Financial Officer of Haycarb Group from 2007 and was appointed to the Board in November 2009. Member of the Chartered Institute of Management Accountants (CIMA) – UK and holds a Masters in Law (LLM) from University of West London. Prior to joining Haycarb, served as the Technical Manager of CIMA (Sri Lanka Division) and as Group Finance Manager of Dipped Products PLC.
DR. SARATH ABAYAWARDANA
A professional Engineer, with a Ph.D. in Chemical Engineering from the University of London, he is a fellow of the Institution of Engineers Sri Lanka as well as the Institution of Chemical Engineers London, and was felicitated in 2011 with the “Excellence in Engineering” Award.
Had an extensive career at Unilever Sri Lanka including international postings, and finally as the National Technical Director and a Board Member. Headed the Sri Lanka Programme of the International Water Management Institute (IWMI) as a Senior International Researcher, and also acted as the Director of their Global Research Division. Was a consultant to the ADB project on Technical Education Development, and a key facilitator in developing the National Science and Technology Policy for the National Science and Technology Commission. He then worked as the Director/CEO, and a Board Member of the National Science Foundation of Sri Lanka, the primary state institution supporting Science and Technology development in the country, and recently retired as a Programme Director at the Co-ordinating Secretariat for Science, Technology and Innovation. Has held numerous Governing Board positions both in the public and the private sector institutions.

Governance and Compliance Board of DirectorsA
nnual Report 2018/19
HAYC
AR
B P
LC
23
SUJEEWA RAJAPAKSE
Appointed to the Board in January 2013. Managing Partner of BDO Partners, a firm of Chartered Accountants. Fellow of The Institute of Chartered Accountants of Sri Lanka and holds a Masters in Business Administration from the Postgraduate Institute of Management of the University of Sri Jayawardenepura.
Past President of The Institute of Chartered Accountants of Sri Lanka (ICASL). Serves as a Non-Executive Independent Director of Softlogic Life Insurance PLC, Dipped Products PLC and Hayleys Agriculture Holdings PLC. He is also a Director of UniDil Packaging Ltd., and Uni Dil Packaging and Solutions Ltd.
M.S.P. UDAYA KUMARA
Appointed to the Board in February 2015. Holds a B.Sc. (Hons.) First Class Degree from the University of Sri Jayawardenepura, Sri Lanka and is a Fellow Member of the Institute of Chemistry, Ceylon. He joined Haycarb in 1988 and has served in Quality Control, Special Product Development and Research and Development Divisions. He was appointed as a General Manager in 2010 and currently heads the Research and Development and Technical, Quality Assurance and Control functions of Haycarb Group.
BRAHMAN BALARATNARAJAH
Appointed to the Board in April 2015. Holds a Mechanical Engineering Degree (First Class) from the National Institute of Technology in India and is an Alumnus of the Indian Institute of Management, Ahmadabad. He is also a member of the American Society of Mechanical Engineers. Joined Haycarb in 1996 as a Maintenance Engineer, and the Haycarb Engineering Project Team in 1998 and appointed as the General Manager in 2010. He has headed the Recogen Operation from 2004 to 2010 and currently responsible for Engineering Projects and all Manufacturing operations of Haycarb Group.
MS. SHARMILA RAGUNATHAN
Appointed to the Board in 2016. Holds a B.Eng. (Hons.) in Electronics Systems Engineering (UK) and a MBA from the University of Colombo. Joined Hayleys Group in October 1996 as a Management Trainee working in Hayleys Electronics, Hayleys Electronics (Lighting) and Hayleys Industrial Solutions. She joined Haycarb PLC in 2010 and was appointed as a Director of Puritas (Pvt) Ltd., in the same year. Head of Environmental Engineering arm of Haycarb Group and is also responsible for Hayleys Group’s CSR Initiative “Puritas Sath Diyawara”.
ALI ASGAR MUNAVER CADERBHOY
Appointed to the Board in 2016. Holds a Master of Arts (Hons.) in Economics and Management from the University of Aberdeen (UK).
Joined Haycarb PLC in 1997 as a Management Trainee and was appointed as the General Manager Business Development for the Haycarb Group in 2010. He has led the establishment of a number of key manufacturing projects in Sri Lanka and Indonesia and successfully expanded distribution networks into new market segments for the company. Mr. Caderbhoy currently heads the Business Development Division of Haycarb Group focusing on developing new market segments, sales and distribution channels and lines of business.
JAMES NAYLOR
Appointed to the Board in 2016. Holds a B.Sc. in Physics and Astrophysics from the University of Birmingham and holds a Certificate in Company Direction from the Institute of Directors (UK).
Joined Eurocarb Products Ltd., (UK) as the Commercial Director / Chief Operating Officer in 2008. Prior to his appointment he has held senior marketing positions in Avon Rubber PLC and Scott Safety. Mr. Naylor is a former Board Director of the International Society for Respiratory Protection and also a former Board Member of the Industry Group NBC UK. He was appointed as the Managing Director of Eurocarb Products Ltd., in 2010.
MS. YOGADINUSHA BHASKARAN(Alternate Director to Mr. Dhammika Perera)
Ms. Yogadinusha Bhaskaran is a Financial and Accounting professional currently serving as the Chief Executive Officer of Vallibel One PLC. She also presently serves on the Board of Delmege Ltd., as a Director, LB Finance PLC, as a Non-Executive Director and Chairperson of Audit Committee, Hayleys Fabric PLC, Haycarb PLC and Dipped Products PLC as Alternate Director to Mr. Dhammika Perera.
Ms. Yogadinusha Bhaskaran has previously worked as a Financial Controller with several Australian companies in Melbourne for a number of years. She has in the past served as the Assistant General Manager (Finance & Planning) at Pan Asia Banking Corporation PLC.
She is a Fellow of the Chartered Institute of Management Accountants UK (FCMA), Fellow of CPA Australia (FCPA) and an Associate Member of the Institute of Bankers, Sri Lanka.
MOHAMED HISHAM JAMALDEEN
He is a finance professional with over 17 years of experience and a seasoned commercial property investor and advisor. He is a Fellow of the Association of Certified Chartered Accountants, UK and holds a Degree in Engineering and Business from the University of Warwick, UK. He is the Founding Managing Director of Steradian Capital Investments (Pvt) Ltd., responsible for Financing, Corporate Structuring, Acquisitions and Development.
He serves as a Director of Singer (Sri Lanka) PLC, Singer Industries (Ceylon) PLC, Hayleys PLC, Talawakelle Tea Estates PLC, Haycarb PLC, Regnis Lanka PLC and Lanka Realty Investments PLC. He is also Executive Director of numerous real estate companies focusing on commercial property investment and development.

HAY
CA
RB
PLC
Ann
ual R
epor
t 201
8/19
24
Governance and Compliance
MANAGEMENT TEAM
HAYCARB (SRI LANKA)
Executive DirectorsA.M. Pandithage – ChairmanH.S.R. Kariyawasan – Managing DirectorMs. M.J.A.S. Abeyratne – Director (Finance and IT)M.S.P. Udaya Kumara – Director (Research & Development and Technical Support) B. Balaratnarajah – Director (Manufacturing & Engineering) A.A.M. Caderbhoy – Director (Business Development)Ms. S.S. Ragunathan – Director (Environmental Engineering)J.D. Naylor – Director (Head of Eurocarb Products Ltd. – UK)
Deputy General ManagersS.P. Weerawardane – Production PlanningN.S. Perera – Charcoal & Shell ProcurementL.R.M.R.A.L. Karunaratne – Customer ManagementG.M.G. Gunawardhana – Manufacturing (Sri Lanka)
Divisional ManagersI.A.S.L. Athukorala – R&D / Process Improvement [Puritas (Pvt) Ltd.]C.J.G.M. Korale – Engineering ProjectsJ.D. Shishira – Research and Development G.A.D.N.U. Samaranayake – Research and DevelopmentP.M.S.M. Ranasinghe – Quality AssuranceW.G.A.P. Gamage – Factory Manager (Madampe)A.S.D. Karunaratne – Human Resource ManagementA.D. Kularatne – Engineering Procurement M.L. Wickramasinghe – Project Engineering & Purification [Puritas (Pvt) Ltd.]W.M.P.A.B. Weerakoon – Deputy Financial ControllerP.S. Liyanaarachchi – Customer ManagementC.R. Kobbekaduwe – Customer ManagementL.I. Adhihetty – Business Development
Departmental Managers L.P.S. Seneviratne – Engineering Projects H.H.B. Senanayake – Business Development [Puritas (Pvt) Ltd.]L.A. Wickramasekara – Charcoal & Shell ProcurementH.S. Kumara – Production (Badalgama) D.M. Senaratne – Engineering ProjectsP.T.R. Dharshana – Production (Madampe)N.G.C.B. Dharmadasa – Raw Material Procurement, Indonesia / Sri LankaM.S.L. Moraes – Production PlanningR.M.G. Ranathunga – Engineering Maintenance (Badalgama)A.G.L. Kokila – Project Engineering, Civil & Structural [Puritas (Pvt) Ltd.]Ms. R.C. Jayawardena – Information Technology P.A.A.U. Pathiraja – Finance
S. Gurusinghe – Procurement, R&D L.M. Hapuarachchi – Quality Management SystemsM.I.A. Munasinghe – Quality ControlH.A.N.P. Kumara – Production (Badalgama) S. Samarajeeva – Engineering Maintenance (Madampe)G.D.S. Ganegoda – O & M Solutions [Puritas (Pvt) Ltd.]Ms. P.P. Premaratne – FinanceT.P.Y.C. Tennakoon – Finance & Business Development [Puritas (Pvt) Ltd.]
OVERSEAS SUBSIDIARIES
MARKETINGEurocarb Products Ltd.J.D. Naylor – Managing Director R. Bittel – Director Sales S. Pickford – Operations Manager
Haycarb Holdings Australia (Pty) Ltd.M. Marques – Director/Chief Operating OfficerB.P.R. Liyanage – Director Operations
Haycarb USA Inc.A.S. Pathirathna – Vice PresidentM. Potok – Director Sales
MANUFACTURING Carbokarn Co. Ltd.P. Karnchanabatr – Managing DirectorB. Karnchanabatr – Deputy Managing DirectorK. Karnchanabatr – DirectorT. Karnchanabatr – Director (Local Sales and Marketing)W.P.J.K. Wickramasinghe – General Manager Ms. C. Techatipmanee – Finance ManagerMs. Y. Singhapoom – Accounting ManagerU.S.S. Udugampala – Manager – Quality Assurance K.U.S. Warnajith – Plant Manager (Shizuka Co. Ltd.)
PT Mapalus Makawanua Charcoal IndustryU.A.N.D. Rupasinghe – General ManagerMs. T. Ente – Administration Manager R.K.L. Jinasiri – Manager – Engineering Maintenance
PT Haycarb Palu MitraN.T. Hettiarachchi – Factory Manager
Annual R
eport 2018/19H
AYCA
RB
PLC
25
Governance and Compliance
CORPORATE GOVERNANCE
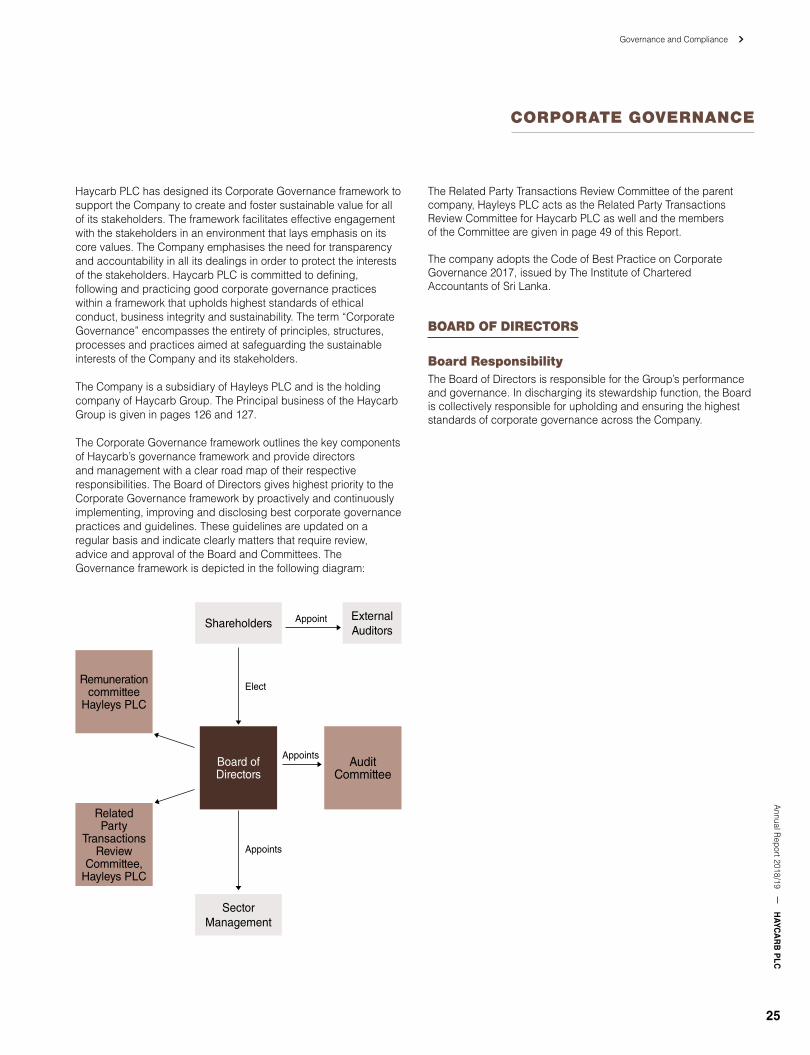
Haycarb PLC has designed its Corporate Governance framework to support the Company to create and foster sustainable value for all of its stakeholders. The framework facilitates effective engagement with the stakeholders in an environment that lays emphasis on its core values. The Company emphasises the need for transparency and accountability in all its dealings in order to protect the interests of the stakeholders. Haycarb PLC is committed to defining, following and practicing good corporate governance practices within a framework that upholds highest standards of ethical conduct, business integrity and sustainability. The term “Corporate Governance” encompasses the entirety of principles, structures, processes and practices aimed at safeguarding the sustainable interests of the Company and its stakeholders.
The Company is a subsidiary of Hayleys PLC and is the holding company of Haycarb Group. The Principal business of the Haycarb Group is given in pages 126 and 127.
The Corporate Governance framework outlines the key components of Haycarb’s governance framework and provide directors and management with a clear road map of their respective responsibilities. The Board of Directors gives highest priority to the Corporate Governance framework by proactively and continuously implementing, improving and disclosing best corporate governance practices and guidelines. These guidelines are updated on a regular basis and indicate clearly matters that require review, advice and approval of the Board and Committees. The Governance framework is depicted in the following diagram:
Related Party
Transactions Review
Committee, Hayleys PLC
Remuneration committee
Hayleys PLC
Audit Committee
Board of Directors
Sector Management
ShareholdersExternal Auditors
Appoint
Elect
Appoints
Appoints
The Related Party Transactions Review Committee of the parent company, Hayleys PLC acts as the Related Party Transactions Review Committee for Haycarb PLC as well and the members of the Committee are given in page 49 of this Report.
The company adopts the Code of Best Practice on Corporate Governance 2017, issued by The Institute of Chartered Accountants of Sri Lanka.
BOARD OF DIRECTORS
Board ResponsibilityThe Board of Directors is responsible for the Group’s performance and governance. In discharging its stewardship function, the Board is collectively responsible for upholding and ensuring the highest standards of corporate governance across the Company.

Governance and Compliance Corporate GovernanceH
AYC
AR
B P
LCA
nnua
l Rep
ort 2
018/
19
26
Composition and Attendance at MeetingsAs at 31st March 2019, the Board comprised of fourteen Directors; six Non-Executive Directors and eight Executive Directors. The names of these Directors are given below and a short profile of each is given in pages 22 and 23 of this Annual Report. The details of Directors’ shareholding and directorates in other companies are given in pages 123 and 126 respectively.
The Board meets quarterly as a matter of routine and additional meetings are held where necessary. During the year the Board met four times and attendance at these meetings are given below:
Name of Director Executive/Non-Executive Attendance
Mr. Mohan Pandithage (Chairman) Executive 4/4
Mr. Rajitha Kariyawasan (Managing Director) Executive 3/4
Mr. Dhammika Perera Non-Executive 1/4
Mr. Arjun Senaratna* Independent Non-Executive 4/4
Mr. Sarath Ganegoda Non-Executive 4/4
Ms. Jeevani Abeyratne*** Executive 4/4
Dr. Sarath Abayawardana Independent Non-Executive 3/4
Mr. Sujeewa Rajapakse Independent Non-Executive 4/4
Mr. M.S.P. Udaya Kumara Executive 4/4
Mr. Brahman Balaratnarajah Executive 4/4
Mr. Ali Asgar Munaver Caderbhoy Executive 4/4
Ms. Sharmila Ragunathan Executive 4/4
Mr. James Naylor* Executive 4/4
Ms. Yogadinusha Bhaskaran (alternate to Mr. Dhammika Perera)** 3/4
Mr. Hisham Jamaldeen Independent Non-Executive 2/4
* Mr. Senaratna and Mr. Naylor participated in these meetings via conference call facility
** Ms. Bhaskaran attended two meetings to represent Mr. Dhammika Perera as his alternative.
*** Ms. Abeyratne attended one meeting via conference call facility
Reference to ICASL code
Requirement Compliance Details of Compliance
SECTION 1: THE COMPANY
A. Directors
Principle: A.1 The Board
The Board consisted of fourteen Directors – six Non-Executive Directors and eight Executive Directors including the Chairman as at the end of the year under review.
A.1.1 Board meetings Complied The Board meets quarterly basis with special meetings convened if and when need arises. During the year under review the Board met on four occasions. Details of meetings of the Board and Attendance of the members are set out above.
The information is provided to the Board on a structured manner and regular basis as agreed by the Board.

Governance and Compliance Corporate GovernanceA
nnual Report 2018/19
HAYC
AR
B P
LC
27
Reference to ICASL code
Requirement Compliance Details of Compliance
Information to be reported to the Board includes; Financial and operational results on pre agreed Key Performance Indicators Financial performance compared to previous periods, budgets and targets Impact of risk factors on financial and operating results and actions to mitigate such risks
*Share trading of the Company and related party transactions by Key Management Personnel Compliance with laws and regulations and any non-compliances Internal control review Any other matters the board should be aware of
The minutes of the previous Board meeting and above information are distributed among the Members 7 days prior to the meeting.
A.1.2 Responsibilities of the Board
Complied The Board Charter sets out the responsibility of the Board. The Board is responsible to the shareholders for creating and delivering long term sustainable shareholder value through the entrepreneurial leadership.
The Board is responsible to: Providing direction and guidance to the Company promoting the sustainable long term success of the Company and enhance shareholders value. Appointing and reviewing the performance of the Chairman and Managing Director. Ensure Executive Directors and key management team possesses the skills, experience and knowledge to implement strategy effectively, with proper succession arrangements in place.
*Ensure Executive Directors have the skills, experience and knowledge to implement strategy effectively, and adopt key management personnel succession strategy.
*Formulate and communicate business policy and strategy to assure sustained growth and to monitor its implementation within a framework of sustainable business development Approve any change in the Group’s business portfolio and sanction major investments and disinvestments in accordance with parameters set. Reviewing, approving and monitoring annual corporate plans, corporate budgets, capital expenditure Ensure effective systems to secure the integrity of information, internal controls, business continuity and risk management Ensure compliance with laws, regulations and ethical standards Ensure all stakeholder interests are considered in corporate decisions Set and communicate values/standards, with adequate attention being paid to accounting policies/practices and fostering compliance with financial regulations Adequacy and the integrity of the Internal control systems over financial reporting and management Information Systems are reviewed by the Board Audit Committee Determining any changes to the discretions/authorities delegated from the Board to the key management team Exercise accountability to shareholders and relevant stakeholders
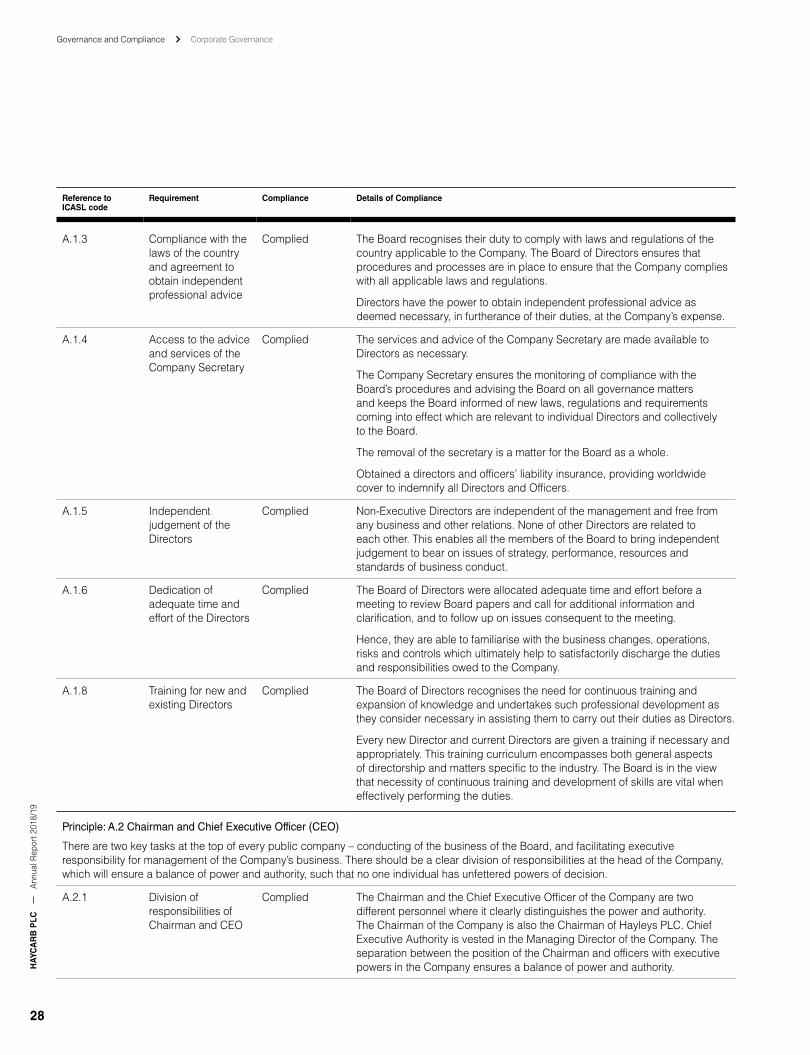
Governance and Compliance Corporate GovernanceH
AYC
AR
B P
LCA
nnua
l Rep
ort 2
018/
19
28
Reference to ICASL code
Requirement Compliance Details of Compliance
A.1.3 Compliance with the laws of the country and agreement to obtain independent professional advice
Complied The Board recognises their duty to comply with laws and regulations of the country applicable to the Company. The Board of Directors ensures that procedures and processes are in place to ensure that the Company complies with all applicable laws and regulations.
Directors have the power to obtain independent professional advice as deemed necessary, in furtherance of their duties, at the Company’s expense.
A.1.4 Access to the advice and services of the Company Secretary
Complied The services and advice of the Company Secretary are made available to Directors as necessary.
The Company Secretary ensures the monitoring of compliance with the Board’s procedures and advising the Board on all governance matters and keeps the Board informed of new laws, regulations and requirements coming into effect which are relevant to individual Directors and collectively to the Board.
The removal of the secretary is a matter for the Board as a whole.
Obtained a directors and officers’ liability insurance, providing worldwide cover to indemnify all Directors and Officers.
A.1.5 Independent judgement of the Directors
Complied Non-Executive Directors are independent of the management and free from any business and other relations. None of other Directors are related to each other. This enables all the members of the Board to bring independent judgement to bear on issues of strategy, performance, resources and standards of business conduct.
A.1.6 Dedication of adequate time and effort of the Directors
Complied The Board of Directors were allocated adequate time and effort before a meeting to review Board papers and call for additional information and clarification, and to follow up on issues consequent to the meeting.
Hence, they are able to familiarise with the business changes, operations, risks and controls which ultimately help to satisfactorily discharge the duties and responsibilities owed to the Company.
A.1.8 Training for new and existing Directors
Complied The Board of Directors recognises the need for continuous training and expansion of knowledge and undertakes such professional development as they consider necessary in assisting them to carry out their duties as Directors.
Every new Director and current Directors are given a training if necessary and appropriately. This training curriculum encompasses both general aspects of directorship and matters specific to the industry. The Board is in the view that necessity of continuous training and development of skills are vital when effectively performing the duties.
Principle: A.2 Chairman and Chief Executive Officer (CEO)
There are two key tasks at the top of every public company – conducting of the business of the Board, and facilitating executive responsibility for management of the Company’s business. There should be a clear division of responsibilities at the head of the Company, which will ensure a balance of power and authority, such that no one individual has unfettered powers of decision.
A.2.1 Division of responsibilities of Chairman and CEO
Complied The Chairman and the Chief Executive Officer of the Company are two different personnel where it clearly distinguishes the power and authority. The Chairman of the Company is also the Chairman of Hayleys PLC. Chief Executive Authority is vested in the Managing Director of the Company. The separation between the position of the Chairman and officers with executive powers in the Company ensures a balance of power and authority.

Governance and Compliance Corporate GovernanceA
nnual Report 2018/19
HAYC
AR
B P
LC
29
Reference to ICASL code
Requirement Compliance Details of Compliance
Principle: A.3 Chairman’s Role
The Chairman’s role in preserving good Corporate Governance is crucial. As the person responsible for running the Board, the Chairman should preserve order and facilitate the effective discharge of Board functions.
A.3.1 Chairman's role Complied The Chairman’s role involves:
*Conducting of Board meetings ensuring effective participation of both Executive and Non-Executive Directors. The Chairman plays a key role in preserving good corporate governance. Approving the agenda for each meeting prepared in consultation with the managing Director and the Company Secretary taking in to consideration matters relating to strategy, performance, resource allocation, risk management and compliance. Sufficiently detailed information of matters included in the agenda should be provided to the Directors in a timely manner. Ensuring that all directors are aware of their duties and responsibilities. All Directors are encouraged to seek information considered necessary to discuss matters on the agenda of meetings and to request inclusions of matters of corporate concern on the agenda. Maintaining the balance of power between Executive and Non-Executive Directors. The view of Directors on issues under consideration are ascertained. The Board is in complete control of the company’s affairs and alert to its obligations to all shareholders and other stakeholders.
Principle: A.4 Financial Acumen
The Board should ensure the availability within it, of those with sufficient financial acumen and knowledge to offer guidance on matters of finance.
A.4 Financial acumen Complied The Board includes six Chartered/Management/Certified Public Accountants who possess the necessary knowledge and competence to offer the Board guidance on matters of finance. One of them serves as Chairman of the Audit Committee. The Board is with sufficient financial acumen and knowledge to offer guidance on matters of finance.
Principle: A.5 Board Balance
It is preferable for the Board to have a balance of Executive and Non-Executive Directors such that no individual or small group of individuals can dominate the Board’s decision making.
A.5.1 Non-Executive Directors
Complied Six out of fourteen Directors on the Board are Non-Executive Directors. The composition of the Executive and Non-Executive Directors (the latter are over one third of the total number of Directors), satisfies the requirements laid down in the Listing Rules of the Colombo Stock Exchange. The Chairman and the Managing Director is not the same person.
A.5.2 Independence of Non- Executive Directors
Complied Four out of six Non-Executive Directors are independent. The Board has determined that four Non-Executive Directors satisfy the criteria for “independence” set out in the Listing Rules.

Governance and Compliance Corporate GovernanceH
AYC
AR
B P
LCA
nnua
l Rep
ort 2
018/
19
30
Reference to ICASL code
Requirement Compliance Details of Compliance
A.5.3 Independence of Non- Executive Directors
Complied Non-Executive Directors’ profiles reflect their calibre and the weight their views carry in Board deliberations. Each is independent of management and free from any relationship that can interfere with independent judgement. The balance of Executive, Non-Executive and Independent Non-Executive Directors on the Board ensures that no individual Director or small group of Directors dominates board discussion and decision making.
A.5.4 Annual declaration of independence – Non-Executive Directors
Complied Each Non-Executive Director has been submitted declaration stating the independence or non-independence in a prescribed format. This information is made available to the Board.
A.5.5 Board determination of independence of Non-Executive Directors and disclosure in Annual Report
Complied The Board considered the declaration of independence submitted by each Non-Executive Director with the basis for determination given in Code of Best Practices as a fair representation and will continue to evaluate their independence on this basis annually. The Board believes the Independence of Mr. A.M. Senarathna is not compromised by being a Board member for more than nine years. The Board is of the opinion that Mr. M.H. Jamaldeen has the capability to conduct himself in an independent and impartial manner on matters deliberated by the Board and his independence will not be affected by his spouse, Mrs. J. Jamaldeen being a Director of the Kingsbury PLC, a subsidiary of Hayleys PLC.
Brief resume of all the Directors is available in pages 22 and 23.
A.5.7, A.5.8 Requirement to appoint Senior Independent Director
Not Applicable This is not applicable as the Chairman and the Managing Director is not the same person.
A.5.9 Chairman’s meetings with Non-Executive Directors
Complied The Chairman holds meeting with the Non-Executive Directors, without Executive Directors, at least once in each year and at any other time where necessary.
A.5.10 Record in the Board minutes of Concerns not unanimously resolved
Complied All matters of the Company are recorded in the Board Minutes, with sufficient detail to enable a proper assessment to be made of the deliberation and any decisions taken at the meeting.
Principle: A.6 Supply of Information
A.6.1 Timely information to the Board
Complied The Board is provided with appropriate and timely information. The Directors are provided with quarterly reports on performance, minutes of committee meetings and such other reports and documents as necessary. In addition to the standard information additional adhoc information and analysis are made available to the Directors on request. The Chairman ensures that all Directors are adequately briefed on issues arising at meetings.
A.6.2 Information provided in advance to the Board meetings
Complied The Board meetings are arranged in advance and all Directors are informed. The Directors are provided with minutes, the agenda and the Board papers in advance to prepare and clearly comprehend with the matters discussed or consent.

Governance and Compliance Corporate GovernanceA
nnual Report 2018/19
HAYC
AR
B P
LC
31
Reference to ICASL code
Requirement Compliance Details of Compliance
Principle: A.7 Appointments to the Board
A.7.1, A.7.2 Appointment to the Board
Complied Hayleys PLC, the Parent company’s Nominations Committee functions as the Nominations Committee of the Company and makes recommendations to the Board on all new Board appointments.
The Nomination Committee comprises following members. A.M. Pandithage* – ChairmanDhammika Perera**Dr. H. Cabral, PC***
*Executive Director**Non-Executive Director***Independent Non-Executive Director
The Board annually assesses the Board composition to ascertain whether the combined knowledge and experience of the Board matches the strategic demands facing the Company.
A.7.3 Disclosure of new appointments
Complied A brief resume of the Director, nature of his/her experience and names of the companies he/she holds the directorship and the independency is informed to the Colombo Stock Exchange and disclose in the Annual Report on pages 22 and 23.
Principle: A.8 Re-election
A.8.1, A.8.2 Re-election of Directors
Complied The provisions of the Company’s Articles require a Director appointed by the Board to hold office until the next Annual General Meeting, and seek re-election by the shareholders at that meeting.
The Articles call for one third of the Directors in office to retire at each Annual General Meeting. The Directors who retire are those who have served for the longest period after their appointment/re-appointment. Retiring Directors are generally eligible for re-election.
The Managing Director does not retire by rotation.
Principle: A.9 Appraisal of Board Performance
A.9.1, A.9.2, A.9.3
Appraisal of Board Performance
Complied The performance of the Board and Subcommittees is evaluated annually on self-assessment basis.
Principle: A.10 Disclosure of Information in Respect of Directors
A.10.1 Disclosures aboutDirectors
Complied Name, qualification, brief profile and nature of expertise are given in the pages22 and 23 of this Annual Report.
Directors’ interest in contracts is given on Note 30 of this Report. The Number of Board meetings attend by the Directors is available in the page 26 of this Report.
Principle: A.11 Appraisal of Chief Executive Officer
A.11.1, A.11.2 Evaluation the performance of the CEO
Complied The short, medium and long-term objectives including financial and non-financial targets that should meet by the CEO are set and evaluate at the commencement of each fiscal year. The performances were evaluated in each quarter and ascertain whether the targets were achieved or achievement is reasonable in the circumstances.

Governance and Compliance Corporate GovernanceH
AYC
AR
B P
LCA
nnua
l Rep
ort 2
018/
19
32
Reference to ICASL code
Requirement Compliance Details of Compliance
B. Directors Remuneration
Principle: B.1 Remuneration Procedure
B.1.1, B.1.2, B.1.3, B.1.4, B.1.5
Establishmentof Remuneration Committee
Complied The Remuneration Committee is constituted as per the Guidelines of the Listing Rules of the CSE. The Remuneration Committee of Hayleys PLC, the Parent Company acts as the Committee and is responsible to overlook the aspects of remuneration of the Company.
The Remuneration Committee of Hayleys PLC consists of the following Non-Executive Directors:
Dr. H. Cabral, PC-Chairman (Independent Non-Executive)
Mr. Dhammika Perera – Member (Non-Executive)
Mr. M.H. Jamaldeen – Member (Non-Executive)
Mr. M.Y.A. Perera – Member (Non-Executive)
Payment of remuneration to Directors is disclosed in page 44 of this report.
Principle: B.3 Disclosure of the Remuneration
B.3.1 Disclosure of the remuneration
Complied The names of the Directors of the Remuneration Committee are given under section B.1.2 above.
The remuneration policy is to attract and retain a highly qualified and experienced work force, and reward performance accordingly in the backdrop of industry norms. These compensation packages provide compensation appropriate for each business within the Group and commensurate with each employee’s level of expertise and contribution, bearing in mind the business’ performance and shareholder return.
The total of Directors’ Remuneration is reported in Note 8.2 to the Financial Statements.
C. Relations with Shareholders
Principle: C.1 Constructive use of the AGM and conduct of General Meetings
C.1.1 Notice of AGM Complied The notice and the agenda of the Annual General Meeting together with the Annual Report with all other relevant documents are sent to the shareholders.
C.1.2 Separate resolution for substantially separate items
Complied A separate resolution is proposed at an Annual General Meeting on each substantially separate item.
Adoption of the Annual Report of the Board of Directors on the affairs of the Company, Statement of Compliance and the Financial Statements with the Independent Auditor’s Report is considered as a separate resolution.
A Form of Proxy is provided with the Annual Report to all shareholders to direct their proxy to vote.
C.1.3 Votes and use of proxy Complied The Company ensures that all proxy votes are properly recorded and counted. The level of proxies lodged on each resolution is conveyed to the Chairman.

Governance and Compliance Corporate GovernanceA
nnual Report 2018/19
HAYC
AR
B P
LC
33
Reference to ICASL code
Requirement Compliance Details of Compliance
C.1.4 Answer questions at the Annual General Meeting (AGM)
Complied The Board arranges the Chairman of the Audit Committee to be available to answer queries at the AGM when necessary. Shareholders may bring up their concerns as appropriate with the Managing Director or the Company Secretary as appropriate.
Principle: C. Communication with Shareholders
C.2.1, C.2.2 Channel to reach all shareholders of the company
Complied The modes of communication between the company and the shareholders are the Annual Reports, Quarterly Financial Statements, and Interim Reports, announcements made through the Colombo Stock Exchange, other press releases and Annual/Extraordinary General Meetings.
The soft version of the Annual Report is posted on the company website as soon as they have been released to the Stock Exchange. The website posts news and latest updates of the company.
The active participation of shareholders at the Annual General Meeting is encouraged. The Board believes the AGM is a means of continuing effective dialogue with shareholders.
The Board offers clarifications and responds to concerns shareholders have over the content of the Annual Report as well as other matters which are important to them. The AGM is also used to adopt the financial statements for the year.
Company secretaries answer queries which are being made by the shareholders where necessary
C.2.3 Implementation of the policy and methodology for communication with shareholders
Complied In terms of the CSE Listing Rules, Annual Reports are issued in CD form. However a shareholder could be provided with a printed copy of the Annual Report if requested in writing to do so.
A copy of the interim financial statements are released to the Colombo Stock Exchange and posted on their website. Copies of all public announcements are made available to the CSE for dissemination to the public.
C.2.4 Disclosure of contact person
Complied Shareholders can forward their inquiries via electronic media (e-mail, telephone call or in writing) to the relevant person to raise queries. The contact person for such communication is the Company Secretary.
C.2.5 Major issues and concerns of shareholders
Complied All the major issues relating to shareholders are brought to the attention of theBoard.
C.2.6 Person to be contacted with regard to shareholders’ matters
Complied The Company secretary holds the responsibility to be contacted in relation to shareholder’s matters.
C.2.7 Process for responding to shareholder matters
Complied The Chairman and the Directors answer all the queries raised by the shareholders at the AGM and General meetings.
The Board in conjunction with the Company Secretary formulates the process for addressing shareholder matters.
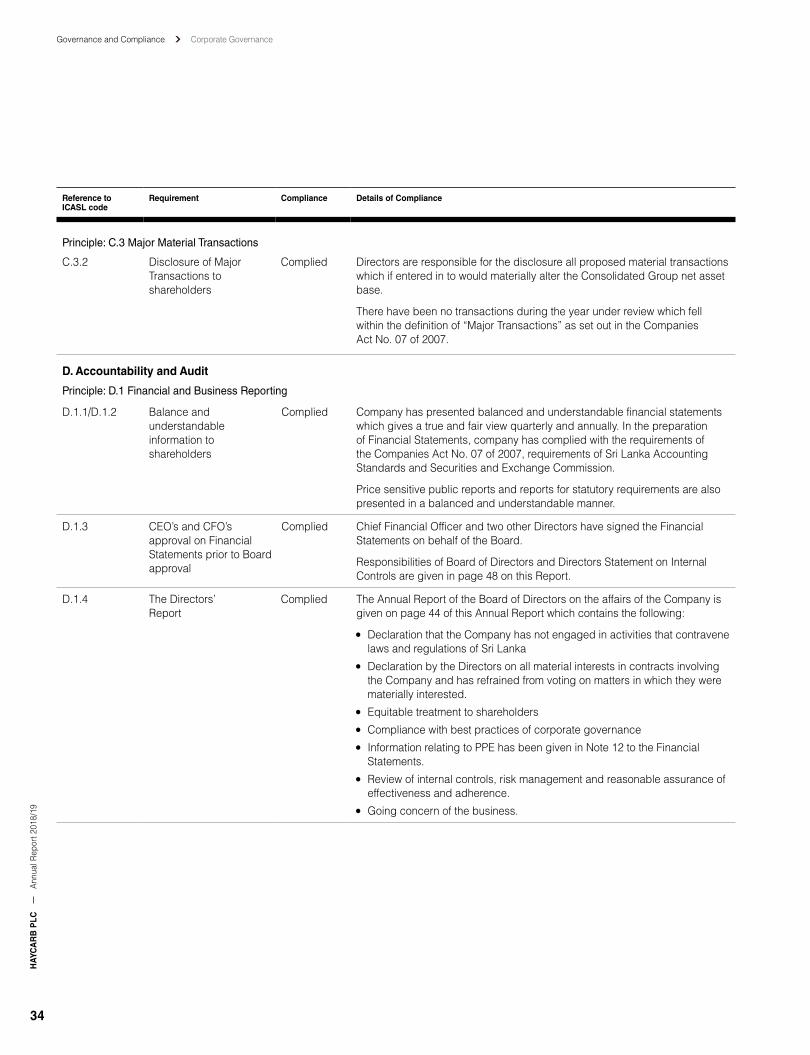
Governance and Compliance Corporate GovernanceH
AYC
AR
B P
LCA
nnua
l Rep
ort 2
018/
19
34
Reference to ICASL code
Requirement Compliance Details of Compliance
Principle: C.3 Major Material Transactions
C.3.2 Disclosure of Major Transactions to shareholders
Complied Directors are responsible for the disclosure all proposed material transactions which if entered in to would materially alter the Consolidated Group net asset base.
There have been no transactions during the year under review which fell within the definition of “Major Transactions” as set out in the Companies Act No. 07 of 2007.
D. Accountability and Audit
Principle: D.1 Financial and Business Reporting
D.1.1/D.1.2 Balance and understandable information to shareholders
Complied Company has presented balanced and understandable financial statements which gives a true and fair view quarterly and annually. In the preparation of Financial Statements, company has complied with the requirements of the Companies Act No. 07 of 2007, requirements of Sri Lanka Accounting Standards and Securities and Exchange Commission.
Price sensitive public reports and reports for statutory requirements are also presented in a balanced and understandable manner.
D.1.3 CEO’s and CFO’s approval on Financial Statements prior to Board approval
Complied Chief Financial Officer and two other Directors have signed the FinancialStatements on behalf of the Board.
Responsibilities of Board of Directors and Directors Statement on Internal Controls are given in page 48 on this Report.
D.1.4 The Directors’ Report
Complied The Annual Report of the Board of Directors on the affairs of the Company is given on page 44 of this Annual Report which contains the following:
Declaration that the Company has not engaged in activities that contravene laws and regulations of Sri Lanka Declaration by the Directors on all material interests in contracts involving the Company and has refrained from voting on matters in which they were materially interested. Equitable treatment to shareholders Compliance with best practices of corporate governance Information relating to PPE has been given in Note 12 to the Financial Statements. Review of internal controls, risk management and reasonable assurance of effectiveness and adherence. Going concern of the business.

Governance and Compliance Corporate GovernanceA
nnual Report 2018/19
HAYC
AR
B P
LC
35
Reference to ICASL code
Requirement Compliance Details of Compliance
D.1.5 Statement of Directors Responsibility, Statement on Internal Controls and Auditors’ Report.
Complied The Statement of Director’s Responsibilities for the Financial Statements and Director’s Statement on Internal Controls is given in page 48.
The Auditors’ Report is available on page 54 to this Report.
D.1.6 Management Discussion Analysis
Complied The Haycarb Group comprises of Haycarb PLC and its subsidiaries and associates as set out in the page 126 to this Report.
The authority is exercised within the ethical framework and business practices established by the Board which demands compliance with existing laws and regulation as well as best practices in dealing with employees, customers, suppliers and the community at large. These are further describing elsewhere in this Report.
The Management Team of the Group given in page 24.
The Executive Directors, General Managers and key Managers of both divisions meet separately on a monthly basis to review progress and discuss strategic issues and other important developments that require consideration. Minutes are kept of decision made and major issues.
The Managing Director of Haycarb PLC attends the monthly meetings of the Group Management Committee of Hayleys PLC and report on progress and important issues.
Management Report
The Joint Statement from the Chairman and the Managing Director (pages 4 to 9) in this Report provides an analysis of the Group’s performance during the financial year.
The Board confirms that there is an ongoing process for identifying, evaluating and managing significant risks. This process has been in place through the year under review. The potential risks, both internal as well as external, faced by the Company and actions instituted for mitigating the same are reported in the letters from the Chairman and the Managing Director (pages 4 to 9) in this Report.
D.1.7 Summon an EGM to notify serious loss of capital
In the event the net assets of the Company fall below 50% of the value of the Company’s Stated Capital, the Directors will forthwith summon an Extraordinary General Meeting to notify shareholders’ the remedial action being taken. However, such an event has not taken place since the adoption of the New Companies Act No. 07 of 2007.

Governance and Compliance Corporate GovernanceH
AYC
AR
B P
LCA
nnua
l Rep
ort 2
018/
19
36
Reference to ICASL code
Requirement Compliance Details of Compliance
Principle: D.2 Risk Management and Internal Control
D.2.1, D2.2. D.2.3, D2.4.
Monitoring sound system of internal control
Complied The Board is responsible for the Group’s internal control and its effectiveness. Internal control is established with emphasis on safeguarding assets, making available accurate and timely information and imposing greater discipline on decision making. It covers all controls required, including financial, operational and compliance controls, and risk management. It is important to recognise, however that any system can provide only reasonable, and not absolute, assurance that errors and irregularities are prevented or detected within a reasonable time.
The important procedures in place to discharge this responsibility are as follows:
The Directors are responsible for the establishment and monitoring of financial controls appropriate for the operation within the overall Group policies. The Board reviews the strategies of the divisions and constituent companies. Annual budgeting and regular forecasting processes are in place and the Directors review performance. The Board has established policies in areas of investment and treasury management and does not permit employment of complex risk management mechanisms. The Group is subjected to regular internal audits and system reviews. The Audit Committee reviews the plans and activities of the internal audits and the management letters of External Auditors. The Group carefully selects and trains employees and provides appropriate channels of communication to foster a control conscious environment.
The Board has reviewed the effectiveness of the system of financial control for the period up to the date of signing the accounts. The Directors’ Responsibilities for the Financial Statements are described on page 48.
Principle: D.3 Audit Committee
D.3.1 Composition of Audit Committee
Complied The Audit Committee comprises of three Non-Executive Independent Directors and is chaired by a senior Chartered Accountant. An Audit Committee was established in 2007. The Committee consists of three independent Non-Executive Directors.
The Chairman of the Audit Committee is an Independent Non-Executive Director, a Fellow Member of the Institute of Chartered Accountants of Sri Lanka.
The Company Secretary serves as Committee Secretary.
The Chairman, Managing Director, Finance Director, Head of Management Audit and Systems Review Division, and the Chief Financial Officer of Hayleys PLC are invited to attend the Meetings, and the other Directors and Senior Managers attend meetings as required. The input of the External Auditors is obtained where necessary.

Governance and Compliance Corporate GovernanceA
nnual Report 2018/19
HAYC
AR
B P
LC
37
Reference to ICASL code
Requirement Compliance Details of Compliance
D 3.2, D.3.3 Committees’ purpose, duties and responsibilities
Complied The purpose of the Audit Committee its duties and responsibilities are set out in the Audit Committee report in page 50 of this Report.
D.3.3 Disclosures of names of the members of Audit Committee
Complied During the year under review the committee met on four occasions, the names of Audit Committee members and their attendance at these meetings are reported in “Audit Committee Report” in page 50 of this Report.
Principle: D.4 Related Party Transactions Review Committee
D.4.1 Related Party Transactions
Complied Company is adhering to LKAS 24 and Transactions entered into with related parties during the year is disclosed in Note 30 to the Financial Statements.
D.4.2 Composition of Related Party Transactions Review Committee
Complied The Related Party Transactions (RPT) Review Committee of Hayleys PLC acts as the Company’s RPT review committee and consists of
Dr. H. Cabral, PC – (Chairman) Independent Non-Executive
M.Y.A. Perera – Independent Non-Executive
S.C. Ganegoda – Executive
D.4.3 Terms of Reference Complied Related Party Transactions Review Committee has written terms of reference dealing with its authority and duties. Related Party Transactions Review Committee report describing the duties, task and attendance of the Committee appear on page 49.
Principle: D.5 Code of Business Conduct and Ethics
D.5.1 Disclosure on presence of Code of Business Conduct and Ethics
Complied The Directors and members of the Senior Management team are bound with a Code of Business Conduct and Ethics which is developed by the Hayleys Group. The Code consists of important topics like conflict of interest, corporate opportunities, confidentiality, fair dealing, protection and proper use of Company assets, compliance of laws, rules and regulations etc. The Board ensures the compliance with the code and non-compliance may reasons to go for a disciplinary action.
D.5.2 Process to identify and report price sensitive information
Complied The Company has a process in place to ensure that material and price sensitive information is promptly identified and reported.
D.5.3 Shares purchased by directors and key management personnel
Complied The Company has a policy and a Process for monitoring, and disclosure of shares purchased by any Director and key management personnel.
Details of directors share holdings are given in page 123 of the Annual Report of Board of Directors on the affairs of the Company.
D.5.4 Affirmation of Code in the Annual Report by the Chairman
Complied The Chairman affirms that he is not aware of any violation of any of the provisions of the Code of Business Conduct and Ethics in the Annual Report.

Governance and Compliance Corporate GovernanceH
AYC
AR
B P
LCA
nnua
l Rep
ort 2
018/
19
38
Reference to ICASL code
Requirement Compliance Details of Compliance
Principle: D.6 Corporate Governance Disclosures
D.6.1 Disclosure of adherence to Corporate Governance
Complied The extent to which the Company adheres to established principles and practices of good Corporate Governance is disclosed from pages 25 to 41 of this Report.
IT GovernanceThe Company pays close attention to bringing the IT systems in line with its strategies and objectives. Upgrading of the IT systems are undertaken based on the assessments of business requirements. The IT function is supported by dedicated IT staff and the services of the Hayleys Group IT Team.
IT Value and AlignmentInvestment in IT projects and systems are made after consideration is given to their suitability to the related projects. Further aspects such as cost savings, improved customer satisfaction, timely information and the balance between cost of investment and scale of operations are also taken into account when these decisions are taken.
IT Risk ManagementRisks associated with cybersecurity and Information Technology are assessed in the process of Risk Management. Use of licensed software, close monitoring of Internet usage and mail server operations and regular update of antivirus and firewall software are some of the practices in place. The Company’s IT policy includes guidance on password security, internet usage and electronic communication. In addition, special awareness sessions have been organised to create awareness on cybersecurity.
SECTION 2: SHAREHOLDERS
E. Institutional Investors
Principle: E.1. Shareholder Voting, E.2. Evaluation of Governance Disclosures
E.1, E.2 Shareholder voting and Evaluation of governance disclosure
Complied All the investors are notified of the Annual General Meeting and all their views, comments and suggestions are encouraged. The Company seeks dialogue with institutional investors. Impartiality is maintained on shareholder votes at the AGM based on individual holding and weightage.
Institutional investors are encouraged to give due weight to all relevant factors drawn to their attention when evaluating companies’ governance arrangement particularly in relation to Board structure and composition.
F. Other Investors
Principle: F.1. Investing/Divesting Decisions, F.2. Shareholders Voting
F 1, F2 Adequate analysis for investment/divestment decisions and usage of voting right
Complied All shareholders are encouraged to actively participate in the AGM and they have the independence of using their votes as they wish. The Company believes that the rational investors remain with the Company without divesting. There are no restrictions for investing or divesting in the Company shares.

Governance and Compliance Corporate GovernanceA
nnual Report 2018/19
HAYC
AR
B P
LC
39
Reference to ICASL code
Requirement Compliance Details of Compliance
Principle: G. Internet of Things and Cybersecurity
G.1 Cybersecurity risk of sending and receiving information
Complied Disaster Recovery plan is implemented with hardware infrastructure. All the data backups and DR site are maintained by Hayleys Group IT. The Group IT division has implemented processes to identify and protect against cyber security risks that effect the business.
Principle: H. Environment, Society and Governance (ESG)
H.1.1 Provide Sufficient information relating to ESG risks
Complied The joint statement from the Chairman and Managing Director in pages 4 to 9 and note 32 in page 109 highlights the ESG issues that may affect the business strategy.
Level of Compliance with Section 7.10 of the CSE Listing Rules on Corporate Governance is given in the following table.
Rule No. Subject Applicable requirement Compliance status Details``
7.10 (a)/(b) Compliance Compliance with Corporate Government rules
Compliant
7.10.1 (a) Non-Executive Directors At least one-third of the total number of Directors should be Non-Executive Directors
Compliant Six of the fourteen Directors are Non-Executive Directors
7.10.2 (a) Independent Directors Two or one-third of Non-Executive Directors, whichever is higher shall be Independent
Compliant Four of the six Non-Executive Directors are independent
7.10.2 (b) Independent Directors Each Non-Executive Director shall submit a declaration of independence/non-independence in the prescribed format.
Compliant All Independent Non-Executive Directors have submitted signed confirmations of their independence
7.10.3 (a) Disclosure relating to Directors
Names of Independent Directors should be disclosed in the Annual Report
Compliant Please refer page 26
7.10.3 (b) Disclosure relating to Directors
In the event a Director does not qualify as independent against the criteria, but if the Board is of the opinion that the Director is nevertheless independent, the Board shall specify the criteria not met and the basis of its determination.
Compliant Please refer Corporate Governance A.5.5
7.10.3 (c) Disclosure relating to Directors
A brief résumé of each Director should be included in the Annual Report including the areas of expertise
Compliant Please refer pages 22 to 23

Governance and Compliance Corporate GovernanceH
AYC
AR
B P
LCA
nnua
l Rep
ort 2
018/
19
40
Rule No. Subject Applicable requirement Compliance status Details``
7.10.3 (d) Disclosure relating to Directors
Forthwith provide a brief résumé of new Directors appointed to the Board with details specified in 7.10.3 (a), (b) and (c) to the Exchange
Compliant Résumé of all new Directors appointed during the year were submitted to the CSE. There was no new director appointment during the year
7.10.5 (a) Remuneration Committee The Board of Directors should set up a Remuneration Committee with a Non-Executive Director as the Chairman.
Compliant Please refer Corporate Governance B.1.1, B.1.2, B.1.3, B.1.4, B.1.5
7.10.5 (c) Remuneration Committee The names of the members of the Remuneration Committee is given on page 32
Compliant Please refer Corporate Governance B.1.1, B.1.2, B.1.3, B.1.4, B.1.5
7.10.6 (a) Audit Committee composition
The listed company shall have an Audit Committee comprising of Non-Executive-Directors
Compliant The names of the members of the Audit Committee are stated on page 50
The Chairman or one member of the Audit Committee should be a member of a recognised professional accounting body
Compliant The Chairman of the Audit Committee is a Senior Chartered Accountant
7.10.6 (c) Audit Committee disclosure
The names of the Directors comprising the Audit Committee to be disclosed.
Compliant Please refer page 50
The Annual Report shall contain a report by the Audit Committee setting out the manner of compliance by the entity.
Compliant Please refer page 50
The Committee shall make a determination of the independence of the Auditors and shall disclose the basis of such determination.
Compliant Please refer page 50
7.13.1 (b) Minimum Public Holding As a listed company in the Main Board, the Company maintained the minimum public holding under specified criteria.
Compliant Please refer page 123
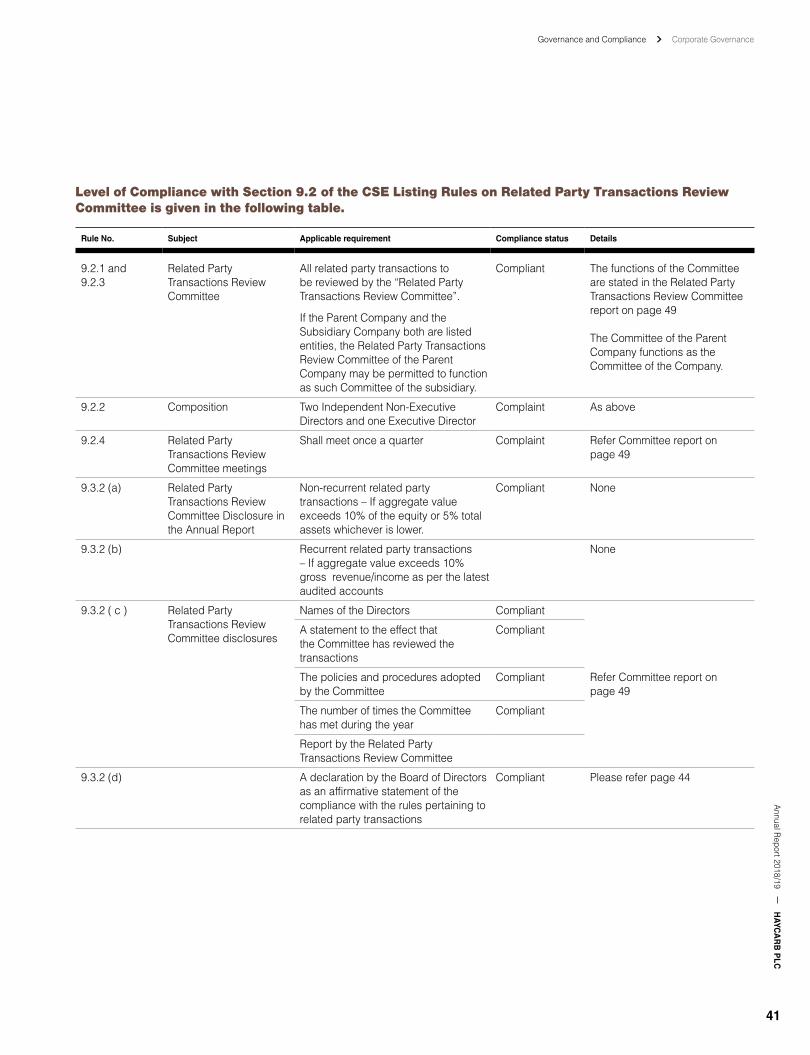
Governance and Compliance Corporate GovernanceA
nnual Report 2018/19
HAYC
AR
B P
LC
41
Level of Compliance with Section 9.2 of the CSE Listing Rules on Related Party Transactions Review Committee is given in the following table.
Rule No. Subject Applicable requirement Compliance status Details``
9.2.1 and 9.2.3
Related Party Transactions Review Committee
All related party transactions to be reviewed by the “Related Party Transactions Review Committee”.
If the Parent Company and the Subsidiary Company both are listed entities, the Related Party Transactions Review Committee of the Parent Company may be permitted to function as such Committee of the subsidiary.
Compliant The functions of the Committee are stated in the Related Party Transactions Review Committee report on page 49
The Committee of the Parent Company functions as the Committee of the Company.
9.2.2 Composition Two Independent Non-Executive Directors and one Executive Director
Complaint As above
9.2.4 Related Party Transactions Review Committee meetings
Shall meet once a quarter Complaint Refer Committee report on page 49
9.3.2 (a) Related Party Transactions Review Committee Disclosure in the Annual Report
Non-recurrent related party transactions – If aggregate value exceeds 10% of the equity or 5% total assets whichever is lower.
Compliant None
9.3.2 (b) Recurrent related party transactions – If aggregate value exceeds 10% gross revenue/income as per the latest audited accounts
None
9.3.2 ( c ) Related Party Transactions Review Committee disclosures
Names of the Directors Compliant
Refer Committee report on page 49
A statement to the effect that the Committee has reviewed the transactions
Compliant
The policies and procedures adopted by the Committee
Compliant
The number of times the Committee has met during the year
Compliant
Report by the Related Party Transactions Review Committee
9.3.2 (d) A declaration by the Board of Directors as an affirmative statement of the compliance with the rules pertaining to related party transactions
Compliant Please refer page 44

Governance and Compliance Corporate GovernanceH
AYC
AR
B P
LCA
nnua
l Rep
ort 2
018/
19
42
Haycarb’s core values of Innovation and Technical Excellence have always been the foundation driving our success over time. Our production, engineering and R&D teams have embraced these values while driving the Company as a sustainable entity adopting “green practices” – another core value of Haycarb. Innovation of new products have led us to explore new market opportunities, and allowed us to stay ahead of the game. Continuous process innovations led by lean management practices enable Haycarb to capitalise on improving existing methods whilst reducing the carbon footprint. Our core values have driven us to strengthen the spectrum of our core operations contributing to our success.
Technical Excellence, Innovation and Green Practices Fuel Sustainability
Energy Saving Initiatives of Haycarb Group for year 2018/19
Energy Source Project
Installation of a solar power system at Haycarb Badalgama facility in Sri Lanka. Project initiated with the installation of a 3KW trial unit currently in operation at the location. Daily performance being monitored to gather data and evaluate the requirements to install a higher capacity solar plant at the factory premises in the future.
Replacing Metal halide high bay lights with LEDs at Haycarb Madampe facility in Sri Lanka. In addition to the power saving, this replacement also improved the lighting level in the indoor area of the facility.
Furnace oil to LPG conversion for Dryers used at the Ultracarb facility located in Badalgama, Sri Lanka.
Introduction of new Flash drying system for drying of powder carbon for the washing plant at Haycarb Badalgama Facility. In addition to fuel saving, this initiative also minimised material wastage.
Converting indirect heat drying system to operate with LPG direct drying, improving energy efficiency in the system without compromising the quality of the products at Haycarb Badalgama Facility. This initiative reduced the per MT oil consumption in the process resulting in reduction of fuel cost.
Oil reduction via improving Volatile Burning Chamber process at Haycarb Badalgama Pellaco Facility.
Volatile gasses produced during the pellet production process are harmful for the environment and cannot be released into the air. Therefore they are directed into a chamber and burnt before being released into the environment. The new process improvements now use the existing energy in the system for this Chamber combustion process eliminating the need to use LPG Gas as done previously.
Stage 1 of this project is now completed.

Governance and Compliance Corporate GovernanceA
nnual Report 2018/19
HAYC
AR
B P
LC
43
New Applications
Introduction of catalytic carbon range of coconut shell and wood based carbons for monochloramine removal
Formaldehyde removal for air filters
Carbon for human consumption, ISO 22000 and GMP certified
Carbons with improved properties for gas masks
Improvement of properties for supercapacitor carbon
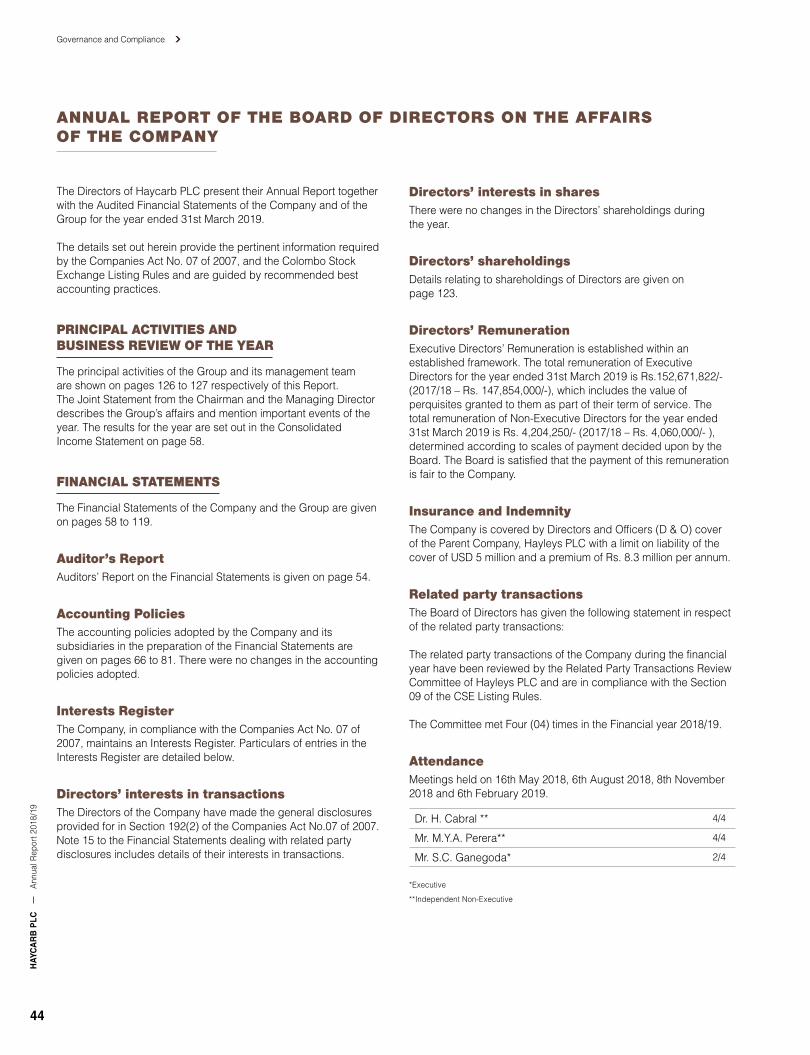
HAY
CA
RB
PLC
Ann
ual R
epor
t 201
8/19
44
Governance and Compliance
ANNUAL REPORT OF THE BOARD OF DIRECTORS ON THE AFFAIRS OF THE COMPANY
The Directors of Haycarb PLC present their Annual Report together with the Audited Financial Statements of the Company and of the Group for the year ended 31st March 2019.
The details set out herein provide the pertinent information required by the Companies Act No. 07 of 2007, and the Colombo Stock Exchange Listing Rules and are guided by recommended best accounting practices.
PRINCIPAL ACTIVITIES AND BUSINESS REVIEW OF THE YEAR
The principal activities of the Group and its management team are shown on pages 126 to 127 respectively of this Report. The Joint Statement from the Chairman and the Managing Director describes the Group’s affairs and mention important events of the year. The results for the year are set out in the Consolidated Income Statement on page 58.
FINANCIAL STATEMENTS
The Financial Statements of the Company and the Group are given on pages 58 to 119.
Auditor’s ReportAuditors’ Report on the Financial Statements is given on page 54.
Accounting PoliciesThe accounting policies adopted by the Company and its subsidiaries in the preparation of the Financial Statements are given on pages 66 to 81. There were no changes in the accounting policies adopted.
Interests RegisterThe Company, in compliance with the Companies Act No. 07 of 2007, maintains an Interests Register. Particulars of entries in the Interests Register are detailed below.
Directors’ interests in transactionsThe Directors of the Company have made the general disclosures provided for in Section 192(2) of the Companies Act No.07 of 2007. Note 15 to the Financial Statements dealing with related party disclosures includes details of their interests in transactions.
Directors’ interests in sharesThere were no changes in the Directors’ shareholdings during the year.
Directors’ shareholdingsDetails relating to shareholdings of Directors are given on page 123.
Directors’ Remuneration Executive Directors’ Remuneration is established within an established framework. The total remuneration of Executive Directors for the year ended 31st March 2019 is Rs.152,671,822/- (2017/18 – Rs. 147,854,000/-), which includes the value of perquisites granted to them as part of their term of service. The total remuneration of Non-Executive Directors for the year ended 31st March 2019 is Rs. 4,204,250/- (2017/18 – Rs. 4,060,000/- ), determined according to scales of payment decided upon by the Board. The Board is satisfied that the payment of this remuneration is fair to the Company.
Insurance and IndemnityThe Company is covered by Directors and Officers (D & O) cover of the Parent Company, Hayleys PLC with a limit on liability of the cover of USD 5 million and a premium of Rs. 8.3 million per annum.
Related party transactionsThe Board of Directors has given the following statement in respect of the related party transactions:
The related party transactions of the Company during the financial year have been reviewed by the Related Party Transactions Review Committee of Hayleys PLC and are in compliance with the Section 09 of the CSE Listing Rules.
The Committee met Four (04) times in the Financial year 2018/19.
AttendanceMeetings held on 16th May 2018, 6th August 2018, 8th November 2018 and 6th February 2019.
Dr. H. Cabral ** 4/4
Mr. M.Y.A. Perera** 4/4
Mr. S.C. Ganegoda* 2/4
*Executive
**Independent Non-Executive

Governance and Compliance Annual Report of the Board of Directors on the Affairs of the CompanyA
nnual Report 2018/19
HAYC
AR
B P
LC
45
SubsidiariesThe Shareholders of the following Subsidiaries, being private companies registered under Companies Act No. 07 of 2007, have unanimously agreed to dispense with the requirement to maintain an Interests Register.
Recogen (Pvt) Ltd.Puritas (Pvt) Ltd.Utracarb (Pvt) Ltd.Haycarb Value Added Products (Pvt) Ltd.
DonationsThe donations made by the Company and the Group are disclosed in Note 8.2 on page 84.
At the last Annual General Meeting shareholders approved a sum not exceeding Rs. 1,500,000/- in respect of donations. The donations given during the year amounted to Rs. 2,073,201/- (2017/18 – Rs. 1,866,100). The ratification by the shareholders of the excess amount of Rs.573.201/- made as donations for 2018/19 will be sought at the Annual General Meeting.
No donations were made for political purpose.
DirectorateThe names of the Directors who served during the year are given below and their brief profiles appear on pages 22 and 23 of this report.
Mr. A.M. Pandithage (Chairman)Mr. H.S.R. Kariyawasan (Managing Director)Mr. Dhammika Perera*Mr. A.M. Senaratna**Mr. S.C. Ganegoda*Mrs. M.J.A.S. AbeyratneDr. S.A.K. Abayawardana**Mr. S. Rajapakse**Mr. M.S.P. Udaya Kumara Mr. B. BalaratnarajahMs. Y. Bhaskaran* (Alternate to Mr. Dhammika Perera)Ms. S.S. RagunathanMr. A.A.M. CaderbhoyMr. J.D. NaylorMr. M.H. Jamaldeen**
*Non-Executive Directors
**Independent Non-Executive Directors
In terms of Article No. 29 (1) of the Articles of Association of the Company, Ms. S.S. Ragunathan and Messrs. A.M. Pandithage, A.A.M. Caderbhoy and J.D. Naylor retire by rotation and being eligible offer themselves for re-election.
Notice has been given pursuant to Section 211 of the Companies Act No. 07 of 2007, of the intention to propose an ordinary resolution for re-election of Dr. S.A.K. Abayawardana, who is over 70 years of age notwithstanding the age limit of 72 years stipulated by Section 210 of the Companies Act No. 07 of 2007.
The Directors of the Subsidiaries are given on pages 126 and 127.
AuditorsThe Financial Statements for the year have been audited by Messrs. Ernst & Young, Chartered Accountants.
The Auditors, Messrs. Ernst & Young, Chartered Accountants, were paid Rs. 1,821,000/- (2017/18 – Rs. 1,735,000/-) and Rs. 3,014,000/- (2017/18 – Rs. 2,775,000/-) as audit fees by the Company and the group respectively. In addition, they were paid Rs. 2,931,000/- (2017/18 – Rs. 1,787,000/-) and Rs. 8,671,000/- (2017/18 – Rs. 5,210,000/-) by the Company and the Group, for non-audit related work, which consisted mainly of tax advisory services.
As far as the Directors are aware, the Auditors of the Company and of the Subsidiaries do not have any relationships (other than that of an Auditor) with the Company or any of its Subsidiaries other than those disclosed above. The Auditors also do not have any interests in the Company or any of its Group companies.
Messrs. Ernst & Young, Chartered Accountants, are deemed reappointed, in terms of section 158 of the Companies Act No. 07 of 2007, as Auditors of the Company.
A resolution proposing Directors be authorised to determine Auditors Remuneration will be submitted at the AGM.
Group revenueThe revenue of the Group was Rs. 20,917,945,000/- (2017/18 – Rs. 15,518,079,000/-) in the year under review. A detailed analysis of the Group’s revenue is given in Note 5 to the Financial Statements.
The Group’s revenue from international trade, which includes the revenue of overseas subsidiaries in addition to exports from Sri Lanka amounted to Rs. 19,307,432,000/- (2017/18 – Rs. 14,603,454,000/-). Trade between Group companies are conducted at fair market prices.

Governance and Compliance Annual Report of the Board of Directors on the Affairs of the CompanyH
AYC
AR
B P
LCA
nnua
l Rep
ort 2
018/
19
46
ProfitsThe Group’s profit before tax amounted to Rs. 1,352,898,000/- (2017/18 – Rs. 926,423,000/-). After a deducting Rs. 271,196,000/- (2017/18 – Rs. 152,799,000/-) for taxation, the profit was Rs. 1,081,702/- (2017/18 – Rs.773, 624,000/-). When non-controlling interest of Rs. 126,291,000 (2017/18 – Rs. 101,260,000/-) was deducted, the profit attributable to the equity holders of the Company was Rs. 955,411,000/-.(2017/18 – Rs. 672,364,000/-).
Stated capital and reservesThe stated capital of the Company, consisting of 29,712,375 ordinary shares, amounts to Rs. 331,774,000/-. There was no change in stated capital during the year.
Total Group reserves as at 31st March 2019 amount to Rs. 7,918,612,000/- comprising of Capital Reserves of Rs. 675,744,000/- and Revenue Reserves of Rs. 7,242,868,000/-. The Composition of reserves is shown in the Statement of Changes in Equity in the Financial Statements.
DividendFirst Interim Dividend of Rs. 2/- per share was paid to the shareholders on 23rd January 2019. The Second Interim Dividend of Rs. 6/- per share was paid to the shareholders on 18th April 2019. The directors have confirmed that the Company satisfied the solvency test requirement under Section 56 of the Companies Act No. 07 of 2007. A Solvency Certificate from the Auditors has been obtained in respect of first and second interim dividend paid.
Statutory paymentsThe declaration relating to statutory payments is made in the Statement of Directors Responsibilities on page 48.
Capital expenditureCapital expenditure during the year, on property, plant and equipment by the Group and by the Company amounted to Rs. 389,598,000/- (2017/18 – Rs. 324,816,000/-) and Rs.118,889,000/- (2017/18 – Rs. 145,317,000/-) respectively. Information relating to movements in property, plant and equipment is given in Note 12 to the Financial Statements.
Market value of propertiesThe freehold land of the Group has in general been subjected to routine revaluation by independent qualified valuers. The most recent revaluations in respect of the Group were carried out as at 31st March 2019.
Details of revaluations, carrying values and market values are provided in Note 12 to the Financial Statements. The statement on the value of real estate on page 88 gives details of freehold land held by the Group.
Events after the Reporting PeriodNo circumstances have arisen since the reporting date that would require adjustments, other than those disclosed in Note 34 to the Financial Statements.
Going concernThe Directors believe, after reviewing the financial position and the cash flow of the Group, that the Group has adequate resources to continue operations well into the foreseeable future. For this reason they continue to adopt the going concern basis in preparing the Financial Statements.
ShareholdersThe Company has made all endeavors to ensure the equitable treatment of shareholders. The board has established a comprehensive mechanisms such as Related Party Transactions Review Committee and regular interactions with shareholders to ensure the interests of the shareholders as a whole are safeguarded.

Governance and Compliance Annual Report of the Board of Directors on the Affairs of the CompanyA
nnual Report 2018/19
HAYC
AR
B P
LC
47
Share InformationInformation relating to earnings, dividends, net asset, market value per share and share trading is given on pages 124 and 125.
Major shareholdingsThe twenty major shareholders as at 31st March 2019 are given on page 122 in this Report.
Annual General MeetingThe Annual General Meeting will be held at 400, Deans Road, Colombo 10, Sri Lanka at Thursday on 27th June 2019. The Notice of the Annual General Meeting appears on page 129.
For and on behalf of the Board,
A.M. PANDITHAGE
Chairman
H.S.R. KARIYAWASAN
Managing Director
HAYLEYS GROUP SERVICES (PVT) LTD
SecretariesNo. 400, Deans Road, Colombo 10,
14th May 2019
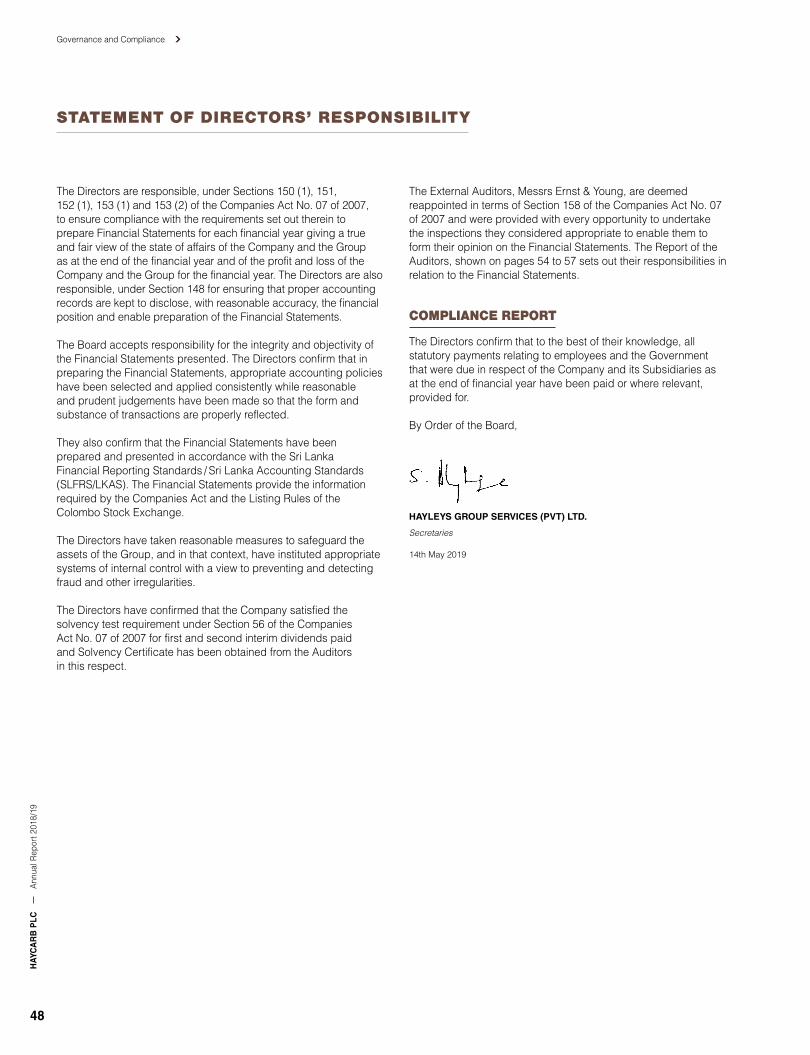
HAY
CA
RB
PLC
Ann
ual R
epor
t 201
8/19
48
Governance and Compliance
STATEMENT OF DIRECTORS’ RESPONSIBILITY
The Directors are responsible, under Sections 150 (1), 151, 152 (1), 153 (1) and 153 (2) of the Companies Act No. 07 of 2007, to ensure compliance with the requirements set out therein to prepare Financial Statements for each financial year giving a true and fair view of the state of affairs of the Company and the Group as at the end of the financial year and of the profit and loss of the Company and the Group for the financial year. The Directors are also responsible, under Section 148 for ensuring that proper accounting records are kept to disclose, with reasonable accuracy, the financial position and enable preparation of the Financial Statements.
The Board accepts responsibility for the integrity and objectivity of the Financial Statements presented. The Directors confirm that in preparing the Financial Statements, appropriate accounting policies have been selected and applied consistently while reasonable and prudent judgements have been made so that the form and substance of transactions are properly reflected.
They also confirm that the Financial Statements have been prepared and presented in accordance with the Sri Lanka Financial Reporting Standards / Sri Lanka Accounting Standards (SLFRS/LKAS). The Financial Statements provide the information required by the Companies Act and the Listing Rules of the Colombo Stock Exchange.
The Directors have taken reasonable measures to safeguard the assets of the Group, and in that context, have instituted appropriate systems of internal control with a view to preventing and detecting fraud and other irregularities.
The Directors have confirmed that the Company satisfied the solvency test requirement under Section 56 of the Companies Act No. 07 of 2007 for first and second interim dividends paid and Solvency Certificate has been obtained from the Auditors in this respect.
The External Auditors, Messrs Ernst & Young, are deemed reappointed in terms of Section 158 of the Companies Act No. 07 of 2007 and were provided with every opportunity to undertake the inspections they considered appropriate to enable them to form their opinion on the Financial Statements. The Report of the Auditors, shown on pages 54 to 57 sets out their responsibilities in relation to the Financial Statements.
COMPLIANCE REPORT
The Directors confirm that to the best of their knowledge, all statutory payments relating to employees and the Government that were due in respect of the Company and its Subsidiaries as at the end of financial year have been paid or where relevant, provided for.
By Order of the Board,
HAYLEYS GROUP SERVICES (PVT) LTD.
Secretaries
14th May 2019

Annual R
eport 2018/19H
AYCA
RB
PLC
49
Governance and Compliance
RELATED PARTY TRANSACTIONS REVIEW COMMITTEE REPORT
The Related Party Transaction Review Committee of Hayleys PLC, the Parent Company functions as the Committee of the Company in terms of the Code of Best Practice on Related Party Transactions issued by the Securities and Exchange Commission of Sri Lanka and the Section 9 of the Listing Rules of the Colombo Stock Exchange.
COMPOSITION OF THE COMMITTEE
The Related Party Transactions Review Committee comprises two Independent Non-Executive Directors and one Executive Director.
The Committee comprises the following members.
Dr. H. Cabral, PC** – Chairman
Mr. M.Y.A. Perera**
Mr. S.C. Ganegoda *
** Independent Non-Executive
*Executive
ATTENDANCE
Committee met four times during the financial year 2018/19
Meetings were held on 16th May 2018, 6th August 2018, 8th November 2018 and 6th February 2019.
Meetings
Dr. H. Cabral, PC 4/4
Mr. M.Y.A. Perera 4/4
Mr. S.C. Ganegoda 2/4
THE DUTIES OF THE COMMITTEE
To review in advance all proposed related party transactions of the Group either prior to the transaction being entered into or, if the transaction is expressed to be conditional on such review, prior to the completion of the transaction. Seek any information the Committee requires from the Management, employees or external parties to with regard to any transaction entered into with a related party.
Obtain knowledge or expertise to assess all aspects of proposed related party transactions where necessary including obtaining appropriate professional and expert advice from suitably qualified persons. To recommend, where necessary, to the Board and obtain their approval prior to the execution of any related party transaction. To monitor that all related party transactions of the entity are transacted on normal commercial terms and are not prejudicial to the interests of the entity and its minority shareholders. Meet with the Management, Internal Auditors/External Auditors as necessary to carry out the assigned duties. To review the transfer of resources, services or obligations between related parties regardless of whether a price is charged. To review the economic and commercial substance of both recurrent/non-recurrent related party transactions. To monitor and recommend the acquisition or disposal of substantial assets between related parties, including obtaining “competent independent advice” from independent professional experts with regard to the value of the substantial asset of the related party transaction.
TASK OF THE COMMITTEE
The Committee reviewed the related party transactions and their compliances of Haycarb PLC and communicated the same to the Board.
The Committee in its review process recognised the adequate of the content and quality of the information forwarded to its members by the Management.
DR. HARSHA CABRAL, PC
ChairmanRelated Party Transactions Review Committee
15th May 2019
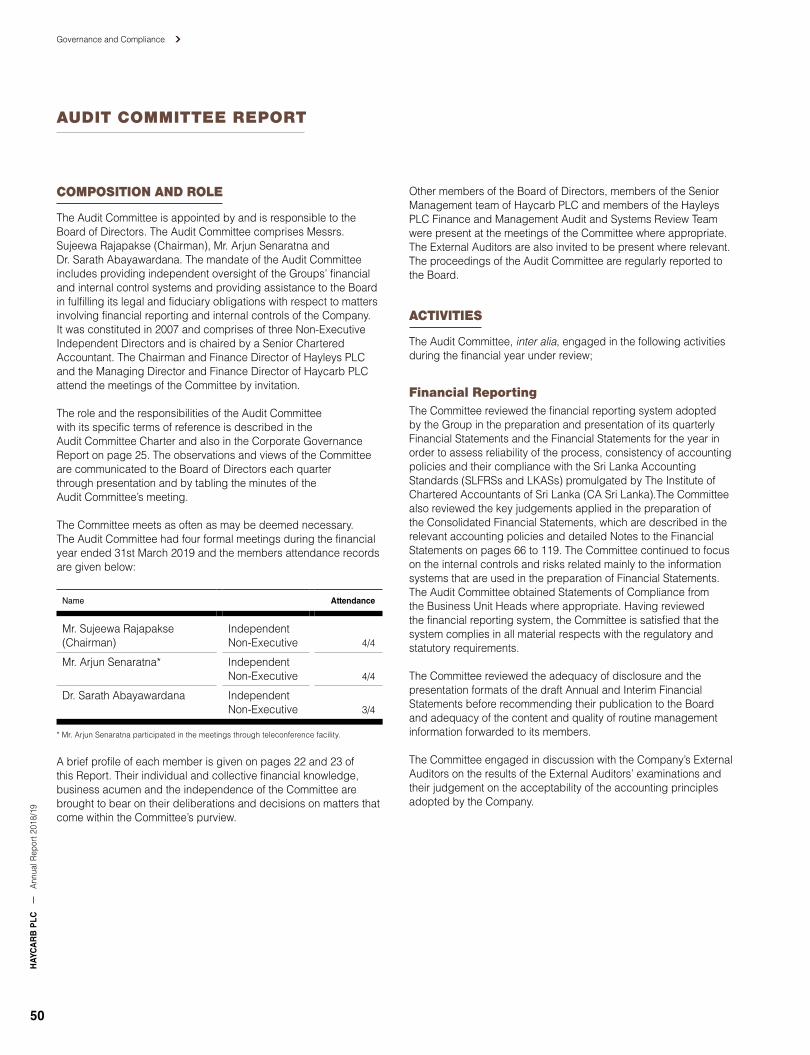
HAY
CA
RB
PLC
Ann
ual R
epor
t 201
8/19
50
Governance and Compliance
AUDIT COMMITTEE REPORT
COMPOSITION AND ROLE
The Audit Committee is appointed by and is responsible to the Board of Directors. The Audit Committee comprises Messrs. Sujeewa Rajapakse (Chairman), Mr. Arjun Senaratna and Dr. Sarath Abayawardana. The mandate of the Audit Committee includes providing independent oversight of the Groups’ financial and internal control systems and providing assistance to the Board in fulfilling its legal and fiduciary obligations with respect to matters involving financial reporting and internal controls of the Company. It was constituted in 2007 and comprises of three Non-Executive Independent Directors and is chaired by a Senior Chartered Accountant. The Chairman and Finance Director of Hayleys PLC and the Managing Director and Finance Director of Haycarb PLC attend the meetings of the Committee by invitation.
The role and the responsibilities of the Audit Committee with its specific terms of reference is described in the Audit Committee Charter and also in the Corporate Governance Report on page 25. The observations and views of the Committee are communicated to the Board of Directors each quarter through presentation and by tabling the minutes of the Audit Committee’s meeting.
The Committee meets as often as may be deemed necessary. The Audit Committee had four formal meetings during the financial year ended 31st March 2019 and the members attendance records are given below:
Name Attendance
Mr. Sujeewa Rajapakse (Chairman)
Independent Non-Executive 4/4
Mr. Arjun Senaratna* Independent Non-Executive 4/4
Dr. Sarath Abayawardana Independent Non-Executive 3/4
* Mr. Arjun Senaratna participated in the meetings through teleconference facility.
A brief profile of each member is given on pages 22 and 23 of this Report. Their individual and collective financial knowledge, business acumen and the independence of the Committee are brought to bear on their deliberations and decisions on matters that come within the Committee’s purview.
Other members of the Board of Directors, members of the Senior Management team of Haycarb PLC and members of the Hayleys PLC Finance and Management Audit and Systems Review Team were present at the meetings of the Committee where appropriate. The External Auditors are also invited to be present where relevant. The proceedings of the Audit Committee are regularly reported to the Board.
ACTIVITIES
The Audit Committee, inter alia, engaged in the following activities during the financial year under review;
Financial ReportingThe Committee reviewed the financial reporting system adopted by the Group in the preparation and presentation of its quarterly Financial Statements and the Financial Statements for the year in order to assess reliability of the process, consistency of accounting policies and their compliance with the Sri Lanka Accounting Standards (SLFRSs and LKASs) promulgated by The Institute of Chartered Accountants of Sri Lanka (CA Sri Lanka).The Committee also reviewed the key judgements applied in the preparation of the Consolidated Financial Statements, which are described in the relevant accounting policies and detailed Notes to the Financial Statements on pages 66 to 119. The Committee continued to focus on the internal controls and risks related mainly to the information systems that are used in the preparation of Financial Statements. The Audit Committee obtained Statements of Compliance from the Business Unit Heads where appropriate. Having reviewed the financial reporting system, the Committee is satisfied that the system complies in all material respects with the regulatory and statutory requirements.
The Committee reviewed the adequacy of disclosure and the presentation formats of the draft Annual and Interim Financial Statements before recommending their publication to the Board and adequacy of the content and quality of routine management information forwarded to its members.
The Committee engaged in discussion with the Company’s External Auditors on the results of the External Auditors’ examinations and their judgement on the acceptability of the accounting principles adopted by the Company.

Governance and Compliance Audit Committee ReportA
nnual Report 2018/19
HAYC
AR
B P
LC
51
Internal Control Systems The Committee reviewed the business processes in order to evaluate the effectiveness of the internal controls. The internal control systems are designed to manage rather than eliminate business risk. They provide reasonable but not absolute assurance against material misstatement or loss.
The Annual Internal Audit Plan is approved by the Audit Committee and reviewed on a quarterly basis in order to reflect the changing business needs and to ensure new and emerging risks are considered. During the year under review the services of the Hayleys PLC Management Audit and System Review Division was used to review processes covering production, procurement and sales among others. The key business processes involving Haycarb Group is reported to the Audit Committee for review and formulation of action plans for the ensuing year.
The Committee also reviewed the adequacy of provisions made for possible impairments, liabilities and compliance with relevant statutory and regulatory requirements.
Risk ManagementThe Committee reviewed the risk management process adopted by the Group and discussed the high level risks faced by the business. The risk management framework which includes identified risks and mitigating plans is presented and reviewed at Audit Committee meetings.
External AuditDuring the year, the Committee reviewed the external audit scope and the strategy. The Audit Committee discussed the audit plan and the scope of the external audit with Messrs Ernst & Young. The Interim Issues Memoranda, Audit Results Report and the Management Letters issued by the External Auditors with regard to the Financial Statements are circulated and reviewed at the Audit Committee.
The Committee reviews annually the appointment of the External Auditor and makes recommendations to the Board accordingly. The Committee is satisfied that the independence of the External Auditors had not been impaired by any event or service that gives rise to a conflict of interest. Due consideration has been given to
the nature of the services provided by the Auditors and the level of audit and non-audit fees received by the Auditors, in order to ensure that it did not compromise their independence.
The Audit Committee recommended to the Board the re-appointment of Messrs Ernst and Young, Chartered Accountants as the External Auditors of the Company for the ensuing financial year, subject to the approval of the shareholders at the next Annual General Meeting.
The Audit Committee provides the opportunity to External Auditors to meet Audit Committee members independently, if necessary.
CONCLUSION
The Audit Committee is provided with sufficient resources and has received the support of the Management to discharge its responsibilities effectively.
The Audit Committee is satisfied that the operational controls of the Group provide a reasonable assurance that the assets are safeguarded, the policies of the Group are adhered to and the financial reporting system is effective and forms the basis for the preparation of reliable Financial Statements.
S. RAJAPAKSE
ChairmanAudit Committee
10th May 2019

Governance and Compliance FINANCIAL CALENDARH
AYC
AR
B P
LCA
nnua
l Rep
ort 2
018/
19
52
FINANCIAL CALENDAR
Quarter ended 30th June 2018 7th August 2018Quarter ended 30th September 2018 7th November 2018Quarter ended 31st December 2018 5th February 2019Quarter ended 1st March 2019 14th May 2019
Annual Report 3rd June 2019Forty-Sixth Annual General Meeting 27th June 20191st Interim Dividend declared 3rd January 20191st Interim Dividend paid 23rd January 20192nd Interim Dividend declared 29th March 20192nd Interim Dividend paid 18th April 2019

Financial Statements A
nnual Report 2018/19
HAYC
AR
B P
LC
53
Financial Statements
Independent Auditors’ Report 54
Income Statement 58
Statement of Comprehensive Income 59
Statement of Financial Position 60
Statement of Changes in Equity 62
Statement of Cash Flow 64
Notes to the Financial Statements 66
HAY
CA
RB
PLC
Ann
ual R
epor
t 201
8/19
54
Financial Statements
INDEPENDENT AUDITORS' REPORT
INDEPENDENT AUDITORS' REPORT TO THE SHAREHOLDERS OF HAYCARB PLC
Report on the audit of the Financial Statements
Opinion We have audited the financial statements of Haycarb PLC ("the Company") and the consolidated financial statements of the Company and its subsidiaries ("the Group"), which comprise the statement of financial position as at 31st March 2019, income statement and the statement of comprehensive income, statement of changes in equity and statement of cash flows for the year then ended, and notes to the financial statements, including a summary of significant accounting policies. In our opinion, the accompanying financial statements of the Company and the Group give a true and fair view of the financial position of the Company and the Group as at 31st March 2019, and of their financial performance and cash flows for the year then ended in accordance with Sri Lanka Accounting Standards.
Basis for opinionWe conducted our audit in accordance with Sri Lanka Auditing Standards (SLAuSs). Our responsibilities under those standards are further described in the Auditor's responsibilities for the audit of the financial statements section of our report. We are independent of the Group in accordance with the Code of Ethics issued by CA Sri Lanka (Code of Ethics) and we have fulfilled our other ethical responsibilities in accordance with the Code of Ethics. We believe that the audit evidence we have obtained is sufficient and appropriate to provide a basis for our opinion.
Key audit mattersKey audit matters are those matters that, in our professional judgement, were of most significance in our audit of the financial statements of the current period. These matters were addressed in the context of our audit of the financial statements as a whole, and in forming our opinion thereon, and we do not provide a separate opinion on these matters. For each matter below, our description of how our audit addressed the matter is provided in that context.
We have fulfilled the responsibilities described in the Auditor’s responsibilities for the audit of the financial statements section of our report, including in relation to these matters. Accordingly, our audit included the performance of procedures designed to respond to our assessment of the risks of material misstatement of the financial statements. The results of our audit procedures, including the procedures performed to address the matters below, provide the basis for our audit opinion on the accompanying financial statements.
Partners: W R H Fernando FCA FCMA M P D Cooray FCA FCMA R N de Saram ACA FCMA Ms. N A De Silva FCA Ms. Y A De Silva FCA W K B S P Fernando FCA FCMA Ms. K R M Fernando FCA ACMA Ms. L K H L Fonseka FCA A P A Gunasekera FCA FCMA A Herath FCA D K Hulangamuwa FCA FCMA LLB (Lond) H M A Jayesinghe FCA FCMA Ms. A A Ludowyke FCA FCMA Ms. G G S Manatunga FCA Ms. P V K N Sajeewani FCA N M Sulaiman ACA ACMA B E Wijesuriya FCA FCMAPrincipal T P M Ruberu FCMA FCCA
A member firm of Ernst & Young Global Limited
Ernst & YoungChartered Accountants201 De Saram PlaceP.O. Box 101Colombo 10Sri Lanka
Tel : +94 11 2463500Fax Gen : +94 11 2697369 Tax : +94 11 [email protected]
Financial Statements Independent Auditors' ReportA
nnual Report 2018/19
HAYC
AR
B P
LC
55
Key audit matter How our audit addressed the key audit matter
Significant balances in foreign subsidiariesHaycarb PLC is a group which includes eleven foreign subsidiaries, operating in Indonesia, Thailand, Singapore, USA, Europe, India and Australia. These overseas subsidiaries are audited by non-EY auditors and certain elements in these subsidiary financial statements are significant to the consolidated financial statements for the year ended 31st March 2019. Geographical dispersion of the operations and magnitude of subsidiaries’ contribution to the Group together with the involvement of non-EY auditors increase the complexity as group auditor to obtain an appropriate level of audit evidences.
During our audit we have specifically focused on risks in relation to those significant balances in foreign subsidiaries and we have extended our involvement in audit work performed by the non-EY component auditors as below:• We have involved component auditors to specifically address certain risks and
attention areas defined at Group level, by requiring all teams to complete specific risk-based questionnaires and detailed audit programmes in order to ensure a consistent approach in areas that were deemed most relevant from a Group audit perspective.
• Sent detailed Group audit instructions to the component auditor in accordance with SLAuS 600 requirements specifying the scope, materiality, risk factors and Group reporting deliverables and evaluated the responses received.
• We visited the component auditor (in Thailand and Indonesia) and reviewed the working papers of components auditors, discussed with engagement partners and team members.
The contribution from the foreign subsidiaries to the Group balances are disclosed in Note 33 – Business Segments in the consolidated financial statements.
Assessment of the carrying value of Goodwill Under SLFRSs, the Group is required to annually test the amount of goodwill for impairment. This annual impairment test was significant to our audit because the balance of Rs. 202 million as of 31st March 2019 is material to the financial statements. In addition, management’s assessment process is complex and involves significant judgement and is based on assumptions, specifically discount rates and business growth rates, which are affected by expected future market or economic conditions, particularly those in Thailand and Indonesia.
Our audit procedures in relation to the assessment of the carrying value of Goodwill included the following, among others:• We involved our internal valuation experts to assist us in evaluating:
– the reasonableness of key assumptions such as discount rates, revenue growth rates; and
– appropriateness of the model that calculates future cash flows.• We assessed whether the future cash flows, are consistent with the strategic
plan approved by the Board of Directors and other relevant developments in the businesses of respective cash generating units.
• We also assessed the adequacy of the disclosures in the financial statements with regard to the model and assumptions as disclosed in Note 13 in the consolidated financial statements.
Valuation of Inventories
The Group has an inventory of Rs. 6.8 billion net of impairment as of 31st March 2019, which represents 55% of the current assets of the Group.
The Group has applied judgement in the determination of inventories that are slow moving or obsolete considering the ageing and nature of the items of inventories as described in Note 4.7.8.
Judgement is also required in the identification of inventories that require to be reflected at net realisable value. The estimation of the net realisable value is influenced by the assumptions concerning historical realisation of sale prices and fluctuations in the market prices.
The valuation policy in relation to inventories as adopted by the Group is reflected in Note 3.10 to the financial statements.
The significance of the balance coupled with the judgement involved has resulted in the valuation of inventories being identified as a key audit matter.
Our audit procedures in assessing the appropriateness of the impairment recognised by the Group included: • verifying inventory movements in order to test the reasonability of judgements
applied by management, especially in relation to the non-expiry and continued use of activated carbon and charcoal in the manufacturing process; and
• checking inventory aging reports to assess whether management has appropriately considered slow moving and non-moving inventories for purposes of determining the impairment to be recognised.
For finished goods identified as having an NRV higher than cost, we checked the appropriateness of the net realisable value, performing tests on sales prices secured by the Group for similar or comparable items of inventories.We also assessed the appropriateness of disclosures made in relation to the valuation of inventories in Note 3.10 to the financial statements.

Financial Statements Independent Auditors' ReportH
AYC
AR
B P
LCA
nnua
l Rep
ort 2
018/
19
56
Other information included in the 2019 Annual ReportOther information consists of the information included in the Annual Report, other than the financial statements and our Auditor's Report thereon. Management is responsible for the other information.
Our opinion on the financial statements does not cover the other information and we do not express any form of assurance conclusion thereon.
In connection with our audit of the financial statements, our responsibility is to read the other information and, in doing so, consider whether the other information is materially inconsistent with the financial statements or our knowledge obtained in the audit or otherwise appears to be materially misstated. If, based on the work we have performed, we conclude that there is a material misstatement of this other information, we are required to report that fact. We have nothing to report in this regard.
Responsibilities of Management and those charged with governance Management is responsible for the preparation of financial statements that give a true and fair view in accordance with Sri Lanka Accounting Standards, and for such internal control as management determines is necessary to enable the preparation of financial statements that are free from material misstatement, whether due to fraud or error.
In preparing the financial statements, management is responsible for assessing the Group's ability to continue as a going concern, disclosing, as applicable, matters related to going concern and using the going concern basis of accounting unless management either intends to liquidate the Group or to cease operations, or has no realistic alternative but to do so.
Those charged with governance are responsible for overseeing the Company's and the Group's financial reporting process.
Auditor's responsibilities for the audit of the financial statementsOur objectives are to obtain reasonable assurance about whether the financial statements as a whole are free from material misstatement, whether due to fraud or error, and to issue an Auditor's Report that includes our opinion. Reasonable assurance is a high level of assurance, but is not a guarantee that an audit conducted in accordance with SLAuSs will always detect a material misstatement when it exists. Misstatements can arise from fraud or error and are considered material if, individually or in the aggregate, they could reasonably be expected to influence the economic decisions of users taken on the basis of these financial statements.
As part of an audit in accordance with SLAuSs, we exercise professional judgement and maintain professional skepticism throughout the audit. We also:
• Identify and assess the risks of material misstatement of the financial statements, whether due to fraud or error, design and perform audit procedures responsive to those risks, and obtain audit evidence that is sufficient and appropriate to provide a basis for our opinion. The risk of not detecting a material misstatement resulting from fraud is higher than for one resulting from error, as fraud may involve collusion, forgery, intentional omissions, misrepresentations, or the override of internal control.
• Obtain an understanding of internal control relevant to the audit in order to design audit procedures that are appropriate in the circumstances, but not for the purpose of expressing an opinion on the effectiveness of the internal controls of the Company and the Group.
• Evaluate the appropriateness of accounting policies used and the reasonableness of accounting estimates and related disclosures made by management.
• Conclude on the appropriateness of management's use of the going concern basis of accounting and, based on the audit evidence obtained, whether a material uncertainty exists related to events or conditions that may cast significant doubt on the Group's ability to continue as a going concern. If we conclude that a material uncertainty exists, we are required to draw attention in our Auditor's Report to the related disclosures in the financial statements or, if such disclosures are inadequate, to modify our opinion. Our conclusions are based on the audit evidence obtained up to the date of our Auditor's Report. However, future events or conditions may cause the Group to cease to continue as a going concern.
• Evaluate the overall presentation, structure and content of the financial statements, including the disclosures, and whether the financial statements represent the underlying transactions and events in a manner that achieves fair presentation.
• Obtain sufficient appropriate audit evidence regarding the financial information of the entities or business activities within the Group to express an opinion on the consolidated financial statements. We are responsible for the direction, supervision and performance of the Group audit. We remain solely responsible for our audit opinion.
We communicate with those charged with governance regarding, among other matters, the planned scope and timing of the audit and significant audit findings, including any significant deficiencies in internal control that we identify during our audit.

Financial Statements Independent Auditors' ReportA
nnual Report 2018/19
HAYC
AR
B P
LC
57
We also provide those charged with governance with a statement that we have complied with ethical requirements in accordance with the Code of Ethics regarding independence, and to communicate with them all relationships and other matters that may reasonably be thought to bear on our independence, and where applicable, related safeguards.
From the matters communicated with those charged with governance, we determine those matters that were of most significance in the audit of the financial statements of the current period and are therefore the key audit matters. We describe these matters in our Auditor's Report unless law or regulation precludes public disclosure about the matter or when, in extremely rare circumstances, we determine that a matter should not be communicated in our report because the adverse consequences of doing so would reasonably be expected to outweigh the public interest benefits of such communication.
Report on Other Legal and Regulatory RequirementsAs required by Section 163 (2) of the Companies Act No. 07 of 2007, we have obtained all the information and explanations that were required for the audit and, as far as appears from our examination, proper accounting records have been kept by the Company.
CA Sri Lanka membership number of the engagement partner responsible for signing this independent Auditor's Report is 2440.
14th May 2019Colombo
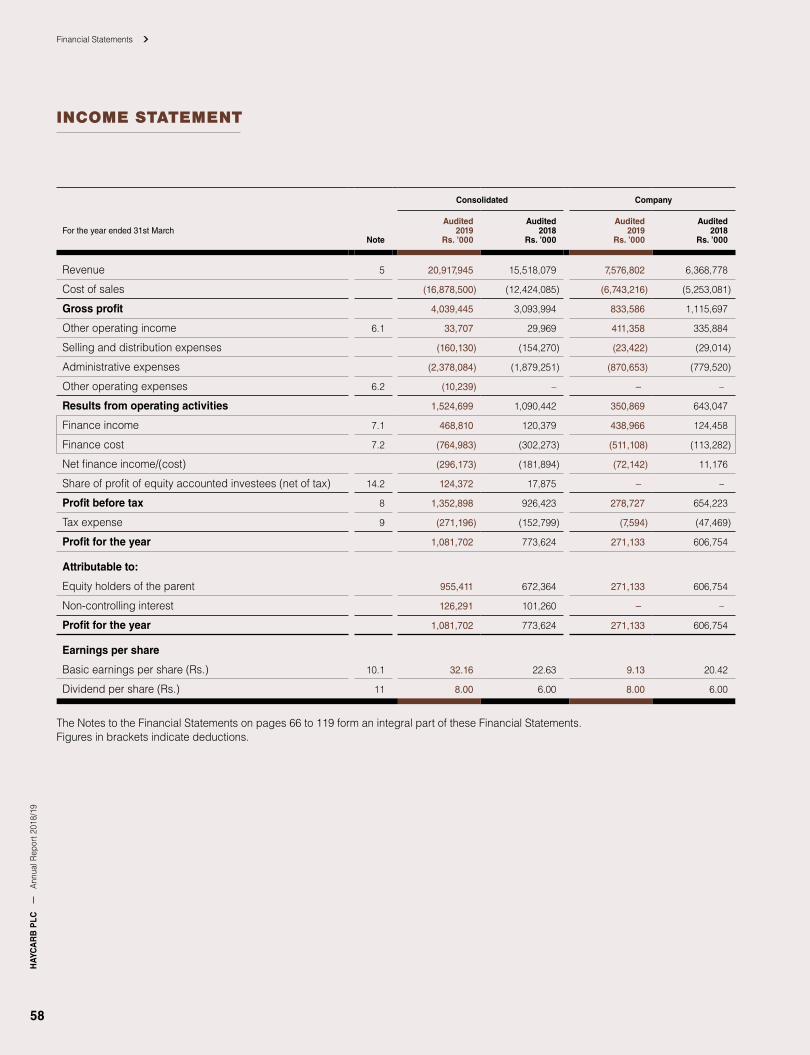
HAY
CA
RB
PLC
Ann
ual R
epor
t 201
8/19
58
Financial Statements
INCOME STATEMENT
Consolidated Company
For the year ended 31st MarchNote
Audited 2019
Rs. ’000
Audited2018
Rs. ’000
Audited2019
Rs. ’000
Audited2018
Rs. ’000
Revenue 5 20,917,945 15,518,079 7,576,802 6,368,778
Cost of sales (16,878,500) (12,424,085) (6,743,216) (5,253,081)
Gross profit 4,039,445 3,093,994 833,586 1,115,697
Other operating income 6.1 33,707 29,969 411,358 335,884
Selling and distribution expenses (160,130) (154,270) (23,422) (29,014)
Administrative expenses (2,378,084) (1,879,251) (870,653) (779,520)
Other operating expenses 6.2 (10,239) – – –
Results from operating activities 1,524,699 1,090,442 350,869 643,047
Finance income 7.1 468,810 120,379 438,966 124,458
Finance cost 7.2 (764,983) (302,273) (511,108) (113,282)
Net finance income/(cost) (296,173) (181,894) (72,142) 11,176
Share of profit of equity accounted investees (net of tax) 14.2 124,372 17,875 – –
Profit before tax 8 1,352,898 926,423 278,727 654,223
Tax expense 9 (271,196) (152,799) (7,594) (47,469)
Profit for the year 1,081,702 773,624 271,133 606,754
Attributable to:
Equity holders of the parent 955,411 672,364 271,133 606,754
Non-controlling interest 126,291 101,260 – –
Profit for the year 1,081,702 773,624 271,133 606,754
Earnings per share
Basic earnings per share (Rs.) 10.1 32.16 22.63 9.13 20.42
Dividend per share (Rs.) 11 8.00 6.00 8.00 6.00
The Notes to the Financial Statements on pages 66 to 119 form an integral part of these Financial Statements. Figures in brackets indicate deductions.
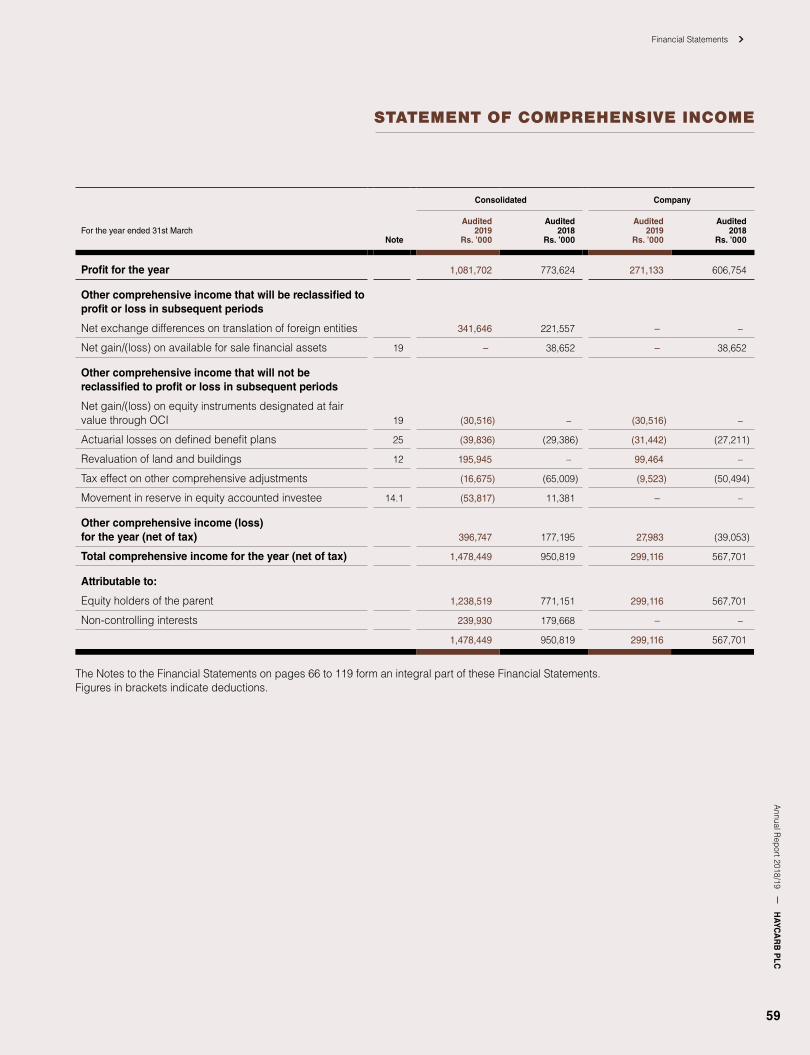
Annual R
eport 2018/19H
AYCA
RB
PLC
59
Financial Statements
STATEMENT OF COMPREHENSIVE INCOME
Consolidated Company
For the year ended 31st MarchNote
Audited2019
Rs. ’000
Audited2018
Rs. ’000
Audited2019
Rs. ’000
Audited2018
Rs. ’000
Profit for the year 1,081,702 773,624 271,133 606,754
Other comprehensive income that will be reclassified to profit or loss in subsequent periods
Net exchange differences on translation of foreign entities 341,646 221,557 – –
Net gain/(loss) on available for sale financial assets 19 – 38,652 – 38,652
Other comprehensive income that will not be reclassified to profit or loss in subsequent periods
Net gain/(loss) on equity instruments designated at fair value through OCI 19 (30,516) – (30,516) –
Actuarial losses on defined benefit plans 25 (39,836) (29,386) (31,442) (27,211)
Revaluation of land and buildings 12 195,945 – 99,464 –
Tax effect on other comprehensive adjustments (16,675) (65,009) (9,523) (50,494)
Movement in reserve in equity accounted investee 14.1 (53,817) 11,381 – –
Other comprehensive income (loss) for the year (net of tax) 396,747 177,195 27,983 (39,053)
Total comprehensive income for the year (net of tax) 1,478,449 950,819 299,116 567,701
Attributable to:
Equity holders of the parent 1,238,519 771,151 299,116 567,701
Non-controlling interests 239,930 179,668 – –
1,478,449 950,819 299,116 567,701
The Notes to the Financial Statements on pages 66 to 119 form an integral part of these Financial Statements.Figures in brackets indicate deductions.

HAY
CA
RB
PLC
Ann
ual R
epor
t 201
8/19
60
Financial Statements
STATEMENT OF FINANCIAL POSITION
Consolidated Company
As at 31st MarchNotes
Audited2019
Rs. ’000
Audited2018
Rs. ’000
Audited2019
Rs. ’000
Audited2018
Rs. ’000
Assets
Non-current assets
Property, plant and equipment 12 5,449,506 5,121,193 1,868,423 1,787,642
Intangible assets 13 248,504 285,856 17,820 27,095
Investments in subsidiaries 16 – – 1,494,769 1,486,895
Investment in equity accounted investees 14 583,765 516,926 92,903 92,903
Non-current receivables from subsidiaries 15.3 – – 268,000 134,386
Other non-current financial assets 19 349,619 385,875 317,851 348,366
Deferred tax assets 26.1 29,772 81,551 – –
Total non-current assets 6,661,166 6,391,401 4,059,766 3,877,287
Current assets
Inventories 17 6,807,033 4,085,980 1,743,262 1,282,321
Trade and other receivables 18 4,061,569 3,279,716 1,638,249 1,165,886
Amounts due from subsidiaries 15.3 – – 1,041,978 1,096,498
Amounts due from other related parties 15.4 12,090 17,106 7,539 –
Amounts due from equity accounted investees 15.5 16,263 26,386 12 1,574
Other current assets 20 532,870 590,862 198,259 269,983
Cash in hand and at bank 21 884,141 891,006 216,151 206,165
Total current assets 12,313,966 8,891,056 4,845,450 4,022,427
Total assets 18,975,132 15,282,457 8,905,216 7,899,714
Equity and liabilities
Equity
Stated capital 22 331,774 331,774 331,774 331,774
Capital reserves 23.1 675,744 648,703 442,458 356,919
Retained earnings 23.2 7,242,868 6,447,363 3,999,725 4,202,121
Equity attributable to equity holders of the Company 8,250,386 7,427,840 4,773,957 4,890,814
Non-controlling interests 1,102,415 909,771 – –
Total equity 9,352,801 8,337,611 4,773,957 4,890,814
Non-current liabilities
Interest-bearing loans and borrowings 24.1 55,218 219,487 52,427 123,821
Employee benefit obligations 25 561,000 464,424 449,605 387,455
Deferred tax liabilities 26.2 203,891 219,199 124,499 117,630
Total non-current liabilities 820,109 903,110 626,531 628,906
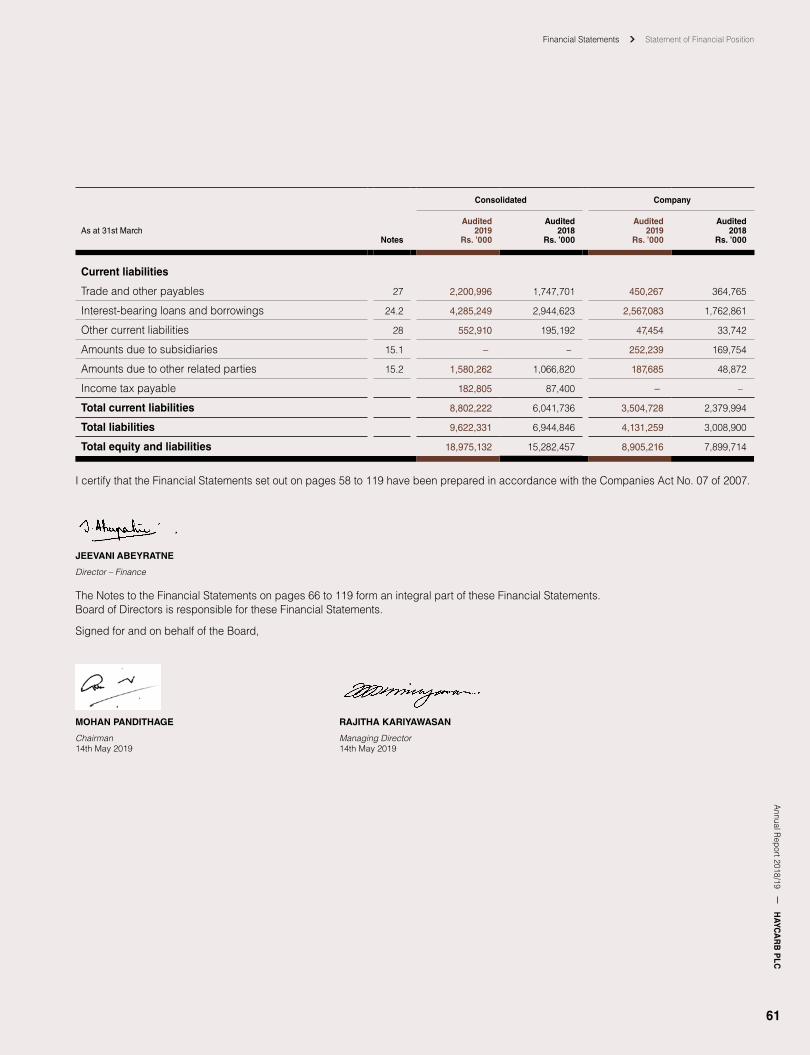
Financial Statements Statement of Financial PositionA
nnual Report 2018/19
HAYC
AR
B P
LC
61
Consolidated Company
As at 31st MarchNotes
Audited2019
Rs. ’000
Audited2018
Rs. ’000
Audited2019
Rs. ’000
Audited2018
Rs. ’000
Current liabilities
Trade and other payables 27 2,200,996 1,747,701 450,267 364,765
Interest-bearing loans and borrowings 24.2 4,285,249 2,944,623 2,567,083 1,762,861
Other current liabilities 28 552,910 195,192 47,454 33,742
Amounts due to subsidiaries 15.1 – – 252,239 169,754
Amounts due to other related parties 15.2 1,580,262 1,066,820 187,685 48,872
Income tax payable 182,805 87,400 – –
Total current liabilities 8,802,222 6,041,736 3,504,728 2,379,994
Total liabilities 9,622,331 6,944,846 4,131,259 3,008,900
Total equity and liabilities 18,975,132 15,282,457 8,905,216 7,899,714
I certify that the Financial Statements set out on pages 58 to 119 have been prepared in accordance with the Companies Act No. 07 of 2007.
JEEVANI ABEYRATNE
Director – Finance
The Notes to the Financial Statements on pages 66 to 119 form an integral part of these Financial Statements. Board of Directors is responsible for these Financial Statements.
Signed for and on behalf of the Board,
MOHAN PANDITHAGE RAJITHA KARIYAWASAN
Chairman Managing Director14th May 2019 14th May 2019

HAY
CA
RB
PLC
Ann
ual R
epor
t 201
8/19
62
Financial Statements
Consolidated
Attributable to equity holders of the parent
Other reserves
Statedcapital
Rs. ’000
Capital reserves
Rs. ’000
Fair value reserve of
financial assets at
FV OCI /AFS
reserve Rs. ’000
Foreigncurrency
translationreserve
Rs. ’000
Generalreserve
Rs. ’000
Retainedearnings
Rs. ’000
Total
Rs. ’000
Non- controlling
interest
Rs. ’000
Totalequity
Rs. ’000
Balance as at 31st March 2017 331,774 717,597 269,054 413,604 519,353 4,494,444 6,745,826 776,762 7,522,588
Profit for the period – – – – – 672,364 672,364 101,260 773,624
Translation of foreign entities – – – 142,376 – – 142,376 79,181 221,557
Actuarial losses on employee benefit obligations – – – – – (28,620) (28,620) (766) (29,386)
Income tax on other comprehensive income – (68,894) – – – 3,892 (65,002) (7) (65,009)
Movement in reserves of equity accounted investees – – – – – 11,381 11,381 – 11,381
Net gain on available-for-sale financial assets – – 38,652 – – – 38,652 – 38,652
Other comprehensive income for the period – (68,894) 38,652 142,376 – (13,347) 98,787 78,408 177,195
Dividends – – – – – (89,137) (89,137) (46,659) (135,796)
Balance as at 31st March 2018 331,774 648,703 307,706 555,980 519,353 5,064,324 7,427,840 909,771 8,337,611
Profit for the period – – – – – 955,411 955,411 126,291 1,081,702
Revaluation during the year – 165,192 – – – – 165,192 30,753 195,945
Translation of foreign entities – – – 252,111 – – 252,111 89,535 341,646
Actuarial losses on employee benefit obligations – – – – – (33,020) (33,020) (6,816) (39,836)
Income tax on other comprehensive income – (20,351) – – – 3,509 (16,842) 167 (16,675)
Movement in reserves of equity accounted investees – (117,800) – – – 63,983 (53,817) – (53,817)
Net gain/(loss) on equity instruments designated at fair value through OCI – – (30,516) – – – (30,516) – (30,516)
Other comprehensive income for the period – 27,041 (30,516) 252,111 – 34,472 283,108 113,639 396,747
Dividends – – – – – (415,973) (415,973) (47,286) (463,259)
Balance as at 31st March 2019 331,774 675,744 277,190 808,091 519,353 5,638,234 8,250,386 1,102,415 9,352,801
STATEMENT OF CHANGES IN EQUITY
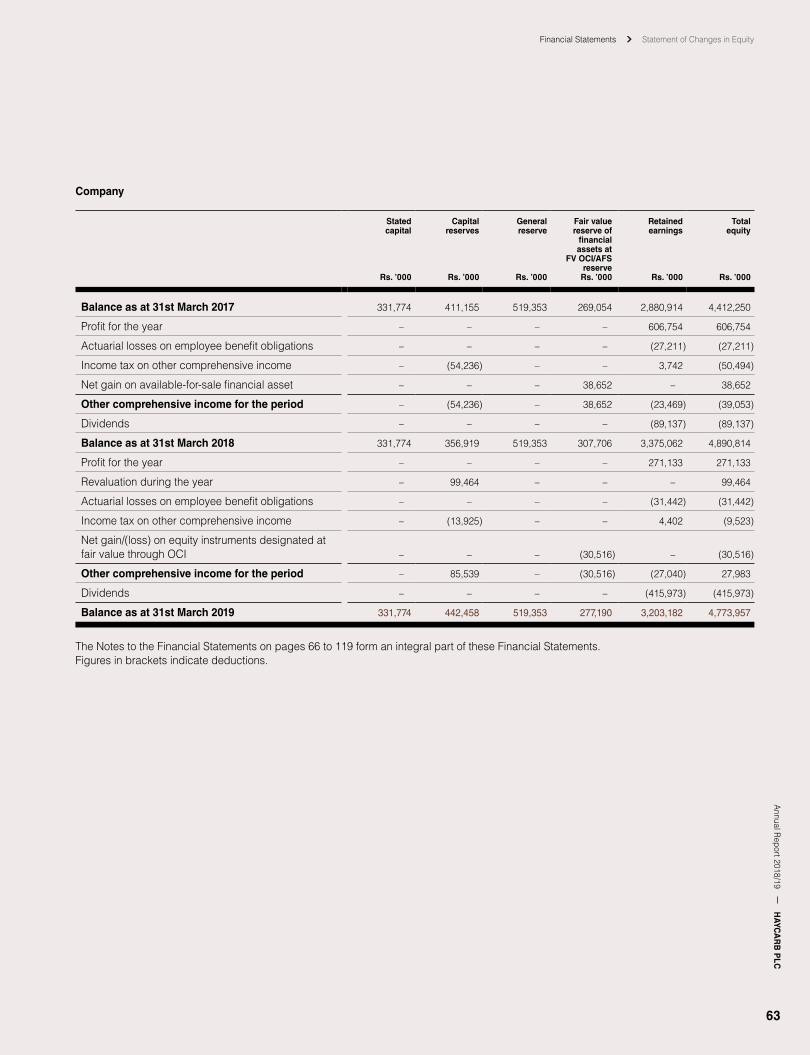
Financial Statements Statement of Changes in EquityA
nnual Report 2018/19
HAYC
AR
B P
LC
63
Company
Stated capital
Rs. ’000
Capitalreserves
Rs. ’000
Generalreserve
Rs. ’000
Fair valuereserve of
financial assets at
FV OCI/AFSreserve
Rs. ’000
Retainedearnings
Rs. ’000
Totalequity
Rs. ’000
Balance as at 31st March 2017 331,774 411,155 519,353 269,054 2,880,914 4,412,250
Profit for the year – – – – 606,754 606,754
Actuarial losses on employee benefit obligations – – – – (27,211) (27,211)
Income tax on other comprehensive income – (54,236) – – 3,742 (50,494)
Net gain on available-for-sale financial asset – – – 38,652 – 38,652
Other comprehensive income for the period – (54,236) – 38,652 (23,469) (39,053)
Dividends – – – – (89,137) (89,137)
Balance as at 31st March 2018 331,774 356,919 519,353 307,706 3,375,062 4,890,814
Profit for the year – – – – 271,133 271,133
Revaluation during the year – 99,464 – – – 99,464
Actuarial losses on employee benefit obligations – – – – (31,442) (31,442)
Income tax on other comprehensive income – (13,925) – – 4,402 (9,523)
Net gain/(loss) on equity instruments designated at fair value through OCI – – – (30,516) – (30,516)
Other comprehensive income for the period – 85,539 – (30,516) (27,040) 27,983
Dividends – – – – (415,973) (415,973)
Balance as at 31st March 2019 331,774 442,458 519,353 277,190 3,203,182 4,773,957
The Notes to the Financial Statements on pages 66 to 119 form an integral part of these Financial Statements.Figures in brackets indicate deductions.

HAY
CA
RB
PLC
Ann
ual R
epor
t 201
8/19
64
Financial Statements
STATEMENT OF CASH FLOWS
Consolidated Company
For the year ended 31st March Note
Audited2019
Rs. ’000
Audited2018
Rs. ’000
Audited2019
Rs. ’000
Audited2018
Rs. ’000
Operating activities
Profit before tax 1,352,898 926,423 278,727 654,223
Non-cash adjustment to reconcile profit before tax to net cash flows:
Depreciation and impairment of property, plant and equipment 12 479,139 426,255 137,572 126,931
Amortisation of intangible assets 13 41,682 32,749 9,275 9,979
(Gain)/loss on disposal of property, plant and equipment 6.1 (1,594) 1 – –
(Gain)/loss on translation of foreign currencies 10,521 2,742 (308) 33,197
Exchange difference on translation of foreign entities 105,706 99,488 – –
Impairment of property, plant and equipment 6.2 10,239 – – –
Finance income 7.1 (468,810) (120,379) (438,966) (124,458)
Finance cost 7.2 764,983 302,273 511,108 113,282
Dividend income - subsidiaries 6.1 – – (261,327) (209,626)
Share of profit of an associate 14 (124,372) (17,875) – –
Provision for slow moving inventory 17 15,403 17,990 3,000 12,175
Provision for unrealised profit on inventories 17 109,501 10,810 – –
Provision/(reversal) for bad and doubtful debts 18 (4,673) 3,527 – –
Provision for employee benefit obligation 25 85,934 74,189 67,872 60,172
Cash generated from operations before working capital changes 2,376,558 1,758,193 306,953 675,875
Working capital adjustments:
(Increase)/decrease in trade and other receivables and prepayments (737,010) (590,283) (400,639) (162,152)
(Increase)/decrease in amounts receivable from related parties 15,139 (20,908) (85,072) (1,561)
(Increase)/decrease in inventories (2,845,957) (638,492) (463,941) (125,595)
Increase/(decrease) in trade and other payables 750,939 47,632 39,142 72,076
Increase/(decrease) in amounts due to related parties 392,684 (51,822) 100,546 (58,589)
(47,647) 504,320 (503,010) 400,054
Interest paid (311,998) (187,952) (133,383) (76,703)
Income tax paid (138,173) (215,543) (10,248) (24,774)
Employee benefit paid 25 (38,593) (7,522) (37,164) (6,159)
Net cash flows from/(used in) operating activities (536,411) 93,303 (683,805) 292,418
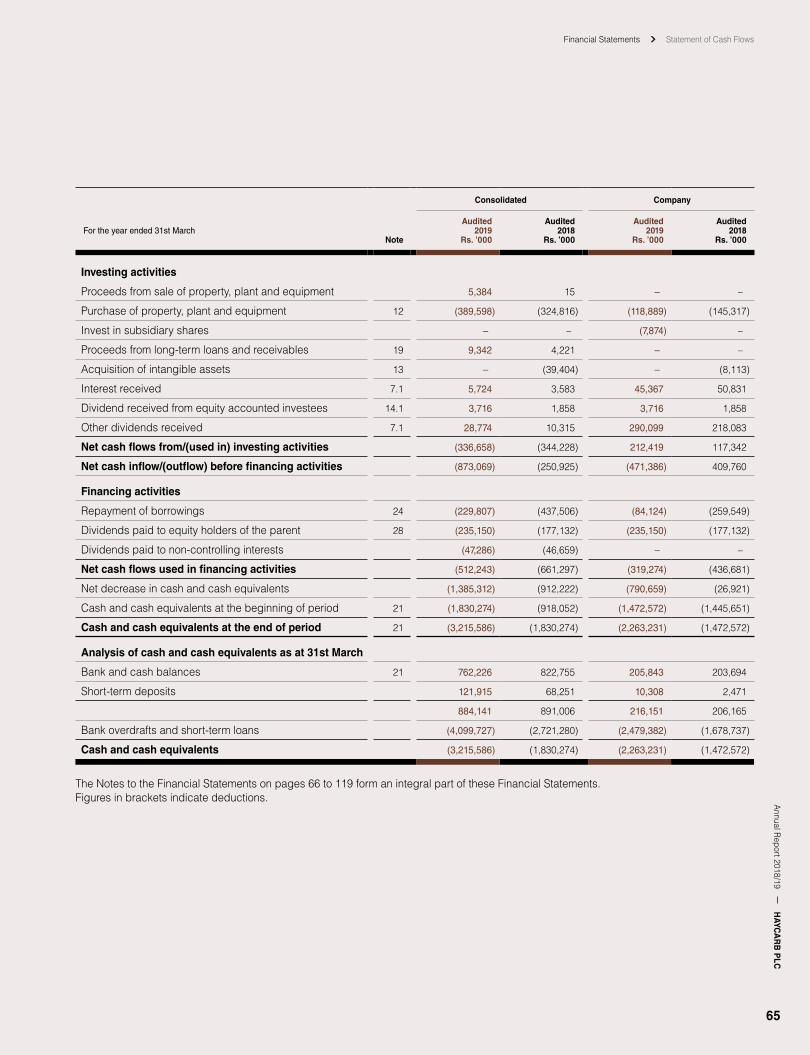
Financial Statements Statement of Cash Flows A
nnual Report 2018/19
HAYC
AR
B P
LC
65
Consolidated Company
For the year ended 31st March Note
Audited2019
Rs. ’000
Audited2018
Rs. ’000
Audited2019
Rs. ’000
Audited2018
Rs. ’000
Investing activities
Proceeds from sale of property, plant and equipment 5,384 15 – –
Purchase of property, plant and equipment 12 (389,598) (324,816) (118,889) (145,317)
Invest in subsidiary shares – – (7,874) –
Proceeds from long-term loans and receivables 19 9,342 4,221 – –
Acquisition of intangible assets 13 – (39,404) – (8,113)
Interest received 7.1 5,724 3,583 45,367 50,831
Dividend received from equity accounted investees 14.1 3,716 1,858 3,716 1,858
Other dividends received 7.1 28,774 10,315 290,099 218,083
Net cash flows from/(used in) investing activities (336,658) (344,228) 212,419 117,342
Net cash inflow/(outflow) before financing activities (873,069) (250,925) (471,386) 409,760
Financing activities
Repayment of borrowings 24 (229,807) (437,506) (84,124) (259,549)
Dividends paid to equity holders of the parent 28 (235,150) (177,132) (235,150) (177,132)
Dividends paid to non-controlling interests (47,286) (46,659) – –
Net cash flows used in financing activities (512,243) (661,297) (319,274) (436,681)
Net decrease in cash and cash equivalents (1,385,312) (912,222) (790,659) (26,921)
Cash and cash equivalents at the beginning of period 21 (1,830,274) (918,052) (1,472,572) (1,445,651)
Cash and cash equivalents at the end of period 21 (3,215,586) (1,830,274) (2,263,231) (1,472,572)
Analysis of cash and cash equivalents as at 31st March
Bank and cash balances 21 762,226 822,755 205,843 203,694
Short-term deposits 121,915 68,251 10,308 2,471
884,141 891,006 216,151 206,165
Bank overdrafts and short-term loans (4,099,727) (2,721,280) (2,479,382) (1,678,737)
Cash and cash equivalents (3,215,586) (1,830,274) (2,263,231) (1,472,572)
The Notes to the Financial Statements on pages 66 to 119 form an integral part of these Financial Statements.Figures in brackets indicate deductions.

HAY
CA
RB
PLC
Ann
ual R
epor
t 201
8/19
66
Financial Statements
NOTES TO THE FINANCIAL STATEMENTS
1. CORPORATE INFORMATION
1.1 Reporting EntityHaycarb PLC is a Company incorporated and domiciled in Sri Lanka. The ordinary shares of the Company are listed on the Colombo Stock Exchange of Sri Lanka. The registered office of the Company is located at No. 400, Deans Road, Colombo 10.
All companies in the Group are limited liability companies and of the eighteen companies, seven [viz., Haycarb PLC, Puritas (Pvt) Ltd., Recogen (Pvt) Ltd., Ultracarb (Pvt) Ltd., Lakdiyatha (Pvt) Ltd., Haycarb Value Added Products (Pvt) Ltd. and Carbotels (Pvt) Ltd.] are incorporated and domiciled in Sri Lanka. The information on incorporation and principal activities of these companies are given on page 126 of the Annual Report.
1.2 Consolidated Financial Statements The Consolidated Financial Statements of Haycarb PLC, as at and for the year ended 31st March 2019 encompasses the Company, its subsidiaries (together referred to as the “Group”) and the Group’s interest in Equity Accounted Investees (Associates and Joint Ventures).
1.3 Nature of Operations and Principal Activities of the Company and the GroupDescriptions of the nature of operations and principal activities of the Company, its subsidiaries and equity accounted investees are given on pages 126 and 127 to the Financial Statements. There were no significant changes in the nature of the principal activities of the Company and the Group during the financial year under review.
The Parent undertaking and controlling party of the Company is Hayleys PLC.
1.4 Approval of Financial Statements The Consolidated Financial Statements of Haycarb PLC and its subsidiaries (collectively, the Group) for the year ended 31 March 2019 were authorised for issue by the Directors on 14th May 2019.
1.5 Responsibility for Financial StatementsThe responsibility of the Directors in relation to the Financial Statements is set out in the Statement of Directors’ Responsibility Report in the Annual Report.
2. BASIS OF PREPARATION
2.1 Statement of ComplianceThe Consolidated Financial Statements have been prepared in accordance with the Sri Lanka Accounting and Auditing Standards Act No. 15 of 1995, which requires compliance with Sri Lanka
Accounting Standards promulgated by the Institute of Chartered Accountants of Sri Lanka (CA Sri Lanka), and with the requirements of the Companies Act No. 07 of 2007.
2.2 Basis of MeasurementThe Consolidated Financial Statements have been prepared on the historical cost basis, except for: Lands which are recognised as property plant and equipment which are measured at cost at the time of the acquisition and subsequently carried at fair value. Financial instruments reflected as fair value through profit or loss which are measured at fair value. Financial instruments designated as fair value through other comprehensive income (OCI) which are measured at fair value. These have been classified as Available for Sale financial instruments up to 31st March 2018. Retirement benefit obligations which are determined based on actuarial valuations.
Where appropriate, the specific policies are explained in the succeeding notes.
No adjustments have been made for inflationary factors in the Consolidated Financial Statements.
2.3 Functional and Presentation CurrencyThe Financial Statements are presented in Sri Lankan Rupees (Rs), which is also the Company’s functional and presentation currency. Subsidiaries whose functional currencies are different as they operate in different economic environments are reflected in Note 36. to the Financial Statements.
All the financial information presented in Sri Lankan Rupees has been rounded to the nearest thousand (Rs.’000), except when otherwise Indicated.
2.4 Materiality and AggregationEach material class of similar items is presented separately in the Consolidated Financial Statements. Items of a dissimilar nature or function are presented separately unless they are immaterial.
2.5 Comparative InformationComparative information including quantitative, narrative and descriptive information as relevant is disclosed in respect of previous period in the Financial Statements. The presentation and classification of the Financial Statement of the previous year are amended, where relevant for better presentation and to be comparable with those of the current year.

Financial Statements Notes to the Financial StatementsA
nnual Report 2018/19
HAYC
AR
B P
LC
67
2.6 OffsettingAssets and liabilities or income and expenses, are not offset unless required or permitted by Sri Lanka Accounting Standards.
3. SUMMARY OF SIGNIFICANT ACCOUNTING POLICIES
3.1 Basis of ConsolidationSubsidiaries and equity accounted investees are disclosed in Note 14 and 16 to the Financial Statements.
3.1.1 SubsidiariesSubsidiaries are those entities controlled by the Group. Control is achieved when the Group is exposed, or rights to variable returns from its involvement with the investee and has the ability to affect those returns through its power over the investee. Specifically, the Group controls an investee if, and only if, the Group has: Power over the investee (i.e., existing rights that give it the current ability to direct the relevant activities of the investee) Exposure, or rights, to variable returns from its involvement with the investee The ability to use its power over the investee to affect its returns
Generally, there is a presumption that a majority of voting rights results in control. To support this presumption and when the Group has less than a majority of the voting or similar rights of an investee, the Group considers all relevant facts and circumstances in assessing whether it has the power over an investee. The contractual arrangement(s) with the other vote holders of the investee. Rights arising from other contractual arrangements The Group’s voting rights and potential voting right.
The Group re-assesses whether or not it controls an investee if facts and circumstances indicate that there are changes to one or more of the three elements of control. Consolidation of a subsidiary begins when the Group obtains control over the subsidiary and ceases when the Group loses control of the subsidiary. Assets, liabilities, income and expenses of a subsidiary acquired or disposed of during the year are included in the Consolidated Financial Statements from the date the Group gains control until the date the Group ceases to control the subsidiary.
Profit or loss and each component of Other Comprehensive Income are attributed to equity holders of the parent of the Group and to the non-controlling interests, even if this results in the non-controlling interests having a deficit balance. When necessary, adjustments are made to the financial statements of subsidiaries to bring their accounting policies into line with the Group’s accounting policies. All intra-group assets and liabilities, equity, income, expenses and cash flows relating to transactions between members of the Group are eliminated in full on consolidation.
A change in the ownership interest of a subsidiary, without a loss of control, is accounted for as an equity transaction.
If the Group loses control over a subsidiary, it derecognises the related assets (including goodwill), liabilities, non-controlling interest and other components of equity while any resultant gain or loss is recognised in profit or loss. Any investment retained is recognised at fair value.
3.1.2 Consolidation of Subsidiaries with Different Accounting PeriodsThe financial statements of all subsidiaries in the Group other than those mentioned in Note 37 to the financial statements are prepared for a common financial year, which ends on 31st March.
The subsidiaries with 31st December financial year ends prepare for consolidation purposes, additional financial information as of the same date as the financial statements of the parent.
3.1.3 Equity Accounted Investees (Investment in Associates)An associate is an entity over which the Group has significant influence. Significant influence is the power to participate in the financial and operating policy decisions of the investee but is not control or joint control over those policies.
The considerations made in determining significant influence or joint control is similar to those necessary to determine control over subsidiaries. The Group’s investments in its associates are accounted for using the equity method.
Under the equity method, the investment in an associate is initially recognised at cost. The carrying amount of the investment is adjusted to recognise changes in the Group’s share of net assets of the associate since the acquisition date. Goodwill relating to the associate is included in the carrying amount of the investment and is not tested for impairment separately.
The Income Statement reflects the Group’s share of the results of operations of the associate. Any change in Other Comprehensive Income of those investees is presented as part of the Group’s Other Comprehensive Income. In addition, when there has been a change recognised directly in the equity of the associate, the Group recognises its share of any changes, when applicable, in the Statement of Changes in Equity. Unrealised gains and losses resulting from transactions between the Group and the associates are eliminated to the extent of the interest in the associates.
The aggregate of the Group’s share of profit or loss of an associate is shown on the face of the Income Statement outside operating profit and represents profit or loss after tax and non-controlling interests in the subsidiaries of the associate.

Financial Statements Notes to the Financial StatementsH
AYC
AR
B P
LCA
nnua
l Rep
ort 2
018/
19
68
The Financial Statements of the associate are prepared for the same reporting period as the Group. When necessary, adjustments are made to bring the accounting policies in line with those of the Group.
After application of the equity method, the Group determines whether it is necessary to recognise an impairment loss on its investment in associate. At each reporting date, the Group determines whether there is objective evidence that the investment in the associate is impaired. If there is such evidence, the Group calculates the amount of impairment as the difference between the recoverable amount of the associate and its carrying value, and then recognises the loss as ‘Share of profit or loss of equity accounted investees’ in the Income Statement.
Upon loss of significant influence over the associate, the Group measures and recognises any retained investment at its fair value. Any difference between the carrying amount of the associate upon loss of significant influence and the fair value of the retained investment and proceeds from disposal is recognised in the Income Statement.
Unrealised gains arising from transactions with equity accounted investees are eliminated against the investment to the extent of the Group’s interest in the investee. Unrealised losses are eliminated in the same way as unrealised gains, but only to the extent that there is no evidence of impairment.
3.2 Business Combination and GoodwillBusiness combinations are accounted for using the acquisition method. The cost of an acquisition is measured as the aggregate of the consideration transferred, which is measured at acquisition date fair value and the amount of any non-controlling interest in the acquiree. For each business combination, the Group elects whether to measures the non-controlling interests in the acquiree at fair value or at the proportionate share of the acquiree’s identifiable net assets.
Transaction costs, other than those associated with the issue of debt or equity securities that the Group incurs in connection with a business combinations are expensed and included in administrative expenses.
When the Group acquires a business, it assesses the financial assets and liabilities assumed for appropriate classification and designation in accordance with the contractual terms, economic circumstances and pertinent conditions as at the acquisition date. This includes the separation of embedded derivatives in host contracts by the acquiree.
If the business combination is achieved in stages, any previously held equity interest is re-measured at its acquisition date fair value and any resulting gain or loss recognised in Income Statement.
Any contingent consideration to be transferred by the acquirer will be recognised at fair value at the acquisition date. Contingent consideration classified as equity is not re-measured and its
subsequent settlement is accounted for within equity. Contingent consideration classified as an asset or liability that is a financial instrument and within the scope of SLFRS 9 Financial Instruments, is measured at fair value with the changes in fair value recognised in the Income Statement in accordance with SLFRS 9. Other contingent consideration that is not within the scope of SLFRS 9 is measured at fair value at each reporting date with changes in fair value recognised in the Income Statement.
Goodwill is initially measured at cost (being the excess of the aggregate of the consideration transferred and the amount recognised for non-controlling interests) and any previous interest held over the net identifiable assets acquired and liabilities assumed. If the fair value of the net assets acquired is in excess of the aggregate consideration transferred, the Group re-assesses whether it has correctly identified all of the assets acquired and all of the liabilities assumed and reviews the procedures used to measure the amounts to be recognised at the acquisition date. If the reassessment still results in an excess of the fair value of net assets acquired over the aggregate consideration transferred, then the gain is recognised in Income Statement.
After initial recognition, goodwill is measured at cost less any accumulated impairment losses. For the purpose of impairment testing, goodwill acquired in a business combination is, from the acquisition date, allocated to each of the Group’s cash-generating units that are expected to benefit from the combination, irrespective of whether other assets or liabilities of the acquiree are assigned to those units.
Where goodwill has been allocated to a cash-generating unit (CGU) and part of the operation within that unit is disposed of, the goodwill associated with the disposed operation is included in the carrying amount of the operation when determining the gain or loss on disposal. Goodwill disposed of in this circumstance is measured based on the relative values of the disposed operation and the portion the cash-generating unit retained.
3.3 Foreign Currency3.3.1 Transactions and BalancesTransactions in foreign currencies are initially recorded by the Group’s entities at their respective functional currency spot rates at the date the transaction first qualifies for recognition.
Monetary assets and liabilities denominated in foreign currencies are translated at the functional currency spot rate of exchange at the reporting date. Differences arising on settlement or translation of monetary items are recognised in Income Statement. Non-monetary assets and liabilities which are measured in terms of historical cost in a foreign currency are translated using exchange rates at the dates of the initial transactions. Non-monetary items measured at fair value in a foreign currency are translated using the exchange rates at the date when the fair value is determined. The gain or loss arising on translation of non-monetary items measured at fair value is treated in line with the recognition of gain or loss on the change in fair value of the item (i.e., translation differences on items whose fair value gain or loss is recognised in OCI or Income Statement).

Financial Statements Notes to the Financial StatementsA
nnual Report 2018/19
HAYC
AR
B P
LC
69
3.3.2 Foreign OperationsThe results and financial position of all Group entities that have a functional currency other than the Sri Lankan Rupee are translated into Sri Lankan Rupees as follows: assets and liabilities of foreign operations, including goodwill and fair value adjustments arising on the acquisition are translated to Sri Lankan Rupees at the exchange rate prevailing at the reporting date; Income and expenses are translated at the average exchange rates for the period.
The exchange differences arising on translation for Consolidation are recognised in Other Comprehensive Income. On disposal of a foreign operation, the relevant amount in the translation reserve is transferred to the Income Statement as part of the profit or loss on disposal. On the partial disposal of a subsidiary that includes a foreign operation, the relevant proportion of such cumulative amount is reattributed to non-controlling interest in that foreign operation. In any other partial disposal of a foreign operation, the relevant proportion is reclassified to the Income Statement.
Any goodwill arising on the acquisition of a foreign operation and any fair value adjustments to the carrying amounts of assets and liabilities arising on the acquisition are treated as assets and liabilities of the foreign operation, and translated at the spot rate of exchange at the reporting date.
3.4 Current versus Non-current ClassificationThe Group presents assets and liabilities in the Statement of Financial Position based on current/non-current classification. An asset is current when it is: Expected to be realised or intended to sold or consumed in a normal operating cycle Held primarily for the purpose of trading Expected to be realised within twelve months after the reporting period, or Cash or cash equivalent unless restricted from being exchanged or used to settle a liability for at least twelve months after the reporting period
All other assets are classified as non-current.
A liability is current when: It is expected to be settled in a normal operating cycle It is held primarily for the purpose of trading It is due to be settled within twelve months after the reporting period, or It does not have a right at the reporting date to defer the settlement of the liability for at least twelve months after the reporting period
The Group classifies all other liabilities as non-current. Deferred tax assets and liabilities are classified as non-current assets and liabilities.
3.5 Fair Value MeasurementThe Group measures financial instruments such as FVOCI/ available-for-sale, derivatives and non-financial assets such as owner occupied lands, at fair value at each reporting date. Fair value related disclosures for financial instruments and non-financial assets that are measured at fair value or where fair values are disclosed are summarised in the following notes: Disclosures for valuation methods, significant estimates and assumptions – Note 19. Property (land) under revaluation model – Note 12. Financial instruments (including those carried at amortised cost) – Note 19.
Fair value is the price that would be received to sell an asset or paid to transfer a liability in an orderly transaction between market participants at the measurement date. The fair value measurement is based on the presumption that the transaction to sell the asset or transfer the liability takes place either: In the principal market for the asset or liability, or In the absence of a principal market, in the most advantageous market for the asset or liability
The principal or the most advantageous market must be accessible by the Group.
The fair value of an asset or a liability is measured using the assumptions that market participants would use when pricing the asset or liability, assuming that market participants act in their economic best interest.
A fair value measurement of a non-financial asset takes into account a market participant’s ability to generate economic benefits by using the asset in its highest and best use or by selling it to another market participant that would use the asset in its highest and best use.
The Group uses valuation techniques that are appropriate in the circumstances and for which sufficient data are available to measure fair value, maximising the use of relevant observable inputs and minimising the use of unobservable inputs.
All assets and liabilities for which fair value is measured or disclosed in the financial statements are categorised within the fair value hierarchy, described as follows, based on the lowest level input that is significant to the fair value measurement as a whole:
Level 1 – Quoted (unadjusted) market prices in active markets for identical assets or liabilities
Level 2 – Valuation techniques for which the lowest level input that is significant to the fair value measurement is directly or indirectly observable
Level 3 – Valuation techniques for which the lowest level input that is significant to the fair value measurement is unobservable
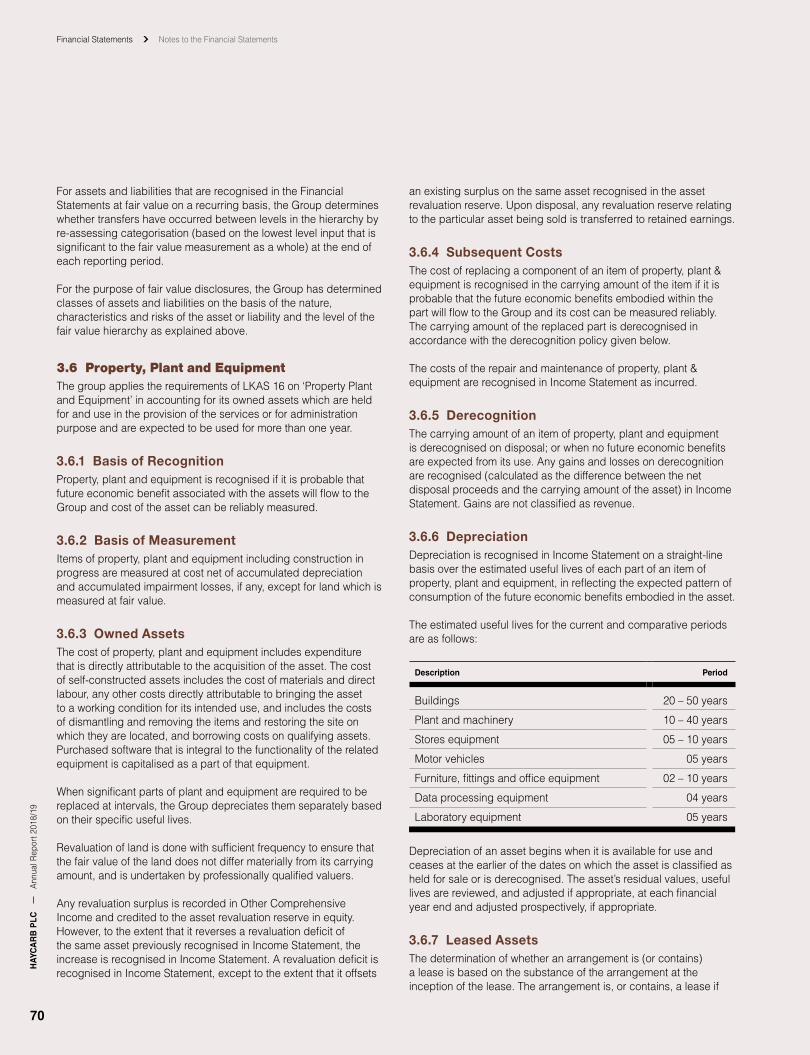
Financial Statements Notes to the Financial StatementsH
AYC
AR
B P
LCA
nnua
l Rep
ort 2
018/
19
70
For assets and liabilities that are recognised in the Financial Statements at fair value on a recurring basis, the Group determines whether transfers have occurred between levels in the hierarchy by re-assessing categorisation (based on the lowest level input that is significant to the fair value measurement as a whole) at the end of each reporting period.
For the purpose of fair value disclosures, the Group has determined classes of assets and liabilities on the basis of the nature, characteristics and risks of the asset or liability and the level of the fair value hierarchy as explained above.
3.6 Property, Plant and EquipmentThe group applies the requirements of LKAS 16 on ‘Property Plant and Equipment’ in accounting for its owned assets which are held for and use in the provision of the services or for administration purpose and are expected to be used for more than one year.
3.6.1 Basis of RecognitionProperty, plant and equipment is recognised if it is probable that future economic benefit associated with the assets will flow to the Group and cost of the asset can be reliably measured.
3.6.2 Basis of MeasurementItems of property, plant and equipment including construction in progress are measured at cost net of accumulated depreciation and accumulated impairment losses, if any, except for land which is measured at fair value.
3.6.3 Owned AssetsThe cost of property, plant and equipment includes expenditure that is directly attributable to the acquisition of the asset. The cost of self-constructed assets includes the cost of materials and direct labour, any other costs directly attributable to bringing the asset to a working condition for its intended use, and includes the costs of dismantling and removing the items and restoring the site on which they are located, and borrowing costs on qualifying assets. Purchased software that is integral to the functionality of the related equipment is capitalised as a part of that equipment.
When significant parts of plant and equipment are required to be replaced at intervals, the Group depreciates them separately based on their specific useful lives.
Revaluation of land is done with sufficient frequency to ensure that the fair value of the land does not differ materially from its carrying amount, and is undertaken by professionally qualified valuers.
Any revaluation surplus is recorded in Other Comprehensive Income and credited to the asset revaluation reserve in equity. However, to the extent that it reverses a revaluation deficit of the same asset previously recognised in Income Statement, the increase is recognised in Income Statement. A revaluation deficit is recognised in Income Statement, except to the extent that it offsets
an existing surplus on the same asset recognised in the asset revaluation reserve. Upon disposal, any revaluation reserve relating to the particular asset being sold is transferred to retained earnings.
3.6.4 Subsequent CostsThe cost of replacing a component of an item of property, plant & equipment is recognised in the carrying amount of the item if it is probable that the future economic benefits embodied within the part will flow to the Group and its cost can be measured reliably. The carrying amount of the replaced part is derecognised in accordance with the derecognition policy given below.
The costs of the repair and maintenance of property, plant & equipment are recognised in Income Statement as incurred.
3.6.5 DerecognitionThe carrying amount of an item of property, plant and equipment is derecognised on disposal; or when no future economic benefits are expected from its use. Any gains and losses on derecognition are recognised (calculated as the difference between the net disposal proceeds and the carrying amount of the asset) in Income Statement. Gains are not classified as revenue.
3.6.6 DepreciationDepreciation is recognised in Income Statement on a straight-line basis over the estimated useful lives of each part of an item of property, plant and equipment, in reflecting the expected pattern of consumption of the future economic benefits embodied in the asset.
The estimated useful lives for the current and comparative periods are as follows:
Description Period
Buildings 20 – 50 years
Plant and machinery 10 – 40 years
Stores equipment 05 – 10 years
Motor vehicles 05 years
Furniture, fittings and office equipment 02 – 10 years
Data processing equipment 04 years
Laboratory equipment 05 years
Depreciation of an asset begins when it is available for use and ceases at the earlier of the dates on which the asset is classified as held for sale or is derecognised. The asset’s residual values, useful lives are reviewed, and adjusted if appropriate, at each financial year end and adjusted prospectively, if appropriate.
3.6.7 Leased AssetsThe determination of whether an arrangement is (or contains) a lease is based on the substance of the arrangement at the inception of the lease. The arrangement is, or contains, a lease if

Financial Statements Notes to the Financial StatementsA
nnual Report 2018/19
HAYC
AR
B P
LC
71
fulfillment of the arrangement is dependent on the use of a specific asset or assets and the arrangement conveys a right to use the asset, even if that right is not explicitly specified in an arrangement.
3.6.8 Group as a LesseeA lease is classified at the inception date as a finance lease or an operating lease. A lease that transfers substantially all the risks and rewards incidental to ownership to the Group is classified as a Finance Lease.
Finance leases are capitalised at the commencement of the lease at the fair value of the leased property or, if lower, at the present value of the minimum lease payments. Lease payments are apportioned between finance charges and reduction of the lease liability so as to achieve a constant rate of interest on the remaining balance of the liability. Finance charges are recognised in finance costs in Income Statement.
A leased asset is depreciated over the useful life of the asset. However, if there is no reasonable certainty that the Group will obtain ownership by the end of the lease term, the asset is depreciated over the shorter of the estimated useful life of the asset and the lease term.
An operating lease is a lease other than a finance lease. Operating lease payments are recognised as an operating expense in Income Statement on a straight-line basis over the lease term.
3.7 Intangible Assets3.7.1 Basis of RecognitionAn Intangible asset is recognised if it is probable that future economic benefit associated with the assets will flow to the Group and cost of the asset can be reliably measured.
3.7.2 Basis of MeasurementIntangible assets acquired separately are measured on initial recognition at cost. The costs of intangible assets acquired in a business combination is their fair value as at the date of acquisition. Following initial recognition, intangible assets are carried at cost less any accumulated amortisation and accumulated impairment losses. Internally generated intangibles, excluding capitalised development costs, are not capitalised and the related expenditure is reflected in Income Statement in the year in which the expenditure is incurred.
3.7.3 Useful Economic Lives and Amortisation The useful lives of intangible assets are assessed as either finite or indefinite.
Intangible assets with finite lives are amortised over the useful economic life and assessed for impairment whenever there is an indication that the intangible asset may be impaired. The amortisation period and the amortisation method for an intangible asset with finite useful lives are reviewed at least at the end of each reporting period. Changes in the expected useful life or the
expected pattern of consumption of future economic benefits embodied in the asset is considered to modify the amortisation period or method, as appropriate, and are treated as changes in accounting estimates. The amortisation expense on intangible assets with finite lives is recognised in Income Statement in the expense category that is consistent with the function of the intangible assets.
Intangible assets with indefinite useful lives are not amortised, but are tested for impairment annually, either individually or at the cash generating unit level. The assessment of indefinite useful life is reviewed annually to determine whether the indefinite life continues to be supportable. If not, the change in useful life from indefinite to finite is made on a prospective basis.
3.7.4 De-recognition of Intangible AssetsIntangible assets are de-recognised on disposal or when no future economic benefits are expected from its use. Gains or losses arising from de-recognition of an intangible asset are measured as the difference between the net disposal proceeds and the carrying amount of the asset and are recognised in Income Statement when the asset is derecognised.
3.7.5 Research and Development Research costs are expensed as incurred. Development expenditures on an individual project are recognised as an intangible asset when the Group can demonstrate: The technical feasibility of completing the intangible asset so that it will be available for use or sale Its intention to complete and its ability and intention to use or sell the asset How the asset will generate future economic benefits The availability of resources to complete the asset The ability to measure reliably the expenditure during development
Following initial recognition of the development expenditure as an asset, the asset is carried at cost less any accumulated amortisation and accumulated impairment losses. Amortisation of the asset begins when development is complete and the asset is available for use. It is amortised over the period of expected future benefit. Amortisation is recorded in cost of sales. During the period of development, the asset is tested for impairment annually if there are indicators of impairment.
3.7.6 Other Intangible Assets.Other intangible assets which are acquired by the Group, with finite useful lives, are measured on initial recognition at cost. Following initial recognition ERP systems are carried at cost less accumulated amortisation and accumulated impairment losses.
Financial Statements Notes to the Financial StatementsH
AYC
AR
B P
LCA
nnua
l Rep
ort 2
018/
19
72
3.7.7 Subsequent Expenditure Subsequent expenditure is capitalised only when it increases the future economic benefits embodied in the specific asset to which it relates. All other expenditure, including expenditure on internally generated goodwill and brands, is recognised in Income Statement as incurred.
3.7.8 AmortisationAmortisation is recognised in profit or loss on a straight-line basis over the estimated useful lives of intangible assets, other than goodwill, trademark and brand name, from the date on which they are available for use. The estimated useful lives are as follows:
Softwares – 5-10 yearsProduct development – 3-5 years
3.8 Financial InstrumentsA financial instrument is any contract that gives rise to a financial asset of one entity and financial liability or equity instrument of another entity.
3.8.1 Financial Assets3.8.1.1 Initial Recognition and Measurement Financial assets are classified, at initial recognition, as subsequently measured at amortised cost, fair value through other comprehensive income (OCI), and fair value through profit or loss.
The classification of financial assets at initial recognition depends on the financial asset’s contractual cash flow characteristics and the Group’s business model for managing them. With the exception of trade receivables that do not contain a significant financing component or for which the Group has applied the practical expedient, the Group initially measures a financial asset at its fair value plus, in the case of a financial asset not at fair value through profit or loss, transaction costs. Trade receivables that do not contain a significant financing component or for which the Group has applied the practical expedient are measured at the transaction price determined under SLFRS 15. In order for a financial asset to be classified and measured at amortised cost or fair value through OCI, it needs to give rise to cash flows that are ‘solely payments of principal and interest (SPPI)’ on the principal amount outstanding. This assessment is referred to as the SPPI test and is performed at an instrument level.
The Group’s business model for managing financial assets refers to how it manages its financial assets in order to generate cash flows. The business model determines whether cash flows will result from collecting contractual cash flows, selling the financial assets, or both.
Purchases or sales of financial assets that require delivery of assets within a time frame established by regulation or convention in the market place (regular way trades) are recognised on the trade date, i.e., the date that the Group commits to purchase or sell the asset.
3.8.1.2 Subsequent MeasurementFor purposes of subsequent measurement, financial assets are classified in four categories. However the Group has only following two categories. Financial assets at amortised cost (debt instruments) Financial assets designated at fair value through OCI with no recycling of cumulative gains and losses upon derecognition (equity instruments)
Financial assets at amortised cost (debt instruments)This category is the most relevant to the Group. The Group measures financial assets at amortised cost if both of the following conditions are met: The financial asset is held within a business model with the objective to hold financial assets in order to collect contractual cash flows, and The contractual terms of the financial asset give rise on specified dates to cash flows that are solely payments of principal and interest on the principal amount outstanding
Financial assets at amortised cost are subsequently measured using the effective interest rate (EIR) method and are subject to impairment. Gains and losses are recognised in Income Statement when the asset is derecognised, modified or impaired.
The Group’s financial assets at amortised cost includes trade receivables, and loan to employees.
These are categorised as loans and receivables up to 31st March 2018. After initial measurement, such financial assets are subsequently measured at amortised cost using effective interest rate method (EIR), less impairment. EIR amortisation is included in finance income and impairment losses of loans and receivables and are recognised in finance cost and other expenses respectively.
Incurred loss model was applied for the impairment of loans and receivables.
Financial Assets Designated at Fair Value through OCI (equity instruments) Upon initial recognition, the Group can elect to classify irrevocably its equity investments as equity instruments designated at fair value through OCI when they meet the definition of equity under LKAS 32 Financial Instruments: Presentation and are not held for trading. The classification is determined on an instrument-by-instrument basis.
Gains and losses on these financial assets are never recycled to profit or loss. Dividends are recognised as other income in Income statement when the right of payment has been established, except when the Group benefits from such proceeds as a recovery of part of the cost of the financial asset, in which case, such gains are recorded in OCI. Equity instruments designated at fair value through OCI are not subject to impairment assessment.

Financial Statements Notes to the Financial StatementsA
nnual Report 2018/19
HAYC
AR
B P
LC
73
The Group elected to classify irrevocably its equity investments under this category.
These are classified as available for sale up to 31st March 2018. After initial measurement, such financial assets are measured at fair value with unrealised gains or losses recognised in other comprehensive income.
3.8.1.3 DerecognitionA financial asset (or, where applicable, a part of a financial asset or part of a group of similar financial assets) is primarily derecognised (i.e: removed from the Group’s consolidated financial position) when:
The rights to receive cash flows from the asset have expired
Or
The Group has transferred its rights to receive cash flows from the asset or has assumed an obligation to pay the received cash flows in full without material delay to a third party under a ‘pass-through’ arrangement; and either (a) the Group has transferred substantially all the risks and rewards of the asset, or (b) the Group has neither transferred nor retained substantially all the risks and rewards of the asset, but has transferred control of the asset.
When the Group has transferred its rights to receive cash flows from an asset or has entered into a pass-through arrangement, it evaluates if and to what extent it has retained the risks and rewards of ownership. When it has neither transferred nor retained substantially all of the risks and rewards of the asset, nor transferred control of the asset, the Group continues to recognise the transferred asset to the extent of its continuing involvement. In that case, the Group also recognises an associated liability. The transferred asset and the associated liability are measured on a basis that reflects the rights and obligations that the Group has retained.
Continuing involvement that takes the form of a guarantee over the transferred asset is measured at the lower of the original carrying amount of the asset and the maximum amount of consideration that the Group could be required to repay.
3.8.1.4 Impairment of Financial AssetsFurther disclosures relating to impairment of financial assets are also provided in the following notes: Disclosures for significant assumptions Note 19. Debt instruments at fair value through OCI Note 19. Trade receivables, including contract assets Notes 17 and 18.
The Group recognises an allowance for expected credit losses (ECLs) for all debt instruments not held at fair value through profit or loss. ECLs are based on the difference between the contractual cash flows due in accordance with the contract and all the cash flows that the Group expects to receive, discounted at an approximation of the original effective interest rate. The expected cash flows will include cash flows from the sale of collateral held or other credit enhancements that are integral to the contractual terms.
ECLs are recognised in two stages. For credit exposures for which there has not been a significant increase in credit risk since initial recognition, ECLs are provided for credit losses that result from default events that are possible within the next 12-months (a 12-month ECL). For those credit exposures for which there has been a significant increase in credit risk since initial recognition, a loss allowance is required for credit losses expected over the remaining life of the exposure, irrespective of the timing of the default (a lifetime ECL).
For trade receivables and contract assets, the Group applies a simplified approach in calculating ECLs. Therefore, the Group does not track changes in credit risk, but instead recognises a loss allowance based on lifetime ECLs at each reporting date. The Group has established a provision matrix that is based on its historical credit loss experience, adjusted for forward-looking factors specific to the debtors and the economic environment.
The Group considers a financial asset in default when contractual payments are 180 days past due. However, in certain cases, the Group may also consider a financial asset to be in default when internal or external information indicates that the Group is unlikely to receive the outstanding contractual amounts in full before taking into account any credit enhancements held by the Group. A financial asset is written off when there is no reasonable expectation of recovering the contractual cash flows.
3.8.2 Financial Liabilities3.8.2.1 Initial Recognition and MeasurementFinancial liabilities are classified, at initial recognition, loans and borrowings, payables or as derivatives designated as hedging instruments in an effective hedge, as appropriate.
All financial liabilities are recognised initially at fair value and in the case of loans and borrowings and payables, net of directly attributable transaction costs.
The Group’s financial liabilities include trade and other payables, bank overdrafts, loans and borrowings, financial guarantee contracts and derivative financial instruments.
3.8.2.2 Subsequent MeasurementThe measurement of financial liabilities depends on their classification as described below:
Loans and BorrowingsAfter initial recognition, interest bearing loans and borrowings are subsequently measured at amortised cost using the EIR method. Gains and losses are recognised in Income Statement when the liabilities are derecognised as well as through the EIR amortisation process.
Amortised cost is calculated by taking into account any discount or premium on acquisition and fees or costs that are an integral part of the EIR. The EIR amortisation is included in finance costs in Income Statement.

Financial Statements Notes to the Financial StatementsH
AYC
AR
B P
LCA
nnua
l Rep
ort 2
018/
19
74
Financial Guarantee ContractsFinancial guarantee contracts issued by the Group are those contracts that require a payment to be made to reimburse the holder for a loss it incurs because the specified debtor fails to make a payment when due in accordance with the terms of a debt instrument. Financial guarantee contracts are recognised initially as a liability at fair value, adjusted for transaction costs that are directly attributable to the issuance of the guarantee. Subsequently, the liability is measured at the higher of the best estimate of the expenditure required to settle the present obligation at the reporting date and the amount recognised less cumulative amortisation.
3.8.2.3 DerecognitionA financial liability is derecognised when the obligation under the liability is discharged or cancelled or expires. When an existing financial liability is replaced by another from the same lender on substantially different terms, or the terms of an existing liability are substantially modified, such an exchange or modification is treated as the derecognition of the original liability and the recognition of a new liability. The difference in the respective carrying amounts is recognised in Income Statement.
3.8.3 Offsetting of Financial Instruments Financial assets and financial liabilities are offset and the net amount reported in the Statement of Financial Position if, There is a currently enforceable legal right to offset the recognised amounts and There is an intention to settle on a net basis, or to realise the assets and settle the liabilities simultaneously
3.8.4 Derivative Financial Instruments3.8.4.1 Initial Recognition and Subsequent MeasurementThe Group uses derivative financial instruments, such as forward currency contracts, to hedge its foreign currency risks. Such derivative financial instruments are initially recognised at fair value on the date on which a derivative contract is entered into and are subsequently remeasured at fair value. Derivatives are carried as financial assets when the fair value is positive and as financial liabilities when the fair value is negative.
3.9 Fair Value of Financial InstrumentsThe fair value of financial instruments that are traded in active markets at each reporting date is determined by reference to quoted market prices or dealer price quotations (bid price for long positions and ask price for short positions), without any deduction for transaction costs.
For financial instruments not traded in an active market, the fair value is determined using appropriate valuation techniques. Such techniques may include: Using recent arm’s length market transactions Reference to the current fair value of another instrument that is substantially the same A discounted cash flow analysis or other valuation models.
An analysis of fair values of financial instruments and further details as to how they are measured are provided in Note 19 to the Financial Statements.
3.10 InventoriesInventories are valued at the lower of cost and net realisable value.
Costs incurred in bringing each product to its present location and condition are accounted for as follows: All inventory items, except manufactured inventories and work-in-progress are measured at weighted average directly attributable cost. Manufactured inventories and work-in-progress are measured at weighted average factory cost which includes all direct expenditure and appropriate share of production overhead based on normal operating capacity but excluding borrowing costs. Projects in progress consists of labour and other cost of personnel directly engaged in providing the service, including supervisory personnel and attributable overheads.
Net realisable value is the estimated selling price in the ordinary course of business less, the estimated cost of completion and the estimated costs necessary to make the sale.
3.11 Impairment of Non-Financial AssetsThe Group assesses, at each reporting date, whether there is an indication that an asset may be impaired. If any indication exists, or when annual impairment testing for an asset is required, the Group estimates the asset’s recoverable amount. An asset’s recoverable amount is the higher of an asset’s or CGU’s fair value less costs of disposal and its value in use. The recoverable amount is determined for an individual asset, unless the asset does not generate cash inflows that are largely independent of those from other assets or groups of assets. When the carrying amount of an asset or CGU exceeds its recoverable amount, the asset is considered impaired and is written down to its recoverable amount.
In assessing value in use, the estimated future cash flows are discounted to their present value using a pre-tax discount rate that reflects current market assessments of the time value of money and the risks specific to the asset. In determining fair value less costs of disposal, recent market transactions are taken into account. If no such transactions can be identified, an appropriate valuation model is used. These calculations are corroborated by valuation multiples, quoted share prices for publicly traded companies or other available fair value indicators.

Financial Statements Notes to the Financial StatementsA
nnual Report 2018/19
HAYC
AR
B P
LC
75
The Group bases its impairment calculation on detailed budgets and forecast calculations, which are prepared separately for each of the Group’s CGUs to which the individual assets are allocated. These budgets and forecast calculations generally cover a period of ten years. A long-term growth rate is calculated and applied to project future cash flows after the tenth year.
Impairment losses of continuing operations are recognised in Income statement in expense categories consistent with the function of the impaired asset, except for properties previously revalued with the revaluation taken to Other Comprehensive Income. For such properties, the impairment is recognised in Other Comprehensive Income up to the amount of any previous revaluation.
For assets excluding goodwill, an assessment is made at each reporting date to determine whether there is an indication that previously recognised impairment losses no longer exist or have decreased. If such indication exists, the Group estimates the asset’s or CGU’s recoverable amount. A previously recognised impairment loss is reversed only if there has been a change in the assumptions used to determine the asset’s recoverable amount since the last impairment loss was recognised. The reversal is limited so that the carrying amount of the asset does not exceed its recoverable amount, nor exceed the carrying amount that would have been determined, net of depreciation, had no impairment loss been recognised for the asset in prior years. Such reversal is recognized in Income statement unless the asset is carried at a revalued amount, in which case, the reversal is treated as a revaluation increase.
Goodwill is tested for impairment annually as at 31 March and when circumstances indicate that the carrying value may be impaired. Impairment is determined for goodwill by assessing the recoverable amount of each CGU (or group of CGUs) to which the goodwill relates. When the recoverable amount of the CGU is less than its carrying amount, an impairment loss is recognised. Impairment losses relating to goodwill cannot be reversed in future periods.
Intangible assets with indefinite useful lives are tested for impairment annually as at 31 March at the CGU level, as appropriate, and when circumstances indicate that the carrying value may be impaired.
3.12 Cash and Cash EquivalentsCash in hand and at bank and short-term deposits in the Statement of Financial Position comprise cash at banks and on hand and short-term deposits with a maturity of three months or less, which are subject to an insignificant risk of changes in value.
For the purpose of the Consolidated Statement of Cash Flows, cash and cash equivalents consist of cash and short-term deposits, as defined above, net of outstanding bank overdrafts and short term borrowings as they are considered an integral part of the Group’s cash management.
3.13 Employee Benefits3.13.1 Defined Contribution PlansA defined contribution plan is a post- employment benefit plan under which an entity pays fixed contributions into a separate entity and will have no legal or constructive obligation to pay further amounts. Obligations for contributions to Provident and Trust Funds covering all employees are recognised as an employee benefit expense in profit or loss in the periods during which services are rendered by employees.
The Group contributes 12% and 3% of gross emoluments to employees as Provident Fund and Trust Fund contribution respectively.
3.13.2 Defined Benefit PlansA defined benefit plan is a post-employment benefit plan other than a defined contribution plan. The defined benefit is calculated by independent actuaries using Projected Unit Credit (PUC) method as recommended by LKAS 19 – “Employee benefits”. The present value of the defined benefit obligation is determined by discounting the estimated future cash outflows using interest rates that are denominated in the currency in which the benefits will be paid, and that have terms to maturity approximating to the terms of the related liability. The present value of the defined benefit obligations depends on a number of factors that are determined on an actuarial basis using a number of assumptions. Key assumptions used in determining the defined retirement benefit obligations are given in Note 25. Any changes in these assumptions will impact the carrying amount of defined benefit obligations. Actuarial gains or losses are recognised in full in the Other Comprehensive Income.
Provision has been made for retirement gratuities from the beginning of service for all employees, in conformity with LKAS 19 on employee benefit. However for entities of the Group operating in Sri Lanka, under the Payment of Gratuity Act No. 12 of 1983, the liability to an employee arises only on completion of 5 years of continued service.
The liability is not externally funded. This liability is settled on the following basis by the respective entities:
Length of each service (Years) No. of month’s salary for completed year of service
Up to 20 1/2
20 up to 25 3/4
25 up to 30 1
30 up to 35 1 1/4
Over 35 1 1/2

Financial Statements Notes to the Financial StatementsH
AYC
AR
B P
LCA
nnua
l Rep
ort 2
018/
19
76
3.13.3 Short-term BenefitsShort-term employee benefit obligations are measured on an undiscounted basis and are expensed as the related service is provided.
3.14 ProvisionsProvisions are recognised when the Group has a present obligation (legal or constructive) as a result of a past event, it is probable that an outflow of resources embodying economic benefits will be required to settle the obligation and a reliable estimate can be made of the amount of the obligation. When the Group expects some or all of a provision to be reimbursed, the reimbursement is recognised as a separate asset, but only when the reimbursement is virtually certain. The expense relating to any provision is presented in Income Statement net of any reimbursement.
If the effect of the time value of money is material, provisions are discounted using a current pre-tax rate that reflects, when appropriate, the risks specific to the liability. When discounting is used, the increase in the provision due to the passage of time is recognised as a finance cost.
3.15 Capital Commitments and ContingenciesCapital commitments and contingent liabilities of the group are disclosed In the Note 31 to the Financial Statements.
3.16 Ordinary SharesOrdinary shares are classified as equity. Incremental costs directly attributable to the issue of ordinary shares are recognised as a deduction from equity, net of any tax effects.
3.17 Revenue from Contracts with CustomersRevenue from contracts with customers is recognised when control of the goods or services are transferred to the customer at an amount that reflects the consideration to which the Group expects to be entitled in exchange for those goods or services.
The Group has several operating segments which are described In Note 33 to these financial statements. In all operating segments, the Group has generally concluded that it is the principal in its revenue arrangements, because it typically controls the goods or services before transferring them to the customer.
Sale of GoodsRevenue from sale of goods is recognised at the point in time when control of the asset is transferred to the customer, generally on delivery of the goods. The Group considers whether there are other promises in the contract that are separate performance obligations to which a portion of the transaction price needs to be allocated (e.g., warranties, customer loyalty points). In determining the transaction price for the sale of goods, the Group considers the effects of variable consideration, the existence of significant financing components, non cash consideration, and consideration payable to the customer (if any).
(i) Variable Consideration If the consideration in a contract includes a variable amount, the Group estimates the amount of consideration to which it will be entitled in exchange for transferring the goods to the customer. The variable consideration is estimated at contract inception and constrained until it is highly probable that a significant revenue reversal in the amount of cumulative revenue recognised will not occur when the associated uncertainty with the variable consideration is subsequently resolved.
(ii) Significant Financing Component The Group receives short-term advances from its customers. Using the practical expedient in SLFRS 15, the Group does not adjust the promised amount of consideration for the effects of a significant financing component if it expects, at contract inception, that the period between the transfer of the promised good or service to the customer and when the customer pays for that good or service will be one year or less. Where long-term advances are received from customers, the transaction price for such contracts is discounted, using the rate that would be reflected in a separate financing transaction between the Group and its customers at contract inception, to take into consideration the significant financing component. There are no any long term advances received form customers which need to be discounted.
Rendering of ServicesEnvironmental Engineering Sector within the Group engage in the provision of services to its customers. The Group recognises revenue from services over time, using an output method to measure progress towards complete satisfaction of the service, because the customer simultaneously receives and consumes the benefits provided by the Group.
Construction ContractsIn relation to contracts which involve the construction of assets on behalf of its customer, the Group assesses the nature of the respective contracts as to whether such is reflective of goods or services transferred at a point in time or satisfied over a period of time.
The Group determines that arrangements include transfers of a good or service over time when any of the following criteria are met: The customer simultaneously receives and consumes the benefits provided by the entity’s performance as the entity performs. The entity’s performance creates or enhances an asset (e.g., work in progress) that the customer controls as the asset is created or enhanced The entity’s performance does not create an asset with an alternative use the entity and the entity has an enforceable right to payment for performance completed to date.

Financial Statements Notes to the Financial StatementsA
nnual Report 2018/19
HAYC
AR
B P
LC
77
When either of the above criteria is met, the Group recognises revenue on the respective contracts similar to the rendering of services. If an entity is unable to demonstrate that control transfers over time, the presumption is that control transfers at a point in time, and revenue Is recognized similar to the sale of goods.
Contract Assets A contract asset is the right to consideration in exchange for goods or services transferred to the customer. If the Group performs by transferring goods or services to a customer before the customer pays consideration or before payment is due, a contract asset is recognised for the earned consideration that is conditional.
Contract Liabilities A contract liability is the obligation to transfer goods or services to a customer for which the Group has received consideration (or an amount of consideration is due) from the customer. If a customer pays consideration before the Group transfers goods or services to the customer, a contract liability is recognised when the payment is made, or the payment is due (whichever is earlier). Contract liabilities are recognised as revenue when the Group performs under the contract.
Cost to Obtain a Contract In several sectors, the Group pays sales commission to its employees and third party representative for sales carried out. The Group has elected to apply the optional practical expedient for costs to obtain a contract which allows the Group to immediately expense sales commissions (included under employee benefits and part of cost of sales) because the amortisation period of the asset that the Group otherwise would have used is one year or less.
InterestInterest income and expense are recognised in Income Statement using the effective interest method. The effective interest rate is the rate that exactly discounts the estimated future cash payments and receipts through the expected life of the financial assets or liability (or, where appropriate a shorter period) to the carrying amount of the financial asset or liability. When calculating the effective interest rate, the Company estimates future cash flows considering all contractual terms of the financial instruments, but not future credit losses.
The calculation of effective interest rate includes all transaction costs and fees and points paid or received that are an integral part of the effective interest rate. Transaction costs include incremental cost that are directly attributable to the acquisition or issue of a financial asset or liability. Interest income is presented in finance income in Income Statement.
Fees and CommissionFees and commission income and expense that are integral to the effective interest rate on a financial asset or liability are included in the measurement of the effective interest rate. Other fees and commission income are recognised as the related services are performed. Other fees and commission expense relate mainly to transactions and service fees, which are expensed as the services are received.
Net Gain/(Loss) from TradingNet gain/(loss) from trading include all realised and unrealised fair value changes from financial assets held for trading and are reflected within other income.
Rental IncomeRental income is recognised in Income Statement on straight line basis.
DividendDividend income is recognised in profit or loss on the date the entity’s right to receive payment is established, which in the case of quoted securities is the ex-dividend date.
Gains and lossesGains and losses on disposal of an item of property, plant & equipment are determined by comparing the net sales proceeds with the carrying amounts of property, plant & equipment and are recognised net within “other income” in Income Statement.
Other incomeOther income is recognised on an accrual basis.
3.18 ExpensesExpenses are recognised in the Income Statement on the basis of a direct association between the cost incurred and the earnings of specific items of income. All expenditure incurred in the running of the business has been charged to income in arriving at the profit for the year. For the purpose of presentation of the Income Statement, the function of expenses method is adopted.
Repairs and renewals are charged to Income Statement in the year in which the expenditure is incurred.

Financial Statements Notes to the Financial StatementsH
AYC
AR
B P
LCA
nnua
l Rep
ort 2
018/
19
78
3.18.1 Borrowing CostsBorrowing costs directly attributable to the acquisition, construction or production of an asset that necessarily takes a substantial period of time to get ready for its intended use or sale are capitalised as part of the cost of the asset. All other borrowing costs are expensed in the period in which they occur. Borrowing costs consist of interest and other costs that an entity incurs in connection with the borrowing of funds.
3.18.2 Finance income and finance costFinance income comprises interest income on funds invested, dividend income, changes in the fair value of financial assets at fair value through profit or loss, and gains on hedging instruments that are recognised in the Income Statement. Interest income is recognised as it accrues in the Income Statement.
Finance cost comprise interest expense on borrowings, unwinding of the discount on provisions, changes in the fair value of financial assets at fair value through profit or loss, and losses on hedging instruments that are recognised in the Income Statement.
3.19 Tax ExpenseTax expense comprises current and deferred tax. Current tax and deferred tax are recognised in the Income Statement except to the extent that it relates to a business combination, or items recognised directly in Equity or in Other Comprehensive Income.
3.19.1 Current TaxCurrent income tax assets and liabilities are measured at the amount expected to be recovered from or paid to the taxation authorities. The tax rates and tax laws used to compute the amount are those that are enacted or substantively enacted at the reporting date in the countries where the Group operates and generates taxable income.
Current tax relating to items recognised directly in Other Comprehensive Income is recognised in Other Comprehensive Income and not in the Income Statement. Management periodically evaluates positions taken in the tax returns with respect to situations in which applicable tax regulations are subject to interpretation and establishes provisions where appropriate.
3.19.2 Deferred TaxDeferred tax is provided using the liability method on temporary differences between the tax bases of assets and liabilities and their carrying amounts for financial reporting purposes at the reporting date.
Deferred tax liabilities are recognised for all taxable temporary differences, except: When the deferred tax liability arises from the initial recognition of goodwill or an asset or liability in a transaction that is not a business combination and, at the time of the transaction, affects neither the accounting profit nor taxable profit or loss In respect of taxable temporary differences associated with investments in subsidiaries and equity accounted investee, when the timing of the reversal of the temporary differences can be controlled and it is probable that the temporary differences will not reverse in the foreseeable future.
Deferred tax assets are recognised for all deductible temporary differences, the carry forward of unused tax credits and any unused tax losses. Deferred tax assets are recognised to the extent that it is probable that taxable profit will be available against which the deductible temporary differences, and the carry forward of unused tax credits and unused tax losses can be utilised, except: When the deferred tax asset relating to the deductible temporary difference arises from the initial recognition of an asset or liability in a transaction that is not a business combination and, at the time of the transaction, affects neither the accounting profit nor taxable profit or loss In respect of deductible temporary differences associated with investments in subsidiaries and equity accounted investee, deferred tax assets are recognised only to the extent that it is probable that the temporary differences will reverse in the foreseeable future and taxable profit will be available against which the temporary differences can be utilised.
The carrying amount of deferred tax assets is reviewed at each reporting date and reduced to the extent that it is no longer probable that sufficient taxable profit will be available to allow all or part of the deferred tax asset to be utilised. Unrecognised deferred tax assets are reassessed at each reporting date and are recognised to the extent that it has become probable that future taxable profits will allow the deferred tax asset to be recovered.
Deferred tax assets and liabilities are measured at the tax rates that are expected to apply in the year when the asset is realised or the liability is settled, based on tax rates that have been enacted or substantively enacted at the reporting date.
Deferred tax relating to items recognised outside the Income Statement is recognised outside the Income Statement. Deferred tax items are recognised in correlation to the underlying transaction either in other comprehensive income or directly in equity.
Tax benefits acquired as part of a business combination, but not satisfying the criteria for separate recognition at that date, would be recognised subsequently if new information about facts and circumstances changed. The adjustment would either be treated as a reduction to goodwill (as long as it does not exceed goodwill) if it was incurred during the measurement period or in the Income Statement.
Financial Statements Notes to the Financial StatementsA
nnual Report 2018/19
HAYC
AR
B P
LC
79
Tax on dividend income from subsidiaries is recognised as an expense in the Consolidated Income Statement at the same time as the liability to pay the related dividend is recognised.
3.19.3 Sales TaxRevenues, expenses and assets are recognised net of the amount of sales tax, except: When the sales tax incurred on a purchase of assets or services is not recoverable from the taxation authority, in which case, the sales tax is recognised as part of the cost of acquisition of the asset or as part of the expense item, as applicable Receivables and payables that are stated with the amount of sales tax.
The net amount of sales tax recoverable from, or payable to, the taxation authority is included as part of receivables or payables in the Statement of Financial Position.
4. GENERAL
4.1 Events Occurring After the Reporting Date All material post reporting date events have been considered and where appropriate adjustments or disclosures have been made in the respective notes to the Financial Statements.
4.2 Earnings Per ShareThe Group presents basic and diluted earnings per share (EPS) for its ordinary shares. Basic EPS is calculated by dividing the profit or loss attributable to ordinary shareholders of the Company by the weighted average number of ordinary shares outstanding during the period. Diluted EPS is determined by adjusting the profit or loss attributable to ordinary shareholders and the weighted average number of ordinary shares outstanding for the effects of all dilutive potential ordinary shares.
4.3 Statement of Cash FlowsThe Statement of Cash Flows has been prepared using the “indirect method”.
Interest paid is classified as an financing cash flow. Dividend and interest income are classified as cash flows from investing activities. Dividends paid are classified as financing cash flows.
4.4 Segment ReportingAn operating segment is a component of the Group that engages in business activities from which it may earn revenues and incur expenses, including revenues and expenses that relate to transactions with any of the Group’s other components. All operating segments’ operating results are reviewed regularly by the Chairman and the Board to make decisions about resources to be allocated to the segment and assess its performance, and for which discrete financial information is available.
Segment results that are reported to the Chairman include items directly attributable to a segment as well as those that can be allocated on a reasonable basis.
Segment capital expenditure is the total cost incurred during the period to acquire property, plant and equipment, and intangible assets other than goodwill.
4.5 Changes in Accounting Policies and Disclosures4.5.1 New and Amended Standards and InterpretationsThe Group applied SLFRS 15 and SLFRS 9 for the first time. The nature and effect of the changes as a result of adoption of these new accounting standards are described below.
Several other amendments and interpretations apply for the first time in 2018/19, but do not have an impact on the consolidated financial statements of the Group. The Group has not early adopted any standards, interpretations or amendments that have been issued but are not yet effective.
4.5.1.1 SLFRS 15 Revenue from Contracts with CustomersSLFRS 15 supersedes LKAS 11 Construction Contracts, LKAS 18 Revenue and related Interpretations and it applies, with limited exceptions, to all revenue arising from contracts with its customers. SLFRS 15 establishes a five-step model to account for revenue arising from contracts with customers and requires that revenue be recognised at an amount that reflects the consideration to which an entity expects to be entitled in exchange for transferring goods or services to a customer.
SLFRS 15 requires entities to exercise judgement, taking into consideration all of the relevant facts and circumstances when applying each step of the model to contracts with their customers. The standard also specifies the accounting for the incremental costs of obtaining a contract and the costs directly related to fulfilling a contract. In addition, the standard requires extensive disclosures.
The Group adopted SLFRS 15 using the modified retrospective method of adoption. Based on the assessment performed, the Group concluded that SLFRS 15 does not have a material impact on the Group's Consolidated Financial Statements.
4.5.1.2 SLFRS 9 Financial InstrumentsSLFRS 9 Financial Instruments replaces LKAS 39 Financial Instruments: Recognition and Measurement for annual periods beginning on or after 1st January 2018, bringing together all three aspects of the accounting for financial instruments: classification and measurement; impairment; and hedge accounting.
The Group has applied SLFRS 9 retrospectively, with the initial application date of 1st April 2018.

Financial Statements Notes to the Financial StatementsH
AYC
AR
B P
LCA
nnua
l Rep
ort 2
018/
19
80
The nature of these adjustments are described below:
4.5.1.2.1 Classification and MeasurementUnder SLFRS 9, debt instruments are subsequently measured at fair value through profit or loss, amortised cost, or fair value through OCI. The classification is based on two criteria: the Group’s business model for managing the assets; and whether the instruments’ contractual cash flows represent ‘solely payments of principal and interest’ on the principal amount outstanding.
The assessment of the Group’s business model was made as of the date of initial application, 1 April 2018, and then applied retrospectively to those financial assets that were not derecognised before 1 April 2018. The assessment of whether contractual cash flows on debt instruments are solely comprised of principal and interest was made based on the facts and circumstances as at the initial recognition of the assets.
The classification and measurement requirements of SLFRS 9 did not have a significant impact on the Group. The Group continued measuring at fair value all financial assets previously held at fair value under LKAS 39. The following are the changes in the classification of the Group’s financial assets: Equity investments in Listed companies and non-listed companies previously classified as AFS financial assets are now classified and measured as Equity instruments designated at fair value through OCI. The Group elected to classify irrevocably these listed and non-listed equity investments under this category as it intends to hold these investments for the foreseeable future.
4.5.1.2.2 ImpairmentThe adoption of SLFRS 9 has fundamentally changed the Group’s accounting for impairment losses for financial assets by replacing LKAS 39’s incurred loss approach with a forward-looking expected credit loss (ECL) approach. SLFRS 9 requires the Group to recognise an allowance for ECLs for all debt instruments not held at fair value through profit or loss and contract assets.
4.6 Standards Issued but not yet Effective The standards and interpretations that are issued, but not yet effective, up to the date of issuance of the Group’s financial statements are disclosed below. The Group intends to adopt these standards, if applicable, when they become effective.
SLFRS 16 LeasesSLFRS 16 sets out the principles for the recognition, measurement, presentation and disclosure of leases for both parties to a contract, i.e. the customer (‘Lessee’] and the supplier (‘Lessor’]. SLFRS 16 will replace Sri Lanka Accounting Standard – LKAS 17 (Leases) and related interpretations.
SLFRS 16 introduces a single accounting model for the lessee, eliminating the present classification of leases in LKAS 17 as either operating leases or finance leases.
The new Standard requires a lessee to: recognise assets and liabilities for all leases with a term of more than 12 months, unless the underlying asset is of low value. present depreciation of lease assets separately, from interest on lease liabilities in the income statement.
SLFRS – 16 substantially carries forward the lessor accounting requirement in LKAS – 17. Accordingly, a lessor continues to classify its leases as operating lease or finance lease, and to account for those two types of leases differently.
SLFRS –16 will become effective on 1st January 2019. The impact on the implementation of the above Standard has not been quantified yet.
4.7 Critical Accounting Estimates and JudgementsThe preparation of Financial Statements in conformity with SLFRS/LKAS’s requires management to make judgements, estimates and assumptions that affect the application of accounting policies and the reported amounts of assets, liabilities, income and expenses. Judgements and estimates are based on historical experience and other factors, including expectations that are believed to be reasonable under the circumstances. Hence actual experience and results may differ from these judgements and estimates.
Estimates and underlying assumptions are reviewed on an ongoing basis. Revisions to accounting estimates are recognised in the period in which the estimates are revised if the revision affects only that period and any future periods.
Information about significant areas of estimation uncertainty and critical judgements in applying accounting policies that have the most significant effect on the amounts recognised in the financial statements is included in the following notes:
4.7.1 Going ConcernThe Directors have made an assessment of the Group’s ability to continue as a going concern and is satisfied that it has the resources to continue in business for the foreseeable future. Furthermore, management is not aware of any material uncertainties that may cast significant doubt upon the Group’s ability to continue as a going concern. Therefore, the Financial Statements continue to be prepared on the going concern basis.
4.7.2 Measurement of the Recoverable Amount of Cash-Generating Units Containing GoodwillThe Group tests annually whether goodwill requires impairment, in accordance with the accounting policy stated in Note 3.2. The basis of determining the recoverable amounts of cash generating units and key assumptions used are given in Note 13 to the Financial Statements.
Financial Statements Notes to the Financial StatementsA
nnual Report 2018/19
HAYC
AR
B P
LC
81
4.7.3 TaxationUncertainties exist with respect to the interpretation of complex tax regulation, changes in tax laws, and the amount and timing of future taxable income. Given the wide range of international business relationships and the long-term nature and the complexity of existing contractual agreements, differences arising between the actual results and the assumptions made, or future changes to such assumptions, could necessitate future adjustments to tax income and expense already recorded. The Group establish provisions, based on reasonable estimates, for possible consequences of audits by the tax authorities of the respective countries in which it operates. The amount of such provisions is based on various factors, such as experience of previous tax audits and differing interpretations of tax regulations by the taxable entity and the responsible tax authority. Such differences of interpretation may arise on a wide variety of issues depending on the conditions prevailing in the respective domicile of the Group companies.
Deferred tax assets are recognised for unused tax losses to the extent that it is probable that taxable profit will be available against which the losses can be utilised. Significant management judgement is required to determine the amount of deferred tax assets that can be recognised, based on upon the likely timing and the level of future taxable profits together as with future tax planning strategies.
4.7.4 Measurement of the Employee Benefit ObligationsThe present value of the employee benefit obligations depends on a number of factors that are determined on an actuarial basis using a number of assumptions. Key assumptions used in determining the defined retirement benefit obligations are given in Note 25 to the Financial Statements. Any changes in these assumptions will impact the carrying amount of employee benefit obligations.
4.7.5 Impairment of Property, Plant and Equipment and Intangible Assets other than GoodwillThe impairment analysis is principally based upon discounted estimated cash flows from the use and eventual disposal of the assets. Factors like lower than anticipated sales and resulting decreases of net cash flows and changes in the discount rates could lead to impairment.
4.7.6 Revaluation of LandThe Group measures lands which are recognised as property, plant & equipment at revalued amount with change in value being recognised in the Statement of Other Comprehensive Income. The valuer has used the open market approach in determining the fair value of the land. Further details on Revaluation of land are disclosed in Note 12 to the Financial Statements.
4.7.7 Consolidation of Entities in which the Group Holds 50% of the Voting RightsThe Group holds 50% of the issued share capital of Carbokarn Company Ltd.,(CK) Thailand which in turn is the Parent Company of two fully-owned subsidiaries; CK Regen Systems Co. Ltd. and Shizuka Co. Ltd. Although the Group holds 50% of the issued capital of the mentioned entities they are considered as subsidiaries for financial reporting after due consideration of the agreements with partners and the current operating arrangement.
4.7.8 Valuation of InventoriesThe Group has applied judgment in the determination of inventories that are slow moving or obsolete considering the aging and nature of the inventories. For activated carbon and charcoal inventories, no impairment is recognized on the basis that such stocks do not have an expiry and are continued to be used in the manufacturing processes of the Group. For other items of inventories, management makes the determination of whether stocks are slow moving or non moving based on the aging of such inventories. Judgment is also required on the identification of inventories that require to be reflected at net realizable value. The estimates and judgments applied by the management are influenced by historical realized sales prices, and fluctuations in market prices.

Financial Statements Notes to the Financial StatementsH
AYC
AR
B P
LCA
nnua
l Rep
ort 2
018/
19
82
5. REVENUE
Timing of Revenue Recognition
Consolidated Company
For the year ended 31st March 2019Rs. ’000
2018Rs. ’000
2019Rs. ’000
2018Rs. ’000
Sale of goods
Goods transferred at a point in time 26,068,872 19,270,211 7,576,802 6,368,778
Services transferred over time 2,800,015 1,168,222 – –
28,868,887 20,438,433 7,576,802 6,368,778
Intra group revenue (7,950,942) (4,920,354) – –
Total revenue from contracts with customers 20,917,945 15,518,079 7,576,802 6,368,778
5.1 Contract BalancesContract assets of the Group relating to projects in progress amount to Rs. 613,078,000/- (2018 – Rs. 84,814,000/-) and is reflected within Inventories in Note 17. Contract liabilities of the Group relate to payments received in advance as reflected in Note 28 and amounts to Rs. 552,910,000/- (2018 – Rs. 195,192,000/-).
6. OTHER OPERATING INCOME/EXPENSE
6.1 Other Operating Income
Consolidated Company
For the year ended 31st March 2019Rs. ’000
2018Rs. ’000
2019Rs. ’000
2018Rs. ’000
Export incentive income 3,568 2,640 – –
Net gain/(loss) on disposal of property, plant and equipment 1,594 (1) – –
Fees for marketing services – – 61,571 42,348
Sundry income 27,225 20,144 9,291 6,264
Rental income – – 9,020 7,817
Income from technical consultations 1,320 7,186 70,149 69,829
Dividend income – subsidiaries – – 261,327 209,626
33,707 29,969 411,358 335,884
6.2 Other Operating Expenses
For the year ended 31st March 2019Rs. ’000
2018Rs. ’000
2019Rs. ’000
2018Rs. ’000
Impairment of property, plant and equipment 10,239 – – –
10,239 – – –

Financial Statements Notes to the Financial StatementsA
nnual Report 2018/19
HAYC
AR
B P
LC
83
7. NET FINANCE COST
7.1 Finance Income
Consolidated Company
For the year ended 31st March 2019Rs. ’000
2018Rs. ’000
2019Rs. ’000
2018Rs. ’000
Dividend income – quoted 28,773 10,183 28,773 10,183
– unquoted 1 132 3,716 132
Interest income on loans and receivables 5,724 3,583 45,367 50,831
Gain on translation of foreign currency 434,312 106,481 361,110 63,312
Total finance income 468,810 120,379 438,966 124,458
7.2 Finance Cost
Consolidated Company
For the year ended 31st March 2019Rs. ’000
2018Rs. ’000
2019Rs. ’000
2018Rs. ’000
Interest cost – Short-term borrowings 254,684 128,680 124,307 64,748
– Long-term borrowings 57,314 59,272 9,076 11,955
Loss on translation of foreign currency 452,985 114,321 377,725 36,579
Total finance cost 764,983 302,273 511,108 113,282
Net finance income/(cost) (296,173) (181,894) (72,142) 11,176
8. PROFIT BEFORE TAX
8.1
Consolidated
For the year ended 31st March 2019Rs. ’000
2018Rs. ’000
Haycarb PLC 278,727 654,223
Subsidiaries 1,324,268 472,481
Equity accounted investees 124,372 17,875
1,727,367 1,144,579
Unrealised profit on intra-group sales (109,501) (10,810)
Intra-group adjustments (264,967) (207,346)
1,352,898 926,423

Financial Statements Notes to the Financial StatementsH
AYC
AR
B P
LCA
nnua
l Rep
ort 2
018/
19
84
8.2 Profit before tax is stated after charging all expenses including the following:
Consolidated Company
For the year ended 31st March 2019Rs. ’000
2018Rs. ’000
2019Rs. ’000
2018Rs. ’000
Depreciation on property, plant and equipment 479,139 426,255 137,572 126,931
Directors’ emoluments including Non-Executive Directors’ consultation fees 156,876 151,914 118,292 111,868
Auditor’s remuneration (fees and expenses):
Ernst & Young 3,014 2,775 1,821 1,734
Others 11,828 9,756 – –
Fees paid to Auditors for non-audit work
Ernst & Young 8,671 5,210 2,931 1,787
Others 1,532 857 – –
Donations 3,610 3,521 2,073 1,866
Provision for slow moving inventories 15,403 17,990 3,000 12,175
Provision of unrealised profits in inventories 109,501 10,810 – –
Provision/(reversal) for bad and doubtful debts (4,673) 3,527 – –
Staff training and development 2,231 1,272 1,169 961
Legal/litigation fees 14,588 6,738 626 1,316
Staff costs (Note 8.2.1) 1,845,141 1,563,132 739,496 661,111
8.2.1 Staff Costs
Consolidated Company
For the year ended 31st March 2019Rs. ’000
2018Rs. ’000
2019Rs. ’000
2018Rs. ’000
Defined contribution plan cost 133,883 109,780 84,975 75,942
Defined benefit plan cost 85,934 74,189 67,872 60,172
Other staff cost 1,625,324 1,379,163 586,649 524,997
1,845,141 1,563,132 739,496 661,111
Number of employees at year end 1,436 1,411 781 772

Financial Statements Notes to the Financial StatementsA
nnual Report 2018/19
HAYC
AR
B P
LC
85
9. TAX EXPENSE
9.1 The corporate rate of tax applicable to Haycarb PLC and other local companies within the Group, excluding those which enjoy a concessionary rate of tax as referred to below is 28%.
In terms of Section 203 of the Inland Revenue Act No. 24 of 2017, qualified export profits enjoy a concessionary rate of tax at 14% (in 2017/18 12%).
Haycarb Value Added Products (Pvt) Ltd., and Ultracarb (Pvt) Ltd., are entitled for income tax exemption under the terms of the Inland Revenue Act Section 16C in respect of manufacturing of activated carbon commencing from the financial year 2013/14.
Shizuka Co. Ltd. is entitled for 8 years tax holiday from the year of commencement of operation. The operations commenced for this purpose in September 2011.
The overseas companies, namely Eurocarb Products Ltd., Haycarb Holding Australia (Pty) Ltd., Haycarb USA Inc., Carbokarn Co. Ltd., CK Regen Systems Co. Ltd., and PT Mapalus Makawanua Charcoal Industry and PT Haycarb Palu Mitra are liable to tax at 20%, 30%, 21%, 20%, 20%, 25% and 25% respectively.
Haycarb Holdings Bitung Ltd., is exempt from tax.
9.2 Tax Expense
Consolidated Company
For the year ended 31st March 2019Rs. ’000
2018Rs. ’000
2019Rs. ’000
2018Rs. ’000
Sri Lanka taxes
Haycarb PLC 3,558 40,529 3,558 40,529
Subsidiaries 47,152 59,508 – –
50,710 100,037 3,558 40,529
Overseas taxes
Subsidiaries 176,973 68,132 – –
227,683 168,169 3,558 40,529
Under/(Over) provision in respect of previous years
Haycarb PLC 6,690 (22,288) 6,690 (22,288)
Subsidiaries (24,110) (264) – –
(17,420) (22,552) 6,690 (22,288)
Deferred taxation
Haycarb PLC 6,869 79,721 6,869 79,721
Subsidiaries 36,870 (26,776) – –
43,739 52,945 6,869 79,721
Tax on dividend income 33,868 19,243 – –
Total tax provisions 287,870 217,806 17,117 97,962
Tax on other comprehensive income (16,674) (65,007) (9,523) (50,493)
271,196 152,799 7,594 47,469

Financial Statements Notes to the Financial StatementsH
AYC
AR
B P
LCA
nnua
l Rep
ort 2
018/
19
86
9.3 Tax Reconciliation Statement
Consolidated Company
For the year ended 31st March 2019Rs. ’000
2018Rs. ’000
2019Rs. ’000
2018Rs. ’000
Profit before tax 1,352,898 926,423 278,727 654,223
Share of profit of equity accounted investees (124,372) (17,875) – –
Consolidation adjustments 374,468 218,156 – –
1,602,994 1,126,704 278,727 654,223
Tax exempt income (454,306) (443,796) (293,815) (247,180)
Disallowable expenses 687,009 519,935 262,703 202,649
Allowable expenses (780,087) (557,937) (267,569) (306,202)
Tax losses brought forward (291,715) (175,621) – –
Other taxable income 63,722 68,777 45,367 50,131
Tax losses carried forward 161,843 291,715 – –
Taxable profit 989,461 829,777 25,412 353,621
Tax @ 12% – 44,861 – 40,293
Tax @ 14% 3,558 – 3,558 –
Tax @ 28% 47,152 55,176 – 236
Tax at other rates 176,973 68,132 – –
227,683 168,169 3,558 40,529
Under/(over) provision in previous year (17,420) (22,552) 6,690 (22,288)
Deferred tax charge/(credit) 27,066 (12,062) (2,654) 29,228
Tax on dividend income 33,868 19,243 – –
Tax expense for the year 271,196 152,799 7,594 47,469
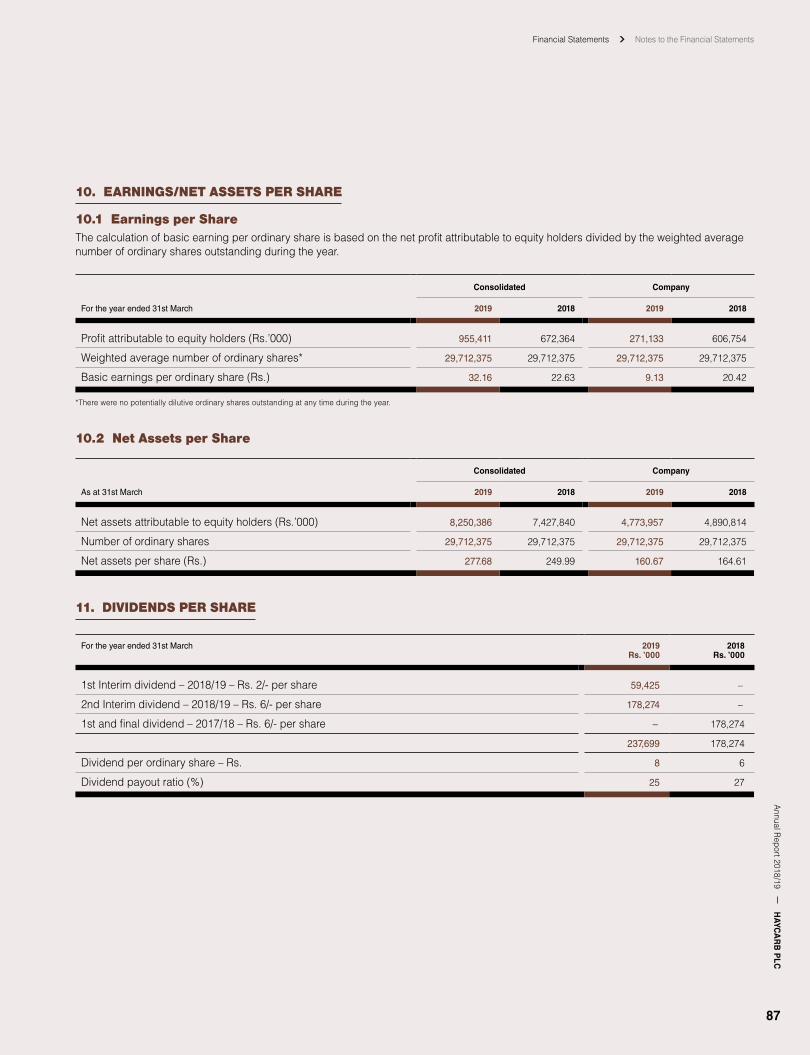
Financial Statements Notes to the Financial StatementsA
nnual Report 2018/19
HAYC
AR
B P
LC
87
10. EARNINGS/NET ASSETS PER SHARE
10.1 Earnings per Share The calculation of basic earning per ordinary share is based on the net profit attributable to equity holders divided by the weighted average number of ordinary shares outstanding during the year.
Consolidated Company
For the year ended 31st March 2019 2018 2019 2018
Profit attributable to equity holders (Rs.’000) 955,411 672,364 271,133 606,754
Weighted average number of ordinary shares* 29,712,375 29,712,375 29,712,375 29,712,375
Basic earnings per ordinary share (Rs.) 32.16 22.63 9.13 20.42
*There were no potentially dilutive ordinary shares outstanding at any time during the year.
10.2 Net Assets per Share
Consolidated Company
As at 31st March 2019 2018 2019 2018
Net assets attributable to equity holders (Rs.’000) 8,250,386 7,427,840 4,773,957 4,890,814
Number of ordinary shares 29,712,375 29,712,375 29,712,375 29,712,375
Net assets per share (Rs.) 277.68 249.99 160.67 164.61
11. DIVIDENDS PER SHARE
For the year ended 31st March 2019Rs. ’000
2018Rs. ’000
1st Interim dividend – 2018/19 – Rs. 2/- per share 59,425 –
2nd Interim dividend – 2018/19 – Rs. 6/- per share 178,274 –
1st and final dividend – 2017/18 – Rs. 6/- per share – 178,274
237,699 178,274
Dividend per ordinary share – Rs. 8 6
Dividend payout ratio (%) 25 27

Financial Statements Notes to the Financial StatementsH
AYC
AR
B P
LCA
nnua
l Rep
ort 2
018/
19
88
12. PROPERTY, PLANT AND EQUIPMENT
12.1 Consolidated
Freeholdland
Rs. ’000
Freeholdbuildings
Rs. ’000
Machinery andequipment
freeholdRs. ’000
Vehicles
Rs. ’000
Furniturefittings and
office equipmentRs. ’000
Data processingequipment
Rs. ’000
Total
Rs. ’000
Cost or valuation
At 31st March 2017 1,019,651 1,348,985 4,705,342 170,034 147,881 66,798 7,458,690
Additions 12,408 56,567 391,780 8,157 11,998 3,327 484,237
Disposals – – (1,578) – (163) – (1,741)
Transfer 10,060 (10,060) – – – – –
Effect of movement in exchange rate 26,885 56,826 168,542 4,895 7,671 – 264,819
At 31st March 2018 1,069,004 1,452,318 5,264,086 183,086 167,387 70,125 8,206,005
Additions 903 24,833 403,476 33,791 15,844 5,712 484,560
Disposals and impairment – (9,439) (8,243) (4,385) (114) (206) (22,387)
Revaluations 195,945 – – – – – 195,945
Effect of movement in exchange rate 36,165 85,533 300,165 9,061 11,059 – 441,983
At 31st March 2019 1,302,017 1,553,245 5,959,484 221,553 194,176 75,631 9,306,106
Depreciation and impairment
At 31st March 2017 – 296,322 2,345,194 60,282 81,121 57,412 2,840,329
Depreciation charge for the year – 48,761 336,037 22,038 15,558 3,861 426,255
Disposals – – (1,563) – (162) – (1,725)
Effect of movement in exchange rate – 19,057 116,173 3,084 4,436 – 142,750
At 31st March 2018 – 364,140 2,795,841 85,404 100,953 61,273 3,407,609
Depreciation charge for the year – 54,927 371,027 28,236 20,427 4,522 479,139
Disposals and impairment – (2,146) (1,568) (4,340) (98) (206) (8,358)
Effect of movement in exchange rate – 27,893 166,034 4,983 7,133 – 206,043
At 31st March 2019 – 444,814 3,331,334 114,283 128,414 65,589 4,084,434
Capital work-in-progress
At 31st March 2019 – – – – – – 253,377
At 31st March 2018 – – – – – – 348,339
Impairment Provision
At 31st March 2019 – – (25,543) – – – (25,543)
At 31st March 2018 – – (25,543) – – – (25,543)
Net book value
At 31st March 2019 1,302,017 1,108,430 2,602,607 107,271 65,762 10,042 5,449,506
At 31st March 2018 1,069,004 1,088,178 2,442,702 97,682 66,434 8,852 5,121,193
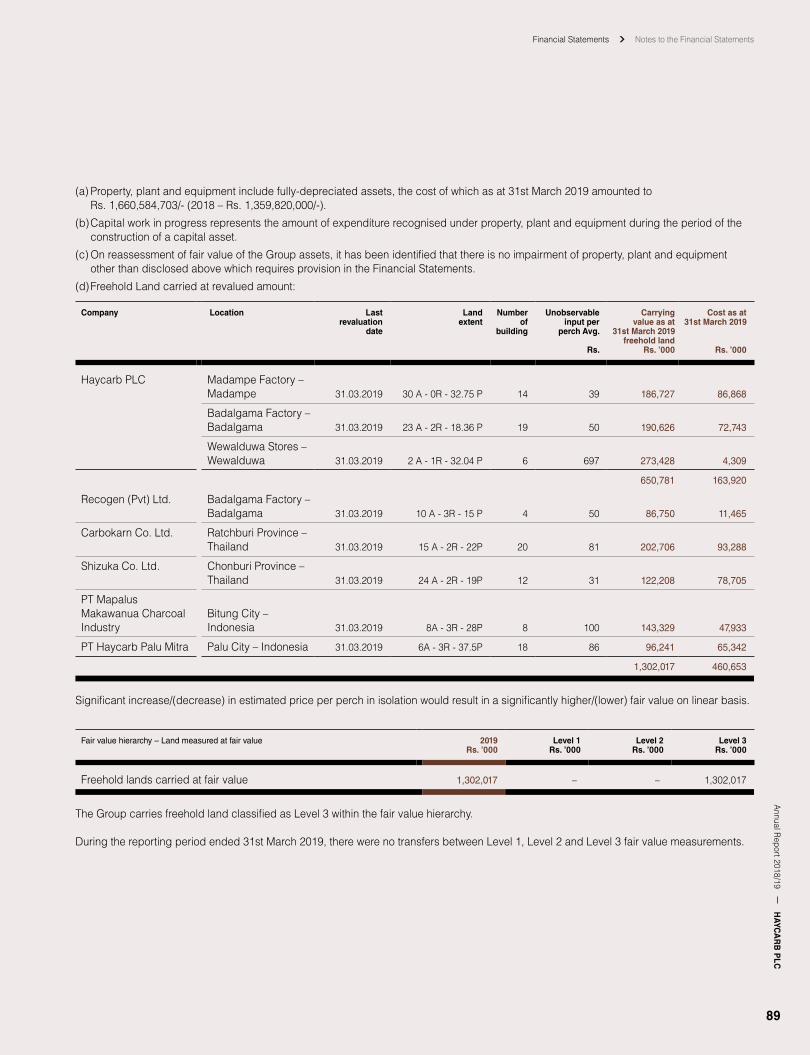
Financial Statements Notes to the Financial StatementsA
nnual Report 2018/19
HAYC
AR
B P
LC
89
(a) Property, plant and equipment include fully-depreciated assets, the cost of which as at 31st March 2019 amounted to Rs. 1,660,584,703/- (2018 – Rs. 1,359,820,000/-).
(b) Capital work in progress represents the amount of expenditure recognised under property, plant and equipment during the period of the construction of a capital asset.
(c) On reassessment of fair value of the Group assets, it has been identified that there is no impairment of property, plant and equipment other than disclosed above which requires provision in the Financial Statements.
(d) Freehold Land carried at revalued amount:
Company Location Lastrevaluation
date
Landextent
Numberof
building
Unobservableinput per
perch Avg.
Rs.
Carryingvalue as at
31st March 2019freehold land
Rs. ’000
Cost as at 31st March 2019
Rs. ’000
Haycarb PLC Madampe Factory – Madampe 31.03.2019 30 A - 0R - 32.75 P 14 39 186,727 86,868
Badalgama Factory – Badalgama 31.03.2019 23 A - 2R - 18.36 P 19 50 190,626 72,743
Wewalduwa Stores – Wewalduwa 31.03.2019 2 A - 1R - 32.04 P 6 697 273,428 4,309
650,781 163,920
Recogen (Pvt) Ltd. Badalgama Factory – Badalgama 31.03.2019 10 A - 3R - 15 P 4 50 86,750 11,465
Carbokarn Co. Ltd. Ratchburi Province – Thailand 31.03.2019 15 A - 2R - 22P 20 81 202,706 93,288
Shizuka Co. Ltd. Chonburi Province – Thailand 31.03.2019 24 A - 2R - 19P 12 31 122,208 78,705
PT Mapalus Makawanua Charcoal Industry
Bitung City – Indonesia 31.03.2019 8A - 3R - 28P 8 100 143,329 47,933
PT Haycarb Palu Mitra Palu City – Indonesia 31.03.2019 6A - 3R - 37.5P 18 86 96,241 65,342
1,302,017 460,653
Significant increase/(decrease) in estimated price per perch in isolation would result in a significantly higher/(lower) fair value on linear basis.
Fair value hierarchy – Land measured at fair value 2019Rs. ’000
Level 1Rs. ’000
Level 2Rs. ’000
Level 3Rs. ’000
Freehold lands carried at fair value 1,302,017 – – 1,302,017
The Group carries freehold land classified as Level 3 within the fair value hierarchy.
During the reporting period ended 31st March 2019, there were no transfers between Level 1, Level 2 and Level 3 fair value measurements.

Financial Statements Notes to the Financial StatementsH
AYC
AR
B P
LCA
nnua
l Rep
ort 2
018/
19
90
(e) There were no assets pledged by the Group as securities for facilities obtained from the Banks other than those disclosed bellow:
Company Details of assets Banks mortgaged to CostRs. ’000
PT Mapalus Makawanuva Land and building Panin BNI 202,221
PT Haycarb Palu Mitra Land and building HSBC (Indonesia) 236,614
Machinery and tools HSBC (Indonesia) 282,774
12.2 Company
Freeholdland
Rs. ’000
Freeholdbuildings
Rs. ’000
Machinery andequipment
freehold
Rs. ’000
Vehicles
Rs. ’000
Furniturefittings
and officeequipment
Rs. ’000
Dataprocessingequipment
Rs. ’000
Total
Rs. ’000
Cost or valuation
At 31st March 2017 530,202 440,694 1,234,858 82,535 54,072 58,847 2,401,208
Additions 10,553 22,795 176,752 529 2,213 1,660 214,502
Transfer* 10,060 (10,060) – – – – –
At 31st March 2018 550,815 453,429 1,411,610 83,064 56,285 60,507 2,615,710
Additions 502 13,147 155,519 – 2,490 4,689 176,347
Revaluations 99,464 – – – – – 99,464
At 31st March 2019 650,781 466,576 1,567,129 83,064 58,775 65,196 2,891,521
Depreciation and impairment
At 1st March 2017 – 84,981 654,847 23,546 30,632 52,603 846,608
Depreciation charge for the year – 8,734 95,334 16,656 3,615 2,592 126,931
At 31st March 2018 – 93,715 750,181 40,202 34,247 55,195 973,539
Depreciation charge for the year – 9,160 104,947 16,588 3,910 2,967 137,572
At 31st March 2019 – 102,875 855,128 56,790 38,157 58,162 1,111,111
Capital work-in-progress
At 31st March 2019 – – – – – – 113,556
At 31st March 2018 – – – – – – 171,014
Impairment Provision
At 31st March 2019 – – (25,543) – – – (25,543)
At 31st March 2018 – – (25,543) – – – (25,543)
Net book value
At 31st March 2019 650,781 363,701 686,458 26,274 20,618 7,034 1,868,423
At 31st March 2018 550,815 359,714 635,886 42,862 22,038 5,312 1,787,642
(a) Property, plant and equipment include fully-depreciated assets, the cost of which as at 31st March 2019 amounted to Rs. 480,794,213/- (2018 – Rs. 460,322,884/-).
(b) There were no assets pledged by the Company as securities for facilities obtained from the Banks.
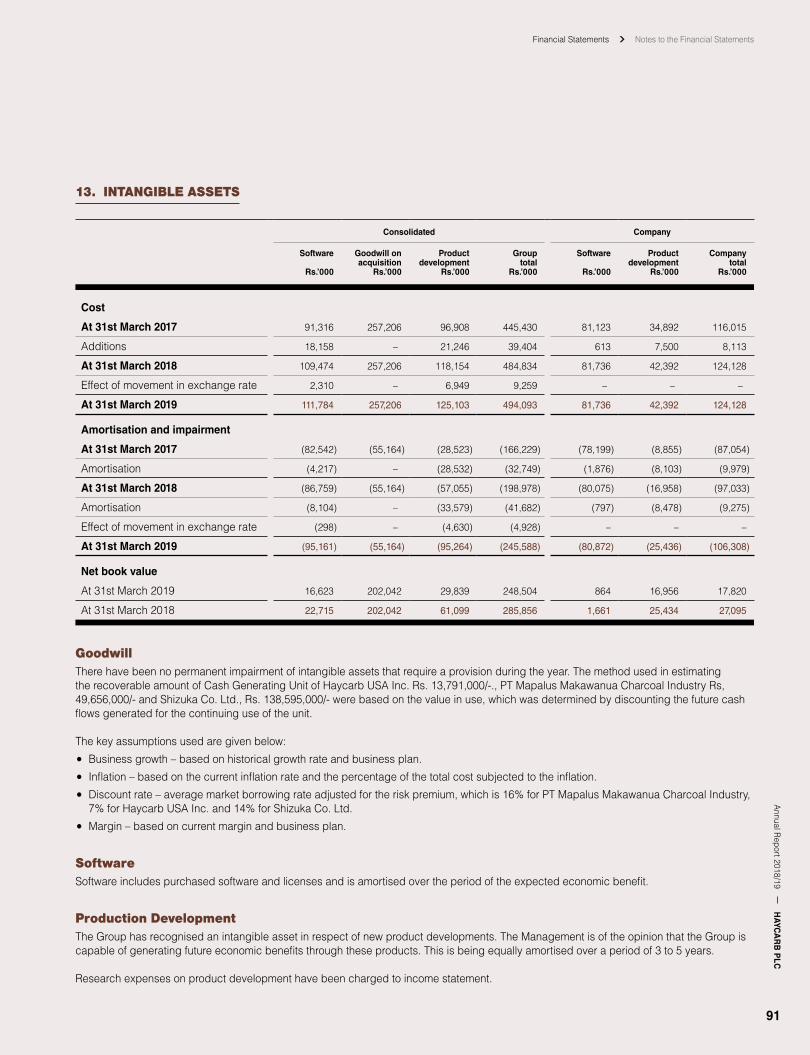
Financial Statements Notes to the Financial StatementsA
nnual Report 2018/19
HAYC
AR
B P
LC
91
13. INTANGIBLE ASSETS
Consolidated Company
Software
Rs.’000
Goodwill onacquisition
Rs.’000
Productdevelopment
Rs.’000
Grouptotal
Rs.’000
Software
Rs.’000
Productdevelopment
Rs.’000
Companytotal
Rs.’000
Cost
At 31st March 2017 91,316 257,206 96,908 445,430 81,123 34,892 116,015
Additions 18,158 – 21,246 39,404 613 7,500 8,113
At 31st March 2018 109,474 257,206 118,154 484,834 81,736 42,392 124,128
Effect of movement in exchange rate 2,310 – 6,949 9,259 – – –
At 31st March 2019 111,784 257,206 125,103 494,093 81,736 42,392 124,128
Amortisation and impairment
At 31st March 2017 (82,542) (55,164) (28,523) (166,229) (78,199) (8,855) (87,054)
Amortisation (4,217) – (28,532) (32,749) (1,876) (8,103) (9,979)
At 31st March 2018 (86,759) (55,164) (57,055) (198,978) (80,075) (16,958) (97,033)
Amortisation (8,104) – (33,579) (41,682) (797) (8,478) (9,275)
Effect of movement in exchange rate (298) – (4,630) (4,928) – – –
At 31st March 2019 (95,161) (55,164) (95,264) (245,588) (80,872) (25,436) (106,308)
Net book value
At 31st March 2019 16,623 202,042 29,839 248,504 864 16,956 17,820
At 31st March 2018 22,715 202,042 61,099 285,856 1,661 25,434 27,095
GoodwillThere have been no permanent impairment of intangible assets that require a provision during the year. The method used in estimating the recoverable amount of Cash Generating Unit of Haycarb USA Inc. Rs. 13,791,000/-., PT Mapalus Makawanua Charcoal Industry Rs, 49,656,000/- and Shizuka Co. Ltd., Rs. 138,595,000/- were based on the value in use, which was determined by discounting the future cash flows generated for the continuing use of the unit.
The key assumptions used are given below: Business growth – based on historical growth rate and business plan. Inflation – based on the current inflation rate and the percentage of the total cost subjected to the inflation. Discount rate – average market borrowing rate adjusted for the risk premium, which is 16% for PT Mapalus Makawanua Charcoal Industry, 7% for Haycarb USA Inc. and 14% for Shizuka Co. Ltd. Margin – based on current margin and business plan.
SoftwareSoftware includes purchased software and licenses and is amortised over the period of the expected economic benefit.
Production DevelopmentThe Group has recognised an intangible asset in respect of new product developments. The Management is of the opinion that the Group is capable of generating future economic benefits through these products. This is being equally amortised over a period of 3 to 5 years.
Research expenses on product development have been charged to income statement.

Financial Statements Notes to the Financial StatementsH
AYC
AR
B P
LCA
nnua
l Rep
ort 2
018/
19
92
14. INVESTMENT IN EQUITY ACCOUNTED INVESTEES
Consolidated Company
For the year ended 31st March Holding%
2019Rs. ’000
2018Rs. ’000
2019Rs. ’000
2018Rs. ’000
Carbotels (Pvt) Ltd. (Note 14.1) 25.2 489,587 417,104 92,903 92,903
Lakdiyatha (Pvt) Ltd. (Note 14.1) 49.0 94,178 99,822 – –
583,765 516,926 92,903 92,903
14.1 Movement in Equity Accounted Investees
Lakdiyatha (Pvt) Ltd. Carbotels (Pvt) Ltd. Consolidated
As at 31st March 2019Rs. ’000
2018Rs. ’000
2019Rs. ’000
2018Rs. ’000
2019Rs. ’000
2018Rs. ’000
Balance at the beginning of the year 99,822 97,866 417,104 391,662 516,926 489,528
Share of results (5,644) 1,956 130,016 15,919 124,372 17,875
Movement in reserves – – (53,817) 11,381 (53,817) 11,381
Dividends – – (3,716) (1,858) (3,716) (1,858)
Balance at the end of the year 94,178 99,822 489,587 417,104 583,765 516,926
14.2 Summarised Financials
Lakdiyatha (Pvt) Ltd. Carbotels (Pvt) Ltd. Consolidated
As at 31st March 2019Rs. ’000
2018Rs. ’000
2019Rs. ’000
2018Rs. ’000
2019Rs. ’000
2018Rs. ’000
Balance Sheet
Total assets 276,386 297,643 1,960,252 1,656,031 2,236,639 1,953,674
Total liabilities (84,186) (93,925) (17,442) (857) (101,628) (94,782)
Net Assets 192,200 203,718 1,942,811 1,655,174 2,135,011 1,858,892
Group carrying amount of the investment 94,177 99,822 489,588 417,104 583,766 516,926
Profit after tax 11,518 3,991 515,935 63,170 527,453 67,161
Group share of profit for the year (5,644) 1,956 130,016 15,919 124,372 17,875
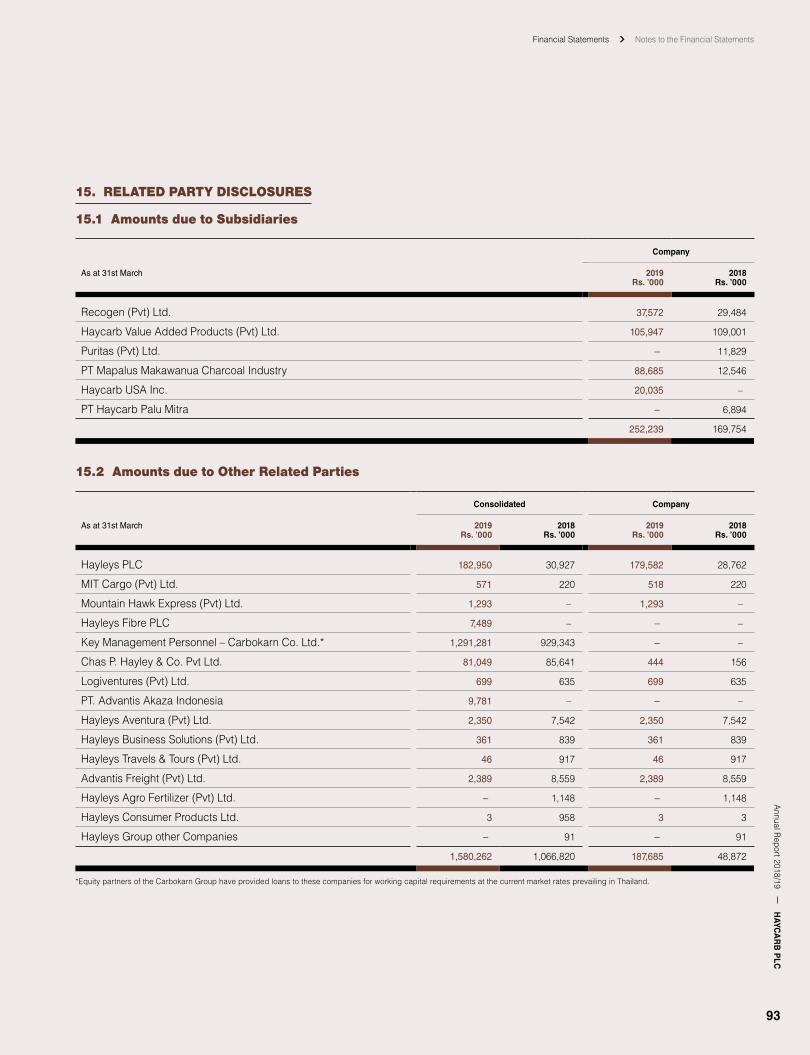
Financial Statements Notes to the Financial StatementsA
nnual Report 2018/19
HAYC
AR
B P
LC
93
15. RELATED PARTY DISCLOSURES
15.1 Amounts due to Subsidiaries
Company
As at 31st March 2019Rs. ’000
2018Rs. ’000
Recogen (Pvt) Ltd. 37,572 29,484
Haycarb Value Added Products (Pvt) Ltd. 105,947 109,001
Puritas (Pvt) Ltd. – 11,829
PT Mapalus Makawanua Charcoal Industry 88,685 12,546
Haycarb USA Inc. 20,035 –
PT Haycarb Palu Mitra – 6,894
252,239 169,754
15.2 Amounts due to Other Related Parties
Consolidated Company
As at 31st March 2019Rs. ’000
2018Rs. ’000
2019Rs. ’000
2018Rs. ’000
Hayleys PLC 182,950 30,927 179,582 28,762
MIT Cargo (Pvt) Ltd. 571 220 518 220
Mountain Hawk Express (Pvt) Ltd. 1,293 – 1,293 –
Hayleys Fibre PLC 7,489 – – –
Key Management Personnel – Carbokarn Co. Ltd.* 1,291,281 929,343 – –
Chas P. Hayley & Co. Pvt Ltd. 81,049 85,641 444 156
Logiventures (Pvt) Ltd. 699 635 699 635
PT. Advantis Akaza Indonesia 9,781 – – –
Hayleys Aventura (Pvt) Ltd. 2,350 7,542 2,350 7,542
Hayleys Business Solutions (Pvt) Ltd. 361 839 361 839
Hayleys Travels & Tours (Pvt) Ltd. 46 917 46 917
Advantis Freight (Pvt) Ltd. 2,389 8,559 2,389 8,559
Hayleys Agro Fertilizer (Pvt) Ltd. – 1,148 – 1,148
Hayleys Consumer Products Ltd. 3 958 3 3
Hayleys Group other Companies – 91 – 91
1,580,262 1,066,820 187,685 48,872
*Equity partners of the Carbokarn Group have provided loans to these companies for working capital requirements at the current market rates prevailing in Thailand.
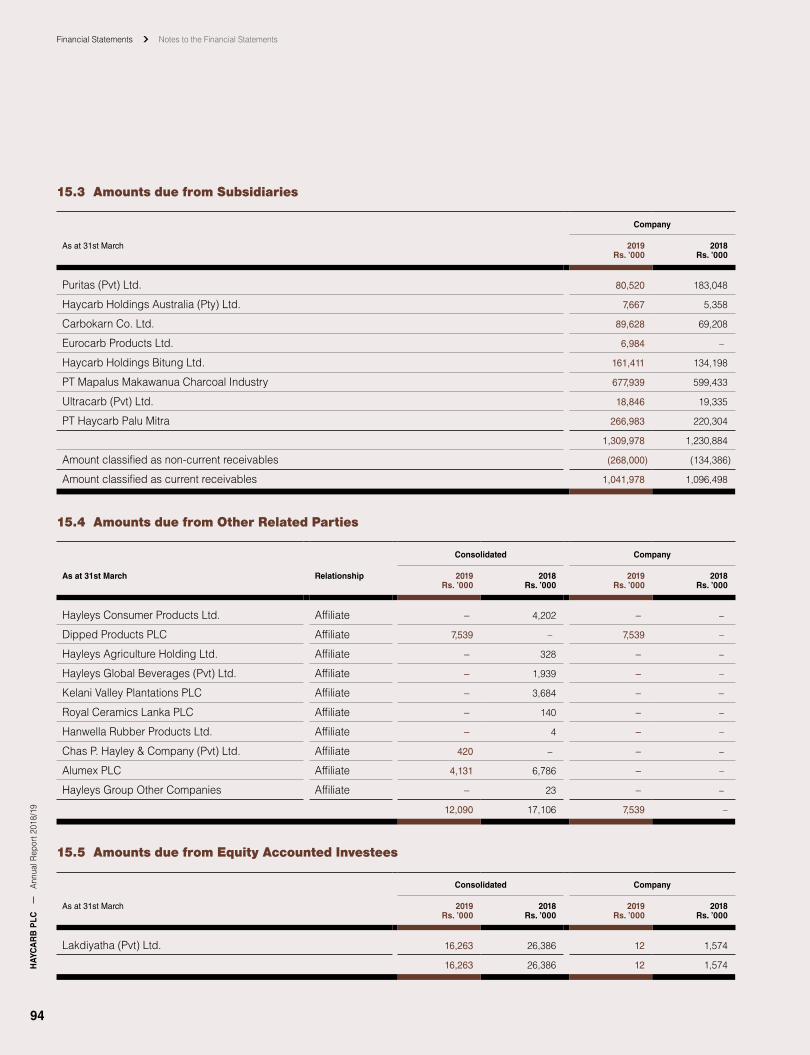
Financial Statements Notes to the Financial StatementsH
AYC
AR
B P
LCA
nnua
l Rep
ort 2
018/
19
94
15.3 Amounts due from Subsidiaries
Company
As at 31st March 2019Rs. ’000
2018Rs. ’000
Puritas (Pvt) Ltd. 80,520 183,048
Haycarb Holdings Australia (Pty) Ltd. 7,667 5,358
Carbokarn Co. Ltd. 89,628 69,208
Eurocarb Products Ltd. 6,984 –
Haycarb Holdings Bitung Ltd. 161,411 134,198
PT Mapalus Makawanua Charcoal Industry 677,939 599,433
Ultracarb (Pvt) Ltd. 18,846 19,335
PT Haycarb Palu Mitra 266,983 220,304
1,309,978 1,230,884
Amount classified as non-current receivables (268,000) (134,386)
Amount classified as current receivables 1,041,978 1,096,498
15.4 Amounts due from Other Related Parties
Consolidated Company
As at 31st March Relationship 2019Rs. ’000
2018Rs. ’000
2019Rs. ’000
2018Rs. ’000
Hayleys Consumer Products Ltd. Affiliate – 4,202 – –
Dipped Products PLC Affiliate 7,539 – 7,539 –
Hayleys Agriculture Holding Ltd. Affiliate – 328 – –
Hayleys Global Beverages (Pvt) Ltd. Affiliate – 1,939 – –
Kelani Valley Plantations PLC Affiliate – 3,684 – –
Royal Ceramics Lanka PLC Affiliate – 140 – –
Hanwella Rubber Products Ltd. Affiliate – 4 – –
Chas P. Hayley & Company (Pvt) Ltd. Affiliate 420 – – –
Alumex PLC Affiliate 4,131 6,786 – –
Hayleys Group Other Companies Affiliate – 23 – –
12,090 17,106 7,539 –
15.5 Amounts due from Equity Accounted Investees
Consolidated Company
As at 31st March 2019Rs. ’000
2018Rs. ’000
2019Rs. ’000
2018Rs. ’000
Lakdiyatha (Pvt) Ltd. 16,263 26,386 12 1,574
16,263 26,386 12 1,574
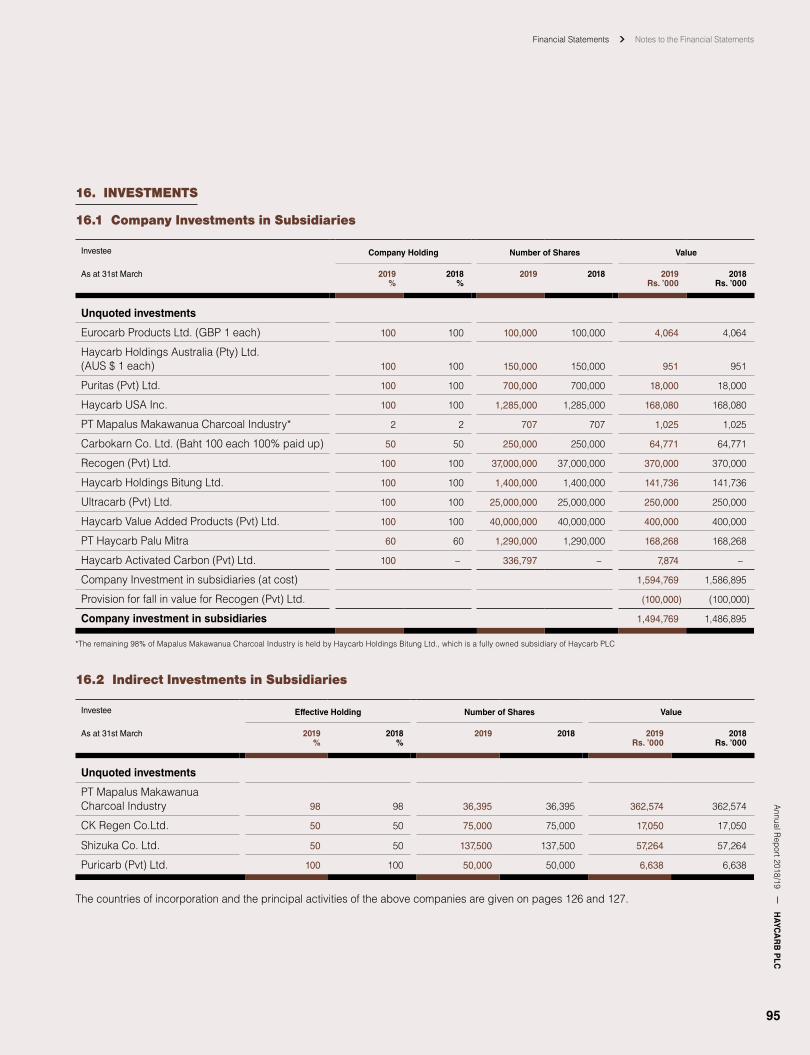
Financial Statements Notes to the Financial StatementsA
nnual Report 2018/19
HAYC
AR
B P
LC
95
16. INVESTMENTS
16.1 Company Investments in Subsidiaries
Investee Company Holding Number of Shares Value
As at 31st March 2019%
2018%
2019 2018 2019Rs. ’000
2018Rs. ’000
Unquoted investments
Eurocarb Products Ltd. (GBP 1 each) 100 100 100,000 100,000 4,064 4,064
Haycarb Holdings Australia (Pty) Ltd. (AUS $ 1 each) 100 100 150,000 150,000 951 951
Puritas (Pvt) Ltd. 100 100 700,000 700,000 18,000 18,000
Haycarb USA Inc. 100 100 1,285,000 1,285,000 168,080 168,080
PT Mapalus Makawanua Charcoal Industry* 2 2 707 707 1,025 1,025
Carbokarn Co. Ltd. (Baht 100 each 100% paid up) 50 50 250,000 250,000 64,771 64,771
Recogen (Pvt) Ltd. 100 100 37,000,000 37,000,000 370,000 370,000
Haycarb Holdings Bitung Ltd. 100 100 1,400,000 1,400,000 141,736 141,736
Ultracarb (Pvt) Ltd. 100 100 25,000,000 25,000,000 250,000 250,000
Haycarb Value Added Products (Pvt) Ltd. 100 100 40,000,000 40,000,000 400,000 400,000
PT Haycarb Palu Mitra 60 60 1,290,000 1,290,000 168,268 168,268
Haycarb Activated Carbon (Pvt) Ltd. 100 – 336,797 – 7,874 –
Company Investment in subsidiaries (at cost) 1,594,769 1,586,895
Provision for fall in value for Recogen (Pvt) Ltd. (100,000) (100,000)
Company investment in subsidiaries 1,494,769 1,486,895
*The remaining 98% of Mapalus Makawanua Charcoal Industry is held by Haycarb Holdings Bitung Ltd., which is a fully owned subsidiary of Haycarb PLC
16.2 Indirect Investments in Subsidiaries
Investee Effective Holding Number of Shares Value
As at 31st March 2019%
2018%
2019 2018 2019Rs. ’000
2018Rs. ’000
Unquoted investments
PT Mapalus Makawanua Charcoal Industry 98 98 36,395 36,395 362,574 362,574
CK Regen Co.Ltd. 50 50 75,000 75,000 17,050 17,050
Shizuka Co. Ltd. 50 50 137,500 137,500 57,264 57,264
Puricarb (Pvt) Ltd. 100 100 50,000 50,000 6,638 6,638
The countries of incorporation and the principal activities of the above companies are given on pages 126 and 127.

Financial Statements Notes to the Financial StatementsH
AYC
AR
B P
LCA
nnua
l Rep
ort 2
018/
19
96
17. INVENTORIES
Consolidated Company
As at 31st March 2019Rs. ’000
2018Rs. ’000
2019Rs. ’000
2018Rs. ’000
Raw materials and consumables 2,890,733 1,243,826 959,204 570,292
Finished/semi-finished goods 3,625,787 2,955,001 829,908 754,879
Projects in progress 613,078 84,814 – –
7,129,598 4,283,641 1,789,112 1,325,171
Provision for slow-moving items (72,214) (56,811) (45,850) (42,850)
Provision for unrealised profits (250,351) (140,850) – –
Total inventories at the lower of cost and net realisable value 6,807,033 4,085,980 1,743,262 1,282,321
18. TRADE AND OTHER RECEIVABLES
Consolidated Company
As at 31st March 2019Rs. ’000
2018Rs. ’000
2019Rs. ’000
2018Rs. ’000
Trade receivables – External customers 4,068,567 3,293,080 644,516 569,260
– Inter company – – 980,206 584,792
Less: Provision for expected credit losses (20,525) (25,198) – –
4,048,042 3,267,882 1,624,722 1,154,052
Loans to employees 13,527 11,834 13,527 11,834
4,061,569 3,279,716 1,638,249 1,165,886
The age analysis of trade receivables is as follows:
Group Total
Rs ’000
Neither past duenor impaired
Rs ’000
0-60 days
Rs ’000
61-120 days
Rs ’000
Above 120 days
Rs ’000
Balance as at 31st March 2019 4,068,567 2,888,860 773,811 111,458 294,439
Balance as at 31st March 2018 3,293,080 2,217,138 695,450 144,995 235,497
Company Total
Rs ’000
Neither past duenor impaired
Rs ’000
0-60 days
Rs ’000
61-120 days
Rs ’000
Above 120 days
Rs ’000
Balance as at 31st March 2019 644,516 547,195 97,321 – –
Balance as at 31st March 2018 569,260 502,080 67,180 – –
Loans to employees (over Rs. 20,000/- included above)

Financial Statements Notes to the Financial StatementsA
nnual Report 2018/19
HAYC
AR
B P
LC
97
Consolidated Company
As at 31st March 2019Rs. ’000
2018Rs. ’000
2019Rs. ’000
2018Rs. ’000
At the beginning of the year 3,474 3,175 3,474 3,175
Granted during the year 1,860 1,300 1,860 1,300
5,334 4,475 5,334 4,475
Repaid during the year (1,925) (1,001) (1,925) (1,001)
At the end of the year 3,409 3,474 3,409 3,474
Number of loans over Rs. 20,000/- 46 30 46 30
No loans have been given to the Directors of the Company.
See Note 32 on credit risk of trade receivables, which details how the Group manages and measures credit quality of trade receivables that are neither past due nor impaired.
Fair value of the trade and other receivable of the Group Rs. 4,061,569,000/- (31st March 2018 – Rs. 3,279,716,000/-), Company Rs. 1,638,249,000/- (31st March 2018 – Rs. 1,165,886,000/-)
19. OTHER NON-CURRENT FINANCIAL ASSETS
Consolidated Company
For the year ended 31st March 2019Rs. ’000
2018Rs. ’000
2019Rs. ’000
2018Rs. ’000
Financial assets designated at FVOCI/Available-for-sale investments
Unquoted equity shares
Quality Seed Co. Ltd. 490 490 490 490
Barrack Gold Corporation 193 184 – –
683 674 490 490
Quoted equity shares
Dipped Products PLC 347,876 309,224 347,876 309,224
Fair value adjustment (30,516) 38,652 (30,516) 38,652
Fair value of quoted equity shares 317,361 347,876 317,361 347,876
318,044 348,550 317,851 348,366
Loans and receivables
Receivable from finance lease
At the beginning of the year 37,325 36,651 – –
Granted during the year – – – –
Settlements during the year (9,342) (4,221) – –
Exchange differences 3,592 4,895 – –
As at 31st March 31,575 37,325 – –
Total other non-current financial assets 349,619 385,875 317,851 348,366
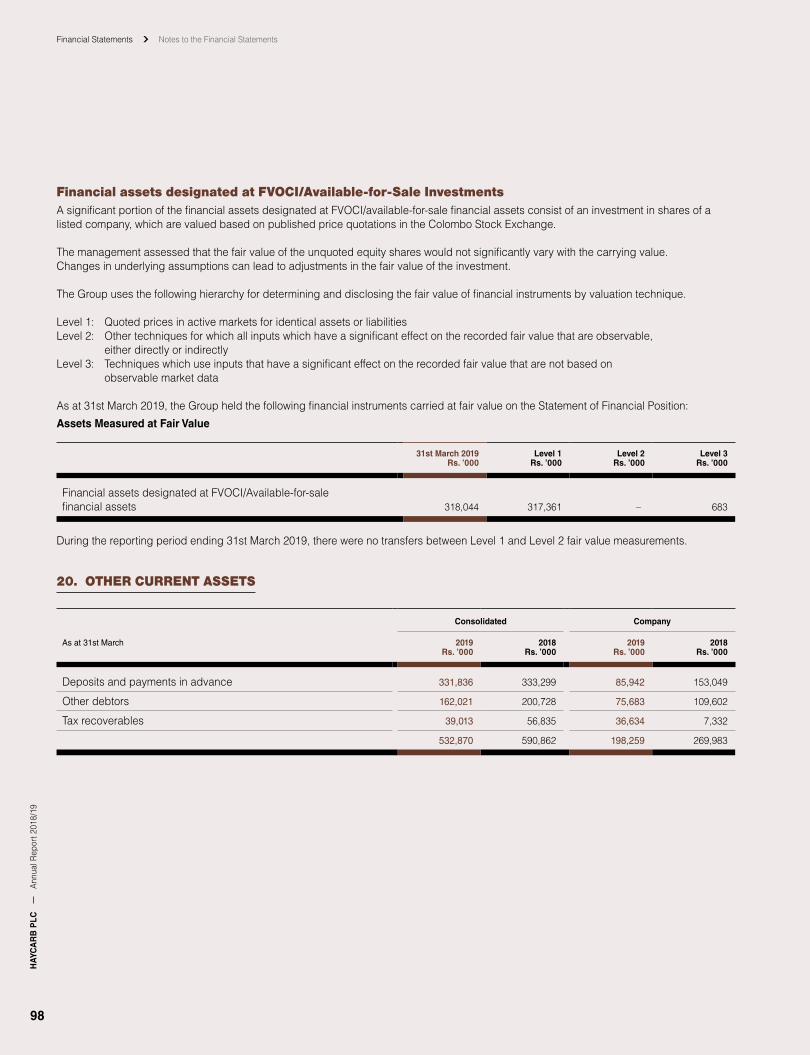
Financial Statements Notes to the Financial StatementsH
AYC
AR
B P
LCA
nnua
l Rep
ort 2
018/
19
98
Financial assets designated at FVOCI/Available-for-Sale InvestmentsA significant portion of the financial assets designated at FVOCI/available-for-sale financial assets consist of an investment in shares of a listed company, which are valued based on published price quotations in the Colombo Stock Exchange.
The management assessed that the fair value of the unquoted equity shares would not significantly vary with the carrying value. Changes in underlying assumptions can lead to adjustments in the fair value of the investment.
The Group uses the following hierarchy for determining and disclosing the fair value of financial instruments by valuation technique.
Level 1: Quoted prices in active markets for identical assets or liabilitiesLevel 2: Other techniques for which all inputs which have a significant effect on the recorded fair value that are observable, either directly or indirectlyLevel 3: Techniques which use inputs that have a significant effect on the recorded fair value that are not based on observable market data
As at 31st March 2019, the Group held the following financial instruments carried at fair value on the Statement of Financial Position:
Assets Measured at Fair Value
31st March 2019Rs. ’000
Level 1Rs. ’000
Level 2Rs. ’000
Level 3Rs. ’000
Financial assets designated at FVOCI/Available-for-sale financial assets 318,044 317,361 – 683
During the reporting period ending 31st March 2019, there were no transfers between Level 1 and Level 2 fair value measurements.
20. OTHER CURRENT ASSETS
Consolidated Company
As at 31st March 2019Rs. ’000
2018Rs. ’000
2019Rs. ’000
2018Rs. ’000
Deposits and payments in advance 331,836 333,299 85,942 153,049
Other debtors 162,021 200,728 75,683 109,602
Tax recoverables 39,013 56,835 36,634 7,332
532,870 590,862 198,259 269,983 532,870 590,862 198,259 269,983

Financial Statements Notes to the Financial StatementsA
nnual Report 2018/19
HAYC
AR
B P
LC
99
21. CASH IN HAND AND AT BANK
Consolidated Company
As at 31st March 2019Rs. ’000
2018Rs. ’000
2019Rs. ’000
2018Rs. ’000
Cash in hand 7,270 6,433 5,458 4,790
Bank Balances 754,956 816,322 200,385 198,904
Short-term deposits 121,915 68,251 10,308 2,471
884,141 891,006 216,151 206,165
For the purpose of the Statement of Cash flows, cash and cash equivalents comprise the following:
Consolidated Company
As at 31st March 2019Rs. ’000
2018Rs. ’000
2019Rs. ’000
2018Rs. ’000
Bank and cash balances 762,226 822,755 205,843 203,694
Short-term deposits 121,915 68,251 10,308 2,471
Bank overdrafts and short-term loans (4,099,727) (2,721,280) (2,479,382) (1,678,737)
Cash and cash equivalents (3,215,586) (1,830,274) (2,263,231) (1,472,572)
22. STATED CAPITAL
Issued and fully-paid – ordinary shares
Company
As at 31st March 2019 2018
NumberValue
Rs. ’000 NumberValue
Rs. ’000
At the beginning of the year 29,712,375 331,774 29,712,375 331,774
Issued and fully-paid ordinary shares 29,712,375 331,774 29,712,375 331,774
At the end of the year 29,712,375 331,774 29,712,375 331,774
23. RESERVES
Group Company
As at 31st March 2019Rs. ’000
2018Rs. ’000
2019Rs. ’000
2018Rs. ’000
Capital reserve (23.1) 675,744 648,703 442,458 356,919
Retained earnings (23.2) 7,242,868 6,447,363 3,999,725 4,202,121

Financial Statements Notes to the Financial StatementsH
AYC
AR
B P
LCA
nnua
l Rep
ort 2
018/
19
100
23.1 Capital Reserves
RevaluationsurplusRs. ’000
Reserve onamalgamation
Rs. ’000
Legal reserve
Rs. ’000
Total
Rs. ’000
Consolidated
Balance as at 1st April 2017 685,171 25,885 6,541 717,597
Tax effect on revalued asset (68,894) – – (68,894)
Balance as at 31st March 2018 616,277 25,885 6,541 648,703
Revaluation surplus during the year 165,192 – – 165,192
Tax effect on revalued assets (20,351) – – (20,351)
Movement in reserve in equity accounted investee (117,800) – – (117,800)
Balance as at 31st March 2019 643,318 25,885 6,541 675,744
Company
Balance as at 1st April 2017 387,397 23,758 – 411,155
Tax effect on revalued asset (54,236) – – (54,236)
Balance as at 31st March 2018 333,161 23,758 – 356,919
Revaluation surplus during the year 99,464 – – 99,464
Tax effect on revalued assets (13,925) – – (13,925)
Balance as at 31st March 2019 418,700 23,758 – 442,458
23.2 Revenue Reserves
Group Company
As at 31st March 2019Rs. ’000
2018Rs. ’000
2019Rs. ’000
2018Rs. ’000
Fair Value Reserve of Financial Assets at FVOCI 277,190 307,706 277,190 307,706
Exchange fluctuation reserve 808,091 555,980 – –
General reserve 519,353 519,353 519,353 519,353
Retained earnings
Haycarb PLC 3,203,182 3,375,062 3,203,182 3,375,062
Subsidiaries 1,968,691 1,407,613 – –
Associates 466,361 281,649 – –
5,638,234 5,064,324 3,203,182 3,375,062
7,242,868 6,447,363 3,999,725 4,202,121
General ReserveGeneral reserve, which is a revenue reserve, represents the amounts set aside by the Directors for general application.
Other ReservesFair Value Reserve of Financial Assets at FVOCI / AFS ReserveFair Value Reserve of Financial Assets at FVOCI related to change in fair value of financial assets designated at FVOCI available-for-sale financial assets.
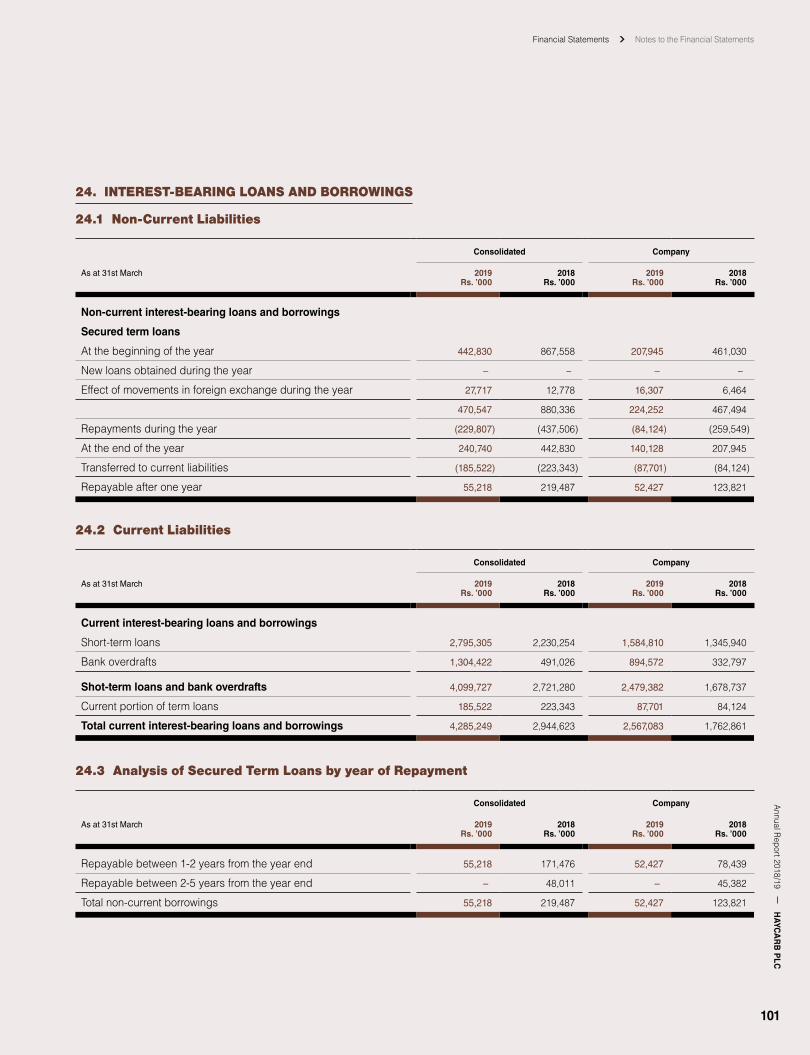
Financial Statements Notes to the Financial StatementsA
nnual Report 2018/19
HAYC
AR
B P
LC
101
24. INTEREST-BEARING LOANS AND BORROWINGS
24.1 Non-Current Liabilities
Consolidated Company
As at 31st March 2019Rs. ’000
2018Rs. ’000
2019Rs. ’000
2018Rs. ’000
Non-current interest-bearing loans and borrowings
Secured term loans
At the beginning of the year 442,830 867,558 207,945 461,030
New loans obtained during the year – – – –
Effect of movements in foreign exchange during the year 27,717 12,778 16,307 6,464
470,547 880,336 224,252 467,494
Repayments during the year (229,807) (437,506) (84,124) (259,549)
At the end of the year 240,740 442,830 140,128 207,945
Transferred to current liabilities (185,522) (223,343) (87,701) (84,124)
Repayable after one year 55,218 219,487 52,427 123,821
24.2 Current Liabilities
Consolidated Company
As at 31st March 2019Rs. ’000
2018Rs. ’000
2019Rs. ’000
2018Rs. ’000
Current interest-bearing loans and borrowings
Short-term loans 2,795,305 2,230,254 1,584,810 1,345,940
Bank overdrafts 1,304,422 491,026 894,572 332,797
Shot-term loans and bank overdrafts 4,099,727 2,721,280 2,479,382 1,678,737
Current portion of term loans 185,522 223,343 87,701 84,124
Total current interest-bearing loans and borrowings 4,285,249 2,944,623 2,567,083 1,762,861
24.3 Analysis of Secured Term Loans by year of Repayment
Consolidated Company
As at 31st March 2019Rs. ’000
2018Rs. ’000
2019Rs. ’000
2018Rs. ’000
Repayable between 1-2 years from the year end 55,218 171,476 52,427 78,439
Repayable between 2-5 years from the year end – 48,011 – 45,382
Total non-current borrowings 55,218 219,487 52,427 123,821

Financial Statements Notes to the Financial StatementsH
AYC
AR
B P
LCA
nnua
l Rep
ort 2
018/
19
102
24.4 Secured Term Loans Repayable after one year
Company Lender Rate of interest 31st March 2019Rs. ’000
Repayment terms Security
Haycarb PLC HSBC 1 month – LIBOR + 2.75% 13,817
60 equal monthly installments commencing from March 2016
HSBC 1 month – LIBOR + 2.75% 14,259
60 equal monthly installments commencing from April 2016
HSBC 1 month – LIBOR + 2.75% 24,349
60 equal monthly installments commencing from June 2016
Haycarb USA IncHatt
HNB 3 month – LIBOR + 3.75% 2,793
60 equal monthly installments commencing from September 2015
Corporate guarantee for US$ 1,750,000/- from Haycarb PLC
Total secured term loans repayable after one year 55,219
Fair value of the interest-bearing loans and borrowings of the Group Rs. 4,340,467,000/- (31st March 2018 – Rs.3,164,110,000/-) Company Rs. 2,619,510,000/- (31st March 2018 – Rs. 1,886,682,000/-).
25. EMPLOYEE BENEFIT OBLIGATIONS
Consolidated Company
2019Rs. ’000
2018Rs. ’000
2019Rs. ’000
2018Rs. ’000
(i) Expenses recognised in Income Statement
Current service cost 41,364 34,516 27,296 23,765
Interest cost on employee benefit obligation 44,569 39,673 40,576 36,407
The total expense is recognised in administrative expenses in the income statement 85,933 74,190 67,872 60,172
(ii) Actuarial gains and losses recognised directly in OCI
Actuarial losses 39,836 29,386 31,442 27,211
39,836 29,386 31,442 27,211
(iii) Present value of unfunded gratuity
Present value of unfunded gratuity 561,000 464,424 449,605 387,455
Total gratuity provision 561,000 464,424 449,605 387,455
(iv) Provision for employee benefit obligations
Employee benefit obligation at 1st April 464,424 365,672 387,455 306,231
Interest cost 44,569 39,673 40,576 36,407
Current service cost 41,364 34,517 27,296 23,765
Benefits paid (38,593) (7,522) (37,164) (6,159)
Actuarial losses on obligations 39,836 29,386 31,442 27,211
Effect of movement in exchange rate 9,400 2,698 – –
Employee benefit obligations at 31st March 561,000 464,424 449,605 387,455
Legal Liability 418,568 368,685 327,367 294,328
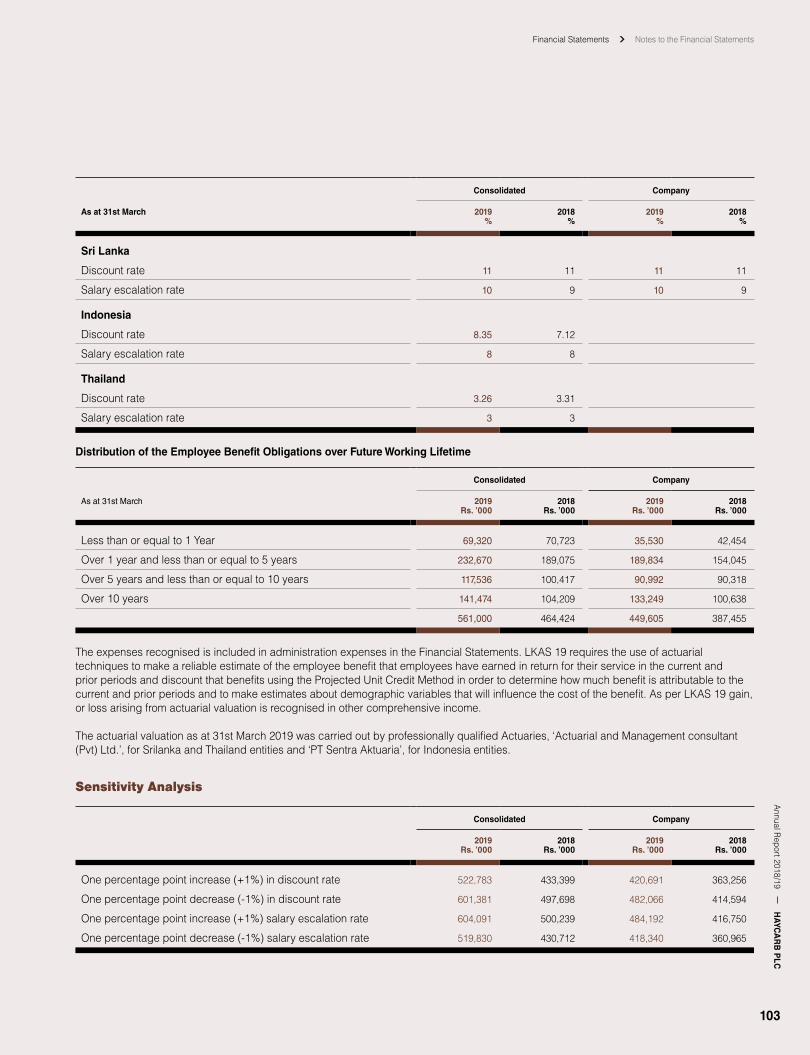
Financial Statements Notes to the Financial StatementsA
nnual Report 2018/19
HAYC
AR
B P
LC
103
Consolidated Company
As at 31st March 2019%
2018%
2019%
2018%
Sri Lanka
Discount rate 11 11 11 11
Salary escalation rate 10 9 10 9
Indonesia
Discount rate 8.35 7.12
Salary escalation rate 8 8
Thailand
Discount rate 3.26 3.31
Salary escalation rate 3 3
Distribution of the Employee Benefit Obligations over Future Working Lifetime
Consolidated Company
As at 31st March 2019Rs. ’000
2018Rs. ’000
2019Rs. ’000
2018Rs. ’000
Less than or equal to 1 Year 69,320 70,723 35,530 42,454
Over 1 year and less than or equal to 5 years 232,670 189,075 189,834 154,045
Over 5 years and less than or equal to 10 years 117,536 100,417 90,992 90,318
Over 10 years 141,474 104,209 133,249 100,638
561,000 464,424 449,605 387,455
The expenses recognised is included in administration expenses in the Financial Statements. LKAS 19 requires the use of actuarial techniques to make a reliable estimate of the employee benefit that employees have earned in return for their service in the current and prior periods and discount that benefits using the Projected Unit Credit Method in order to determine how much benefit is attributable to the current and prior periods and to make estimates about demographic variables that will influence the cost of the benefit. As per LKAS 19 gain, or loss arising from actuarial valuation is recognised in other comprehensive income.
The actuarial valuation as at 31st March 2019 was carried out by professionally qualified Actuaries, ‘Actuarial and Management consultant (Pvt) Ltd.’, for Srilanka and Thailand entities and ‘PT Sentra Aktuaria’, for Indonesia entities.
Sensitivity Analysis
Consolidated Company
2019Rs. ’000
2018Rs. ’000
2019Rs. ’000
2018Rs. ’000
One percentage point increase (+1%) in discount rate 522,783 433,399 420,691 363,256
One percentage point decrease (-1%) in discount rate 601,381 497,698 482,066 414,594
One percentage point increase (+1%) salary escalation rate 604,091 500,239 484,192 416,750
One percentage point decrease (-1%) salary escalation rate 519,830 430,712 418,340 360,965
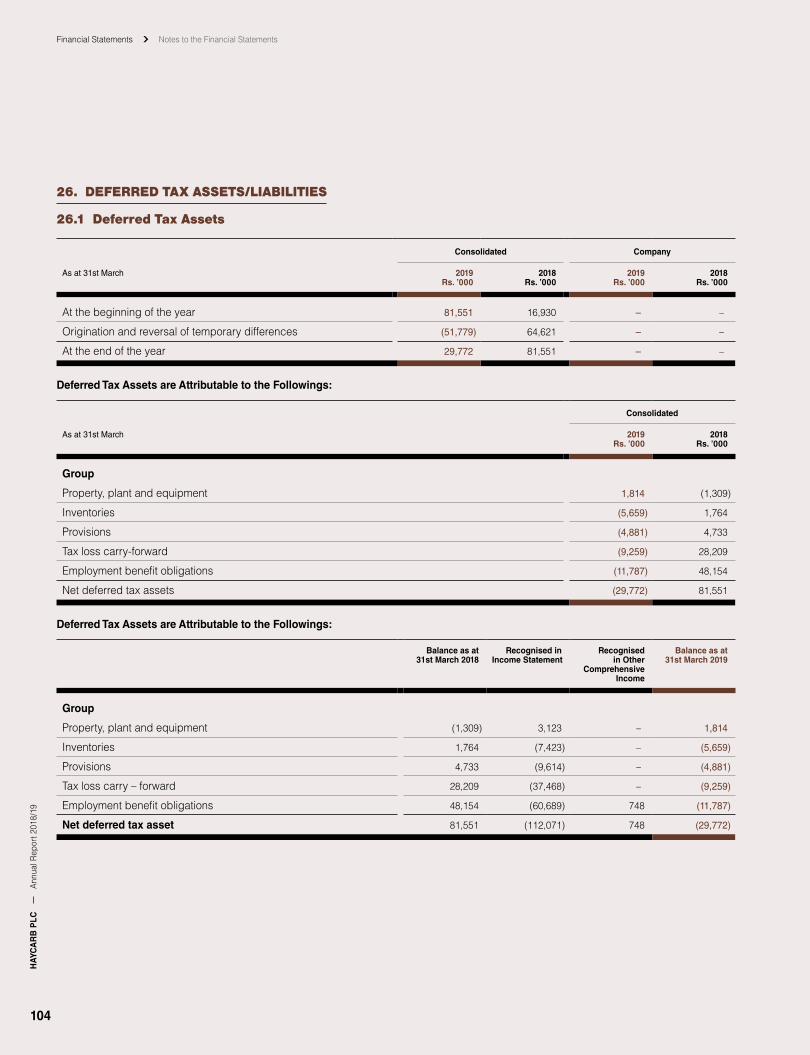
Financial Statements Notes to the Financial StatementsH
AYC
AR
B P
LCA
nnua
l Rep
ort 2
018/
19
104
26. DEFERRED TAX ASSETS/LIABILITIES
26.1 Deferred Tax Assets
Consolidated Company
As at 31st March 2019Rs. ’000
2018Rs. ’000
2019Rs. ’000
2018Rs. ’000
At the beginning of the year 81,551 16,930 – –
Origination and reversal of temporary differences (51,779) 64,621 – –
At the end of the year 29,772 81,551 – –
Deferred Tax Assets are Attributable to the Followings:
Consolidated
As at 31st March 2019Rs. ’000
2018Rs. ’000
Group
Property, plant and equipment 1,814 (1,309)
Inventories (5,659) 1,764
Provisions (4,881) 4,733
Tax loss carry-forward (9,259) 28,209
Employment benefit obligations (11,787) 48,154
Net deferred tax assets (29,772) 81,551
Deferred Tax Assets are Attributable to the Followings:
Balance as at31st March 2018
Recognised in Income Statement
Recognisedin Other
ComprehensiveIncome
Balance as at 31st March 2019
Group
Property, plant and equipment (1,309) 3,123 – 1,814
Inventories 1,764 (7,423) – (5,659)
Provisions 4,733 (9,614) – (4,881)
Tax loss carry – forward 28,209 (37,468) – (9,259)
Employment benefit obligations 48,154 (60,689) 748 (11,787)
Net deferred tax asset 81,551 (112,071) 748 (29,772)
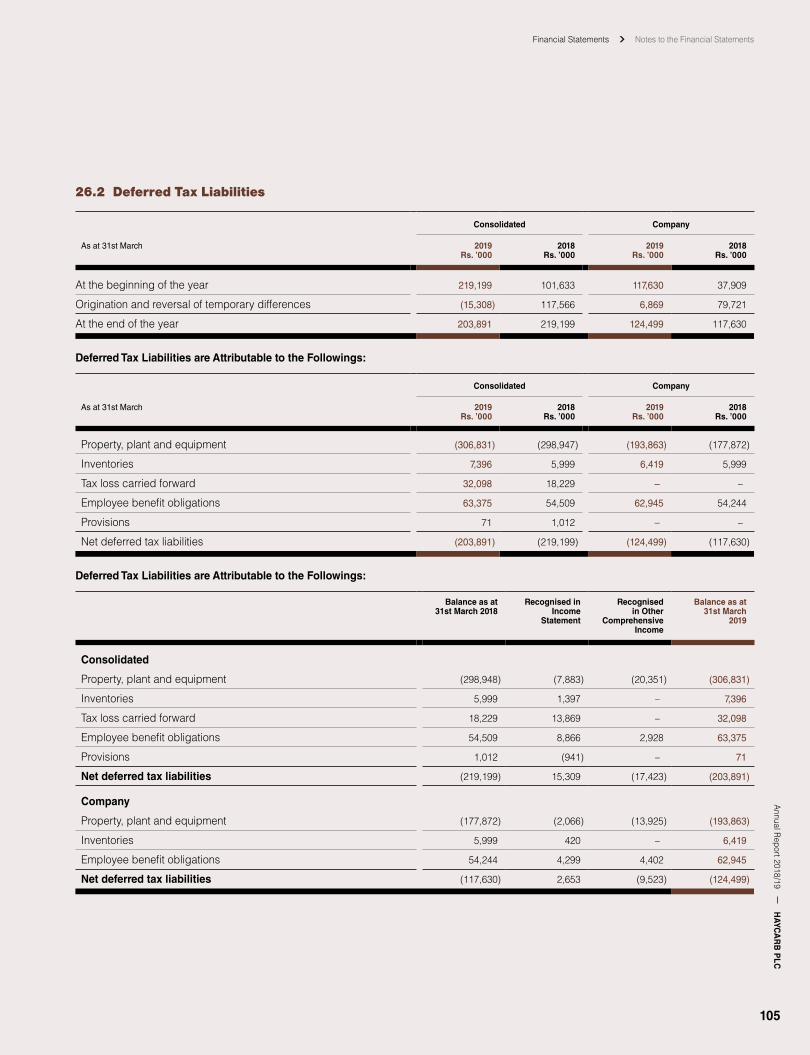
Financial Statements Notes to the Financial StatementsA
nnual Report 2018/19
HAYC
AR
B P
LC
105
26.2 Deferred Tax Liabilities
Consolidated Company
As at 31st March 2019Rs. ’000
2018Rs. ’000
2019Rs. ’000
2018Rs. ’000
At the beginning of the year 219,199 101,633 117,630 37,909
Origination and reversal of temporary differences (15,308) 117,566 6,869 79,721
At the end of the year 203,891 219,199 124,499 117,630
Deferred Tax Liabilities are Attributable to the Followings:
Consolidated Company
As at 31st March 2019Rs. ’000
2018Rs. ’000
2019Rs. ’000
2018Rs. ’000
Property, plant and equipment (306,831) (298,947) (193,863) (177,872)
Inventories 7,396 5,999 6,419 5,999
Tax loss carried forward 32,098 18,229 – –
Employee benefit obligations 63,375 54,509 62,945 54,244
Provisions 71 1,012 – –
Net deferred tax liabilities (203,891) (219,199) (124,499) (117,630)
Deferred Tax Liabilities are Attributable to the Followings:
Balance as at 31st March 2018
Recognised inIncome
Statement
Recognisedin Other
ComprehensiveIncome
Balance as at 31st March
2019
Consolidated
Property, plant and equipment (298,948) (7,883) (20,351) (306,831)
Inventories 5,999 1,397 – 7,396
Tax loss carried forward 18,229 13,869 – 32,098
Employee benefit obligations 54,509 8,866 2,928 63,375
Provisions 1,012 (941) – 71
Net deferred tax liabilities (219,199) 15,309 (17,423) (203,891)
Company
Property, plant and equipment (177,872) (2,066) (13,925) (193,863)
Inventories 5,999 420 – 6,419
Employee benefit obligations 54,244 4,299 4,402 62,945
Net deferred tax liabilities (117,630) 2,653 (9,523) (124,499)

Financial Statements Notes to the Financial StatementsH
AYC
AR
B P
LCA
nnua
l Rep
ort 2
018/
19
106
27. TRADE AND OTHER PAYABLES
Consolidated Company
As at 31st March 2019Rs. ’000
2018Rs. ’000
2019Rs. ’000
2018Rs. ’000
Trade payables 798,514 760,314 104,540 159,091
Freight payable 112,924 72,007 86,460 40,016
Salaries and wages 25,639 20,261 22,007 16,641
Dividend payable (27.1) 67,844 7,771 67,844 7,771
Accrued expenses and other payables 1,196,075 887,348 169,417 141,245
2,200,996 1,747,701 450,267 364,764
27.1 Dividend Payable
Consolidated Company
2019Rs. ’000
2018Rs. ’000
2019Rs. ’000
2018Rs. ’000
As at 1st April 7,771 35,391 7,771 35,391
As at 1st April payables under related party – 60,375 – 60,375
Declared during the year 463,259 135,796 415,973 89,137
Dividends paid to equity holders of the parent (235,150) (177,132) (235,150) (177,132)
Dividends paid to non-controlling interests (47,285) (46,659) – –
As at 31st March payables under related party (120,751) – (120,751) –
As at 31st March 67,844 7,771 67,844 7,771
Fair value of the trade and other payables of the Group Rs. 2,200,996,000/- (31st March 2018 – Rs. 1,747,701,000/-). Company Rs. 450,268,000/- (31st March 2018 – Rs. 364,764,000/-).
28. OTHER CURRENT LIABILITIES
Consolidated Company
As at 31st March 2019Rs. ’000
2018Rs. ’000
2019Rs. ’000
2018Rs. ’000
Payments received in advance 552,910 195,192 47,454 33,742
552,910 195,192 47,454 33,742

Financial Statements Notes to the Financial StatementsA
nnual Report 2018/19
HAYC
AR
B P
LC
107
29. PRINCIPAL SUBSIDIARIES WITH MATERIAL NON-CONTROLLING INTEREST
Summarised financial information in respect of Haycarb PLC's subsidiaries that have material non-controlling interest, reflecting amount before inter-company eliminations, is set out bellow:
The significant figures extracted from the financials of Carbokarn Co. Ltd. Group PT Haycarb Palu Mitra
As at 31st March 2019Rs. ’000
2018Rs. ’000
2019Rs. ’000
2018Rs. ’000
Revenue 5,030,628 3,835,939 1,129,170 787,639
Profit before tax 285,660 294,743 42,687 (73,829)
Cash flows from operating activities (132,891) 155,163 45,594 (85,736)
Cash flows from investing activities (159,123) (108,436) (7,489) (5,873)
Cash flows from financing activities (94,573) (93,318) (10,164) (9,165)
Non-current assets 1,398,290 1,244,552 549,007 551,571
Current assets 2,825,247 1,715,582 698,209 568,501
Total assets 4,223,537 2,960,134 1,247,216 1,120,072
Non-current liabilities 31,259 25,370 731,901 4,009
Current liabilities 2,488,838 1,507,200 302,838 939,886
Total liabilities 2,520,097 1,532,570 1,034,740 943,895
Equity attributable to the Parent of the Company 851,720 713,782 127,486 105,706
Non-controlling interest 851,720 713,782 84,990 70,471
Non-controlling interest (%) 50 50 40 40
30. RELATED PARTY TRANSACTIONS
Transactions with key management personnelThe Directors of the Company are considered the key management personnel of the Company.
Loans to DirectorsNo loans have been granted to Directors of the Company.
Transactions with parent, subsidiaries, equity accounted investees and other related companiesRelationship with subsidiaries and equity accounted investees are explained in Note 14 and 16 and also under Group companies in pages 126 and 127. Business segment classification is also given under Group companies.
(i) Companies within the Group engage in trading transactions under normal commercial terms and conditions. Outstanding current account balances at the year end are unsecured and charged with weighted average cost of debt rate. Settlements occur in cash.
(ii) Companies of Haycarb group have paid charges on office space and other services such as export shipping, secretarial, data processing, personnel administration and other functions obtained from Hayleys PLC.
(iii) Haycarb PLC provides factory space to its subsidiaries and charges rent. In addition, the Company incurs common expenses such as administration and personnel cost. Such costs are allocated to subsidiaries
(iv) Transactions with Haylex (Japan) Ltd., Hayleys Consumer Products (Pvt) Ltd., Logiventures (Pvt) Ltd., Dipped Products PLC, The Kingsburry PLC, Quality Seeds Co. Ltd., Hayleys Agriculture Holdings Ltd., MIT Cargo (Pvt) Ltd., Civaro Lanka (Pvt) Ltd., Mountain Hawk (Pvt) Ltd., Chas P. Hayley Company (Pvt) Ltd., Mabroc Teas (Pvt) Ltd., Pan Asia Bank PLC, Singer Finance PLC, Toyo Cushion Lanka (Pvt) Ltd., Hayleys Business Solutions International (Pvt) Ltd., Hayleys Travels & Tours (Pvt) Ltd., Dimo PLC, Hayleys Electronics Ltd., Hayleys Industrial Solutions Ltd., Hayleys Agro Fertilizers (Pvt) Ltd., PT Advantis Akaza Indonesia, and Sampath Bank PLC are given below under details of related party transactions with affiliates.

Financial Statements Notes to the Financial StatementsH
AYC
AR
B P
LCA
nnua
l Rep
ort 2
018/
19
108
Related Party Disclosures
Group Company
Year ended 31st March 2019Rs. ’000
2018Rs. ’000
2019Rs. ’000
2018Rs. ’000
Transactions with related parties
Fully-owned subsidiaries
Sales of Activated Carbon – – 2,813,481 2,048,558
Purchase of raw material – – 288,765 253,824
Reimbursement of salaries/bonus – – 141,524 138,225
Dividend income – – 216,456 162,858
Current account interest paid – – 48,612 54,125
Fund transfers – – 611,222 630,947
Rental income – – 5,679 8,353
Purchase of services – – 92,730 68,205
Income from guarantees and short-term funds – – 1,781 7,072
Income on services rendered 23,092 62,643
Partly-owned subsidiaries
Sales of goods and services – – 3,353 14,987
Purchase of raw material and consumables – – 449,321 168,942
Income from services provided – – 51,814 42,595
Dividend income – – 44,871 44,910
Purchase of services – – 2,187 10,387
Cost of guarantees and short-term funds – – 10,314 8,374
Equity accounted investee
Dividend received – – 3,716 1,990
Services-related expenses paid 264 270 – –
Parent – Hayleys PLC
Services related expenses paid 13,854 12,904 185,933 183,358
Affiliates
Sales of goods and services 3,238 31,570 638,885 253,791
Purchase of goods and services 335,999 381,536 107,184 116,796
Dividend income – – 28,773 10,172
Dividend paid – – 156,211 60,375
Interest income – – 12 12
Loans obtained from/(repaid to) Directors Carbokarn Co. Ltd. 361,938 (66,221) – –
Interest paid to Directors of Carbokarn Co. Ltd. 50,596 45,143 – –
None of the transactions above with an individual related party exceeds the ten percent threshold as defined in section 9.3.2 of the listing rules.
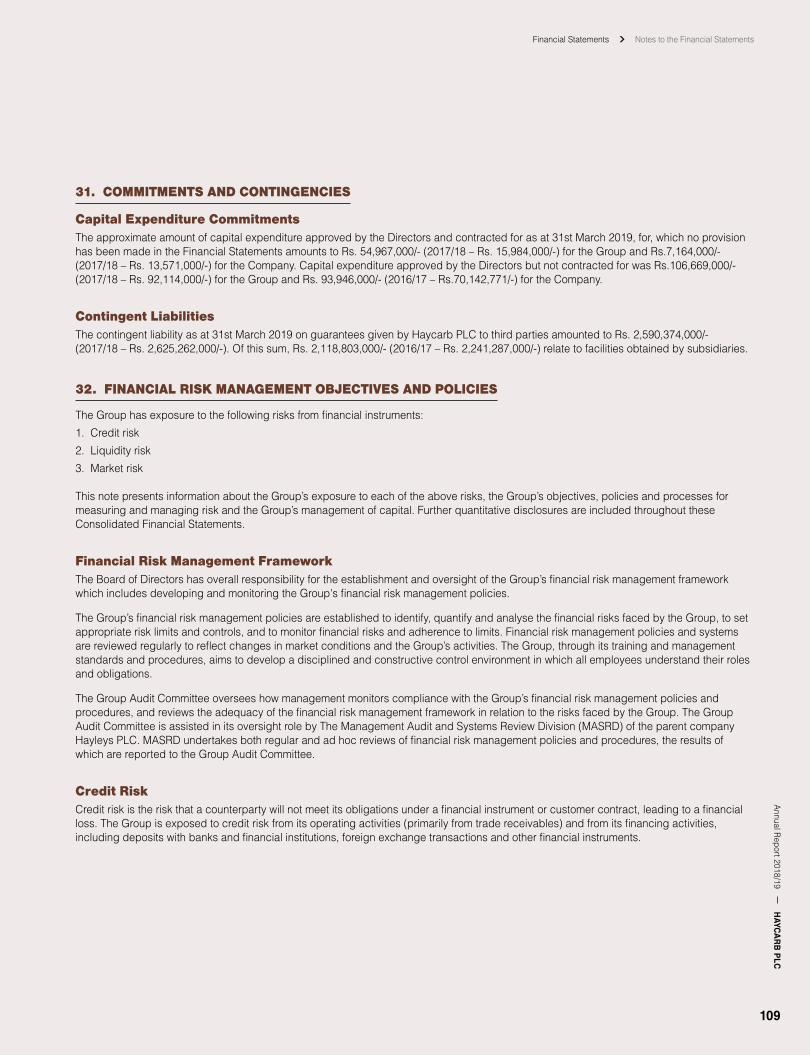
Financial Statements Notes to the Financial StatementsA
nnual Report 2018/19
HAYC
AR
B P
LC
109
31. COMMITMENTS AND CONTINGENCIES
Capital Expenditure CommitmentsThe approximate amount of capital expenditure approved by the Directors and contracted for as at 31st March 2019, for, which no provision has been made in the Financial Statements amounts to Rs. 54,967,000/- (2017/18 – Rs. 15,984,000/-) for the Group and Rs.7,164,000/- (2017/18 – Rs. 13,571,000/-) for the Company. Capital expenditure approved by the Directors but not contracted for was Rs.106,669,000/- (2017/18 – Rs. 92,114,000/-) for the Group and Rs. 93,946,000/- (2016/17 – Rs.70,142,771/-) for the Company.
Contingent LiabilitiesThe contingent liability as at 31st March 2019 on guarantees given by Haycarb PLC to third parties amounted to Rs. 2,590,374,000/- (2017/18 – Rs. 2,625,262,000/-). Of this sum, Rs. 2,118,803,000/- (2016/17 – Rs. 2,241,287,000/-) relate to facilities obtained by subsidiaries.
32. FINANCIAL RISK MANAGEMENT OBJECTIVES AND POLICIES
The Group has exposure to the following risks from financial instruments:
1. Credit risk
2. Liquidity risk
3. Market risk
This note presents information about the Group’s exposure to each of the above risks, the Group’s objectives, policies and processes for measuring and managing risk and the Group’s management of capital. Further quantitative disclosures are included throughout these Consolidated Financial Statements.
Financial Risk Management FrameworkThe Board of Directors has overall responsibility for the establishment and oversight of the Group’s financial risk management framework which includes developing and monitoring the Group's financial risk management policies.
The Group’s financial risk management policies are established to identify, quantify and analyse the financial risks faced by the Group, to set appropriate risk limits and controls, and to monitor financial risks and adherence to limits. Financial risk management policies and systems are reviewed regularly to reflect changes in market conditions and the Group’s activities. The Group, through its training and management standards and procedures, aims to develop a disciplined and constructive control environment in which all employees understand their roles and obligations.
The Group Audit Committee oversees how management monitors compliance with the Group’s financial risk management policies and procedures, and reviews the adequacy of the financial risk management framework in relation to the risks faced by the Group. The Group Audit Committee is assisted in its oversight role by The Management Audit and Systems Review Division (MASRD) of the parent company Hayleys PLC. MASRD undertakes both regular and ad hoc reviews of financial risk management policies and procedures, the results of which are reported to the Group Audit Committee.
Credit RiskCredit risk is the risk that a counterparty will not meet its obligations under a financial instrument or customer contract, leading to a financial loss. The Group is exposed to credit risk from its operating activities (primarily from trade receivables) and from its financing activities, including deposits with banks and financial institutions, foreign exchange transactions and other financial instruments.
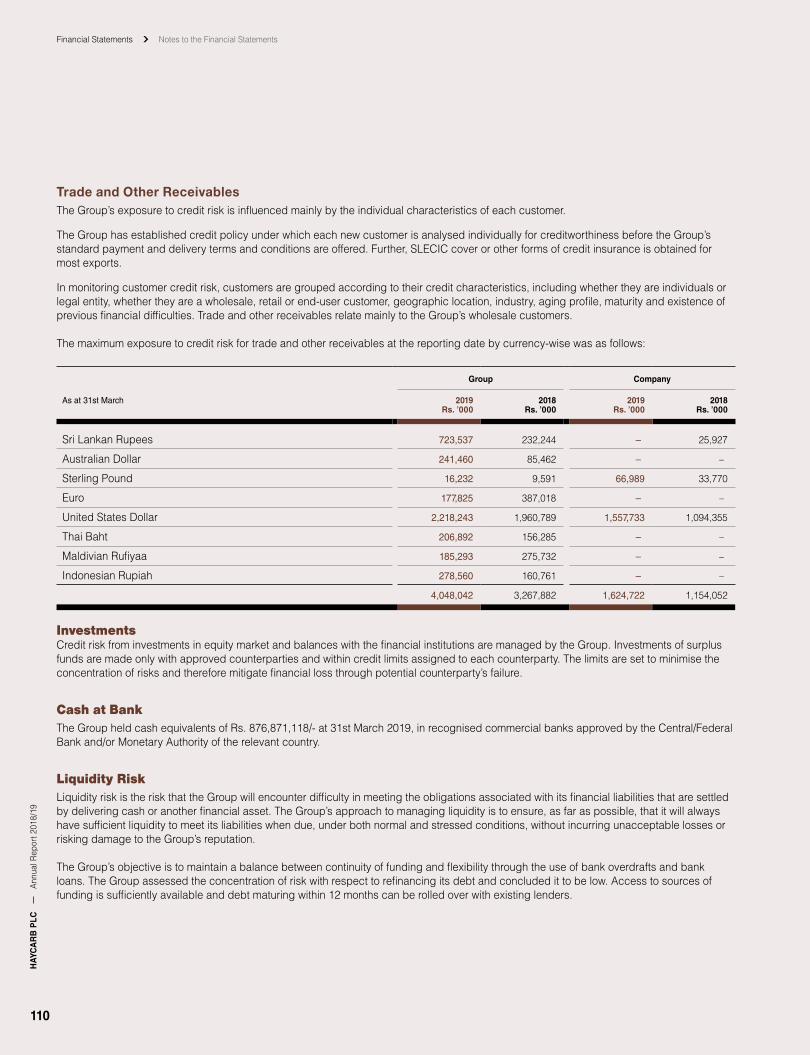
Financial Statements Notes to the Financial StatementsH
AYC
AR
B P
LCA
nnua
l Rep
ort 2
018/
19
110
Trade and Other ReceivablesThe Group’s exposure to credit risk is influenced mainly by the individual characteristics of each customer.
The Group has established credit policy under which each new customer is analysed individually for creditworthiness before the Group’s standard payment and delivery terms and conditions are offered. Further, SLECIC cover or other forms of credit insurance is obtained for most exports.
In monitoring customer credit risk, customers are grouped according to their credit characteristics, including whether they are individuals or legal entity, whether they are a wholesale, retail or end-user customer, geographic location, industry, aging profile, maturity and existence of previous financial difficulties. Trade and other receivables relate mainly to the Group’s wholesale customers.
The maximum exposure to credit risk for trade and other receivables at the reporting date by currency-wise was as follows:
Group Company
As at 31st March 2019Rs. ’000
2018Rs. ’000
2019Rs. ’000
2018Rs. ’000
Sri Lankan Rupees 723,537 232,244 – 25,927
Australian Dollar 241,460 85,462 – –
Sterling Pound 16,232 9,591 66,989 33,770
Euro 177,825 387,018 – –
United States Dollar 2,218,243 1,960,789 1,557,733 1,094,355
Thai Baht 206,892 156,285 – –
Maldivian Rufiyaa 185,293 275,732 – –
Indonesian Rupiah 278,560 160,761 – –
4,048,042 3,267,882 1,624,722 1,154,052
InvestmentsCredit risk from investments in equity market and balances with the financial institutions are managed by the Group. Investments of surplus funds are made only with approved counterparties and within credit limits assigned to each counterparty. The limits are set to minimise the concentration of risks and therefore mitigate financial loss through potential counterparty’s failure.
Cash at BankThe Group held cash equivalents of Rs. 876,871,118/- at 31st March 2019, in recognised commercial banks approved by the Central/Federal Bank and/or Monetary Authority of the relevant country.
Liquidity RiskLiquidity risk is the risk that the Group will encounter difficulty in meeting the obligations associated with its financial liabilities that are settled by delivering cash or another financial asset. The Group’s approach to managing liquidity is to ensure, as far as possible, that it will always have sufficient liquidity to meet its liabilities when due, under both normal and stressed conditions, without incurring unacceptable losses or risking damage to the Group’s reputation.
The Group’s objective is to maintain a balance between continuity of funding and flexibility through the use of bank overdrafts and bank loans. The Group assessed the concentration of risk with respect to refinancing its debt and concluded it to be low. Access to sources of funding is sufficiently available and debt maturing within 12 months can be rolled over with existing lenders.
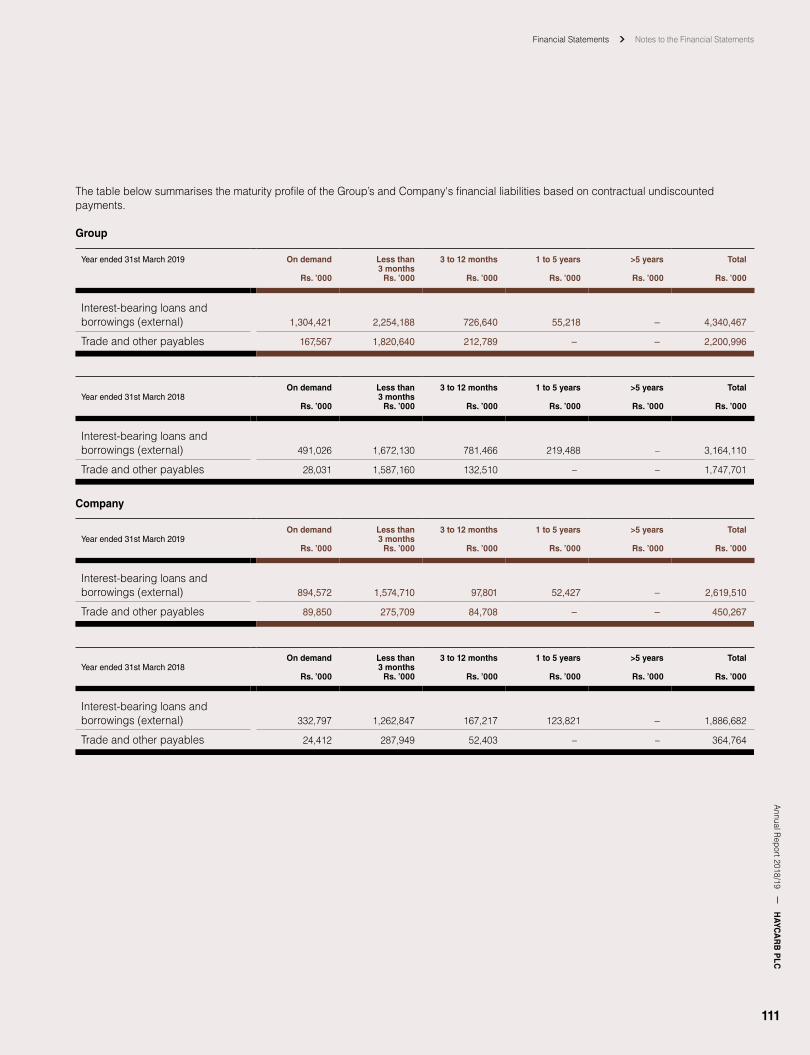
Financial Statements Notes to the Financial StatementsA
nnual Report 2018/19
HAYC
AR
B P
LC
111
The table below summarises the maturity profile of the Group’s and Company's financial liabilities based on contractual undiscounted payments.
Group
Year ended 31st March 2019 On demand
Rs. ’000
Less than 3 months
Rs. ’000
3 to 12 months
Rs. ’000
1 to 5 years
Rs. ’000
>5 years
Rs. ’000
Total
Rs. ’000
Interest-bearing loans and borrowings (external) 1,304,421 2,254,188 726,640 55,218 – 4,340,467
Trade and other payables 167,567 1,820,640 212,789 – – 2,200,996
Year ended 31st March 2018On demand
Rs. ’000
Less than 3 months
Rs. ’000
3 to 12 months
Rs. ’000
1 to 5 years
Rs. ’000
>5 years
Rs. ’000
Total
Rs. ’000
Interest-bearing loans and borrowings (external) 491,026 1,672,130 781,466 219,488 – 3,164,110
Trade and other payables 28,031 1,587,160 132,510 – – 1,747,701
Company
Year ended 31st March 2019On demand
Rs. ’000
Less than 3 months
Rs. ’000
3 to 12 months
Rs. ’000
1 to 5 years
Rs. ’000
>5 years
Rs. ’000
Total
Rs. ’000
Interest-bearing loans and borrowings (external) 894,572 1,574,710 97,801 52,427 – 2,619,510
Trade and other payables 89,850 275,709 84,708 – – 450,267
Year ended 31st March 2018On demand
Rs. ’000
Less than 3 months
Rs. ’000
3 to 12 months
Rs. ’000
1 to 5 years
Rs. ’000
>5 years
Rs. ’000
Total
Rs. ’000
Interest-bearing loans and borrowings (external) 332,797 1,262,847 167,217 123,821 – 1,886,682
Trade and other payables 24,412 287,949 52,403 – – 364,764
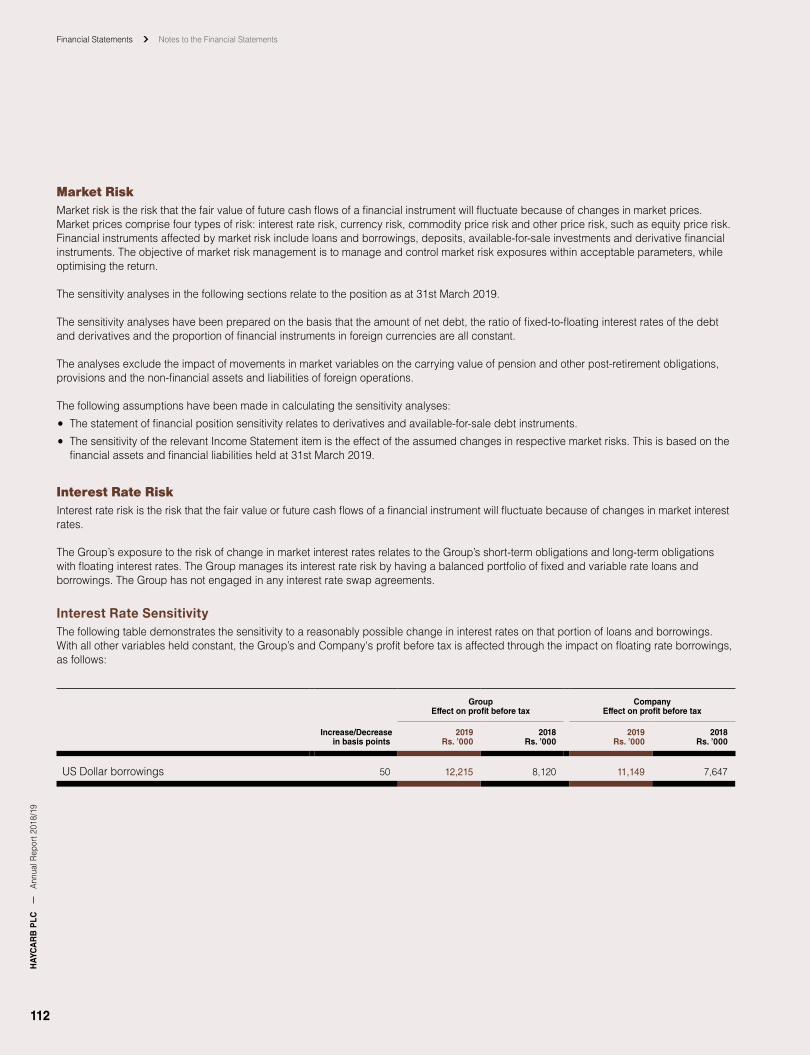
Financial Statements Notes to the Financial StatementsH
AYC
AR
B P
LCA
nnua
l Rep
ort 2
018/
19
112
Market RiskMarket risk is the risk that the fair value of future cash flows of a financial instrument will fluctuate because of changes in market prices. Market prices comprise four types of risk: interest rate risk, currency risk, commodity price risk and other price risk, such as equity price risk. Financial instruments affected by market risk include loans and borrowings, deposits, available-for-sale investments and derivative financial instruments. The objective of market risk management is to manage and control market risk exposures within acceptable parameters, while optimising the return. The sensitivity analyses in the following sections relate to the position as at 31st March 2019.
The sensitivity analyses have been prepared on the basis that the amount of net debt, the ratio of fixed-to-floating interest rates of the debt and derivatives and the proportion of financial instruments in foreign currencies are all constant.
The analyses exclude the impact of movements in market variables on the carrying value of pension and other post-retirement obligations, provisions and the non-financial assets and liabilities of foreign operations.
The following assumptions have been made in calculating the sensitivity analyses: The statement of financial position sensitivity relates to derivatives and available-for-sale debt instruments. The sensitivity of the relevant Income Statement item is the effect of the assumed changes in respective market risks. This is based on the financial assets and financial liabilities held at 31st March 2019.
Interest Rate RiskInterest rate risk is the risk that the fair value or future cash flows of a financial instrument will fluctuate because of changes in market interest rates. The Group’s exposure to the risk of change in market interest rates relates to the Group’s short-term obligations and long-term obligations with floating interest rates. The Group manages its interest rate risk by having a balanced portfolio of fixed and variable rate loans and borrowings. The Group has not engaged in any interest rate swap agreements.
Interest Rate SensitivityThe following table demonstrates the sensitivity to a reasonably possible change in interest rates on that portion of loans and borrowings. With all other variables held constant, the Group’s and Company's profit before tax is affected through the impact on floating rate borrowings, as follows:
GroupEffect on profit before tax
CompanyEffect on profit before tax
Increase/Decreasein basis points
2019Rs. ’000
2018Rs. ’000
2019Rs. ’000
2018Rs. ’000
US Dollar borrowings 50 12,215 8,120 11,149 7,647
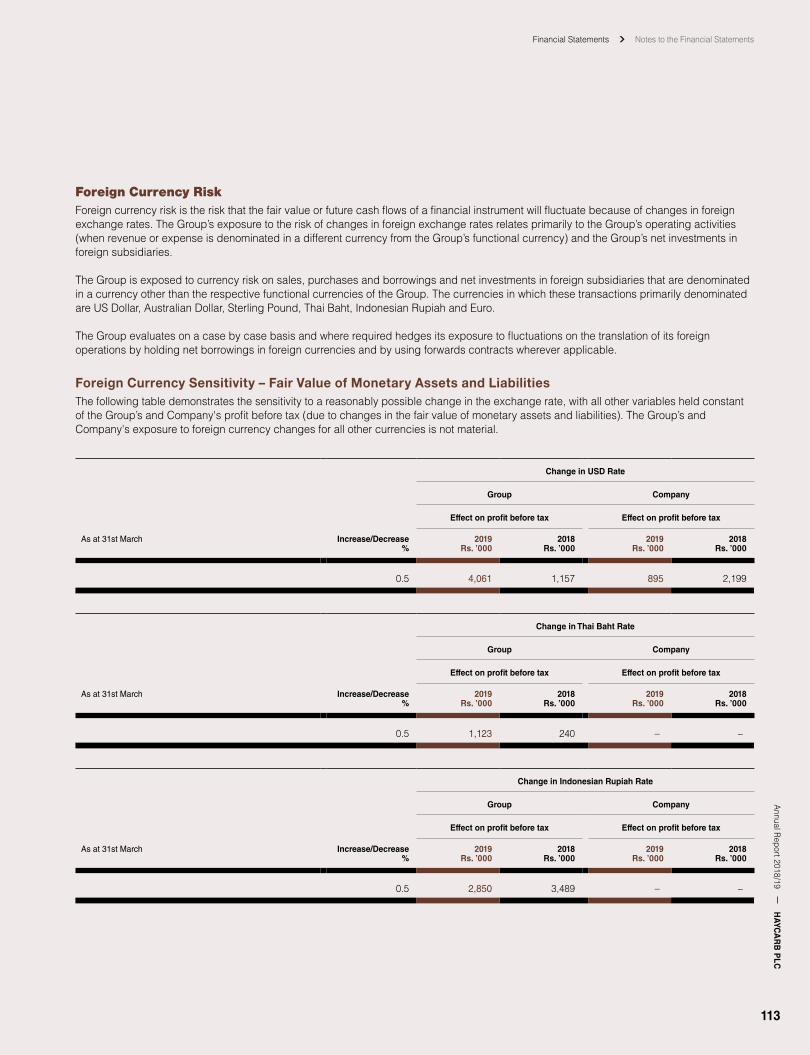
Financial Statements Notes to the Financial StatementsA
nnual Report 2018/19
HAYC
AR
B P
LC
113
Foreign Currency RiskForeign currency risk is the risk that the fair value or future cash flows of a financial instrument will fluctuate because of changes in foreign exchange rates. The Group’s exposure to the risk of changes in foreign exchange rates relates primarily to the Group’s operating activities (when revenue or expense is denominated in a different currency from the Group’s functional currency) and the Group’s net investments in foreign subsidiaries. The Group is exposed to currency risk on sales, purchases and borrowings and net investments in foreign subsidiaries that are denominated in a currency other than the respective functional currencies of the Group. The currencies in which these transactions primarily denominated are US Dollar, Australian Dollar, Sterling Pound, Thai Baht, Indonesian Rupiah and Euro.
The Group evaluates on a case by case basis and where required hedges its exposure to fluctuations on the translation of its foreign operations by holding net borrowings in foreign currencies and by using forwards contracts wherever applicable.
Foreign Currency Sensitivity – Fair Value of Monetary Assets and LiabilitiesThe following table demonstrates the sensitivity to a reasonably possible change in the exchange rate, with all other variables held constant of the Group’s and Company's profit before tax (due to changes in the fair value of monetary assets and liabilities). The Group’s and Company's exposure to foreign currency changes for all other currencies is not material.
Change in USD Rate
Group Company
Effect on profit before tax Effect on profit before tax
As at 31st March Increase/Decrease %
2019Rs. ’000
2018Rs. ’000
2019Rs. ’000
2018Rs. ’000
0.5 4,061 1,157 895 2,199
Change in Thai Baht Rate
Group Company
Effect on profit before tax Effect on profit before tax
As at 31st March Increase/Decrease %
2019Rs. ’000
2018Rs. ’000
2019Rs. ’000
2018Rs. ’000
0.5 1,123 240 – –
Change in Indonesian Rupiah Rate
Group Company
Effect on profit before tax Effect on profit before tax
As at 31st March Increase/Decrease %
2019Rs. ’000
2018Rs. ’000
2019Rs. ’000
2018Rs. ’000
0.5 2,850 3,489 – –

Financial Statements Notes to the Financial StatementsH
AYC
AR
B P
LCA
nnua
l Rep
ort 2
018/
19
114
Change in GBP Rate
Group Company
Effect on profit before tax Effect on profit before tax
As at 31st March Increase/Decrease%
2019Rs. ’000
2018Rs. ’000
2019Rs. ’000
2018Rs. ’000
0.5 276 92 46 187
Change in AUD Rate
Group Company
Effect on profit before tax Effect on profit before tax
As at 31st March Increase/Decrease%
2019Rs. ’000
2018Rs. ’000
2019Rs. ’000
2018Rs. ’000
0.5 211 240 – –
Change in Euro Rate
Group Company
Effect on profit before tax Effect on profit before tax
As at 31st March Increase/Decrease%
2019Rs. ’000
2018Rs. ’000
2019Rs. ’000
2018Rs. ’000
0.5 1,602 1,928 – –
Change in MVR Rate
Group Company
Effect on profit before tax Effect on profit before tax
As at 31st March Increase/Decrease%
2019Rs. ’000
2018Rs. ’000
2019Rs. ’000
2018Rs. ’000
0.5 334 374 – –
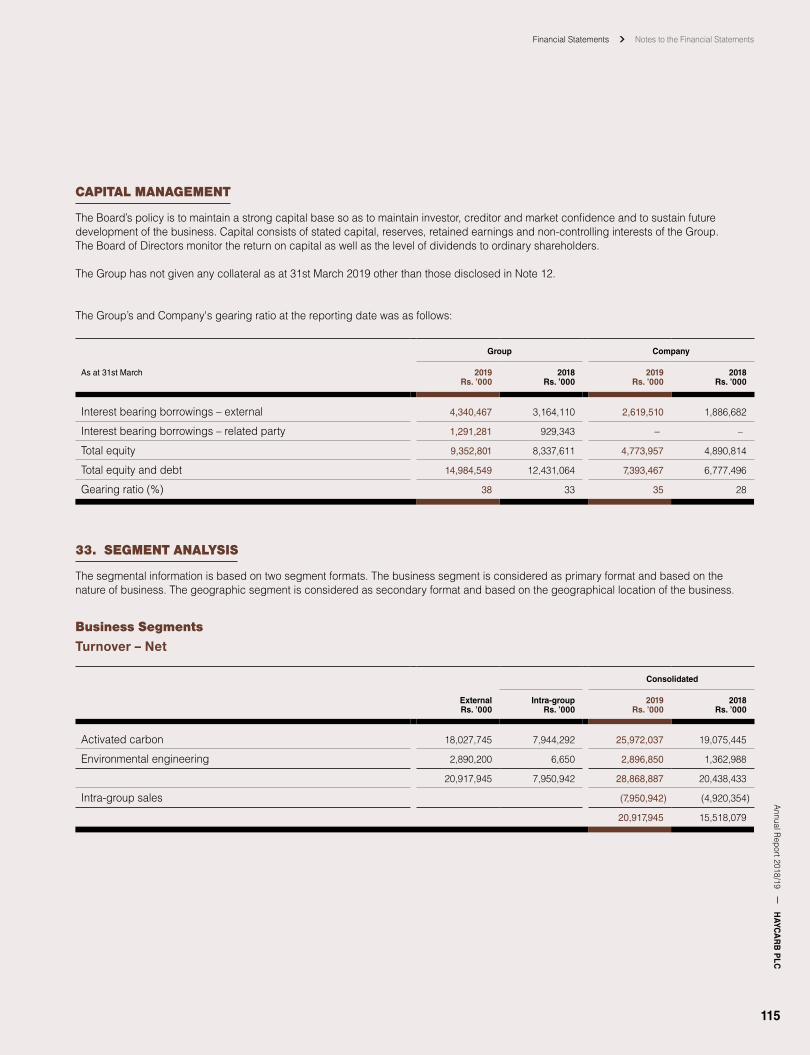
Financial Statements Notes to the Financial StatementsA
nnual Report 2018/19
HAYC
AR
B P
LC
115
CAPITAL MANAGEMENT
The Board’s policy is to maintain a strong capital base so as to maintain investor, creditor and market confidence and to sustain future development of the business. Capital consists of stated capital, reserves, retained earnings and non-controlling interests of the Group. The Board of Directors monitor the return on capital as well as the level of dividends to ordinary shareholders.
The Group has not given any collateral as at 31st March 2019 other than those disclosed in Note 12.
The Group’s and Company's gearing ratio at the reporting date was as follows:
Group Company
As at 31st March 2019Rs. ’000
2018Rs. ’000
2019Rs. ’000
2018Rs. ’000
Interest bearing borrowings – external 4,340,467 3,164,110 2,619,510 1,886,682
Interest bearing borrowings – related party 1,291,281 929,343 – –
Total equity 9,352,801 8,337,611 4,773,957 4,890,814
Total equity and debt 14,984,549 12,431,0647,393,467
7,393,467 6,777,496
Gearing ratio (%) 38 33 35 28
33. SEGMENT ANALYSIS
The segmental information is based on two segment formats. The business segment is considered as primary format and based on the nature of business. The geographic segment is considered as secondary format and based on the geographical location of the business.
Business SegmentsTurnover – Net
Consolidated
External Rs. ’000
Intra-groupRs. ’000
2019Rs. ’000
2018Rs. ’000
Activated carbon 18,027,745 7,944,292 25,972,037 19,075,445
Environmental engineering 2,890,200 6,650 2,896,850 1,362,988
20,917,945 7,950,942 28,868,887 20,438,433
Intra-group sales (7,950,942) (4,920,354)
20,917,945 15,518,079

Financial Statements Notes to the Financial StatementsH
AYC
AR
B P
LCA
nnua
l Rep
ort 2
018/
19
116
Profit Before Tax
Consolidated
2019Rs. ’000
2018Rs. ’000
Activated carbon 1,301,952 726,759
Environmental engineering 301,042 399,945
Purification – associate (5,644) 1,956
Leisure – associate 130,016 15,919
1,727,366 1,144,579
Consolidation adjustments (264,967) (207,346)
Unrealised profit on intra-group sales (109,501) (10,810)
1,352,898 926,423
Total assets Provision for liabilities and charges Trade and other payables
As at 31st March 2019Rs. ’000
2018Rs. ’000
2019Rs. ’000
2018Rs. ’000
2019Rs. ’000
2018Rs. ’000
Activated carbon 16,259,930 13,251,053 764,891 683,623 1,929,420 1,188,418
Environmental engineering 2,131,437 1,514,478 – – 824,486 754,475
18,391,367 14,765,531 764,891 683,623 2,753,906 1,942,893
Investment in associates and others 583,765 516,926
18,975,132 15,282,457
Capital expenditure Depreciation
2019Rs. ’000
2018Rs. ’000
2019Rs. ’000
2018Rs. ’000
Activated carbon 388,364 321,416 476,831 424,390
Environmental engineering 1,234 3,400 2,308 1,865
389,598 324,816 479,139 426,255
Cash Flows from
2019 2018
Activated carbon
Rs. ’000
Environmentalengineering
Rs. ’000
Activatedcarbon
Rs. ’000
Environmentalengineering
Rs. ’000
Operating activities (722,018) 185,607 92,635 668
Investing activities (338,919) 2,261 (343,605) (623)
Financing activities (421,414) (90,829) (503,797) (157,500)
(1,482,351) 97,039 (754,767) (157,455)

Financial Statements Notes to the Financial StatementsA
nnual Report 2018/19
HAYC
AR
B P
LC
117
Geographical SegmentsTurnover – Net
Consolidated
External Rs. ’000
Intra-groupRs. ’000
2019Rs. ’000
2018Rs. ’000
USA 3,465,124 – 3,465,124 2,237,827
Europe 2,145,831 – 2,145,831 1,655,599
Australia 1,739,703 – 1,739,703 1,067,288
Sri Lanka 7,154,857 (2,747,123) 9,901,980 8,032,446
Other Asian Countries 6,412,430 (5,203,819) 11,616,249 7,445,273
20,917,945 (7,950,942) 28,868,887 20,438,433
Intra-group sales (7,950,942) (4,920,354)
20,917,945 15,518,079
Profit Before Tax
Consolidated
2019Rs. ’000
2018Rs. ’000
USA 52,944 45,977
Europe 74,660 (18,894)
Australia 33,710 22,343
Sri Lanka 636,194 1,041,543
Other Asian Countries 929,858 53,610
1,727,366 1,144,579
Consolidation adjustments (374,468) (218,156)
1,352,898 926,423

Financial Statements Notes to the Financial StatementsH
AYC
AR
B P
LCA
nnua
l Rep
ort 2
018/
19
118
Assets and Liabilities
Non-interest-bearing liabilities
Total assets Provision for liabilities and charges Trade and other payables
2019Rs. ’000
2018Rs. ’000
2019Rs. ’000
2018Rs. ’000
2019Rs. ’000
2018Rs. ’000
USA 1,269,668 1,155,562 – – 150,913 124,489
Europe 1,069,669 690,675 – – 260,961 191,770
Australia 599,850 376,531 – – 42,805 72,758
Sri Lanka 5,852,725 5,369,502 655,135 607,777 1,168,160 1,171,176
Other Asian Countries 9,599,455 7,173,261 109,756 75,846 1,131,067 382,700
18,391,367 14,765,531 764,891 683,623 2,753,906 1,942,893
Investments in associates and other 583,765 516,926
18,975,132 15,282,457
Capital expenditure Depreciation
Year ended 31st March 2019Rs. ’000
2018Rs. ’000
2019Rs. ’000
2018Rs. ’000
USA 771 1,196 5,547 2,351
Europe 5,600 10,048 9,922 7,993
Australia – 8,078 1,352 1,670
Sri Lanka 134,680 158,353 222,827 220,325
Other Asian Countries 248,547 147,141 239,491 193,916
389,598 324,816 479,139 426,255
34. EVENTS OCCURRING AFTER THE BALANCE SHEET DATE
No circumstances have arisen since the reporting date, which would require adjustment to or disclosure in the Financial Statements,

Financial Statements Notes to the Financial StatementsA
nnual Report 2018/19
HAYC
AR
B P
LC
119
35. FOREIGN CURRENCY TRANSLATION
The principal exchange rates used for translation purposes were:
Average Year end
2019Rs. ’000
2018Rs. ’000
2019Rs. ’000
2018Rs. ’000
US Dollar 169.551 153.509 176.092 155.604
Australian Dollar 123.278 118.943 124.809 119.070
Pound Sterling 222.047 205.281 230.213 219.070
Thai Baht 5.254 4.666 5.540 4.991
Indonesian Rupiah 0.0118 0.0114 0.0124 0.0113
Euro 195.815 180.744 197.773 191.741
Indian rupee 2.429 2.381 2.546 2.394 2.429 2.381 2.546 2.394
36. FUNCTIONAL CURRENCY
The Group's functional currency is Sri Lanka Rupee, except in the following subsidiaries:
Company Functional Currency
PT Mapalus Makawanua Charcoal Industry Indonesian Rupiah
PT Haycarb Palu Mitra Indonesian Rupiah
Haycarb Holdings Bitung Ltd. United States Dollar
Eurocarb Products Ltd. Sterling Pounds
Haycarb Holdings Australia (Pty) Ltd. Australian Dollar
Haycarb USA Inc. United States Dollar
Carbokarn Co. Ltd. Thai Baht
CK Regen Systems Co. Ltd. Thai Baht
Shizuka Co. Ltd. Thai Baht
Puricarb Pte. Ltd. Euro
Haycarb Activated Carbon (Pvt) Limited (Chennai,India) Indian Rupee
37. COMPANIES WITH DIFFERENT ACCOUNTING YEARS
The Financial Statements of Carbokarn Co. Ltd., CK Regen Systems Co. Ltd., Shizuka Co. Ltd., Thailand, Haycarb Holdings Australia (Pty) Ltd., Australia, Haycarb USA, USA and PT Mapalus Makawanua Charcoal Industry, PT Haycarb Palu Mitra, Indonesia which has financial year end as 31st December.
These subsidiaries with 31st December financial year end prepare additional financial information for consolidation purpose as of the same date as the Financial Statements of the parent.

HAY
CA
RB
PLC
Ann
ual R
epor
t 201
8/19
120
Group Value Added
2019Rs. ’000
2018Rs. ’000
20,917,945 15,518,079
Other operating income 33,707 29,969
20,951,652 15,548,048
Cost of materials and services brought in (17,091,867) (12,149,424)
Value added 3,859,785 3,398,624
Distribution of Value Added
%2019
Rs. ’000 %2018
Rs. ’000
To: Employees as remuneration 49 1,884,977 47 1,591,127
To: Government revenue
Sri Lanka 5 187,254 5 180,184
Overseas 3 132,824 5 179,731
To: Providers of capital 11 438,289 9 289,212
Interest on borrowings 311,998 187,952
Minority interest 126,291 101,260
To: Shareholders as dividends 6 237,699 5 178,274
Retained in the business 25 978,741 29 980,096
Depreciation 479,139 426,255
Profit retained 499,602 553,841
100 3,859,785 100 3,398,624
STATEMENT OF GROUP VALUE ADDED

Annual R
eport 2018/19H
AYCA
RB
PLC
121
1. STOCK EXCHANGE LISTING
The Interim Financial Statements for the fourth quarter ended 31st March 2019, have been submitted to the Colombo Stock Exchange as required by the Listing Rules.
2. SHAREHOLDERS
Haycarb PLC – Ordinary Shareholders as at 31st March 2019.
Residents Non-Residents Total
No. of shares held Number ofshareholders
Number ofshares
% Number ofshareholders
Number ofshares
% Number ofshareholders
Number ofshares
%
1 – 1,000 1,528 311,777 1.0493 23 6,817 0.0229 1,551 318,594 1.0722
1,001 – 10,000 413 1,372,133 4.6181 16 68,929 0.2320 429 1,441,062 4.8501
10,001 – 100,000 94 2,425,597 8.1636 10 262,474 0.8834 104 2,688,071 9.0470
100,001 – 1,000,000 8 2,198,716 7.4000 6 1,523,264 5.1267 14 3,721,980 12.5267
Over 1,000,000 2 21,542,668 72.5040 – – – 2 21,542,668 72.5040
2,045 27,850,891 93.7350 55 1,861,484 6.2650 2,100 29,712,375 100.0000
Category
Individuals 1,886 3,833,829 12.9032 51 1,168,801 3.9337 1,937 5,002,630 16.8369
Institutions 159 24,017,062 80.8318 4 692,683 2.3313 163 24,709,745 83.1631
2,045 27,850,891 93.7350 55 1,861,484 6.2650 2,100 29,712,375 100.0000
3. MARKET VALUE
The market value of Haycarb PLC, ordinary shares during the year.
2018/19 2017/18
Rs. Date Rs. Date
Highest price 154.90 14th January, 2019 170.00 12th July, 2017
Lowest price 119.10 5th April, 2018 120.00 29th March, 2018
Closing price 127.00 29th March, 2019 120.00 29th March, 2018
Number of transactions 670.00 652.00
Number of shares traded 574,349 380,507
Value of shares traded 73,607,820 58,495,343
INVESTOR INFORMATION
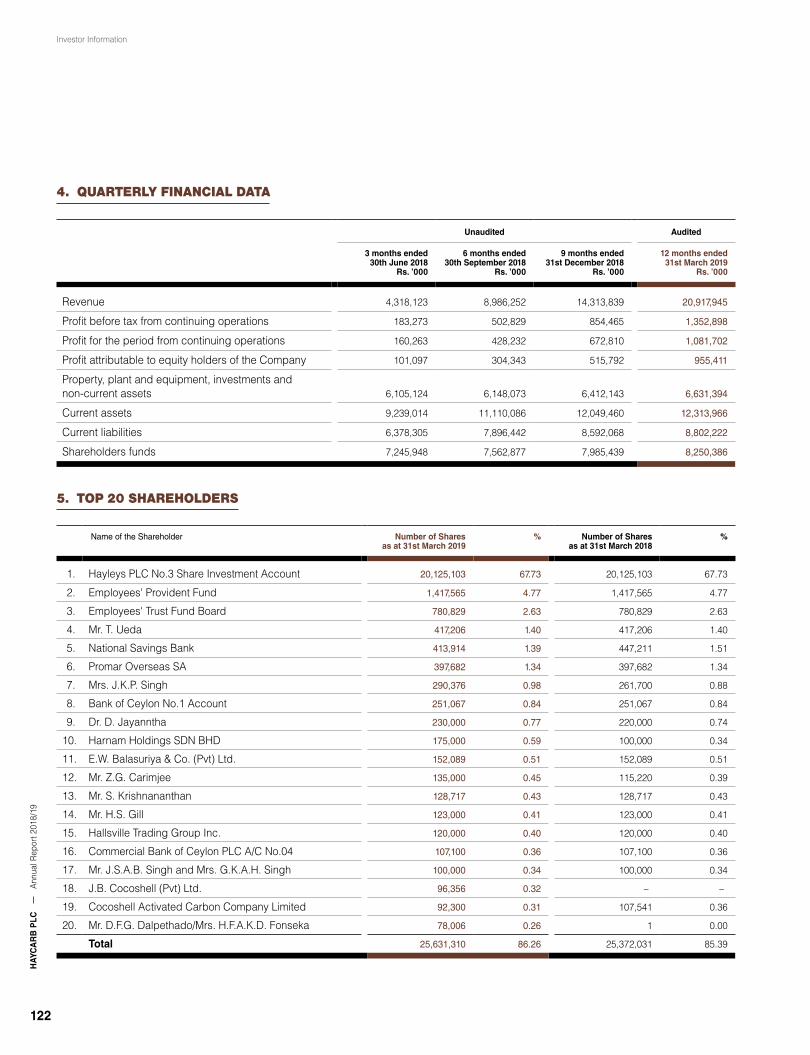
HAY
CA
RB
PLC
Ann
ual R
epor
t 201
8/19
122
Investor Information
4. QUARTERLY FINANCIAL DATA
Unaudited Audited
3 months ended 30th June 2018
Rs. ’000
6 months ended30th September 2018
Rs. ’000
9 months ended31st December 2018
Rs. ’000
12 months ended31st March 2019
Rs. ’000
Revenue 4,318,123 8,986,252 14,313,839 20,917,945
Profit before tax from continuing operations 183,273 502,829 854,465 1,352,898
Profit for the period from continuing operations 160,263 428,232 672,810 1,081,702
Profit attributable to equity holders of the Company 101,097 304,343 515,792 955,411
Property, plant and equipment, investments and non-current assets 6,105,124 6,148,073 6,412,143 6,631,394
Current assets 9,239,014 11,110,086 12,049,460 12,313,966
Current liabilities 6,378,305 7,896,442 8,592,068 8,802,222
Shareholders funds 7,245,948 7,562,877 7,985,439 8,250,386
5. TOP 20 SHAREHOLDERS
Name of the Shareholder Number of Sharesas at 31st March 2019
% Number of Sharesas at 31st March 2018
%
1. Hayleys PLC No.3 Share Investment Account 20,125,103 67.73 20,125,103 67.73
2. Employees' Provident Fund 1,417,565 4.77 1,417,565 4.77
3. Employees' Trust Fund Board 780,829 2.63 780,829 2.63
4. Mr. T. Ueda 417,206 1.40 417,206 1.40
5. National Savings Bank 413,914 1.39 447,211 1.51
6. Promar Overseas SA 397,682 1.34 397,682 1.34
7. Mrs. J.K.P. Singh 290,376 0.98 261,700 0.88
8. Bank of Ceylon No.1 Account 251,067 0.84 251,067 0.84
9. Dr. D. Jayanntha 230,000 0.77 220,000 0.74
10. Harnam Holdings SDN BHD 175,000 0.59 100,000 0.34
11. E.W. Balasuriya & Co. (Pvt) Ltd. 152,089 0.51 152,089 0.51
12. Mr. Z.G. Carimjee 135,000 0.45 115,220 0.39
13. Mr. S. Krishnananthan 128,717 0.43 128,717 0.43
14. Mr. H.S. Gill 123,000 0.41 123,000 0.41
15. Hallsville Trading Group Inc. 120,000 0.40 120,000 0.40
16. Commercial Bank of Ceylon PLC A/C No.04 107,100 0.36 107,100 0.36
17. Mr. J.S.A.B. Singh and Mrs. G.K.A.H. Singh 100,000 0.34 100,000 0.34
18. J.B. Cocoshell (Pvt) Ltd. 96,356 0.32 – –
19. Cocoshell Activated Carbon Company Limited 92,300 0.31 107,541 0.36
20. Mr. D.F.G. Dalpethado/Mrs. H.F.A.K.D. Fonseka 78,006 0.26 1 0.00
Total 25,631,310 86.26 25,372,031 85.39

Annual R
eport 2018/19H
AYCA
RB
PLC
123
Investor Information
6. DIRECTORS’ SHAREHOLDINGS – (AS DEFINED IN COLOMBO STOCK EXCHANGE RULES)
Number of Shares
Name of the Shareholder As at31st March 2019
As at31st March 2018
Mr. A.M. Pandithage 2,379 2,379
Mr. S.C. Ganegoda 1,815 1,815
Mr. H.S.R. Kariyawasan* 15,500 15,500
Mr. M.S.P. Udaya Kumara 462 462
Mr. B. Balaratnarajah 1,004 1,004
21,160 21,160
* Shares held jointly with Mrs. K. H. S. Kariyawasan
** Mr. Dhammika Perera holds directly and indirectly 50.44% of the total issued shares of Hayleys PLC which has 20,125,103 shares in Haycarb PLC.
7. PUBLIC HOLDING
The percentage of shares held by public as per the Colombo Stock Exchange Rules as at 31st March 2019, was 32.20% (2018 – 32.20%) held by 2094 ordinary shareholder (2018 – 2113).
Float adjusted market capitalisation as at 31st March 2019 was Rs. 1,215,057,863.25
The Company complies with Option 5 of the Listing Rules 7.3.1 (a) – less than Rs. 2.5 billion Float Adjusted Market Capitalisation which requires 20% minimum public holding.
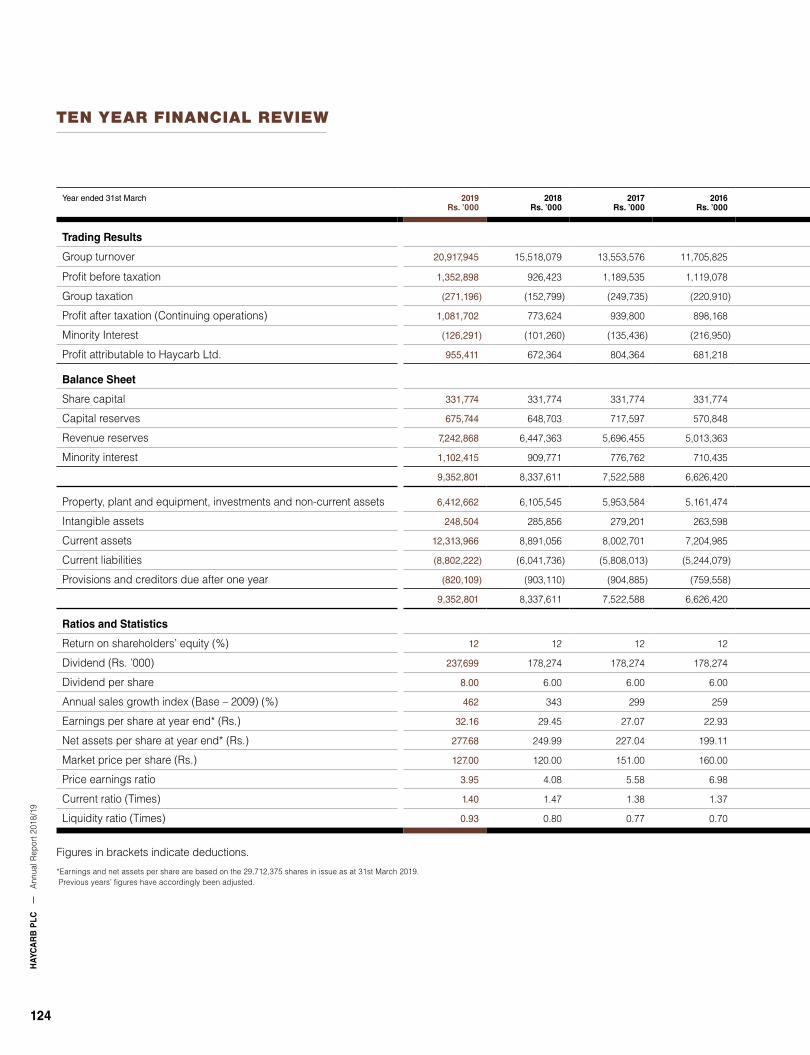
HAY
CA
RB
PLC
Ann
ual R
epor
t 201
8/19
124
TEN YEAR FINANCIAL REVIEW
Year ended 31st March 2019Rs. ’000
2018Rs. ’000
2017Rs. ’000
2016Rs. ’000
2015Rs. ’000
2014Rs. ’000
2013Rs. ’000
2012Rs. ’000
2011Rs. ’000
2010Rs. ’000
Trading Results
Group turnover 20,917,945 15,518,079 13,553,576 11,705,825 11,933,848 10,338,684 10,149,637 8,508,896 6,400,233 5,075,968
Profit before taxation 1,352,898 926,423 1,189,535 1,119,078 1,070,336 1,044,083 1,227,707 656,822 724,197 819,809
Group taxation (271,196) (152,799) (249,735) (220,910) (196,404) (152,106) (192,708) (133,808) (149,853) (134,166)
Profit after taxation (Continuing operations) 1,081,702 773,624 939,800 898,168 873,932 891,977 1,034,999 523,014 574,344 685,643
Minority Interest (126,291) (101,260) (135,436) (216,950) (178,947) (104,197) (89,691) (51,822) (69,259) (52,716)
Profit attributable to Haycarb Ltd. 955,411 672,364 804,364 681,218 694,985 787,780 945,308 471,192 505,085 632,927
Balance Sheet
Share capital 331,774 331,774 331,774 331,774 331,774 331,774 331,774 331,774 331,774 331,774
Capital reserves 675,744 648,703 717,597 570,848 570,848 373,907 373,907 296,707 213,330 213,330
Revenue reserves 7,242,868 6,447,363 5,696,455 5,013,363 4,800,584 4,061,796 3,675,876 2,961,061 2,587,343 1,753,964
Minority interest 1,102,415 909,771 776,762 710,435 590,724 468,418 344,247 270,721 260,786 223,577
9,352,801 8,337,611 7,522,588 6,626,420 6,293,930 5,235,895 4,725,804 3,860,263 3,393,233 2,522,645
Property, plant and equipment, investments and non-current assets 6,412,662 6,105,545 5,953,584 5,161,474 5,059,453 4,275,533 3,724,931 2,616,262 2,009,828 1,318,321
Intangible assets 248,504 285,856 279,201 263,598 260,903 251,223 240,018 132,000 63,447 63,447
Current assets 12,313,966 8,891,056 8,002,701 7,204,985 5,696,413 4,986,749 4,466,440 3,710,435 2,504,592 2,183,165
Current liabilities (8,802,222) (6,041,736) (5,808,013) (5,244,079) (3,923,488) (3,357,492) (2,907,846) (2,083,981) (1,072,575) (905,443)
Provisions and creditors due after one year (820,109) (903,110) (904,885) (759,558) (799,351) (920,118) (797,739) (514,453) (112,059) (136,845)
9,352,801 8,337,611 7,522,588 6,626,420 6,293,930 5,235,895 4,725,804 3,860,263 3,393,233 2,522,645
Ratios and Statistics
Return on shareholders’ equity (%) 12 12 12 12 12 17 21 13 16 28
Dividend (Rs. ’000) 237,699 178,274 178,274 178,274 178,274 178,274 207,986 163,418 148,562 148,562
Dividend per share 8.00 6.00 6.00 6.00 6.00 6.00 7.00 5.50 5.00 5.00
Annual sales growth index (Base – 2009) (%) 462 343 299 259 264 228 224 188 141 112
Earnings per share at year end* (Rs.) 32.16 29.45 27.07 22.93 23.39 26.51 31.82 15.86 17.00 21.30
Net assets per share at year end* (Rs.) 277.68 249.99 227.04 199.11 191.95 160.45 147.89 120.81 105.42 77.38
Market price per share (Rs.) 127.00 120.00 151.00 160.00 183.00 181.00 176.00 160.00 155.40 160.00
Price earnings ratio 3.95 4.08 5.58 6.98 7.82 6.83 5.53 10.09 9.14 7.51
Current ratio (Times) 1.40 1.47 1.38 1.37 1.45 1.47 1.54 1.78 2.33 2.41
Liquidity ratio (Times) 0.93 0.80 0.77 0.70 0.68 0.85 0.79 0.84 1.37 1.31
Figures in brackets indicate deductions.
*Earnings and net assets per share are based on the 29,712,375 shares in issue as at 31st March 2019. Previous years’ figures have accordingly been adjusted.
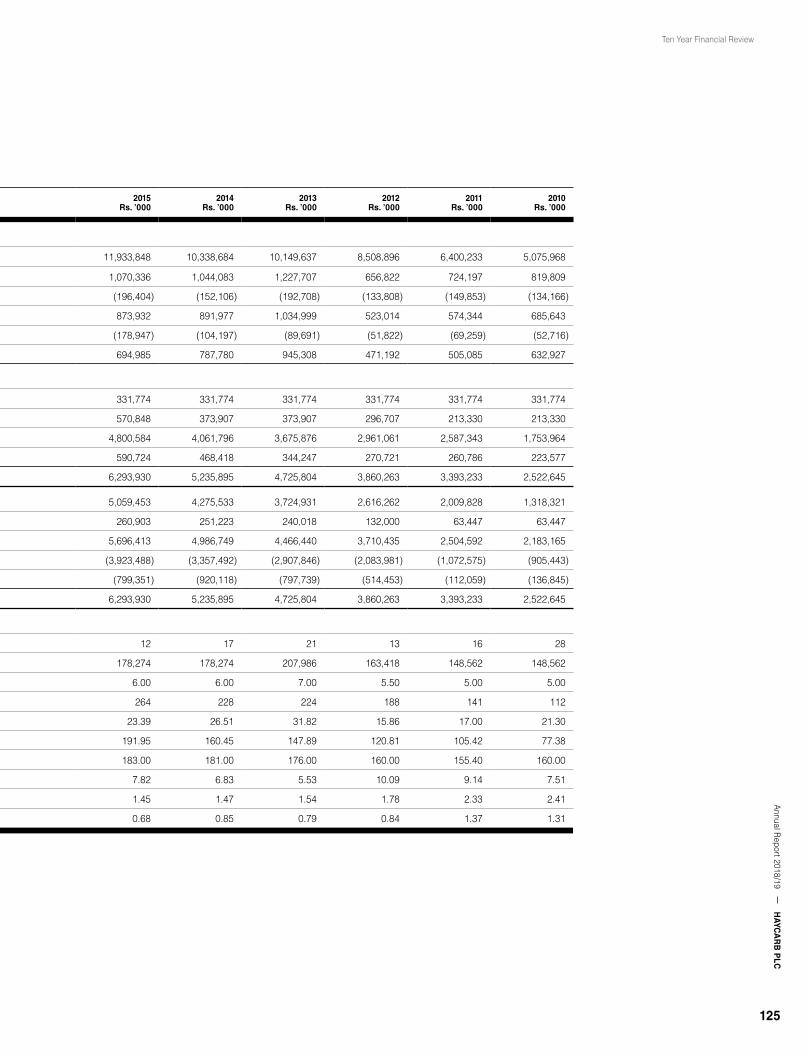
Annual R
eport 2018/19H
AYCA
RB
PLC
125
Ten Year Financial Review
Year ended 31st March 2019Rs. ’000
2018Rs. ’000
2017Rs. ’000
2016Rs. ’000
2015Rs. ’000
2014Rs. ’000
2013Rs. ’000
2012Rs. ’000
2011Rs. ’000
2010Rs. ’000
Trading Results
Group turnover 20,917,945 15,518,079 13,553,576 11,705,825 11,933,848 10,338,684 10,149,637 8,508,896 6,400,233 5,075,968
Profit before taxation 1,352,898 926,423 1,189,535 1,119,078 1,070,336 1,044,083 1,227,707 656,822 724,197 819,809
Group taxation (271,196) (152,799) (249,735) (220,910) (196,404) (152,106) (192,708) (133,808) (149,853) (134,166)
Profit after taxation (Continuing operations) 1,081,702 773,624 939,800 898,168 873,932 891,977 1,034,999 523,014 574,344 685,643
Minority Interest (126,291) (101,260) (135,436) (216,950) (178,947) (104,197) (89,691) (51,822) (69,259) (52,716)
Profit attributable to Haycarb Ltd. 955,411 672,364 804,364 681,218 694,985 787,780 945,308 471,192 505,085 632,927
Balance Sheet
Share capital 331,774 331,774 331,774 331,774 331,774 331,774 331,774 331,774 331,774 331,774
Capital reserves 675,744 648,703 717,597 570,848 570,848 373,907 373,907 296,707 213,330 213,330
Revenue reserves 7,242,868 6,447,363 5,696,455 5,013,363 4,800,584 4,061,796 3,675,876 2,961,061 2,587,343 1,753,964
Minority interest 1,102,415 909,771 776,762 710,435 590,724 468,418 344,247 270,721 260,786 223,577
9,352,801 8,337,611 7,522,588 6,626,420 6,293,930 5,235,895 4,725,804 3,860,263 3,393,233 2,522,645
Property, plant and equipment, investments and non-current assets 6,412,662 6,105,545 5,953,584 5,161,474 5,059,453 4,275,533 3,724,931 2,616,262 2,009,828 1,318,321
Intangible assets 248,504 285,856 279,201 263,598 260,903 251,223 240,018 132,000 63,447 63,447
Current assets 12,313,966 8,891,056 8,002,701 7,204,985 5,696,413 4,986,749 4,466,440 3,710,435 2,504,592 2,183,165
Current liabilities (8,802,222) (6,041,736) (5,808,013) (5,244,079) (3,923,488) (3,357,492) (2,907,846) (2,083,981) (1,072,575) (905,443)
Provisions and creditors due after one year (820,109) (903,110) (904,885) (759,558) (799,351) (920,118) (797,739) (514,453) (112,059) (136,845)
9,352,801 8,337,611 7,522,588 6,626,420 6,293,930 5,235,895 4,725,804 3,860,263 3,393,233 2,522,645
Ratios and Statistics
Return on shareholders’ equity (%) 12 12 12 12 12 17 21 13 16 28
Dividend (Rs. ’000) 237,699 178,274 178,274 178,274 178,274 178,274 207,986 163,418 148,562 148,562
Dividend per share 8.00 6.00 6.00 6.00 6.00 6.00 7.00 5.50 5.00 5.00
Annual sales growth index (Base – 2009) (%) 462 343 299 259 264 228 224 188 141 112
Earnings per share at year end* (Rs.) 32.16 29.45 27.07 22.93 23.39 26.51 31.82 15.86 17.00 21.30
Net assets per share at year end* (Rs.) 277.68 249.99 227.04 199.11 191.95 160.45 147.89 120.81 105.42 77.38
Market price per share (Rs.) 127.00 120.00 151.00 160.00 183.00 181.00 176.00 160.00 155.40 160.00
Price earnings ratio 3.95 4.08 5.58 6.98 7.82 6.83 5.53 10.09 9.14 7.51
Current ratio (Times) 1.40 1.47 1.38 1.37 1.45 1.47 1.54 1.78 2.33 2.41
Liquidity ratio (Times) 0.93 0.80 0.77 0.70 0.68 0.85 0.79 0.84 1.37 1.31
Figures in brackets indicate deductions.
*Earnings and net assets per share are based on the 29,712,375 shares in issue as at 31st March 2019. Previous years’ figures have accordingly been adjusted.

HAY
CA
RB
PLC
Ann
ual R
epor
t 201
8/19
126
GROUP PROFILE
Incorporation Stated/Share Capital Group Interest Directors
Haycarb PLCManufacturing and Marketing of Activated Carbon
Parent Company A.M. Pandithage (Chairman) H.S.R. Kariyawasan (Managing Director)Dhammika PereraA.M. SenaratnaS.C. Ganegoda
Ms. M.J.A.S. AbeyratneDr. S.A.K. AbayawardanaS. RajapakseM.S.P. Udaya KumaraB. Balaratnarajah
A.A.M. CaderbhoyMs. S.S. RagunathanJ.D. NaylorMs. Yogadinusha Bhaskaran(Alternate Director to Mr. Dhammika Perera)M.H. Jamaldeen
Eurocarb Products Ltd.Distributors of Activated CarbonProducts and Technology in Europe
1986 in UK(Bristol, England)
£ 100,000 100% (Subsidiary) A.M. Pandithage (Chairman)J.D. Naylor (Managing Director)
H.S.R. KariyawasanR. Bittel
Haycarb Holdings Australia (Pty) Ltd.Distributors of Activated CarbonProducts and Technology in Australia
1989 in Australia(Victoria, Australia)
AUD 150,000 100% (Subsidiary) A.M. Pandithage (Chairman) H.S.R. Kariyawasan
Ms. M.J.A.S. AbeyratneM. MarquesB.P.R. Liyanage
Carbokarn Co. Ltd.Manufacture and Sale of Activated Carbon
1993 in Thailand(Bangkok, Thailand)
THB 50,000,000 50% (Subsidiary) A.M. Pandithage (Chairman)P. Karnchanabatr (Managing Director)H.S.R. Kariyawasan
B. KarnchanabatrK. KarnchanabatrY.P.A.S. Pathirathna
Ms. C. KarnchanabatrMs. M.J.A.S. AbeyratneB. BalaratnarajahT. Karnchanabatr
CK Regen Systems Co. Ltd.Regeneration of Spent Carbon
2002 in Thailand(Bangkok, Thailand)
THB 15,000,000 50% (Subsidiary) A.M. Pandithage (Chairman)P. Karnchanabatr (Managing Director)
H.S.R. KariyawasanB. KarnchanabatrK. Karnchanabatr
Y.P.A.S. PathirathnaMs. C. KarnchanabatrMs. M.J.A.S. Abeyratne
Haycarb USA Inc.Distributors of Activated Carbon Products and Technology and Coir Fibre Pith in the USA
1983 in USA(Woodlands, Texas, USA)
USD 1,287,900 100% (Subsidiary) A.M. Pandithage (Chairman)H.S.R. Kariyawasan
Ms. M.J.A.S. AbeyratneY.P.A.S. Pathirathna
A.M. Senaratne
Puritas (Pvt) Ltd.Environmental Engineering
1995 in Sri Lanka Rs. 18,000,000 100% (Subsidiary) A.M. Pandithage (Chairman)H.S.R. Kariyawasan
Ms. M.J.A.S. AbeyratneMs. S.S. RagunathanI.A.S.L. Athukorala
Recogen (Pvt) Ltd.Charcoal Making and Power Generation
1997 in Sri Lanka Rs. 370,000,000 100% (Subsidiary) A.M. Pandithage (Chairman)H.S.R. Kariyawasan
R. De Silva B. Balaratnarajah
PT Mapalus Makawanua Charcoal IndustryManufacture and Sale of Activated Carbon
1985 in Indonesia(Bitung, Indonesia)
IDR. 37,102,000,000 100% (Subsidiary) A.M. Pandithage (President Commissioner)S.C. Ganegoda (Vice-President Commissioner)
H.S.R. Kariyawasan (President Director)B. BalaratnarajahE. Senduk
M.S.P. Udaya KumaraA.A.M. Caderbhoy
Haycarb Holdings Bitung Ltd.Investment
2005 in BritishVirgin Islands
USD 1,400,000 100% (Subsidiary) A.M. Pandithage (Chairman)A.M. Senaratna
H.S.R. KariyawasanMs. M.J.A.S. Abeyratne
Carbotels (Pvt) Ltd.Investor in Tourist Resorts
1991 in Sri Lanka Rs. 368,665,000 25.2% (Associate) A.M. Pandithage (Chairman)S.C. Ganegoda
Ultracarb (Pvt) Ltd.Manufacture and Sale of Value Added Activated Carbon
2010 in Sri Lanka Rs. 250,000,000 100% (Subsidiary) A.M. Pandithage (Chairman)H.S.R. KariyawasanMs. M.J.A.S. Abeyratne
B. BalaratnarajahM.S.P. Udaya KumaraA.A.M. Caderbhoy
S.P. Weerawardane
Lakdiyatha (Pvt) Ltd.Sewage and Wastewater Treatment Plant
2011 in Sri Lanka Rs. 50,000,000 49% (Associate) A.M. PandithageH.S.R. Kariyawasan
Ms. S.S. RagunathanMr. Ashok Parashar
Ms. J.J.J. LerceMr. G.B.M.H. Dourdin
Shizuka Co. Ltd.Manufacture and Sale of Activated Carbon
2012 in Thailand(Ratchaburi Province, Thailand)
THB 20,000,000 50% (Subsidiary) A.M. Pandithage (Chairman)P. Karnchanabatr (Managing Director)H.S.R. Kariyawasan
Y.P.A.S. PathirathnaMs. M.J.A.S. Abeyratne
Ms. C. KarnchanabatrB. KarnchanabatrK. Karnchanabatr
Haycarb Value Added Products (Pvt) Ltd.Manufacture and Sale of Value Added Activated Carbon
2012 in Sri Lanka Rs. 400,000,010 100% (Subsidiary) A.M. Pandithage (Chairman)H.S.R. KariyawasanMs. M.J.A.S. Abeyratne
PT Haycarb Palu MitraManufacture and Sale of Activated Carbon
2012 in Indonesia(Palu, Indonesia)
IDR 20,508,850,000 60% (Subsidiary) J. Yaurai (President Commissioner)Ms. M.J.A.S. Abeyratne (Commissioner)M.S.P. Udaya Kumara (Commissioner)
A.M. Pandithage (President Director)H.S.R. KariyawasanA.A.M. Caderbhoy
B. BalaratnarajahRonnyK.A. Karim
Puricarb (Pte.) Ltd.Engineering Consultancy Services
2014 in Singapore USD 50,001 100% (Subsidiary) A.M. Pandithage (Chairman)H.S.R. Kariyawasan
Ms. M.J.A.S. AbeyratneMs. S.S. Ragunathan
Wong Yong Fei
Haycarb Activated Carbon (Pvt) Ltd.Business Development
2017 in India INR 3,367,970 100% (Subsidiary) A.M. Pandithage (Chairman)H.S.R. KariyawasanA.A.M. Caderbhoy
Ms. M.J.A.S. Abeyratne Elindram Srinivasulu

Annual R
eport 2018/19H
AYCA
RB
PLC
127
Group Profile
Incorporation Stated/Share Capital Group Interest Directors
Haycarb PLCManufacturing and Marketing of Activated Carbon
Parent Company A.M. Pandithage (Chairman) H.S.R. Kariyawasan (Managing Director)Dhammika PereraA.M. SenaratnaS.C. Ganegoda
Ms. M.J.A.S. AbeyratneDr. S.A.K. AbayawardanaS. RajapakseM.S.P. Udaya KumaraB. Balaratnarajah
A.A.M. CaderbhoyMs. S.S. RagunathanJ.D. NaylorMs. Yogadinusha Bhaskaran(Alternate Director to Mr. Dhammika Perera)M.H. Jamaldeen
Eurocarb Products Ltd.Distributors of Activated CarbonProducts and Technology in Europe
1986 in UK(Bristol, England)
£ 100,000 100% (Subsidiary) A.M. Pandithage (Chairman)J.D. Naylor (Managing Director)
H.S.R. KariyawasanR. Bittel
Haycarb Holdings Australia (Pty) Ltd.Distributors of Activated CarbonProducts and Technology in Australia
1989 in Australia(Victoria, Australia)
AUD 150,000 100% (Subsidiary) A.M. Pandithage (Chairman) H.S.R. Kariyawasan
Ms. M.J.A.S. AbeyratneM. MarquesB.P.R. Liyanage
Carbokarn Co. Ltd.Manufacture and Sale of Activated Carbon
1993 in Thailand(Bangkok, Thailand)
THB 50,000,000 50% (Subsidiary) A.M. Pandithage (Chairman)P. Karnchanabatr (Managing Director)H.S.R. Kariyawasan
B. KarnchanabatrK. KarnchanabatrY.P.A.S. Pathirathna
Ms. C. KarnchanabatrMs. M.J.A.S. AbeyratneB. BalaratnarajahT. Karnchanabatr
CK Regen Systems Co. Ltd.Regeneration of Spent Carbon
2002 in Thailand(Bangkok, Thailand)
THB 15,000,000 50% (Subsidiary) A.M. Pandithage (Chairman)P. Karnchanabatr (Managing Director)
H.S.R. KariyawasanB. KarnchanabatrK. Karnchanabatr
Y.P.A.S. PathirathnaMs. C. KarnchanabatrMs. M.J.A.S. Abeyratne
Haycarb USA Inc.Distributors of Activated Carbon Products and Technology and Coir Fibre Pith in the USA
1983 in USA(Woodlands, Texas, USA)
USD 1,287,900 100% (Subsidiary) A.M. Pandithage (Chairman)H.S.R. Kariyawasan
Ms. M.J.A.S. AbeyratneY.P.A.S. Pathirathna
A.M. Senaratne
Puritas (Pvt) Ltd.Environmental Engineering
1995 in Sri Lanka Rs. 18,000,000 100% (Subsidiary) A.M. Pandithage (Chairman)H.S.R. Kariyawasan
Ms. M.J.A.S. AbeyratneMs. S.S. RagunathanI.A.S.L. Athukorala
Recogen (Pvt) Ltd.Charcoal Making and Power Generation
1997 in Sri Lanka Rs. 370,000,000 100% (Subsidiary) A.M. Pandithage (Chairman)H.S.R. Kariyawasan
R. De Silva B. Balaratnarajah
PT Mapalus Makawanua Charcoal IndustryManufacture and Sale of Activated Carbon
1985 in Indonesia(Bitung, Indonesia)
IDR. 37,102,000,000 100% (Subsidiary) A.M. Pandithage (President Commissioner)S.C. Ganegoda (Vice-President Commissioner)
H.S.R. Kariyawasan (President Director)B. BalaratnarajahE. Senduk
M.S.P. Udaya KumaraA.A.M. Caderbhoy
Haycarb Holdings Bitung Ltd.Investment
2005 in BritishVirgin Islands
USD 1,400,000 100% (Subsidiary) A.M. Pandithage (Chairman)A.M. Senaratna
H.S.R. KariyawasanMs. M.J.A.S. Abeyratne
Carbotels (Pvt) Ltd.Investor in Tourist Resorts
1991 in Sri Lanka Rs. 368,665,000 25.2% (Associate) A.M. Pandithage (Chairman)S.C. Ganegoda
Ultracarb (Pvt) Ltd.Manufacture and Sale of Value Added Activated Carbon
2010 in Sri Lanka Rs. 250,000,000 100% (Subsidiary) A.M. Pandithage (Chairman)H.S.R. KariyawasanMs. M.J.A.S. Abeyratne
B. BalaratnarajahM.S.P. Udaya KumaraA.A.M. Caderbhoy
S.P. Weerawardane
Lakdiyatha (Pvt) Ltd.Sewage and Wastewater Treatment Plant
2011 in Sri Lanka Rs. 50,000,000 49% (Associate) A.M. PandithageH.S.R. Kariyawasan
Ms. S.S. RagunathanMr. Ashok Parashar
Ms. J.J.J. LerceMr. G.B.M.H. Dourdin
Shizuka Co. Ltd.Manufacture and Sale of Activated Carbon
2012 in Thailand(Ratchaburi Province, Thailand)
THB 20,000,000 50% (Subsidiary) A.M. Pandithage (Chairman)P. Karnchanabatr (Managing Director)H.S.R. Kariyawasan
Y.P.A.S. PathirathnaMs. M.J.A.S. Abeyratne
Ms. C. KarnchanabatrB. KarnchanabatrK. Karnchanabatr
Haycarb Value Added Products (Pvt) Ltd.Manufacture and Sale of Value Added Activated Carbon
2012 in Sri Lanka Rs. 400,000,010 100% (Subsidiary) A.M. Pandithage (Chairman)H.S.R. KariyawasanMs. M.J.A.S. Abeyratne
PT Haycarb Palu MitraManufacture and Sale of Activated Carbon
2012 in Indonesia(Palu, Indonesia)
IDR 20,508,850,000 60% (Subsidiary) J. Yaurai (President Commissioner)Ms. M.J.A.S. Abeyratne (Commissioner)M.S.P. Udaya Kumara (Commissioner)
A.M. Pandithage (President Director)H.S.R. KariyawasanA.A.M. Caderbhoy
B. BalaratnarajahRonnyK.A. Karim
Puricarb (Pte.) Ltd.Engineering Consultancy Services
2014 in Singapore USD 50,001 100% (Subsidiary) A.M. Pandithage (Chairman)H.S.R. Kariyawasan
Ms. M.J.A.S. AbeyratneMs. S.S. Ragunathan
Wong Yong Fei
Haycarb Activated Carbon (Pvt) Ltd.Business Development
2017 in India INR 3,367,970 100% (Subsidiary) A.M. Pandithage (Chairman)H.S.R. KariyawasanA.A.M. Caderbhoy
Ms. M.J.A.S. Abeyratne Elindram Srinivasulu

HAY
CA
RB
PLC
Ann
ual R
epor
t 201
8/19
128
GLOSSARY
Accounting PoliciesSpecific principles, bases, conventions, rules and practices adopted by an enterprise in preparing and presenting Financial Statements.
BorrowingsBank loans, overdrafts and finance lease obligations.
Capital EmployedTotal assets less interest free liabilities, deferred income and provisions.
Capital ReservesReserves identified for specific purposes and considered not available for distribution.
Cash EquivalentsFor the purpose of cash flow, cash equivalents is defined as liquid investments with original maturities of three months or less net of short-term borrowings.
Contingent LiabilitiesConditions or situations at the reporting date, the financial effect of which are to be determined by future events which may or may not occur.
Current RatioCurrent assets divided by current liabilities.
Deferred TaxationThe tax effect of timing differences deferred to/from other periods, which would only qualify for inclusion on a tax return at a future date.
Dividend PayoutThe dividend payout ratio is the percentage of earnings paid out to shareholders in dividend.
Earnings per ShareProfit attributable to ordinary shareholders divided by the number of ordinary shares in issue and ranking for dividend.
EBITEarnings before interest and tax
EquityShareholders' funds i.e., stated capital and reserves.
Gearing RatioProportion of total interest-bearing borrowing to capital employed.
Gross DividendPortion of profits inclusive of tax withheld distributed to shareholders.
Liquidity RatioCurrent assets less inventories divided by current liabilities. A measure of the Company’s ability to settle its debts as they fall due.
Net Assets per ShareShareholders’ funds divided by the weighted average number of ordinary shares in issue.
Non Controlling InterestEquity in subsidiary not attributable, directly or indirectly, to a parent.
Price Earnings RatioMarket price of a share divided by earnings per share as reported at that date.
Related PartiesParties who could control or significantly influence the financial and operating policies of the business.
Return on Capital Employed (ROCE)Profit before tax and net finance cost divided by average capital employed.
Return on Shareholder EquityAttributable profits divided by average shareholders’ funds.
Revenue ReservesReserves considered as being available for distributions and investments.
SegmentConstituent business units grouped in terms of nature and similarity of operations.
Value AdditionThe quantum of wealth generated by the activities of the Group and its distribution.
Working CapitalCapital required to finance the day-to-day operations (current assets minus current liabilities).
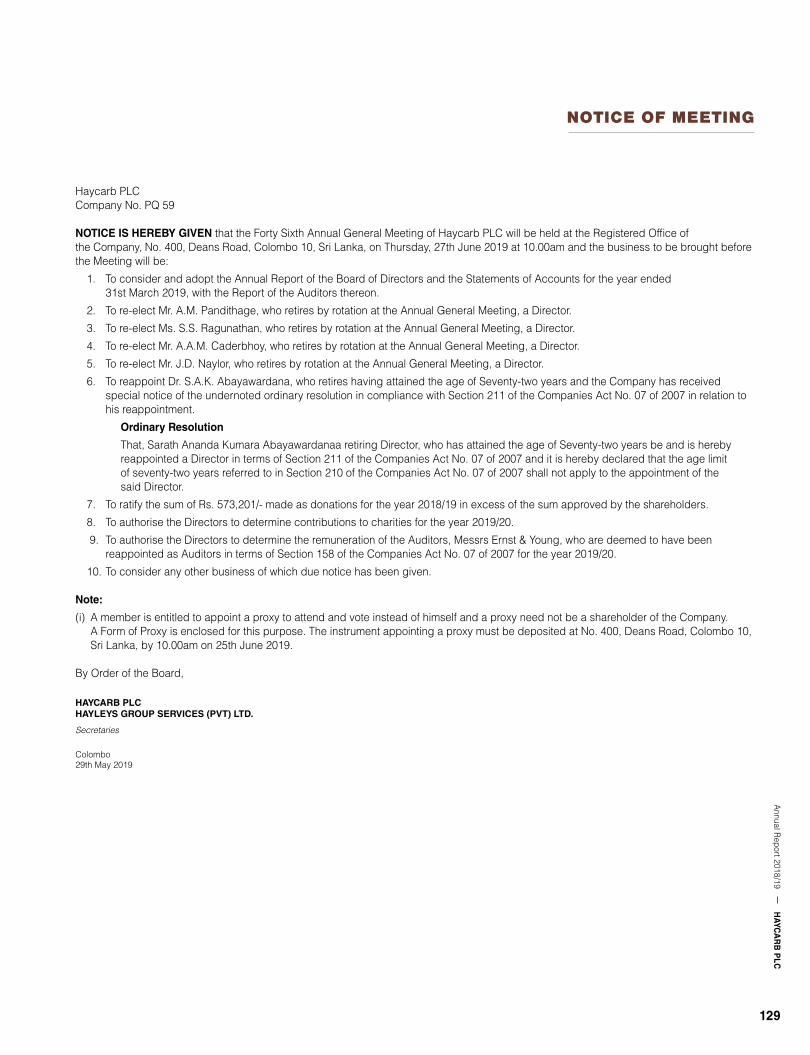
Annual R
eport 2018/19H
AYCA
RB
PLC
129
NOTICE OF MEETING
Haycarb PLCCompany No. PQ 59
NOTICE IS HEREBY GIVEN that the Forty Sixth Annual General Meeting of Haycarb PLC will be held at the Registered Office of the Company, No. 400, Deans Road, Colombo 10, Sri Lanka, on Thursday, 27th June 2019 at 10.00am and the business to be brought before the Meeting will be:
1. To consider and adopt the Annual Report of the Board of Directors and the Statements of Accounts for the year ended 31st March 2019, with the Report of the Auditors thereon.
2. To re-elect Mr. A.M. Pandithage, who retires by rotation at the Annual General Meeting, a Director.
3. To re-elect Ms. S.S. Ragunathan, who retires by rotation at the Annual General Meeting, a Director.
4. To re-elect Mr. A.A.M. Caderbhoy, who retires by rotation at the Annual General Meeting, a Director.
5. To re-elect Mr. J.D. Naylor, who retires by rotation at the Annual General Meeting, a Director.
6. To reappoint Dr. S.A.K. Abayawardana, who retires having attained the age of Seventy-two years and the Company has received special notice of the undernoted ordinary resolution in compliance with Section 211 of the Companies Act No. 07 of 2007 in relation to his reappointment.
Ordinary Resolution
That, Sarath Ananda Kumara Abayawardanaa retiring Director, who has attained the age of Seventy-two years be and is hereby reappointed a Director in terms of Section 211 of the Companies Act No. 07 of 2007 and it is hereby declared that the age limit of seventy-two years referred to in Section 210 of the Companies Act No. 07 of 2007 shall not apply to the appointment of the said Director.
7. To ratify the sum of Rs. 573,201/- made as donations for the year 2018/19 in excess of the sum approved by the shareholders.
8. To authorise the Directors to determine contributions to charities for the year 2019/20.
9. To authorise the Directors to determine the remuneration of the Auditors, Messrs Ernst & Young, who are deemed to have been reappointed as Auditors in terms of Section 158 of the Companies Act No. 07 of 2007 for the year 2019/20.
10. To consider any other business of which due notice has been given.
Note:
(i) A member is entitled to appoint a proxy to attend and vote instead of himself and a proxy need not be a shareholder of the Company. A Form of Proxy is enclosed for this purpose. The instrument appointing a proxy must be deposited at No. 400, Deans Road, Colombo 10, Sri Lanka, by 10.00am on 25th June 2019.
By Order of the Board,
HAYCARB PLC HAYLEYS GROUP SERVICES (PVT) LTD.
Secretaries
Colombo29th May 2019

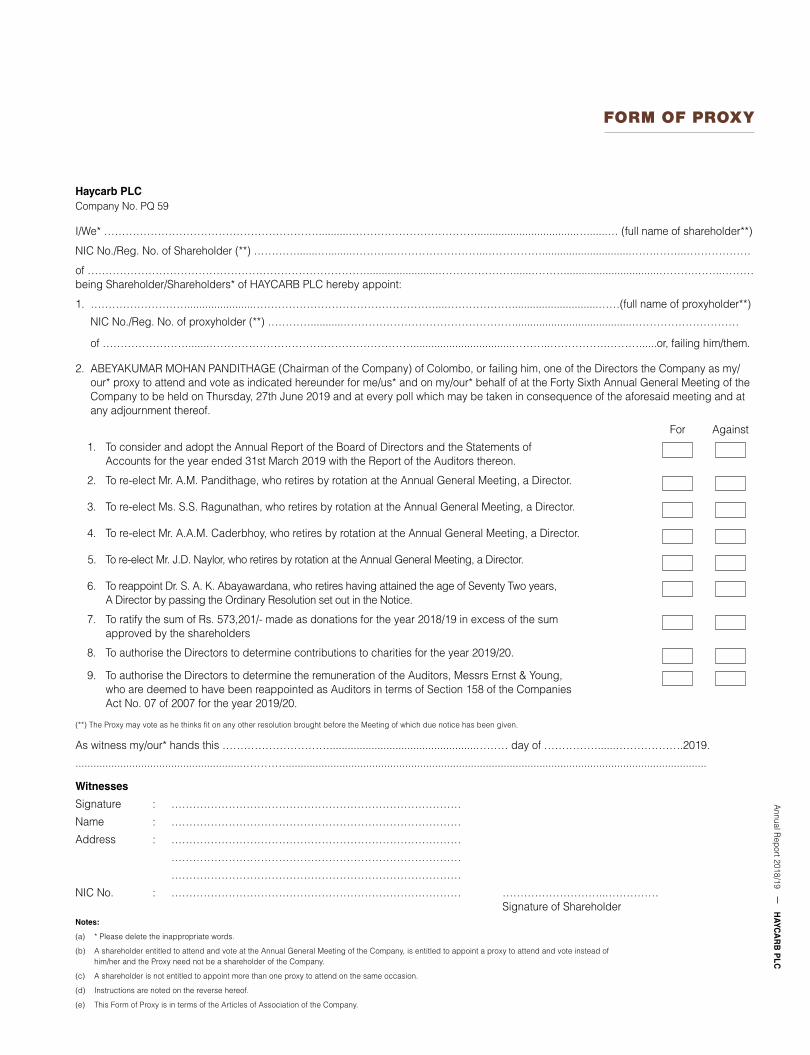
Annual R
eport 2018/19H
AYCA
RB
PLC
FORM OF PROXY
Haycarb PLCCompany No. PQ 59
I/We* ……………………………………………………..........……………………………….................................….......… (full name of shareholder**)
NIC No./Reg. No. of Shareholder (**) ………….......…........………...……………………...……………..............................…….……...………………
of ……………………………………………………………………........................…………………......………................................……….……..………being Shareholder/Shareholders* of HAYCARB PLC hereby appoint:
1. ………………………......................……………………………………………....……………….............................……(full name of proxyholder**)
NIC No./Reg. No. of proxyholder (**) …………...........………………………………………….......................................…………………………
of …………………….......………………………………………………….................................………..…………….………......or, failing him/them.
2. ABEYAKUMAR MOHAN PANDITHAGE (Chairman of the Company) of Colombo, or failing him, one of the Directors the Company as my/our* proxy to attend and vote as indicated hereunder for me/us* and on my/our* behalf of at the Forty Sixth Annual General Meeting of the Company to be held on Thursday, 27th June 2019 and at every poll which may be taken in consequence of the aforesaid meeting and at any adjournment thereof.
For Against
1. To consider and adopt the Annual Report of the Board of Directors and the Statements of Accounts for the year ended 31st March 2019 with the Report of the Auditors thereon.
2. To re-elect Mr. A.M. Pandithage, who retires by rotation at the Annual General Meeting, a Director.
3. To re-elect Ms. S.S. Ragunathan, who retires by rotation at the Annual General Meeting, a Director.
4. To re-elect Mr. A.A.M. Caderbhoy, who retires by rotation at the Annual General Meeting, a Director.
5. To re-elect Mr. J.D. Naylor, who retires by rotation at the Annual General Meeting, a Director.
6. To reappoint Dr. S. A. K. Abayawardana, who retires having attained the age of Seventy Two years, A Director by passing the Ordinary Resolution set out in the Notice.
7. To ratify the sum of Rs. 573,201/- made as donations for the year 2018/19 in excess of the sum approved by the shareholders
8. To authorise the Directors to determine contributions to charities for the year 2019/20.
9. To authorise the Directors to determine the remuneration of the Auditors, Messrs Ernst & Young, who are deemed to have been reappointed as Auditors in terms of Section 158 of the Companies Act No. 07 of 2007 for the year 2019/20.
(**) The Proxy may vote as he thinks fit on any other resolution brought before the Meeting of which due notice has been given.
As witness my/our* hands this ………………………….................................................……… day of ……………......……………….2019.
........................................................………….............................................................................................................................................
Witnesses
Signature : ………………………………………………………………………
Name : ………………………………………………………………………
Address : ………………………………………………………………………
………………………………………………………………………
………………………………………………………………………
NIC No. : ……………………………………………………………………… ………………………..…………… Signature of ShareholderNotes:
(a) * Please delete the inappropriate words.
(b) A shareholder entitled to attend and vote at the Annual General Meeting of the Company, is entitled to appoint a proxy to attend and vote instead of him/her and the Proxy need not be a shareholder of the Company.
(c) A shareholder is not entitled to appoint more than one proxy to attend on the same occasion.
(d) Instructions are noted on the reverse hereof.
(e) This Form of Proxy is in terms of the Articles of Association of the Company.

HAY
CA
RB
PLC
Ann
ual R
epor
t 201
8/19
Form of Proxy
INSTRUCTIONS AS TO COMPLETION:
1. To be valid, the completed Form of Proxy must be deposited with the Company Secretaries, Hayleys Group Services (Pvt) Ltd. at No. 400, Deans Road, Colombo 10, Sri Lanka not less than 48 hours before the start of the Meeting.
2. In perfecting the Form of Proxy, please ensure that all requested details are filled in legibly including mandatory details. Kindly sign and fill in the date of signing.
3. If you wish to appoint a person other than the Chairman of the Company (or failing him, one of the Directors) as your proxy, please insert the relevant details at overleaf. The proxy need not be a member of the Company.
4. Please indicate with an X in the space provided how your proxy is to vote on the resolution. If no indication is given, the proxy in his discretion will vote as he thinks fit. Please also delete (**) if you do not wish your proxy to vote as he thinks fit on any other resolution brought before the Meeting.
5. In the case of a company/corporation the proxy must be under its Common Seal which should be affixed and attested in the manner prescribed by its Articles of Association.
In the case of the individual shareholders, the signature of the shareholder should be witnessed by any person over 18 years of age.
6. Where the Form of Proxy is signed under a Power of Attorney (POA) which has not been registered with the Company, the original POA together with a photocopy of same or a copy certified by a Notary Public must be lodged with the Company along with the Form of Proxy.
In case of Margin Trading Accounts (slash accounts), the Form of Proxy should be signed by the respective authorised Fund Manger/Banker with whom the account is maintained.

Name of CompanyHaycarb PLC
Legal FormA Quoted Public Company with limited liability. Incorporated in Sri Lanka in 1973
Company NumberPQ 59
Stock Exchange ListingThe ordinary shares of the Company are listed with the Colombo Stock Exchange of Sri Lanka
SecretariesHayleys Group Services (Pvt) Ltd.400, Deans Road, Colombo 10, Sri LankaTelephone: +94 11 2627650
Registered Office400, Deans Road, Colombo 10, Sri Lanka.Telephone: +94 11 2627000, 2677364Fax: +94 11 2699630E-mail: [email protected]
BankersBank of CeylonCitibank N.A.Commercial BankDeutsche BankDFCC Vardhana BankHatton National BankHongkong & Shanghai Banking CorporationNations Trust BankNDB BankPan Asia Bank PLCPeople’s BankSampath BankSeylan BankStandard Chartered Bank
AuditorsMessrs Ernst & Young,Chartered Accountants,201, De Saram Place, Colombo 10Sri Lanka
Parent CompanyHayleys PLC
Accounting Year End31st March
CORPORATE INFORMATION
KEY PERFORMANCE INDICATORS
STATEMENT OF INCOME
REVENUE
11,934 11,70613,554
15,518
20,918
(Rs.
mill
ion)
2014/15 2015/16 2016/17 2017/18 2018/19
GROSS PROFIT
2014/15 2015/16 2016/17 2017/18 2018/19
(Rs.
mill
ion)
3,014 2,956 3,163 3,094
4,039
2014/15 2015/16 2016/17 2017/18 2018/19
(%)
25 2523
20 19
GROSS PROFIT MARGIN
(Rs.
mill
ion)
2014/15 2015/16 2016/17 2017/18 2018/19
PROFIT ATTRIBUTABLE TO EQUITY SHAREHOLDERS
695 681804
672
955
RETURN TO SHAREHOLDERS
2014/15 2015/16 2016/17 2017/18 2018/19
(Rs.
)
192
NAV ASSETS PER SHARE
199227
250278
(Rs.
)
2014/15 2015/16 2016/17 2017/18 2018/19
6 6 6 6
8
DPS
2014/15 2015/16 2016/17 2017/18 2018/19
(Rs.
)
EPS
23 2327
23
32
RATIOS
2014/15 2015/16 2016/17 2017/18 2018/19
15 15 1513
12(%)
OVERHEADS COST TO REVENUE RATIO
2014/15 2015/16 2016/17 2017/18 2018/19
15
12 13
9
12(%)
ROCE
GEARING RATIO
2014/15 2015/16 2016/17 2017/18 2018/19
(%)
35
38
35
33
38
CASH FLOWS
CUMULATIVE INVESTMENT IN CAPEX FROM YEAR 2010
(Rs.
mill
ion)
2014/15 2015/16 2016/17 2017/18 2018/19
3,034
3,629
4,4774,801
5,191
OPERATING CASH FLOWS BEFORE WORKING CAPITAL CHANGES
(Rs.
mill
ion)
2014/15 2015/16 2016/17 2017/18 2018/19
1,601 1,7571,907
1,758
2,377
The Financials for 2014/15 presents results for 15 months for some of the subsidiary companies due to transitional adjustments made to comply with Sri Lanka Financial Reporting Standards (SLFRS 10) “Consolidated Financial Statements” – Refer Note 1 of page 13.
The value of values cannot be overstated. In deploying our core values – innovation, technical superiority, customer centricity and environmental consciousness – we were able to build the resilience, strength and stability of the Company, all of which have allowed us to achieve significant growth and performance this year.
The Value of Values
CONTENT
01 Global Presence
02 Strategy
04 Joint Statement from the Chairman and the Managing Director
12 Financial Review16 Corporate Social Responsibility
21 Governance and Compliance
22 Board of Directors24 Management Team25 Corporate Governance44 Annual Report of the Board of Directors on the
Affairs of the Company48 Statement of Directors’ Responsibility49 Related Party Transactions Review
Committee Report50 Audit Committee Report52 Financial Calendar
53 Financial Statements
54 Independent Auditors’ Report58 Income Statement59 Statement of Comprehensive Income60 Statement of Financial Position62 Statement of Changes in Equity64 Statement of Cash Flows66 Notes to the Financial Statements
120 Statement of Group Value Added121 Investor Information124 Ten Year Financial Review126 Group Profile128 Glossary129 Notice of Meeting
Form of ProxyCorporate Information
HAYCARB PLC
Annual Report 2018/19
HA
YC
AR
B P
LC
Annual Report 2018/19
“Better livingthrough Carbon”
Our Vision
Leading edge Activated Carbon Technology for every industry and purpose
“To be the leading global brand for Activated Carbonand foremost provider for Water Purification Systems in Sri Lanka and the Region, renowned for technical excellence, customer centricity, innovation and sustainable business practices”
Haycarb PLC400, Deans Road, Colombo 10, Sri Lanka.Phone: +94 11 262 7000, +84 11 267 7364 (Finance)Fax: +94 11 269 9630E-mail: [email protected]