leading academic change: an early market scan of leading
TRANSCRIPT

WILLIAM E. KIRWAN
CENTER for ACADEMIC INNOVATION
Leading Academic Change: An Early Market Scan of Leading-‐edge
Postsecondary Academic Innovation Centers
MJ Bishop Director, Kirwan Center for Academic Innovation
University System of Maryland
Anne Keehn President and CEO, Quantum Thinking
(formerly Senior Fellow for Technology and Innovation, Post-‐secondary Success Team, BMGF)

1
Background
Academic change is the term being used increasingly to describe universities’ efforts to improve student success by creating optimally effective learning environments that simultaneously increase access, affordability, and quality of higher education for all those who want a postsecondary degree. Institutions are starting to see the vast potential of hybrid classrooms, shared courseware initiatives, open educational resources, competency-‐based education, learning analytics, and adaptive learning environments and they are seeking ways to scale and sustain these innovations.
Among the positive outcomes from these change efforts have been two interesting developments. First, there appears to be an increasing number of institutions that are reconstituting their “faculty development centers” and/or “centers for teaching and learning” to help lead their organizations in transforming and advancing student success through academic innovation and improved support for students and faculty. The second recent development has been what appears to be a sharp increase in the number of senior administrative positions in academic affairs being created over the last 2-‐3 years to lead their institution’s academic change initiatives. These individuals hold titles such as Assistant Provost Office of Academic Innovation, Vice Provost for Innovation in Learning and Student Success, or Associate Provost for Learning Initiatives and are often filled by faculty leaders who have emerged as “change agents” among their colleagues. In some cases, they are managing a complex combination of instructional design and technology staff, faculty development centers, and data analytics units. And, while these individuals may be experts in innovative pedagogies supported by emerging technologies, many seem to be less well versed in the integration of these technologies or the organizational change theories and change management approaches that will be necessary to make innovations scalable and sustainable within their institutions. Individuals filling these newly constituted positions are seeking support networks and professional development opportunities.
It seems we may be observing the emergence of a new, interdisciplinary “innovation infrastructure” within higher education administration. However, little is known beyond anecdotal information about how these changes are being implemented.
Purpose
The purpose of the Leading Academic Change project was, therefore, to begin exploring this trend using a 3-‐pronged approach:
• bring together a cross-‐section of academic innovation leaders to begin the conversation around academic change leadership during a 2-‐day Leading Academic Change Summit;
• conduct Interviews with Innovative Teaching and Learning Centers to learn more about how their centers are functioning and where changes are occurring; and
• based on our findings from the Summit and our interviews, design a National Survey of Campus Centers for Teaching and Learning to explore the larger landscape.
Leading Academic Change Summit
With support from the Bill and Melinda Gates Foundation, the University System of Maryland’s Center for Academic Innovation hosted the inaugural Leading Academic Change Summit on December 2nd and

2
3rd, 2014. The Summit brought together more than 60 academic innovation leaders, representing 2-‐ and 4-‐year public and private colleges, universities, and systems as well as other guests from ACE, APLU, EDUCAUSE, Ithaka S+R, NASH, and NASPA. Invitees were selected based on the knowledge and experience of the project directors in consultation with other experts both at the USM Center for Academic Innovation and the Bill and Melinda Gates Foundation.
The highly interactive 2-‐day conference was a rare and exciting opportunity for this diverse group of higher education leaders to engage in discussions around how academic transformation efforts are unfolding on their campuses, explore common challenges, and identify promising practices. Among the learnings from the Summit discussions and the pre-‐/post-‐conference surveys were:
Almost all of the participants (94%) have been in their position 6 years or less and more than half (59%) for 3 years or less.
Most (85%) have college/university faculty experience.
0%
2%
3%
35%
60%
20+ years
10-‐20 years
6-‐10 years
3-‐6 years
Less than 3 years
How long have you been in your current role?
37%
11%
3%
48%
31%
25%
85%
Other (please specify)
K-‐12 Faculty
Learning Science
Instrucional Design
Informaion Technology
Business/Industry
College Faculty
In which of the following areas do you have prior experience?

3
More than three quarters (78%) report to the Provost/Academic Affairs VP (as compared with IT/CIO, chancellor/president, or student affairs).
Navigating “institutional culture” is among the biggest challenges these leaders’ encounter (equal to “lack of resources”).
They are eager to learn more about theories and strategies for faculty engagement, boundary spanning, and organizational/cultural change. The top 3 reasons for attending the Summit (all 97% agreed or strongly agreed) were:
• Seeking ideas or inspiration to help them in their job.
• Advancing their thinking about leading academic change at their institution.
• Making/strengthening bonds with people who will help them do their jobs.
Ninety-‐seven percent of participants reported they thought the Summit was a good use of their time, and 50% of those stated that it was, in fact, a “much more valuable use of my time than what I probably would have done otherwise.”
11%
5%
2%
2%
11%
30%
30%
4%
5%
Other (please specify)
Unclear direcives
Lack of infrastructure
Lack of strategy
Fear of change
Resources (money, people)
Insituional culture
Leadership support
Faculty support
What is the single biggest challenge in your current role?
A very valuable use of my ime.
A good use of my ime.
With 20:20 hindsight, I might not akend.
Was aIending the Summit a good use of your Jme?

4
When asked about the specific ways they felt they benefited from the Summit, participants’ top responses included making connections and mutual support.
Much of the conversation at the Summit seemed to confirm that these academic change leaders are eager to have interactions with colleagues for networking, inspiration, and collaboration, but existing networks and membership organizations are not sufficiently addressing their needs. Participants also confirmed the need for a new network in their survey responses, with nearly 77% confirming that there would be value in developing this new network.
Overall, Summit participants left energized and with a new sense of focus. Additionally, there continues to be interaction and communication among the attendees including the formation of at least one northeast regional group that is exploring collaborations around faculty teaching and learning innovation grants.
0% 10% 20% 30% 40% 50% 60% 70% 80% 90% 100%
Collaboraion
Mutual support
Connecions
Professional Growth
Ideas/Inspiraion
In what specific ways did you benefit from aIending the Summit?
Strongly agree Agree Neither agree nor disagree Disagree Strongly disagree
Yes
Not sure
No
Do you see any value in conJnuing this network?

5
Interviews with Innovative Teaching and Learning Centers
Also as part of the project, in October 2014 we engaged the services of Cynthia Jennings of The Black Bear Group to conduct in-‐depth interviews with a total of 17 particularly innovative academic transformation leaders to talk about the evolution of the teaching and learning centers at their institutions. The interview protocol and the list of targeted institutions were derived by the project directors in consultation with Ms. Jennings and experts at the USM’s Center for Academic Innovation and the Gates Foundation. Interviewees included representatives from a variety of institution types, including public and private, 2-‐year and 4-‐year, research intensive and liberal arts, as well as one public higher education state system. Interviews were conducted between November 2014 and early January 2015.
Key Findings
Revisioning and Reorganizing:
What used to be “centers for teaching and learning” are taking on much broader responsibilities and roles across campus, necessitating revisioning and reorganization. While the models institutions pursue still vary quite a bit, some themes do seem to be emerging from these particularly innovative efforts.
For example, Stanford, the University of Maryland, and Purdue University have all recently completely reorganized and moved several functions –including their teaching and learning center– under a new Vice Provost for Teaching and Learning or similarly named position. Similarly, UT-‐Austin recently merged the university’s Continuing and Innovative Education unit into the Center for Teaching and Learning, creating a new kind of campus infrastructure for teaching and learning that includes both on-‐campus and off-‐campus academic innovations. At the University of Georgia, these mergers are breaking down political and budgetary boundaries that have existed in the past and prevented the kinds of collaborations needed to truly impact teaching and learning.
Another traditional boundary that appears to be getting increasingly fuzzy is that between academic and student affairs. Many “pedagogy centers” are also beginning to look at topics like student health and well-‐being and other student success areas. In some cases, like LaGuardia Community College, we are seeing the total merger of academic affairs and student affairs under the Provost.
But as new organizational structures are emerging, sometimes boundaries can be difficult to establish and/or maintain. In some cases, boundaries are blurred because institutions have retained their “legacy” structures. For example, the University of Connecticut has retained their Institute for Teaching and Learning while also having recently started a Center for Excellence in Teaching and Learning. The former is serving largely as their instructional technology unit now. Similarly, Georgetown has both a Center for New Designs and Learning and Scholarship (CNDLS), which focuses on teaching and learning, and the recently created “Red House,” which serves as an innovation incubator with a student success focus. These units along with the Center for Technology Innovation, the Center for Teaching Excellence, and the Center for Assessment Analytics and for Research are working in close collaboration to assure that they are all part of the conversation.
Collaboratives:
In fact, regardless of the organizational changes, most these efforts involve strong collaborations among various units on campus, including the library, instructional technology, facilities, and the like. Purdue’s

6
center, for example, works very collaboratively, assigning “teams” to work with faculty on course transformation under their IMPACT program. American University also draws heavily upon collaborations with student affairs in programming on diversity and inclusion and their open educational resource initiatives.
Because most academic change units are in the tricky position of not being able to dictate change from the top down, several of these centers are exploring a “shared services model.” UT-‐Austin’s center, for example, works hard to “empower and facilitate structure” rather than impose strategies. In their center redesign, UT-‐Austin has made substantial changes aimed at giving resources directly to the leading faculty innovators on campus, essentially “deputizing” these leaders through the Provost’s Teaching Fellows program.
Student Involvement:
As the focus shifts from faculty success to thinking more about student success, many of these centers are involving students more directly in the work. For example, LaGuardia Community College actually employs students to help train the faculty. Stanford also works very closely with students. In fact, under the Stanford center’s umbrella are also student learning resources, the tutoring programs, the academic skills and coaching programs, the student resilience programs, and graduate teaching development.
Technology’s Role:
Technology is often not the leading focus of most of these efforts, but rather viewed as a tool to potentially help achieve desired outcomes. UT-‐Austin, for example, has created an Associate Vice Provost for Learning Sciences position that oversees a Learning Sciences group that includes faculty developers, digital content developers, technologists, and a unified learning analytics infrastructure. Duke’s center, which is the only one among the 17 that reports up through the library, works very hard to take faculty who come in wanting to test a new technology and get them thinking, instead, about transforming their course. This is also true for Carnegie Mellon’s Eberly Center, which grounds any technical solutions in the desired learning outcomes.
National Survey of Campus Centers for Teaching and Learning
In November 2014 we engaged the services of Kenneth C. Green of The Campus Computing Project to work with us on the distribution and statistical analysis of the first known national survey of campus teaching and learning centers. Survey items were designed and developed from our preliminary findings from the Summit and the interviews. We also sought the help of a variety of higher education experts from POD, the USM Center for Academic Innovation, and other experts at the Gates Foundation including Anne Keehn (grantor), Senior Fellow for Technology and Innovation and part of the Postsecondary Success Team, as well as Rahim Rajan and Greg Ratliff, both Senior Program Officers, Postsecondary Success, and Jason Palmer, Deputy Director, Postsecondary Success. See Appendix 7 for the entire survey with data tables.
Given that there is no definitive “list” of U.S. higher education teaching and learning centers and/or their directors, we decided to employ an “open survey” approach. We invited those center directors we did know to respond while, at the same time, circulating the survey to the memberships of various technology-‐and-‐pedagogy-‐oriented higher education professional organizations with a request to
7
participate or to pass on the link to an appropriate respondent. These open requests for participation went to various listservs at EDUCAUSE (the CIO, ELI, Blending Learning, Small Colleges, and Community Colleges lists), the Online Learning Consortium (OLC), the Council on Libraries and Information Resources (CLIR), and other professional organizations. We also received support from POD, NISOD, and the TLT Group to promote the survey with their members.
The survey was distributed in January 2015. In total, 163 center heads/directors responded, fairly evenly distributed among public/private, 4-‐ and 2-‐year, research and comprehensive. While we were pleased with the participation level and the diversity of institutions represented given the difficulty in locating the centers and their directors, there are over 4000 colleges and universities in the U.S. and many more than 163 are likely to have teaching and learning centers. The findings reported below should, therefore, be considered to be illustrative, but not definitive.
Key Findings
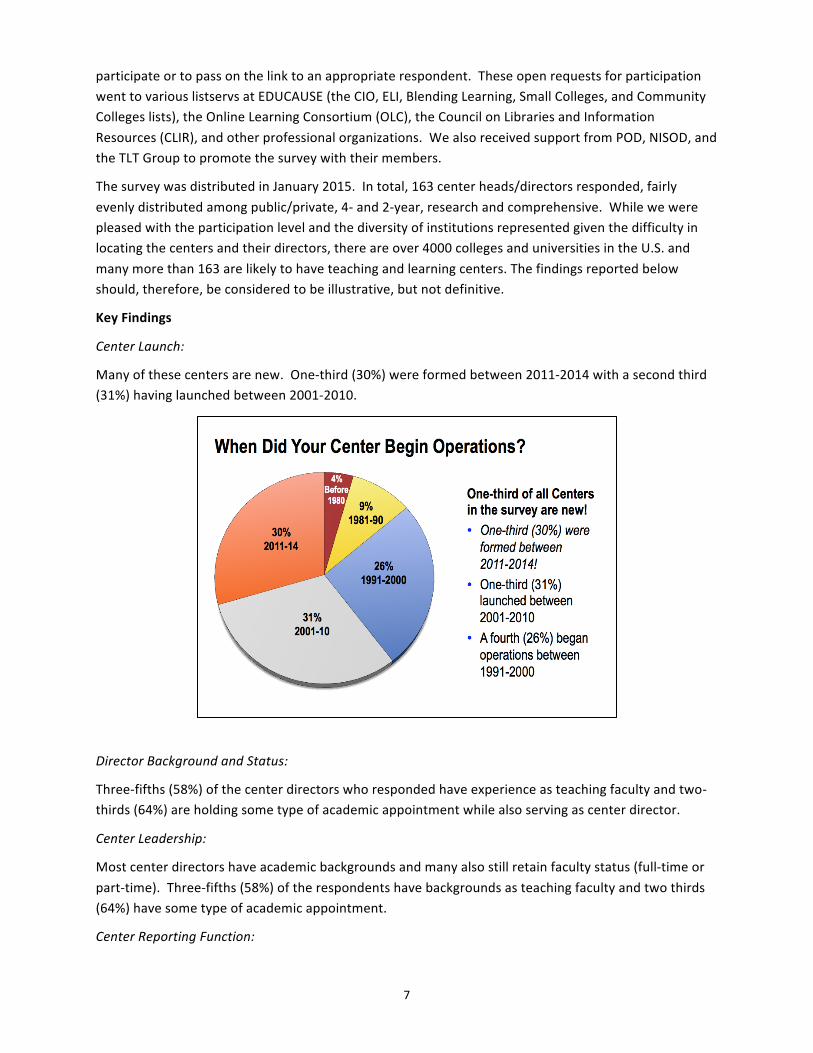
Center Launch:
Many of these centers are new. One-‐third (30%) were formed between 2011-‐2014 with a second third (31%) having launched between 2001-‐2010.
Director Background and Status:
Three-‐fifths (58%) of the center directors who responded have experience as teaching faculty and two-‐thirds (64%) are holding some type of academic appointment while also serving as center director.
Center Leadership:
Most center directors have academic backgrounds and many also still retain faculty status (full-‐time or part-‐time). Three-‐fifths (58%) of the respondents have backgrounds as teaching faculty and two thirds (64%) have some type of academic appointment.
Center Reporting Function:

8
Most centers (81%) report up through the Provost or Academic Affairs Office. The remainder report to the CIO (6%), the library (2%) or “other” units such as a special learning or innovation office (10%).
Changing Mission and Reporting Functions:
Most of the centers have recently experienced a change in mission, with almost 60% of the center director respondents reporting either that their center’s mission has changed in the past 2 years or is likely to change within the next 2 years. Similarly, more than one-‐third of the responding centers have either recently undergone a reporting function change or anticipate one within the next two years.
Number of Centers on Campus:
Nearly half of all respondents reported their campuses have two or more similar centers supporting the institution’s instructional mission.
Budgets and Staff:
While the majority of respondents indicated their budget has experienced little or no change over the last 2 years, the good news is that only one-‐fifth have experienced budget cuts and a third benefited from budget increases. However, there are big variations within sectors, with public institutions’ centers generally seeing less modest budget growth than their private counterparts. Perhaps not surprisingly, larger universities have larger compliments of center staff than smaller institutions (approximately 10 as compared to 3-‐5) and also make greater use of student workers.

9
Center Priorities:
Center directors who responded indicated that their primary foci are on faculty engagement with students, course design/redesign (online/hybrid and face-‐to-‐face), and leveraging instructional/learning platforms for instruction. Other technologies and approaches such as adaptive, analytics, open educational resources, courseware, e-‐portfolios, competency-‐based learning, and badging were all rated as far lower priorities. This finding may also be reflected in the responding center directors’ surprisingly low awareness or familiarity with third-‐party digital content providers.

10
Usage:
According to the center directors, pre-‐tenured, full-‐time faculty are the primary users of these centers. While lower numbers of engagement for tenured and part-‐time faculty may not be particularly surprising, it is disappointing to see that respondents reported very little use by graduate and undergraduate students. When asked what disciplines tend to make more use of the center, respondents indicated the highest levels of engagement come from the social sciences, STEM fields, and health sciences. The least engaged disciplines are business and education. Also, according to the responses, it seems the primary uses that faculty are making of the center resources and services are professional development for teaching and instructional design help.

11
Effectiveness and Impact:
Given faculty usage it is, perhaps, not surprising that the directors rate “improving teaching skills” and providing course redesign support as the most effective services their centers offer. When asked about their center’s impact, the directors indicated they thought they were having a modest positive impact on learning transformation and student success. When asked about the one thing their center could do better, the responses included engagement beyond full-‐time pretenure faculty, communication about services, and use of assessment (both to assess faculty progress and to assess the Center’s work).

12
Outreach Strategies:
Directors are using a variety of strategies to encourage use of center resources –everything from financial and course release incentives to changes in promotion and tenure policies. Among those strategies rated most effective were departmental outreach and financial incentives. Least effective were efforts to promote learning science research (evidence), funding to present at pedagogy conferences, and providing professional accreditation support to the program.
This was the first known attempt to do a broad survey of teaching and learning center directors and we received a good deal of positive feedback from respondents for making this effort to reach out to them and learn more about their experiences. Overall, the survey results demonstrate the clear need to engage faculty in the work of academic innovation and illustrate some of the difficulties involved in doing so. The findings suggest the importance of supporting these teaching and learning center directors’ efforts through stronger engagement with academic department as well as better messaging from the Provost around the importance of these centers as a key strategy to promote innovation. Additionally, training for center directors in how to manage change and affect organizational culture was among the top responses participants volunteered when asked “what key issues did we miss in the survey?”
Summary and Conclusion
There was a surprising amount of consistency in the data that we collected across this three-‐pronged project, all of which does seem to point to the emergence of a new, interdisciplinary innovation infrastructure within higher education administration. Overwhelmingly, this transformation is most apparent within Academic Affairs units, which may mark a shift in thinking about the role academic affairs can and should play in institutional efforts to increase effectiveness and affordability, particularly in relation to student success. And, increasingly, these efforts are taking on a highly collaborative tone, busting traditional higher education silos in order to progress and, in some cases, even bringing multiple units together under one “umbrella” position.
13
Centers for teaching and learning are clearly evolving at the same time, often providing the underlying structure necessary to support academic change more broadly. These centers’ missions are shifting from a reactive “faculty development” focus to a more proactive “teaching and learning transformation” focus. Student success, not just faculty success, is now a priority for most. And, as part of this mission shift, these centers’ responsibilities are expanding to include program and curricular redesign, “next generation digital learning,” assessment and analytics, facilities and use of instructional space, as well as advising and other student success initiatives.
Given their background and expertise, the individuals charged with leading academic change appear to be respected if, perhaps, somewhat isolated advocates. Their biggest challenge is changing the institutional culture, but they may not be particularly well trained for the task or well supported in that role. In addition to lacking the evidence they need to demonstrate benefits to faculty for innovations, they face the continuing challenge of building strong alliances with academic departments.
This is a time of transformational and, perhaps, disruptive change in higher education. Public and private colleges and universities increasingly face calls for more transparent accountability, evidence of return on investment, and creative solutions to difficult problems including budget constraints, rising costs, and stagnant completion rates. Additionally, the changing character of our students in terms of their preparation, prior experiences, motivation, culture, age, and expectations of our institutions challenges us to seek new pedagogical models that capitalize on recent findings from the learning sciences as well as the capabilities of emerging technologies. As a result of these pressures, our higher education institutions are responding by creating a new, interdisciplinary “innovation infrastructure.”
This project has taken the first steps to shed some light on how these organizational changes are being implemented and who these new academic innovation leaders are. But clearly there is more work to be done to support these leaders’ efforts to affect change within their institutions.

14
Appendix 01: Leading Academic Change Summit Participating Institutions
Institution Type
American University Private, R1
Arizona State University Public
Austin Peay State University Public, comp
Bowie State University (USM) Public, HBU
Broward College 2-‐year
California Institute of Technology Public
California State University System Public, system
Capella University Private, online
Carnegie Mellon University Private, R1
Central New Mexico Community College
2-‐year
Chattanooga State Community College
2-‐year
City Colleges of Chicago 2-‐year
College of New Jersey Public, comp
Coppin State University (USM) Public, HBU
Cornell University Private, R1
CUNY Public
Dartmouth Private, R1
Duke University Private, R1
Eckerd College Private
Essex County College 2-‐year
Florida Virtual Campus Public
Frostburg State University (USM) Public, comp
Gateway Technical College (WI) 2-‐year
George Mason University Public
George Washington University Private
Georgetown University Private, R1
Georgia State University Public
Guilford Technical Community College
2-‐year
Guttman Community College 2-‐year
Howard Community College (MD) 2-‐year
Institution Type
Kentucky Community and Technical College System (KCTCS)
2-‐year
LaGuardia Community College, CUNY
2-‐year
Lake Area Technical Institute 2-‐year
Massachusetts Institute of Technology
Private
Miami Dade Community College 2-‐year
Minnesota State Colleges and Universities
Public
Montana University System Public
Montgomery County Community College (PA)
2-‐year
Ocean County College 2-‐year
Penn State Public, R1
Portland State University Public
Purdue University Public, R1
Richard Stockton College of New Jersey
Public, comp
Rio Salado College 2-‐year, online
Salisbury State University (USM) Public, comp
San Francisco State University Public
Santa Barbara City College 2-‐year
Shippensburg University Public, comp
Sinclair Community College 2-‐year
St Petersburg College Public
Stanford Universty Private, R1
Stony Brook University Public, comp
SUNY Empire State College Public
SUNY Office of the Provost Public, system
Tennessee Board of Regents Public, system
The University of Texas System Public, system
Tidewater Community College 2-‐year

15
Institution Type
Tidewater Community College (VA)
2-‐year
Towson University Public, comp
Universities at Shady Grove (USM) Public, reg cntr
University of Arkansas System Public, system
University of Baltimore (USM) Public, comp
University of California at Davis Public
University of California Los Angeles
Public
University of Central Florida Public
University of Central Oklahoma Public
University of Connecticut Public, R1
University of Florida Public, R1
University of Georgia Public, R1
University of Maryland, Baltimore (USM)
Public, R1
University of Maryland, Baltimore County (USM)
Public, R1
University of Maryland, College Park
Public, R1
University of Maryland, Eastern Shore (USM)
Public, HBU
University of Maryland, University College (USM)
Public, online
University of Massachusetts, Boston
Public
Institution Type
University of Michigan Public, R1
University of Michigan, CRLT Public
University of North Carolina System
Public, system
University of Notre Dame Private
University of Southern California Public, R1
University of Texas at Arlington Public
University of Texas at Austin Public, R1
University of Texas System Public, system
University of the Pacific Private
University of West Florida Public, comp
University of Wisconsin System Public, system
University of Wisconsin-‐Extension’s Continuing Education
Public, R1
University System of Georgia Public, system
University System of Hawaii Public
University System of MD Hagerstown (USM)
Public, reg cntr
Utah System of Higher Education Public
Vanderbilt University Private, R1
Virginia Tech Public, R1
Walla Walla Community College 2-‐year
West Virginia University Public, R1
Western Governor’s University Private

16
Appendix 02: Evolution of T&L Centers -‐-‐ Interview Protocol
Our hypotheses:
There is an increasing number of institutions that are reconstituting their Faculty Development Centers and/or Centers for Teaching & Learning to help lead their organizations in transforming and advancing student success through improved teaching and learning.
The changes appear to include the following:
1. Infrastructure reorganization that takes these centers out of library and/or IT focused units of the institution and moves them into academic affairs and under the supervision of the Provost.
2. Efforts to move long-‐time, well-‐respected faculty into administrative/ leadership roles within these Centers and/or within the Provost’s office to oversee these Centers (along with other direct reports such as instructional technology and learner analytics).
3. Tighter alignment and collaboration with what used to be called “student success” programs and initiatives in Student Affairs.
4. A new leadership role has been created and reports to the Provost and/or President
Questions:
1. What is the name of your Center/Institute? Your official title? Who do you report to?
2. Where is your Center/Institute housed within the overall organizational structure? In academic affairs? Information technology?
3. When was your Center/Institute created?
4. What is the background of your Center’s director? Academic/Faculty? Staff? (If not talking to Center director, get name and title).
5. How would you gauge the level of faculty participation in the programs/services offered by the Center?
a. What sorts of strategies do you use to encourage different faculty to engage with the Center’s programs/services so that you’re not always just “preaching to the choir?”
b. What do you perceive are the barriers or levers for increasing faculty use of the Center/Institute?
6. To what extent does your Center collaborate with the other units on campus that are critical to its mission? (So, for example, if Center is housed in IT to what extent does it collaborate with academic affairs and vice versa?)
7. If you had to pick one thing (program, approach, strategy) that stands out for you as being particularly innovative about your Center/Institute, what would it be?
8. In what ways, if any, has the mission/focus of the Center’s efforts changed over the last few years?
9. On a scale of 1-‐5 (with 1 being “not at all a priority” and 5 being “top priority”), what are the sorts of initiatives that your Center/Institute is focusing on right now:

17
a. Course/program redesign
b. Competency-‐based learning
c. Learner/learning analytics
d. Open Educational Resources
e. Adaptive learning
f. Faculty engagement with students (high-‐impact practices)
g. Badging
h. Prior learning assessment
i. Use of e-‐portfolios
j. Other?
10. To what extent have you seen other institutions shift the focus/mission of their faculty development/T&L centers and how?
11. Has your budget increased over the years? Staff size increased/decreased?
12. Are there Centers that you consider exemplars? Who have changed their model (s) of support for Faculty and Students in teaching & learning?
13. What conferences do you attend for knowledge and professional development in your Center leadership role?
14. If there were to be a National Summit and/or a network of your peers, would you find this valuable to attend/join? If so, why?
15. Is there someone else you think we should be talking with to get the answers to these questions?

18
Appendix 03: Evolution of T&L Centers Interview Participating Centers
1) American University, Center for Teaching, Research, and Learning
2) Carnegie Mellon University, Eberly Center for Teaching Excellence
3) Dartmouth College, Center for the Advancement of Learning
4) Duke University, Center for Instructional Technology
5) Franklin and Marshall College, The F&M Faculty Center
6) Georgetown University, Center for New Designs in Learning and Scholarship
7) LaGuardia Community College, LaGuardia Center for Teaching and Learning
8) Purdue University, Center for Instructional Excellence
9) Stanford University, Center for Teaching and Learning / Teaching Commons
10) Towson University, Office of Academic Innovation
11) Vanderbilt University, Vanderbilt Institute for Digital Learning
12) West Virginia University, Teaching and Learning Commons
13) University of Connecticut, Center for Excellence in Teaching and Learning
14) University of Georgia, Center for Teaching and Learning
15) University of Maryland College Park, Teaching and Learning Transformation Center
16) University of Texas -‐ Austin, Center for Teaching and Learning
17) University of Texas System, Institute for Transformative Learning

19
Appendix 04: Survey Data Tables See next page.

The 2015 National Survey of Campus Centers for Teaching and LearningSponsored by Center for Academic Innovation, University System of Maryland with financial support from the Bill and Melinda Gates Foundation
Prepared by Casey Green, The Campus Computing Project - 1 -
unless otherwise indicated, all data are for percentages (%)ALL
INSTITUTIONSPublic
UniversityPublic
MAPublic
Two-YearPrivate
UniversityPrivate
MAPrivate
BAFor-
Profit Number of respondents 171* 39 30 26 20 30 20 5
Yes 99 100 100 96 100 100 100 80No 1 0 0 4 0 0 0 20Don't know
Q3. Are you the head or director (senior officer) of the Center? (percentages)No 4 3 0 12 0 3 0 40Yes 96 97 100 88 100 97 100 60
The data presented below are for only the head or director of a campus Center.
Academic Affairs / Provost 81 76 66 87 90 86 90 67Information Technology / CIO 6 11 10 0 5 7 0 0Library 2 0 3 4 5 0 0 33Student Affairs 0 0 0 0 0 0 0 0Other 10 13 21 9 0 7 10 0
Q5: When did the Center begin operations (year)?1961 - 1980 4 13 3 0 0 0 5 01981 - 1990 9 16 7 25 11 0 0 01991 - 2000 26 32 34 15 42 14 15 02001 - 2010 31 24 34 30 32 41 25 332011 - present 30 16 21 30 16 45 55 67
This Center is the only such unit on campus 45 26 48 70 40 45 50 100This Center is the primary unit for these resources and services, but there are others, often linked to 48 66 45 26 55 48 45 0 academic programs or other campus units.This Center is one of several similar units on campus, but none is the primary campus center for these services. 6 8 7 4 5 7 5 0Don't know 1 0 0 0 0 0 0 0
No: No other institutional title 21 26 31 22 25 21 0 0Yes: I have a regular (tenure-track) faculty appointment 43 39 41 30 40 45 70 0Yes: I have an appointment as adjunct or affiliate faculty 21 29 14 22 25 21 10 33Yes: I have another staff / administrative appointment in addition to the position of Center director 15 5 14 26 10 14 20 67
Teaching faculty 58 39 62 52 55 66 90 33Research faculty 7 8 3 0 20 7 5 0Staff / administration 28 37 28 39 25 21 5 67Other 7 16 7 9 0 7 0 0
Q9: Has the mission for the Center changed in the past two years?No, the mission has not changed 71 70 62 70 65 79 75 100Yes, the mission has changed 29 30 38 30 35 21 25 0
Q10: Will the mission for the Center change in the next two years?No 70 61 69 74 60 79 85 33Yes 30 39 31 26 40 21 15 67
12 16 17 9 25 7 0 --
No 75 82 72 70 70 76 80 67Yes 25 18 28 30 30 24 20 33
No 88 89 83 96 90 83 95 100Yes 12 11 17 4 10 17 5 0
3 0 7 0 5 4 0 --
Q1: What is the name of your college or university? (open ended response)
Calculated: percentage of Center directors who report that the Center mission has changed in the past two yeae that also expect the mission will change again in the next two years.
Calculated: percentage of Center directors who indicate that the Center reporting function has changed in the past two years who also expect the reporting function will change again in the next two years.
* Note: 171 institutions completed the online questionnaire, including just one public baccalaureate college. The data for that one public BA institution are not presented separately in these data tables.
Q11: Have the organizational reporting arrangements for the Center changed in the past two years?
Q2. My Institution has a Campus Center for Teaching and Learning, Professional Development, or Academic Transformation that supports faculty and students in using educational technologies and innovative practices for teaching and learning. (percentages)
Q6: Is your Center the only such unit on the campus or others that offer similar instructional support and professional development services?
Q4: Reporting structure for the institution's Center: To what office does the Center report?
Q7: As the Center head or director, do you also have another institutional appointment?
Q8: As the Center head or director, which description below characterizes your background?
Q12: Will the organizational reporting arrangements for the Center change in the next two years?

The 2015 National Survey of Campus Centers for Teaching and LearningSponsored by Center for Academic Innovation, University System of Maryland with financial support from the Bill and Melinda Gates Foundation
Prepared by Casey Green, The Campus Computing Project - 2 -
unless otherwise indicated, all data are for percentages (%)ALL
INSTITUTIONSPublic
UniversityPublic
MAPublic
Two-YearPrivate
UniversityPrivate
MAPrivate
BAFor-
Profit Q13: Annual Center Budget for Academic Year 2014-15 Average budget 522,507$ 1,116,854$ 355,708$ 276,605$ 1,097,148$ 129,194$ 71,086$ 60,010$ Median budget 137,000$ 650,000$ 100,000$ 65,000$ 700,000$ 65,000$ 35,000$ 60,000$
Significant increase: up 8 percent or more 15 8 7 9 30 29 15 0Modest increase: up 3-7 percent 17 27 17 13 5 7 15 67Little change: plus or minus 2 percent 51 51 52 48 55 46 60 33Modest decrease: down 3-7 percent 9 3 14 17 5 11 5 0Significant decrease: down 8 percent or more 9 11 10 13 5 7 5 0
Professional staff who provide services to faculty / students 6.4 10.6 4.1 3.5 9.4 7.2 2.2 2.0Faculty fellows 2.4 4.2 1.8 2.6 3.7 1.2 0.8 3.0Administrative support staff 2.3 2.3 1.2 1.7 3.2 4.6 0.8 0.7Student workers (including graduate students) who support / assist the activities of the professional staff 5.5 9.4 3.3 0.2 12.3 2.0 7.1 0.0Student workers who support / assist administrative staff 1.2 1.8 0.8 0.5 2.8 1.1 0.7 0.3
Full-time faculty 38 38 38 49 28 38 38 12not applicable to my center 3 3 10 0 0 0 0 0
Part-time faculty 24 24 31 24 25 17 19 24not applicable to my center 13 13 10 0 15 10 35 0
Academic staff 15 13 22 18 16 11 11 2not applicable to my center 33 29 35 26 20 38 45 33
Graduate students 20 22 21 0 24 14 5 3not applicable to my center 52 5 59 78 30 66 95 67
Undergraduates 18 15 21 9 37 11 26 5not applicable to my center 63 61 66 65 65 55 65 67
mean scores (scale: 1=low priority; 7=high priorty)Course / program development or redesign for on-campus courses 5.4 5.5 5.4 4.9 5.8 5.3 5.4 4.7Course / program development or redesign for blended / hybrid courses 5.1 5.4 5.2 5.3 5.5 5.4 3.4 6.3Course / program development or redesign for fully online courses 4.5 4.7 5.2 5.4 4.4 4.3 2.2 6.3Competency-based learning 3.1 3.6 2.8 3.5 3.1 3.0 2.4 3.7Adaptive learning technologies 3.4 4.0 3.4 3.9 2.8 3.1 3.4 2.0Use of third-party digital courseware 3.1 3.1 2.8 3.3 3.2 3.5 2.9 4.3Digital textbooks and course materials 3.1 3.4 3.1 4.0 2.6 3.0 2.5 4.7Learner / learning analytics 3.7 4.2 3.6 4.0 3.7 3.6 3.3 3.7Open Educational Resources (OER) 3.2 3.1 3.4 4.1 3.2 3.0 2.8 2.0Faculty engagement with students (high impact practices) 6.2 6.3 6.3 6.2 6.3 6.4 6.1 5.7Digital Badging 2.2 2.6 2.4 2.6 1.9 2.0 1.5 1.7Assessment of prior learning 3.4 3.3 3.0 3.1 3.3 3.9 4.0 2.0Use of ePortfolios 3.4 3.3 3.3 3.1 3.4 3.8 3.2 3.7Gaming and simulations 2.7 3.1 2.5 2.7 2.9 2.7 2.4 2.0Leveraging Cloud platforms for instruction,(LMS, learning platforms, etc.) 4.6 4.2 4.8 4.8 4.9 5.6 3.5 5.0Classroom / learning spaces design 4.3 4.6 4.1 4.1 4.9 4.3 3.6 5.0Improving academic advising 3.2 3.0 2.5 3.1 2.4 3.9 4.2 4.7
percent reporting low priority (score of 1 or 2)Course / program development or redesign for on-campus courses 9 5 10 13 0 14 15 0Course / program development or redesign for blended / hybrid courses 12 5 17 9 5 7 35 0Course / program development or redesign for fully online courses 25 16 21 4 20 25 75 0Competency-based learning 50 39 59 35 55 50 68 33Adaptive learning technologies 38 22 38 22 58 50 42 67Use of third-party digital courseware 44 44 52 39 47 33 50 33Digital textbooks and course materials 41 31 41 22 55 46 60 0Learner / learning analytics 30 19 35 26 25 31 45 33Open Educational Resources (OER) 40 38 31 32 45 43 50 67Faculty engagement with students (high impact practices) 3 3 3 0 0 3 5 0Digital Badging 67 58 62 55 75 75 84 67Assessment of prior learning 33 36 41 39 25 25 20 67Use of ePortfolios 37 39 35 50 40 32 32 33Gaming and simulations 53 41 66 57 35 54 58 100Leveraging Cloud platforms for instruction, (LMS, learning platforms) 24 30 21 22 15 12 45 0Classroom / learning spaces design 25 22 32 17 10 29 40 0Improving academic advising 46 54 59 55 47 36 25 0
percent reporting high priority (score of 6 or 7)Course / program development or redesign for on-campus courses 57 68 55 39 60 57 65 0Course / program development or redesign for blended / hybrid courses 51 57 59 48 60 54 20 67Course / program development or redesign for fully online courses 42 38 66 48 40 36 15 67Competency-based learning 13 17 10 17 10 11 11 0Adaptive learning technologies 19 28 21 17 11 7 32 0Use of third-party digital courseware 11 14 10 4 5 15 10 67Digital textbooks and course materials 9 11 10 22 5 4 0 33Learner / learning analytics 17 22 17 17 15 14 15 33
Q14: How has the operating budget for the Center changed over the past two years?
Q15. Average head-count of key groups of personnel at the Center (number)
Q16. Best estimate of the proportion (%) of the institution's faculty and students who made use of the Center's resources and services during the fall term, 2014?
Q17. How would you characterize the current priority of the following initiatives and activities for your Center?

The 2015 National Survey of Campus Centers for Teaching and LearningSponsored by Center for Academic Innovation, University System of Maryland with financial support from the Bill and Melinda Gates Foundation
Prepared by Casey Green, The Campus Computing Project - 3 -
unless otherwise indicated, all data are for percentages (%)ALL
INSTITUTIONSPublic
UniversityPublic
MAPublic
Two-YearPrivate
UniversityPrivate
MAPrivate
BAFor-
Profit percent reporting high priority (score of 6 or 7) continued
Open Educational Resources (OER) 12 11 10 32 15 4 5 0Faculty engagement with students (high impact practices) 81 84 83 78 75 86 75 67Digital Badging 3 8 3 5 0 0 0 0Assessment of prior learning 13 17 7 9 5 21 15 0Use of ePortfolios 15 14 7 14 20 25 11 33Gaming and simulations 4 14 3 0 0 0 0 0Leveraging Cloud platforms for instruction,(LMS, learning platforms, etc.) 46 43 48 48 40 73 20 33Classroom / learning spaces design 34 43 39 17 40 36 25 33Improving academic advising 17 16 3 14 0 32 35 33
Q18: Which Center resources and services are most used by faculty? Mean score (scale: 1=least used; 7=most used)
Instructional design services 5.2 5.4 5.3 5.5 5.1 4.9 4.5 5.3Learning science research and support 3.7 3.8 3.9 2.6 3.7 4.2 4.1 3.3Course / program development or redesign for on-campus courses 5.2 5.4 4.8 5.0 5.6 5.4 5.0 4.0Course / program development or redesign for blended / hybrid courses 5.0 5.5 4.9 5.2 5.0 5.0 3.6 7.0Course / program development or redesign for fully online courses 4.7 4.5 5.3 5.5 4.2 4.0 3.7 5.7Media production (graphics, video, interactive simulations) 3.7 4.1 4.4 3.5 3.5 3.1 3.2 3.7Teaching assistants 3.9 4.7 2.0 1.5 4.9 3.3 2.2 .Evaluation support for courses and programs 4.3 4.8 4.7 3.5 4.1 4.9 3.6 3.0Library support 3.2 2.4 3.2 3.4 3.6 3.5 3.3 3.0Professional development 6.0 5.9 6.2 6.4 5.6 6.0 5.8 5.3Opportunity to experiment with new technology resources 5.2 4.9 5.3 5.2 5.4 5.0 5.4 6.0Improving teaching skills 6.1 6.3 5.9 5.9 6.5 6.0 6.5 5.7
Percent Reporting Least Used Center services (scale score of 1 or 2)Instructional design services 8 5 10 4 5 11 16 0Learning science research and support 24 18 17 48 35 14 20 33Course / program development or redesign for on-campus courses 7 3 14 4 5 7 10 0Course / program development or redesign for blended / hybrid courses 9 3 14 4 5 7 30 0Course / program development or redesign for fully online courses 15 13 11 9 25 25 10 0Media production (graphics, video, interactive simulations) 21 16 14 22 30 25 25 33Teaching assistants 11 11 17 9 5 4 21 0Evaluation support for courses and programs 14 18 4 26 15 4 16 33Library support 18 26 10 17 15 14 20 33Professional development 1 0 0 0 5 0 0 33Opportunity to experiment with new technology resources 8 16 3 9 5 7 5 0Improving teaching skills 3 3 4 4 0 3 0 0
Percent Reporting Most Used Center Services (scale score of 6 or 7)Instructional design services 41 45 48 48 30 43 26 33Learning science research and support 15 8 21 9 20 18 20 0Course / program development or redesign for on-campus courses 47 54 35 44 55 57 40 33Course / program development or redesign for blended / hybrid courses 43 57 41 48 50 32 15 100Course / program development or redesign for fully online courses 37 34 54 61 30 29 5 67Media production (graphics, video, interactive simulations) 14 21 24 9 15 0 10 0Teaching assistants 9 26 0 0 20 0 0 0Evaluation support for courses and programs 22 42 25 4 15 29 0 0Library support 6 0 7 4 10 7 10 0Professional development 71 68 76 78 60 72 65 67Opportunity to experiment with new technology resources 46 42 48 52 50 39 45 67Improving teaching skills 76 90 68 65 84 69 80 67
Mean score (scale: 1=not effective; 7=very effective)Instructional design services 5.6 5.9 6.1 5.7 5.5 5.2 4.9 5.3Learning science research and support 4.3 4.7 4.6 3.6 4.4 4.4 4.0 3.7Course / program development or redesign for on-campus courses 5.6 5.9 5.3 5.6 5.6 5.6 5.2 5.7Course / program development or redesign for blended / hybrid courses 5.2 5.6 5.4 5.7 5.3 4.8 4.1 6.3Course / program development or redesign for fully online courses 5.2 5.0 6.0 5.7 4.8 4.8 4.3 6.0Media production (graphics, video, interactive simulations) 4.5 4.9 5.0 4.1 4.6 3.4 4.0 5.7Teaching assistants 4.8 5.4 3.2 . 5.4 4.0 3.2 .Evaluation support for courses and programs 4.8 5.4 4.5 3.9 5.5 4.9 4.5 3.3Library support 4.0 3.5 3.6 4.3 4.4 4.3 3.7 6.0Professional development 5.7 5.7 5.9 6.0 6.1 5.5 5.3 5.0Opportunity to experiment with new technology resources 5.2 5.2 5.2 5.3 5.6 5.1 5.2 5.7Improving teaching skills 5.9 6.1 5.8 5.7 6.1 5.9 5.7 4.3
Percent Reporting Not Effective Resource/Service (scale score 1 or 2)Instructional design services 3 0 0 0 5 4 10 0Learning science research and support 16 11 11 26 32 7 20 0Course / program development or redesign for on-campus courses 3 0 4 0 10 4 5 0Course / program development or redesign for blended / hybrid courses 4 0 0 0 10 4 10 0Course / program development or redesign for fully online courses 8 11 4 4 15 8 5 0Media production (graphics, video, interactive simulations) 12 8 11 17 10 19 5 0Teaching assistants 5 6 7 0 5 4 10 0Evaluation support for courses and programs 8 6 11 14 0 8 10 33Library support 9 11 7 9 10 8 10 0Professional development 1 0 0 0 5 4 0 0Opportunity to experiment with new technology resources 8 11 4 13 5 7 5 0Improving teaching skills 3 0 4 0 5 4 0 33
Q19: How would you rate the effectiveness of the resources and services your Center provides to faculty?

The 2015 National Survey of Campus Centers for Teaching and LearningSponsored by Center for Academic Innovation, University System of Maryland with financial support from the Bill and Melinda Gates Foundation
Prepared by Casey Green, The Campus Computing Project - 4 -
unless otherwise indicated, all data are for percentages (%)ALL
INSTITUTIONSPublic
UniversityPublic
MAPublic
Two-YearPrivate
UniversityPrivate
MAPrivate
BAFor-
Profit Percent Reporting Very Effective Center Resource/Service (scale score 6 or 7)
Instructional design services 51 56 63 52 45 48 35 67Learning science research and support 26 25 33 9 42 29 20 0Course / program development or redesign for on-campus courses 61 67 54 61 75 67 45 67Course / program development or redesign for blended / hybrid courses 46 58 43 57 60 41 5 100Course / program development or redesign for fully online courses 40 42 57 61 35 31 5 67Media production (graphics, video, interactive simulations) 23 31 33 30 15 8 10 67Teaching assistants 12 37 0 0 30 0 0 0Evaluation support for courses and programs 31 56 21 5 40 31 25 0Library support 10 6 7 17 15 8 10 33Professional development 61 60 64 70 75 57 42 33Opportunity to experiment with new technology resources 44 42 32 61 60 48 30 33Improving teaching skills 69 80 71 57 84 67 55 33
Percent not applicable Financial incentives to individual faculty 29 32 21 44 25 30 20 33Financial incentives to academic programs / departments 73 61 76 73 85 75 75 67Course release time for faculty during the academic year 57 53 62 44 60 68 60 0Course release time for faculty during the summer months 70 64 71 57 75 71 95 33Changes to promotion and tenure policies that encourage teaching innovation 49 49 48 57 55 45 50 0Embedding support staff in academic units 68 51 83 65 55 82 80 33Use of learning science research to improve student learning 22 14 21 30 15 29 30 0Support to present at teaching / pedagogical conferences 20 17 29 5 20 24 20 0Support with accreditation requirements of professional programs 39 38 43 22 25 43 58 67Outreach to division and department chairs 8 14 4 0 10 14 5 0
Percent reporting not effective outreach strategies (scale score 1 or 2)Financial incentives to individual faculty 8 5 7 9 10 11 5 0Financial incentives to academic programs / departments 8 6 10 9 5 11 5 0Course release time for faculty during the academic year 10 22 7 9 0 11 5 0Course release time for faculty during the summer months 10 19 4 13 0 11 5 33Changes to promotion and tenure policies that encourage teaching innovation 10 19 7 4 10 7 10 0Embedding support staff in academic units 10 14 10 13 0 7 15 0Use of learning science research to improve student learning 19 11 21 22 20 21 20 33Support to present at teaching / pedagogical conferences 16 19 4 27 15 21 10 0Support with accreditation requirements of professional programs 13 19 7 26 5 14 5 0Outreach to division and department chairs 11 3 11 9 15 11 16 33
Percent reporting very effective outreach strategies (scale score 6 or 7)Financial incentives to individual faculty 31 43 31 22 25 22 35 33Financial incentives to academic programs / departments 7 19 10 0 0 4 0 0Course release time for faculty during the academic year 13 11 10 13 10 11 20 33Course release time for faculty during the summer months 6 11 7 9 0 7 0 0Changes to promotion and tenure policies that encourage teaching innovation 10 5 10 9 5 21 5 33Embedding support staff in academic units 7 14 0 4 15 7 0 0Use of learning science research to improve student learning 13 16 11 13 15 11 10 0Support to present at teaching / pedagogical conferences 20 14 18 27 30 17 20 0Support with accreditation requirements of professional programs 17 19 21 13 20 18 11 0Outreach to division and department chairs 33 35 32 44 40 29 21 33
Mean score (scale: 1=low engagement; 7=high engagement)Faculty, in general 4.7 4.7 4.7 4.5 4.8 4.8 4.7 4.3Tenured faculty 4.3 4.3 4.0 4.3 4.5 4.5 4.1 5.0Pretenured faculty 5.3 5.1 5.6 5.3 5.1 5.4 5.6 6.0Part-time faculty 3.7 3.5 4.0 4.3 3.9 3.4 3.1 5.0Faculty in the Arts & Humanities 4.6 4.8 4.7 4.5 4.2 4.7 4.5 5.5Faculty in Business / Management 3.8 3.6 4.0 4.0 3.6 3.8 3.6 6.0Faculty in Education 3.8 3.8 3.3 4.0 3.2 4.5 3.4 5.5Faculty in the Health Sciences 4.9 5.1 5.2 4.8 4.8 4.7 4.6 5.0Faculty in the Sciences / STEM fields 4.7 5.0 4.3 4.5 5.2 4.6 4.7 4.0Faculty in the Social Sciences 4.9 5.1 4.9 4.5 4.8 5.0 4.7 4.7
Percent reporting low engagement (scale score of 1 or 2)Faculty, in general 4 5 4 4 5 3 0 0Tenured faculty 11 14 18 9 5 11 10 0Pretenured faculty 1 0 0 0 0 0 5 0Part-time faculty 26 36 21 9 25 35 26 0Faculty in the Arts & Humanities 10 6 11 4 15 21 0 0Faculty in Business / Management 24 28 30 22 20 21 25 0Faculty in Education 24 28 44 13 25 11 25 0Faculty in the Health Sciences 6 3 4 9 5 14 0 0Faculty in the Sciences / STEM fields 8 6 11 9 10 10 5 0Faculty in the Social Sciences 4 0 4 9 5 4 0 33
Q21: How would you assess the level of engagement of various faculty groups with the programs / services offered by your Center?
Q20: Strategies the institution uses to encourage faculty across all disciplines and ranks to use the Center's programs and services?

The 2015 National Survey of Campus Centers for Teaching and LearningSponsored by Center for Academic Innovation, University System of Maryland with financial support from the Bill and Melinda Gates Foundation
Prepared by Casey Green, The Campus Computing Project - 5 -
unless otherwise indicated, all data are for percentages (%)ALL
INSTITUTIONSPublic
UniversityPublic
MAPublic
Two-YearPrivate
UniversityPrivate
MAPrivate
BAFor-
Profit Percent reporting high engagement (scale score of 6 or 7)
Faculty, in general 23 16 29 17 20 35 15 33Tenured faculty 18 14 18 22 20 21 15 0Pretenured faculty 43 31 54 30 40 50 60 33Part-time faculty 15 11 14 17 20 17 5 33Faculty in the Arts & Humanities 29 31 33 17 20 35 26 33Faculty in Business / Management 16 8 22 17 5 18 15 67Faculty in Education 17 14 22 13 0 29 10 33Faculty in the Health Sciences 30 31 39 39 25 35 15 0Faculty in the Sciences / STEM fields 32 37 15 30 50 35 25 0Faculty in the Social Sciences 33 34 33 22 35 39 20 67
Percent not applicable Academic Affairs 1 0 0 0 0 0 0 0Information Technology 1 0 0 0 0 0 0 0The Library 1 0 0 0 0 0 5 33Student academic support services 7 3 14 9 5 3 10 0Academic advising 15 13 21 4 15 14 30 0Developmental education 49 53 52 4 65 57 63 33Student affairs 12 8 17 13 15 7 20 0Institutional research 12 3 14 9 5 21 25 33Academic programs in the Arts & Humanities 9 3 7 13 5 17 10 33Academic programs in Business / Management 16 8 10 13 15 21 30 33Academic programs in Education 21 3 14 39 25 24 32 33Academic programs in the Health Sciences 24 14 21 13 30 17 53 67Academic programs in the Sciences / STEM fields 8 3 7 13 0 14 5 33Academic programs in the Social Sciences 9 3 7 13 5 17 10 0
Percent reporting no/little collaboration (scale score 1 or 2)Academic Affairs 4 0 0 9 0 7 5 33Information Technology 4 0 7 0 5 7 5 0The Library 8 8 14 4 5 11 5 0Student academic support services 17 18 10 9 20 21 20 33Academic advising 22 32 21 26 30 14 5 33Developmental education 12 21 7 17 0 4 21 33Student affairs 33 34 24 26 20 43 45 67Institutional research 24 29 14 17 30 14 35 33Academic programs in the Arts & Humanities 12 8 21 4 16 14 15 0Academic programs in Business / Management 21 25 31 9 20 10 30 0Academic programs in Education 20 22 39 9 20 7 26 0Academic programs in the Health Sciences 11 11 14 9 10 10 11 0Academic programs in the Sciences / STEM fields 8 5 14 4 5 7 15 0Academic programs in the Social Sciences 11 8 17 13 5 3 15 33
Perecent reporting significant collaboration (scale score 6 or 7)Academic Affairs 73 84 79 70 75 61 70 0Information Technology 70 79 66 87 80 64 55 0The Library 44 37 55 44 55 41 37 33Student academic support services 24 21 21 30 10 31 35 0Academic advising 20 16 10 17 15 39 25 0Developmental education 13 8 7 30 15 11 16 0Student affairs 12 8 10 13 25 7 15 0Institutional research 21 26 28 22 15 14 15 33Academic programs in the Arts & Humanities 28 41 14 30 26 28 15 67Academic programs in Business / Management 22 22 21 30 15 17 20 67Academic programs in Education 19 17 11 22 20 31 11 33Academic programs in the Health Sciences 29 32 10 44 40 28 21 33Academic programs in the Sciences / STEM fields 35 46 14 39 55 31 25 33Academic programs in the Social Sciences 26 31 14 30 25 28 20 67
Percent who agree/strongly agree The Center serves as an effective catalyst for a significant learning transformation in teaching and learning 71 73 62 70 85 68 70 67Serves as a positive catalyst for modest improvements in teaching and learning. 92 89 97 91 90 90 95 100The Center touches a large group of faculty and serves them well 61 71 52 36 80 69 55 33The Center touches only a small group of faculty but serves them well 54 50 57 57 50 48 65 100The Center serves as an effective catalyst for a significant transformation in overall student success. 45 56 33 52 42 43 40 33The Center serves as a positive catalyst for a modest improvement in overall student success. 70 69 78 70 53 82 60 100The Center's activities and services are well known and widely respected on campus 81 87 93 65 90 76 70 67
Q22: To what extent does your Center collaborate with other units at your institution?
Q23: As you think about the role, mission, and effectiveness of your Center, do you agree or disagree with the descriptions below about the impact of the Center’s activities at your institution?
The 2015 National Survey of Campus Centers for Teaching and LearningSponsored by Center for Academic Innovation, University System of Maryland with financial support from the Bill and Melinda Gates Foundation
Prepared by Casey Green, The Campus Computing Project - 6 -
unless otherwise indicated, all data are for percentages (%)ALL
INSTITUTIONSPublic
UniversityPublic
MAPublic
Two-YearPrivate
UniversityPrivate
MAPrivate
BAFor-
Profit
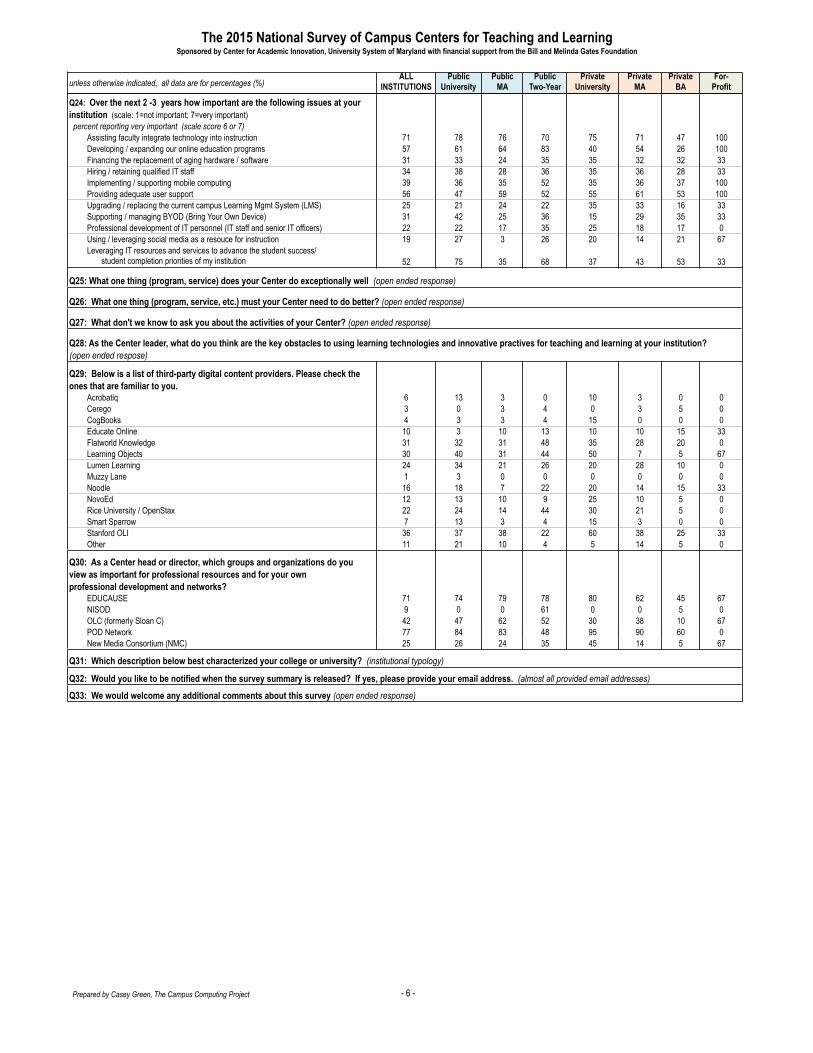
percent reporting very important (scale score 6 or 7)Assisting faculty integrate technology into instruction 71 78 76 70 75 71 47 100Developing / expanding our online education programs 57 61 64 83 40 54 26 100Financing the replacement of aging hardware / software 31 33 24 35 35 32 32 33Hiring / retaining qualified IT staff 34 38 28 36 35 36 28 33Implementing / supporting mobile computing 39 36 35 52 35 36 37 100Providing adequate user support 56 47 59 52 55 61 53 100Upgrading / replacing the current campus Learning Mgmt System (LMS) 25 21 24 22 35 33 16 33Supporting / managing BYOD (Bring Your Own Device) 31 42 25 36 15 29 35 33Professional development of IT personnel (IT staff and senior IT officers) 22 22 17 35 25 18 17 0Using / leveraging social media as a resouce for instruction 19 27 3 26 20 14 21 67Leveraging IT resources and services to advance the student success/ student completion priorities of my institution 52 75 35 68 37 43 53 33
Acrobatiq 6 13 3 0 10 3 0 0Cerego 3 0 3 4 0 3 5 0CogBooks 4 3 3 4 15 0 0 0Educate Online 10 3 10 13 10 10 15 33Flatworld Knowledge 31 32 31 48 35 28 20 0Learning Objects 30 40 31 44 50 7 5 67Lumen Learning 24 34 21 26 20 28 10 0Muzzy Lane 1 3 0 0 0 0 0 0Noodle 16 18 7 22 20 14 15 33NovoEd 12 13 10 9 25 10 5 0Rice University / OpenStax 22 24 14 44 30 21 5 0Smart Sparrow 7 13 3 4 15 3 0 0Stanford OLI 36 37 38 22 60 38 25 33Other 11 21 10 4 5 14 5 0
EDUCAUSE 71 74 79 78 80 62 45 67NISOD 9 0 0 61 0 0 5 0OLC (formerly Sloan C) 42 47 62 52 30 38 10 67POD Network 77 84 83 48 95 90 60 0New Media Consortium (NMC) 25 26 24 35 45 14 5 67
Q31: Which description below best characterized your college or university? (institutional typology)
Q32: Would you like to be notified when the survey summary is released? If yes, please provide your email address. (almost all provided email addresses)
Q33: We would welcome any additional comments about this survey (open ended response)
Q30: As a Center head or director, which groups and organizations do you view as important for professional resources and for your own professional development and networks?
Q29: Below is a list of third-party digital content providers. Please check the ones that are familiar to you.
Q24: Over the next 2 -3 years how important are the following issues at your institution (scale: 1=not important; 7=very important)
Q25: What one thing (program, service) does your Center do exceptionally well (open ended response)
Q26: What one thing (program, service, etc.) must your Center need to do better? (open ended response)
Q27: What don't we know to ask you about the activities of your Center? (open ended response)
Q28: As the Center leader, what do you think are the key obstacles to using learning technologies and innovative practives for teaching and learning at your institution? (open ended respose)

20
Appendix 05: Institutions Participating in Survey Albion College American University Anderson University Arizona Western College Asian University for Women Austin Community College Azusa Pacific University Bacone College Barton College Bates College Bucknell University Bucks County Community College Cal Poly State University, San Luis Obispo California Lutheran University California State Polytechnic University, Pomona Cambridge College Case Western Reserve University Chapman University Cleveland State University Colby College County College of Morris CUNY-‐ Manhattan Community College CUNY -‐ School of Professional Studies Dartmouth College Davidson College Dean College Denison University DePauw University Des Moines University Duke University EAFIT University Eastern Kentucky University Edison Community College Edison State Community College Elon University
GateWay Community College George Brown College The George Washington University Georgia Perimeter College Georgia Regents University Grand View University Green Mountain College Grinnell College Heritage University Hiroshima University Howard University Illinois Central College Indiana university south bend Iowa State University James Madison University Johns Hopkins University Lake Forest College Lee College Lehigh University Lincoln College Marylhurst University McGill University Mesa Community College Messiah College Michigan Technological University Middle Tennessee State University Minneapolis Community and Technical College Missouri State University Molloy College Montgomery College Montgomery County Community College Moraine Valley Community College Morehead State University Muhlenberg College New York Institute of Technology
Niagara College of Applied Arts and Technologies North Carolina A&T State University North Central State College Northeastern Illinois University Northern Illinois University Northern Michigan University Northwestern Michigan College Northwestern University Oakland University The Ohio State University Otis College of Art and Design Otterbein University Pace University Pacific Lutheran University Park University Philadelphia University Phoenix College Pine Technical & Community College Providence College Regent University Rhode Island School of Design Rhodes College Rollins College The Sage Colleges Saint Louis University Saint Mary's College of California San Juan College Scottsdale Community College Seattle University Southern Illinois University Carbondale Southern Methodist University Spelman College Spelman College St. Louis College of Pharmacy SUNY-‐ Buffalo State College SUNY-‐ College at Brockport SUNY -‐ Purchase College

21
Stevenson University Stonehill College Suffolk University Temple University Tennessee State University Texas A&M University -‐ Central Texas Texas Tech University Thomas Jefferson University Trinity University Tufts University University of Alaska Anchorage University of Arkansas University of California, Irvine University of California, Riverside University of Central Arkansas University of Central Florida University of Cincinnati University of Colorado, Boulder University of Connecticut University of Dayton
University of Georgia University of Hawaii University of the Incarnate Word University of Maryland, Baltimore County (UMBC) University of Massachusetts, Amherst University of Michigan University of Nebraska at Omaha University of New Mexico University of North Carolina, Asheville University of North Florida University of North Texas University of Notre Dame University of Pittsburgh University of Pretoria (South Africa) University of Puget Sound University of Rhode Island University of San Diego University of the South University of South Dakota University of South Florida
The University of Texas at Brownsville University of Trinidad & Tobago University of Utah University of Washington University of West Florida University of West Georgia University of Wisconsin, Eau Claire University of Wisconsin System Utah Valley University Valdosta State University Valencia College Vanderbilt University Washington University in St. Louis Weber State University Western Carolina University Western Washington University Winona State University Yale School of Management Yale University