leadership: a personnel economics approachwaysinternational.com/leadership.pdf · production...
TRANSCRIPT

NBER WORKING PAPER SERIES
LEADERSHIP: A PERSONNEL ECONOMICS APPROACH
Edward P. Lazear
Working Paper 15918http://www.nber.org/papers/w15918
NATIONAL BUREAU OF ECONOMIC RESEARCH1050 Massachusetts Avenue
Cambridge, MA 02138April 2010
I gratefully acknowledge comments by my colleagues at Stanford University and the able researchassistance of Nicholas Obradovich. The views expressed herein are those of the author and do notnecessarily reflect the views of the National Bureau of Economic Research.
© 2010 by Edward P. Lazear. All rights reserved. Short sections of text, not to exceed two paragraphs,may be quoted without explicit permission provided that full credit, including © notice, is given tothe source.

Leadership: A Personnel Economics ApproachEdward P. LazearNBER Working Paper No. 15918April 2010JEL No. J0
ABSTRACT
A theory of leadership is proposed and tested. Leaders are characterized as those who have the abilityto choose the right direction more frequently than their peers. The theory implies that leaders tendto be more able, place themselves in visible decision making situations more frequently, and are generalists.Also, the most able leaders should be found in the highest variance industries, where decision makinghas the greatest payoff. The theory is tested using data on Stanford business school alumni and isconfirmed. Leaders are generalists rather than specialists, both innately and in their pattern of skillacquisition.
Edward P. LazearGraduate School of Businessand Hoover InstitutionStanford UniversityStanford, CA 94305and [email protected]
Edward P. Lazear Leadership: A Personnel Economics Approach
1In the economics literature, a well-known paper on style and leadership is Rotembergand Saloner (1993), where leaders can choose to be autocratic leaders or those who empathizewith their employees, depending on the rate of innovation.
Another example from outside the economics literature of how leadership style andapproach can affect productivity is provided by O’Reilly and Chathman (1984).
1
The topic of “leadership” has received an increasing amount of attention in the business
world, as reflected in the business press and in the curricula of top business schools. Most
recognize that it is important to be able to discuss leadership in a coherent manner. There is a
significant literature on this subject in organizational behavior. Three review articles that cover
many of the papers (over 300 independent papers referenced) are Barrow (1977), Yukl (1989),
and House and Aditya (1997).
The papers summarized generally fall into a few categories. First, there are those that
describe the traits of leadership, listing the characteristics that lead to being in a leadership
position. This paper will do that as well, but will focus on a trait not usually emphasized in the
past, namely having a wide variety of skills in many different areas. Other papers concentrate on
describing type of leadership, sometimes whether a leader focuses on motivational leadership or
whether choice of task is the more central role. Frequently called the “behavioral” approach,
these papers analyze the actual behavior that can make ascribed to leaders.1 A third set of papers
examines leadership effectiveness and discusses the variables that make a leader most effective.
Fourth are normative leadership papers, which discuss what leaders should do to satisfy
particular criteria (private, social, organizational). Fifth, some papers delineate the
environmental situations in which leaders can be effective and those in which they cannot. Sixth

Edward P. Lazear Leadership: A Personnel Economics Approach
2
are papers that try to determine the amount of power that a leader has. Finally, some papers
classify leaders into those who influence major changes in attitudes and assumptions of the
organization and into those who go beyond, being “charismatic,” meaning that the leader
possesses a gift (perhaps divinely inspired) that is unique and which gives the leader
unquestioned authority.
The approaches described above cover virtually every aspect of leadership and are rich in
description and breadth. Their shortfall, to the extent that there is one, is that the literature does
not lend itself well to the type of scientific analysis and proof that could add additional insight
into our understanding of the area. The best evidence of this deficiency is that business schools
still struggle to offer a well-developed leadership curriculum, even though there is great demand
for training leaders in our top schools. In what follows, an attempt is made to strip down the
problem of leadership to its basics, to provide a model that produces testable implications, and to
present some evidence from a data set of individuals, many of whom have become successful
leaders.
The view presented is that leaders are individuals who confront new situations often and
choose the right direction in a high proportion of cases. Leaders also have the ability to identify
situations where their skills will be needed and to do this frequently in a public setting. As a
result of their success in choosing direction, and because the success is observable to others,
leaders acquire followers who turn to the leaders for guidance in new and ambiguous situations.
Individuals follow those who make correct decisions for a variety of reasons, the most direct of
which is that they will boost their own probabilities of being correct by mimicking the decisions

Edward P. Lazear Leadership: A Personnel Economics Approach
2Hermalin (1998) points out that choosing to follow is voluntary and that individuals maychoose to follow because they believe that the leader has better information. The focus of hiswork is on strategic behavior of the leader, who may want to mislead followers. Leading byexample or sacrifice is a way to make credible that the leader believes in what he is doing.
Kobayashi, H., & Suehiro, H. (2005) consider leadership in a two period context whereone chooses to lead and the other to follow based on confidence about the state of a stochasticproduction environment.
More recent work by Huck and Rey-Biel (2006) extends Hermalin (1998) to a teamsetting with leading by example, but focus on the endogenous choice of leader. There analysisleads to the conclusion that the least productive team member should be assigned the role ofleader. This hinges on the assumed relation of leadership ability to production ability and on theproduction function that determines how ability affects output through production versus throughleadership.
Hermalin (2007) follows his earlier work, imbedding the analysis in a repeated gamecontext where leaders gain credibility, keep and acquire followers by demonstrated success. Thedefinition of leadership in that paper, namely having followers, is similar to that used here.
Recent papers Komai, M., Stegeman, M., & Hermalin, B. E. (2007) and Komai andStegeman (2010) continue the theme of leadership as a way to motivate other under uncertainty. Especially the latter, emphasizes the motivational aspect of leadership, where followers wouldshirk absent correct motivation or incentives.
The direction of followed in the work that follows is different. Effort is ignored. Toprovide empirical implications the focus is on the characteristics of individuals that allows themto assume leadership roles and on their behavior, both with respect to their own actions and tothe way markets treat them.
3
of the leaders. Thus, a leader is someone who has both vision and wisdom and who attracts a
coterie of followers because of displayed superiority of decision making.2
Because leaders are confronted with a wide variety of choices and because these choices
span many fields, leaders tend to be generalists rather than specialists. Further, the broader the
organization that an individual leads, the more general are the skills. Academic department
chairs are broader than many of their colleagues who are not well suited to be chairs, but they are
less broad than the heads of large corporations. Analogously, political leaders tend to be the
least specialized and broadest of all leaders because they confront the entire spectrum of possible
decisions. This is sometimes characterized as shallowness - knowledge that is 1000 miles wide
Edward P. Lazear Leadership: A Personnel Economics Approach
3See Lazear (2005). Baumol (1968) was one of the first modern-era papers to considerthe role of the entrepreneur in economic growth and macroeconomic activity. Sometimes, theability to influence others is destructive as Baumol (1990) points out in his influential essay. Inaddition to being creative and generating value, those who are effective in swaying others cancapture rents, and entrepreneurship and more generally leadership, can be used primarily tocapture rent, without little increase in value. In what follows, most of the discussion will focuson those aspects of entrepreneurship and leadership that are indeed productive.
4
and ½ inch deep - but breadth is important when the situations that will be encountered are from
a large set of potentially unpredictable areas.
An additional key ingredient is that leaders also possess the skills necessary to convince
others that they have leadership ability. Consequently, communication skills are likely to be an
important component in the leadership mix.
The empirical work below follows some recent analysis of entrepreneurship and uses the
same data from graduates of the Stanford MBA program.3 This is not inappropriate because
entrepreneurs are a subset of leaders. Indeed, the distinction between entrepreneurs and leaders
is somewhat blurred. Most successful entrepreneurs view themselves as leaders because they
had the vision that enabled them to provide valuable output economy. Starting a successful
business requires the ability to navigate through a vast array of potential hazards. Conversely,
most leaders of large corporations think of themselves as entrepreneurial, whether they founded
the company or not. The most successful of some CEOs include a few founders, but are
comprised primarily of those who redesigned existing companies to produce higher profits and
shareholder value.
Building on this view, the analysis produces three main results, the last two of which are
testable with the data at hand and borne out.

Edward P. Lazear Leadership: A Personnel Economics Approach
4The acquisition of these skills is a standard human capital investment problem. Becauseinvestment introduces complication without providing insight, the version of the model absentexplicit investment is presented.
5
1. Ability and visibility, manifested in number of contacts per period, are complements.
The most able seek to be the most visible in decision making settings.
2. The most able leaders are in the highest variance industries.
3. Leaders are generalists.
Model
In an economy, individuals encounter decision making situations. Sometimes the
decisions are private, but in many, perhaps most, cases in business, the decisions that are made
become known and the outcomes are eventually observable to others. Think of there being q
encounters per period where each encounter is defined as an opportunity to make a decision or
answer a question. The probability of getting a correct answer to a question depends on ability,
a, which can be endowed or acquired.4 Leadership is demonstrated when individuals excel at
making decisions and answering questions with more accuracy than the individuals with whom
they interact.
The main variable of interest is q, which is interpreted as the number of leadership-
displaying situations in which an individual places himself. It can also be thought of as the main
effort variable because it is costly to seek out such situations and everything positive that comes
from effort is incorporated in the results of q, the number of decisions. Because decisions are
thought to be public, it is useful to think of q as the number of new contacts that the individual

Edward P. Lazear Leadership: A Personnel Economics Approach
5 There is no requirement on the shape of G( ), but it is natural to think of it as aai
logistic or some other similarly shaped function.
6Incorporated into k is the probability that a correct decision results in followers, timesthe value that the leader places on having these followers.
6
makes. The variable q then relates to the potential number of followers that a leader acquires. It
is not the same as the number of followers, because individuals are more likely to follow when
the individual makes a correct decision.
The main assumption in the model is that more able individuals are more likely to
produces successful decisions for a given cost. Thus, the probability of success in a decision
making situations, q, is a function of ability given by G(a) with G bounded between 0 and 1.
The number of successful decisions is then q G.5
The problem for the aspiring leader is to choose how much effort to put into finding
decision making situations. Each time an individual demonstrates success by making a correct
decision that is public, he acquires followers. The direct value of making a correct decision,
coupled with the value that he attaches to acquiring followers, has value k.6 The maximization is
then
(1) Maximize Net Value of Contacts = Max kG a C qq
This is a trivial problem, the first-order condition to which is
Edward P. Lazear Leadership: A Personnel Economics Approach
7
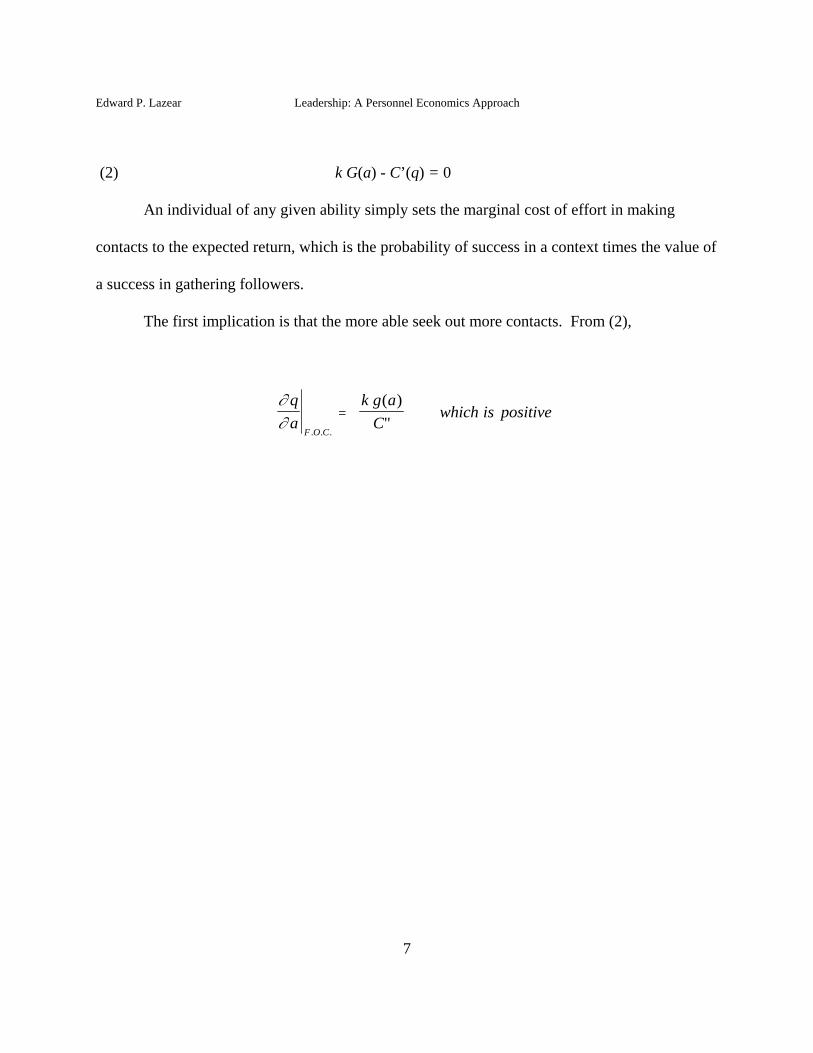
(2) k G(a) - C’(q) = 0
An individual of any given ability simply sets the marginal cost of effort in making
contacts to the expected return, which is the probability of success in a context times the value of
a success in gathering followers.
The first implication is that the more able seek out more contacts. From (2),
q
a
k g a
Cwhich is positive
F O C. . .
( )
"
Edward P. Lazear Leadership: A Personnel Economics Approach
7This result is a necessary consequence of the fact that the reward to additional contacts islinear (sufficient but not necessary) and that the probability of success is increasing in ability. Itis conceivable that in some ranges the most able might not seek out as many contacts as thosesomewhat less able. For example, were the reward to contacts sufficiently concave once anindividual had a sufficient number of followers, it might not pay to acquire additional contactsafter the high level of followers had been acquired. This would be a more natural outcome in amulti-period structure, where prior activity would affect the stock of followers who are broughtinto subsequent periods.
8
The most able seek visibility. They do this by putting themselves in an observable
decision making situation.7 Thus, the able also seek to become people-persons, by connecting
with many others. Individuals who are particularly able at making publicly observable decisions
find it more profitable to cultivate contacts. The intuition is that contacts are more valuable to
people who want to show off their knowledge than to people whose knowledge base is small.
Put directly, if you’ve got it, flaunt it. Or the converse, attributed to Mark Twain, is that it is
better to remain silent and have others suspect stupidity then to open one’s mouth and prove it.
It also follows directly that the most able acquire more followers since the number of
followers is merely dependent on q G(a) and both q and G are increasing in a . Thus, leaders are
likely to come from the ranks of the most able. Note that ability is defined here as a scalar and
the ability that is relevant is the ability to make wise decisions that are publicly observable.
The next implication is that the most able gravitate to situations where the variance
between the value of good and bad decisions is high. In this simple model, there is only one
parameter that measures the value of a good decision, namely k. In some firms, occupations or
industries, it is conceivable that mistakes do not matter very much. In others, a good decision,
which sets a firm on the right course, can be extremely valuable, whereas a bad decision can
imply disaster. This can be put in terms of additive or multiplicative production. A shoe

Edward P. Lazear Leadership: A Personnel Economics Approach
8See Andersson, et al. (2006), who find that stars are found in, and best paid in, highvariance industries.
9
salesman’s technology is additive production, where a mistake has limited effect and a success
has limited gain. A research scientists’ technology is likely multiplicative because the fruits of a
discovery can be shared among many potential users and uses. The most able leaders will seek
out occupations, industries and firms where the impacts of correct decisions are greatest.8
Formally, holding q constant,
2 ( )( )
leadership gain
a kq g a
which is positive. Allowing q to vary optimally with a and k can only increase the gain further.
The value of ability is higher in those environments where k is highest. A competitive
labor market for leaders guarantees that they will sort to the firms where correct decisions have
the most value, a result that is found in Rosen (1982). Because of the complementarity between
k and a, the most able have a comparative advantage at high k firms, so these firms can always
outbid lower k firms for talented leaders. The market guarantees that lower ability individuals
naturally sort to lower k firms, where they are less likely to have adverse effects on profit and
where the skills of the most able do not shine so brightly.
Finally, the most able leaders are generalists. In order to derive this result, it is necessary
to introduce a second type of ability, call it b. For any given amount of ability, x = a + b, the
question is whether leaders more likely to have similar amounts of a and b, or are they more
Edward P. Lazear Leadership: A Personnel Economics Approach
9This can always be done because problems can be broken up into units the size of whichmakes their solutions have value equal to k.
10
likely to be specialized in either a or b? It is shown here that if leaders are among the most able,
as defined by having high levels of x, generalists, with balanced levels of a and b, are more
likely to choose the right direction given an encounter with a random problem. As such,
generalists command the highest wage among leaders, and leaders will naturally be generalists.
Suppose that problems come in two varieties. These can be thought of as right-brain
problems, which are solved using ability a, and left brain problems, which are solved using
ability b. The proportion of right-brain problems encountered as a leader is 8, and the proportion
of left-brain problems encountered is therefore 1-8. As before, the probability of getting a
problem correct depends on the amount of ability that an individual brings to the problem. As
before, an individual who encounters a right-brain problem gets it correct G(a) of the time and
one who encounters a left-brain problem gets it correct G(b) of the time.
The scaling is not arbitrary, but is chosen so that the value of solving each type of
problem is the same9 and G(a) = G(b) for a=b. That is, the contribution to the probability (and
value) of solving a right brain problem equals the contribution to the probability of solving a left-
brain problem at any given level of ability. The normalization is on the scale of either of the two
types of ability. Once that scaling is selected, then the scaling of the other must be such that
G(a) = G(b) whenever a=b, for all levels of a. That is, the probability of solving a b-type
problem with value one is the same as that of solving an a-type problem with value one when

Edward P. Lazear Leadership: A Personnel Economics Approach
10Once the scaling is set so as to make the value of one unit of b equal to the value of oneunit of a, the distributions in the population are determined. Although one unit of b is scaled sothat it has the same value as one unit of a, this does not imply that it is as easy to find b as a orvice versa. It may be that one skill is much more scarce than another, that is, that most areendowed with low levels of one relative to the other. Additionally, if a and b were produced byinvesting in them, there is nothing to require that the cost of produce one unit of b is the same asthe cost of producing one unit of a when a equals b.
11
a=b.10
The expected value of a decision from having an ability vector [a, b] is then
(3) Value = [8 G(a) + (1-8) G(b)] k
which can be written
(4) Value = [8 G(a) + (1-8) G(x-a)] k .
The question is whether level x of ability, concentrated on one type of problem or the
other, yields higher value than splitting x in some way. If a split x is better, then individuals of a
given ability who are endowed with diversified ability are more likely to get high wage offers for
leader positions than those who are specialized in one or another ability. To determine this,
differentiate (4) with respect to a:
(5)
It is important to examine the second-order condition because the solution to (5) is
sometimes a minimum rather than a maximum. The s.o.c. is
Gain
ag a g x a k [ ( ) ( ) ( )]1 0

Edward P. Lazear Leadership: A Personnel Economics Approach
12
(6)
From (6), it is clear that if G() is concave throughout, the second order condition is
negative, so (5) yields a maximum, implying an interior solution and diversification. The
intuition of the result is clearest when 8 = ½. Then (5) implies a= b. Because G is concave,
putting extra ability on a has diminishing returns. The steepest part of the G function is at G(0)
so it always pays to move ability x from a to b until a=b. Of course, 8= ½ is not necessary, but
then the ratio of a to b reflects not only the concavity of the G function but also the relative
likelihood of the two kinds of problems arising.
Conversely, if G() is convex in the relevant range, the second order condition is positive,
implying that (5) yields a minimum. Under these circumstances, it pays to specialize in one skill
or the other and the choice of which simply depends on whether 8 is greater than or less than ½.
Because there are increasing returns, additional units of ability devoted to any one skill has
more value in increasing the probability of getting a correct solution than the first units of that
skill. As a result, specialization is natural.
At very high levels of ability, the function is certain to be concave. As G(x) approaches
one, the function must asymptote and so concavity is implied. Consequently, very high ability
individuals with diversified abilities have higher values of gain in (4) than those with specialized
ability. Given concavity of G(x) at high levels of x, it follows that the sufficiently able leaders
2
2 1Gain
ag a g x a k [ ' ( ) ( ) ' ( )]
Edward P. Lazear Leadership: A Personnel Economics Approach
13
are generalists whether the abilities a and b are acquired or endowed. Those individuals who, for
a given level of x, have diversified abilities, will command higher demand prices than those with
specialized ability. Were individuals to invest in a and b, then those who in equilibrium acquire
high levels of x tend to invest in some of a and some of b. Again, this follows from the first
order condition in (5) and concavity at high levels of x that imply the optimality of an interior
solution.
It is less obvious that G(x) is likely to be convex at low levels of x. As a result, the logic
that implies generalization at very high levels of x does not also imply specialization at very low
levels of x. Were G(x) a logistic function, then low ability individuals would be specialists
because of convexity of G(x) in the G(x) in the relevant range. The high ability individuals
would be generalists.
Many of the smartest people are highly specialized. Is this a contradiction of the theory?
Perhaps, but not necessarily. The highly specialized individuals may not, in fact, be the
“smartest” people we know. Although they are extremely good in a narrow area, they may
actually have lower levels of “ability” defined as the sum of a and b than others who appear less
impressive. Because we observe them only in the context of problems that relate to one type of
ability, they are very successful, having G(a) that exceeds the G(a) or G(b) of other top
individuals. But that is not the test. The test is whether
ai + bi> aj + bj
where j is the CEO and i is the top scientist who works for him. The fact that G(ai) exceed the
maximum of G(aj) and G(bj) does not imply that i is “smarter” than j, but only that j is not as

Edward P. Lazear Leadership: A Personnel Economics Approach
14
good at any one type of problem as i. The CEO is the generalist who appears very smart in many
different areas, but lacking genius in any one. The scientist may have a very high value of a but
a low level of b, implying that she is not very good at making decisions outside her narrow area.
It is not a stretch to suggest that the most able technical people are not the ones that we would
rely on to make marketing decisions, hiring decisions, or decisions about the general product
strategy of a firm. The same is true in other leadership constructs. Those people who are most
adept at structuring the best economic policies, say as they affect a particular government loan
program, are not the ones likely to be best at making decisions affecting national security.
It is a trivial reinterpretation to think of the amount of a (and therefore b for a given x) as
being a choice variable for the individual. Nothing in the previous analysis changes; it is
irrelevant whether the individual chooses a or whether nature chooses it.
That high ability people are more likely to be generalists is testable using a variety of
data sets. The Stanford University data described below can be used, but these individuals are
very high ability as a group so the within group variation may not be pronounced. Still, it is
possible to examine the simple relation of diversification in knowledge to position held in the
firm.
Leadership in New Technology
Although high level leaders, like CEOs and founders of the great businesses, have many
general skills, that seems less likely to be true in newly evolving fields. In new fields, the
unanswered questions are more likely to be concentrated in the newer areas. In older fields,

Edward P. Lazear Leadership: A Personnel Economics Approach
11Non-negativity constraints on b might imply that a corner solution is reached before thef.o.c. is satisfied.
15
what is left unanswered may come from anywhere. In new technical fields, the primary
questions relate to the technology itself, not to the general management. Thus, one could argue
that 8 is closer to one (or zero) in new fields. This is a force toward wanting specialization. The
better leaders are those who have large values of the relevant skill.
Formally, if G() is concave in the relevant range, then (5) implies an interior solution as
given by (4) which is rewritten as
g a
g x a
( )
( )
10
As 8 goes to one, g(a) goes to zero, which implies that a is large. High levels of 8 imply more
specialization in a and low levels of 8 imply more specialization in b.11
This can be examined empirically. In new fields, the prediction is that highest level
managers are more likely to be specialists than in older, established industries.
Edward P. Lazear Leadership: A Personnel Economics Approach
12The response rate was 40%. Some individuals were very old, and others were no longeralive, which accounts for some of the non-responses.
16
Evidence
There are a number of propositions that can be tested using a unique data set that was
used in Lazear (2005). In the late 1990s, Stanford University surveyed its Graduate School of
Business alumni (from all prior years). This resulted in a sample of about 5000 respondents. The
primary focus of the survey was compiling a job history for each of the graduates and detailed
histories are available. Information on job titles, industry, firm size, starting and ending salaries
and work periods was collected with special emphasis on information about starting businesses.12
In addition to the detailed job histories, the data were matched with the student transcripts so
that it is possible to see which courses were taken by those who went on to be leaders and which
by those who became specialists. Additionally, the grade obtained in each of the courses taken is
reported in the data.
In some ways, the data are very rich, but there is one way in which they fall short.
Because the students are Stanford MBAs, and because Stanford is among the most selective
MBA programs in the world, testing the proposition that leaders have high levels of ability to
acquire knowledge is difficult. All of the individuals in this sample have very high ability and
the differences between them may not be important. Still, some other aspects of the data are
appropriate for the task at hand, particularly determining whether leaders are generalists.
The unit of analysis in Table 2 is a job spell. Each individual generally reports a number
of jobs and there is a separate observation for each job for each individual. There are about
Edward P. Lazear Leadership: A Personnel Economics Approach
17
25,000 valid job spells, but each observation is not independent because there are multiple
observations per individual. There are about 5100 individuals in the sample.
A number of implications that come from the theoretical model. The most important
prediction is that leaders are generalists. In the Stanford data, one way to measure general skills
is by counting the number of roles they have had, prior to an employment event. An individual
who has general skills in the sense that he can do many things is likely to have played more roles
in his prior jobs than one who is highly technical and who has concentrated in one area. The
variable “NPRIOR” measures the number of prior roles in which an individual has served in his
prior jobs. For example, an individual who had two jobs prior to the current observation might
have served as a marketer and salesperson on his first job, and as a comptroller on his second.
This person would have a value of 0 for the first job (no prior roles), 2 for the second job, and 3
for the current observation (the third job). The average number of prior roles for all observations
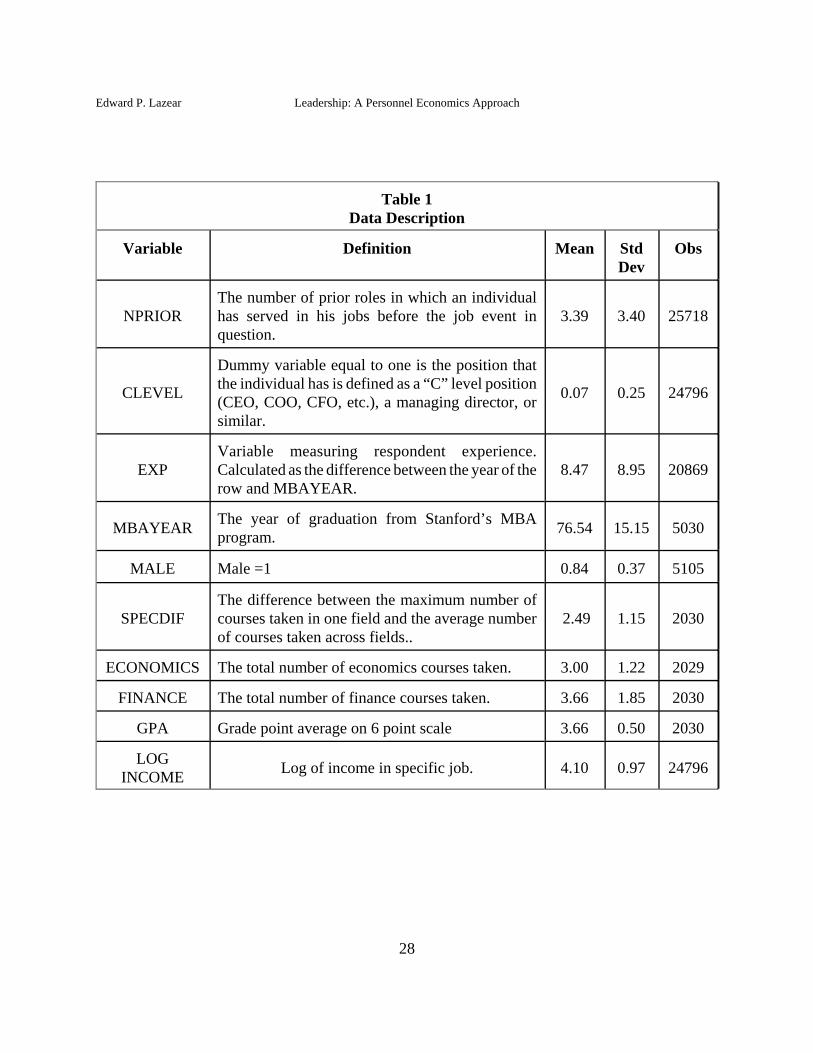
is 3.4, with a maximum of 30 and a minimum of 0. Table 1 provides variable definitions and
summary statistics. Table 2 provides a basic look at the importance of the number of prior roles
in determining a who becomes leader. The variable “CLEVEL” is a dummy equal to 1 if the
position that the individual has is defined as a “C” level position (CEO, COO, CFO...), a
managing director, or similar. The data are for individuals who have had at least 15 years of
experience. Those who have had only one or two prior roles up to that point have only a 2%
chance of being a leader on the next job. Those who have had at least five prior roles up to that
point have a 18% chance of being a leader on their next job. It is clear from this simple analysis
that prior roles is a major determinant of being a leader. This could either be because leaders are
Edward P. Lazear Leadership: A Personnel Economics Approach
13Kuhn, P., & Weinberger, C. (2005) show that leadership is correlated over differentevents in life. Individuals who were leaders in school are also more likely to assume leadershippositions later when they enter management. This has implications for earnings, some of whichare similar to those presented below in Table 5.
18
innate generalists or because those who are grooming themselves or are being groomed to be
leaders take on many roles to prepare them for the job. Either interpretation requires that the
basic implication of the model, namely that having broad knowledge is important for leadership.
(The distinction is discussed below in Table 3).13
Although the basic correlation is interesting, it does not hold other factors constant.
Table 3 reports logits which hold constant prior experience and demographic characteristics.
Most important is that NPRIOR has a large effect on the probability of obtaining a C-level
position. The derivative of the probability of being in a C-level job with respect to NPRIOR is
0.004. A one standard deviation move in the number of prior roles (equal to 3.4 roles) increases
the probability of obtaining a C-level position by 0.014, with is about one-fifth the probability of
being in a C-level position in the sample.
Experience also counts. Not surprisingly, more experienced individuals are more likely
to obtain C-level positions. The same is true of males and, given experience, of those with more
recent MBAs. Given experience, more recent MBAs are likely older, since most experience is
obtained after the MBA is received.
In column 2 of Table 3, the logit is repeated, but clustered by individual to correct for
non-independence. The same basic results prevail. Column 3 examines whether having had a
specialized curriculum at Stanford is more or less likely to be associated with leadership. The
variable “SPECDIF” is the difference between the maximum number of courses taken in one
Edward P. Lazear Leadership: A Personnel Economics Approach
14Because data on courses taken were only available for later cohorts, the samples incolumns 1 and 2 differ significantly from that in column 3, so coefficients cannot be directlycompared.
19
field and the average number of courses taken across fields. This is a measure of lopsidedness in
the study of curriculum. Higher values of “SPECDIF” reflect higher levels of specialization in
course of study at Stanford. The important result is that the coefficient on SPECDIF is negative
and significant. Individuals who take more general and varied curricula at Stanford are more
likely to become leaders in their subsequent employment.14 This is additional evidence that
supports the view that leaders are generalists, particularly among the very able who comprise the
bulk of the Stanford data set.
Are Leaders Born or Made?
Mentioned earlier is that there are two interpretations of the finding that NPRIOR is a
strong predictor of the likelihood of being a leader. Both are consistent with the generalist view.
One is that people are born generalists, can therefore perform in many roles, and NPRIOR picks
up this effect. The other is that those who want to be leaders or who are being groomed for
leadership take on many roles to acquire the experience necessary for leadership.
The two hypotheses can be tested. Column 5 of Table 3 reports a fixed effect linear
probability model with CLEVEL as the dependent variable. The fixed effect regression allows
separation into the variation explained by the between-person effect and the variation explained
by the within-person effect. The within-person effect corresponds to the effect of intentionally
taking on roles in order to position oneself for leadership. The between-person effect
Edward P. Lazear Leadership: A Personnel Economics Approach
20
corresponds to the innate differences between people, with some being better able to be leaders
than others. Both are important, but the amount of variation explained by the between person
effect accounts for only 22% of the total variance in the unexplained component, with the
within-person effect making up the rest. This means that changes that occur over the work life
are directly linked to the probability of being a leader.
The NPRIOR effect on leadership is actually stronger when fixed effects are removed
than when they are not. In column 4 of Table 3, a standard linear probability regression is
reported for the purposes of comparison with column 5. The coefficient on NPRIOR in the fixed
effect regression is many times larger than that in the regression without fixed effects. The same
is true of the fixed logit reported in column 6. When a straight logit is run on the same sample
with the same variables, the coefficient on NPRIOR is 0.013 rather than 0.168. This implies that
prior roles and innate ability are substitutes rather than complements in affecting leadership
likelihood. Those least likely to become leaders compensate by acquiring more roles than those
most likely. As a consequence, the observed (non-fixed-effect) relation is flatter than the within-
person effects. This is shown in the figure 1.
Person 1 has observations shown by circles. He is the more able, having had 4 of 5
leadership positions. Person 2 has observations shown by diamonds. She has 3 of 5 leadership
positions, but had to take on more roles in order to obtain them. The regression line with fixed
effects is the average of the two upward sloping dotted lines, which results in a strongly positive
effect of NPRIOR on CLEVEL. The regression without fixed effects is the solid flatter line. It
is flat because those least likely to be leaders have the highest levels of NPRIOR.
Edward P. Lazear Leadership: A Personnel Economics Approach
21
Are leaders born or made? Person effects are important, which suggests that there are
innate differences in leadership ability that play a role in becoming a leader. But these
differences can be offset by experience and taking on many roles, both of which boost the
probability of getting a leader position. In explaining variance in leadership, the changes that
occur over time seem more important than the innate differences across people.
Visibility
The model predicts that individuals who are well suited to be leaders will place
themselves in positions where their decisions are visible to others in order to acquire followers.
The data can be used to examine this. The respondents state their functions in each of their jobs.
We also know whether the respondent ever becomes a leader during their lifetimes. Table 4
reports the bottom and top jobs for becoming a leader (CLEVEL=1 at some point during the
respondent’s career). Jobs held when the individual is actually in a C-level position are excluded
from the analysis.
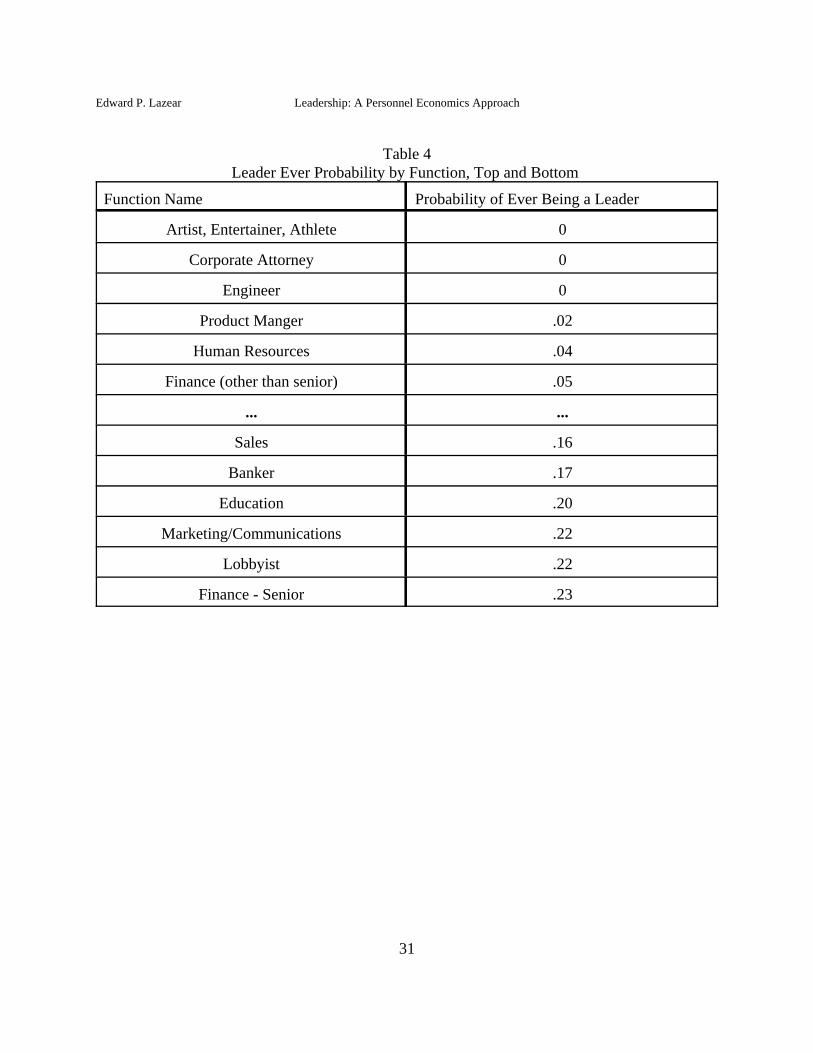
The jobs least likely to end up leading to a C-level position include artists, entertainers,
athletes, corporate attorneys, engineers, product managers, human resources, and finance (lower
level, e.g., analysts). Are these invisible positions? Surely artists, entertainers and athletes are
visible, but not for their decision making. The others are internal positions with technical
functions.
The jobs most likely to end up leading to a C-level position include sales, banking,
education, marketing and communications, lobbyists and senior finance positions. These jobs
Edward P. Lazear Leadership: A Personnel Economics Approach
22
for the most part involve much contact with other people who see the individuals in decision
settings. Although descriptive, qualitative, and far from proof, the evidence here seems
consistent with the notion that those who go on to be leaders are make themselves visible
through job choice.
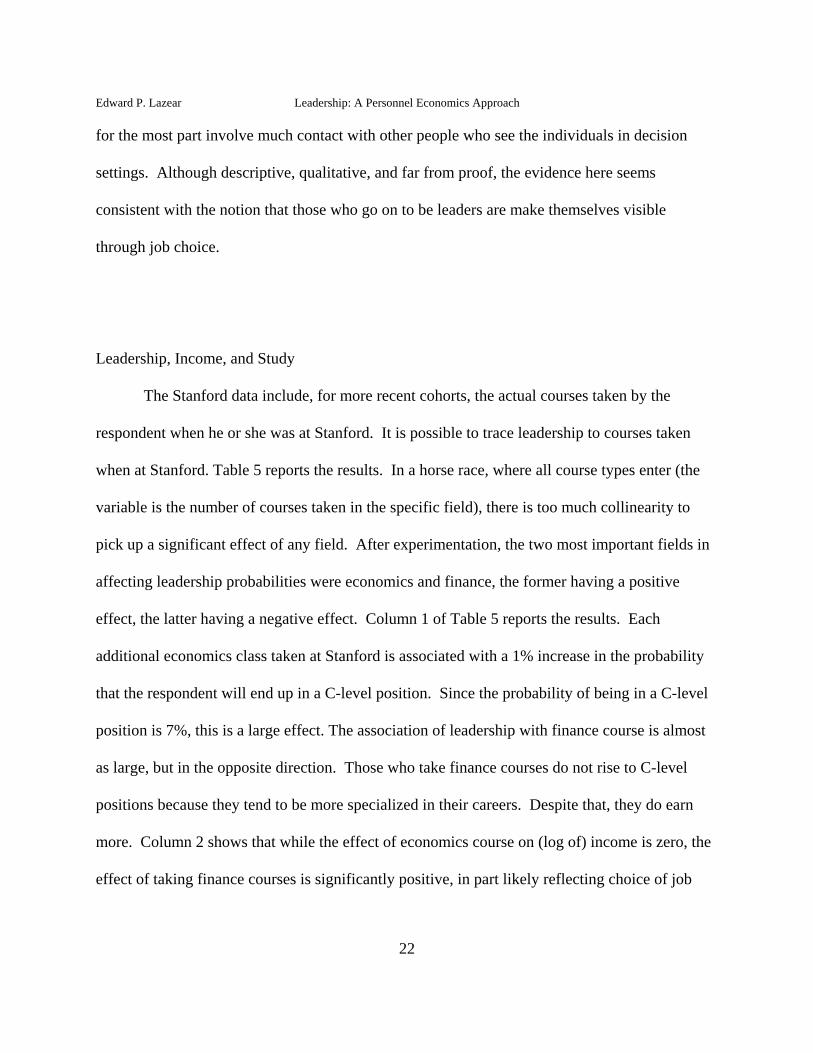
Leadership, Income, and Study
The Stanford data include, for more recent cohorts, the actual courses taken by the
respondent when he or she was at Stanford. It is possible to trace leadership to courses taken
when at Stanford. Table 5 reports the results. In a horse race, where all course types enter (the
variable is the number of courses taken in the specific field), there is too much collinearity to
pick up a significant effect of any field. After experimentation, the two most important fields in
affecting leadership probabilities were economics and finance, the former having a positive
effect, the latter having a negative effect. Column 1 of Table 5 reports the results. Each
additional economics class taken at Stanford is associated with a 1% increase in the probability
that the respondent will end up in a C-level position. Since the probability of being in a C-level
position is 7%, this is a large effect. The association of leadership with finance course is almost
as large, but in the opposite direction. Those who take finance courses do not rise to C-level
positions because they tend to be more specialized in their careers. Despite that, they do earn
more. Column 2 shows that while the effect of economics course on (log of) income is zero, the
effect of taking finance courses is significantly positive, in part likely reflecting choice of job

Edward P. Lazear Leadership: A Personnel Economics Approach
15Indeed, the admissions criteria may actually create that situation. Anyone admitted toStanford without superior grades likely had some other superior trait that caused him or her to
23
and field.
Columns 3 and 4 of Table 5 add a variable that measures GPA. Grades are not thought to
be too important at Stanford, in part because grades are not reported to perspective employers.
But grades clearly matter, perhaps as a proxy for unobserved person-specific traits. First, note
that in column 4, grades are significantly related to subsequent income. A one standard deviation
increase in grade point average is associated with about a 7% higher in income.
More interesting is that there is a large and negative association between C-Level and
grade point average. This is likely to be another manifestation of the “leaders are generalists”
result. Suppose that there are two types of skills - school smarts and street smarts and that both
are necessary for leadership. If ability varied dramatically, but the ratio of school smarts to street
smarts were constant, then one would expect a positive association between leadership and GPA.
High GPA individuals would have more of both skills and since the model predicts that the more
able are more likely to be leaders, GPA would pick this up and be positively related to C-Level.
If instead all individuals were of exactly the same total ability (as defined earlier), then better
school smarts, reflected in GPA, would necessarily be offset by poorer street smarts. The
correlation between leadership and GPA would depend on the relative importance of the skills in
leading. Were street smarts more important than school smarts, the correlation would be
negative, as observed in Table 5. Since the Stanford MBA population is a very narrow slice of
the overall ability distribution, it is possible that most of what is seen in good GPAs is offset by
deficiencies in other skills.15
Edward P. Lazear Leadership: A Personnel Economics Approach
stand out relative to other applicants.
24
Technical and Non-Technical Fields
It is also possible to separate individuals by industries. The argument in the theory
section suggested that in high tech industries (such as biotech or information technology),
leaders should be relatively more specialized. Unfortunately, there are only 19 cases of c-level
jobs being held in the high tech industries (recall that most of the data predate 1996) so it is
impossible to do a serious comparison of tech leaders with non-tech leaders.
Conclusion
A theory of leadership is presented. Leaders put themselves in publicly observed
decision making situations frequently and have a higher probability of getting the right answer
more often than the average individual. As a result, they accumulate followers.
Both ability, either innate or acquired, and contact with others are important for
leadership. Furthermore, they are complementary. Those individuals who are smartest are more
likely to invest in generating contacts where their knowledge can be displayed and put to use.
The most able leaders are attracted to industries that have the highest variance in
outcomes because their value added is highest in those industries. Wages are both high and
variable in industries where outcomes across firms are highly variable.

Edward P. Lazear Leadership: A Personnel Economics Approach
25
Ability is negatively related to specialization. Potential leaders who are very able acquire
more followers by branching out than by acquiring incremental skills in their best areas. But for
low ability individuals, it may be better to specialize. Knowing a very small amount about
everything is unlikely to have much payoff.
The view is tested using data from the alumni of the Stanford Graduate School of
Business. The data show that leaders are generalists relative to their peers.
Edward P. Lazear Leadership: A Personnel Economics Approach
26
References
Andersson, F., M. Freedman, J. Haltiwanger, J. Lane, and K. Shaw. 2006. “Reaching for theStars: Who Pays for Talent in Innovative Industries?” NBER Working Paper #12435 andEconomic Journal, forthcoming.
Barrow, J. C. 1977. “The Variables of Leadership: A Review and Conceptual Framework.” TheAcademy of Management Review 2, (2): 231-51.
Baumol, W.J. 1990. “Entrepreneurship: Productive, Unproductive, and Destructive.” Journal ofPolitical Economy 98:5: pp. 893-922.
———. 1968. “Entrepreneurship in Economic Theory.” American Economic Review 58 (2),64–71
Hermalin, B. E. 2007. “Leading for the Long Term.” Journal of Economic Behavior andOrganization 62, (1): 1-19.
———. 1998. “Toward an Economic Theory of Leadership: Leading by Example.” TheAmerican Economic Review 88, (5): 1188-206.
House, R. J., and R. N. Aditya. 1997. “The Social Scientific Study of Leadership: Quo Vadis?” Journal of Management 23, (3): 409.
Huck, S., and P. Rey-Biel. 2006. “Endogenous Leadership in Teams.” Journal of Institutionaland Theoretical Economics JITE 162, (2): 253-61.
Kobayashi, H., and H. Suehiro. 2005. “Emergence of Leadership in Teams.” Japanese EconomicReview 56, (3): 295.
Komai, M., and M. Stegeman. 2010. “Leadership Based on Asymmetric Information.” The RandJournal of Economics 41, (1): 35-63.
Komai, M., M. Stegeman, and B. E. Hermalin. 2007. “Leadership and Information.” AmericanEconomic Review 97, (3): 944-7.
Kuhn, P., and C. Weinberger. 2005. “Leadership Skills and Wages.” Journal of LaborEconomics 23, (3): 395-436.
Lazear, Edward P. 2005. “Entrepreneurship.” Journal of Labor Economics 23:4: 649-80.
O’Reilly, C. A. III and J. A. Chatman. 1984. “Working Smarter and Harder: A LongitudinalStudy of Managerial Success.” Administrative Science Quarterly , 39, 603-27
Rosen, Sherwin. 1982. “Authority, Control, and the Distribution of Earnings.” Bell Journal ofEconomics 13: 311-23.

Edward P. Lazear Leadership: A Personnel Economics Approach
27
Rotemberg, J. J., and G. Saloner. 1993. “Leadership Style and Incentives.” Management Science39, (11): 1299-318.
Yukl, G. 1989. “Managerial Leadership: A Review of Theory and Research.” Journal ofManagement 15, (2): 251.
.
Edward P. Lazear Leadership: A Personnel Economics Approach
28
Table 1Data Description
Variable Definition Mean StdDev
Obs
NPRIORThe number of prior roles in which an individualhas served in his jobs before the job event inquestion.
3.39 3.40 25718
CLEVEL
Dummy variable equal to one is the position thatthe individual has is defined as a “C” level position(CEO, COO, CFO, etc.), a managing director, orsimilar.
0.07 0.25 24796
EXPVariable measuring respondent experience.Calculated as the difference between the year of therow and MBAYEAR.
8.47 8.95 20869
MBAYEARThe year of graduation from Stanford’s MBAprogram.
76.54 15.15 5030
MALE Male =1 0.84 0.37 5105
SPECDIFThe difference between the maximum number ofcourses taken in one field and the average numberof courses taken across fields..
2.49 1.15 2030
ECONOMICS The total number of economics courses taken. 3.00 1.22 2029
FINANCE The total number of finance courses taken. 3.66 1.85 2030
GPA Grade point average on 6 point scale 3.66 0.50 2030
LOGINCOME
Log of income in specific job. 4.10 0.97 24796

Edward P. Lazear Leadership: A Personnel Economics Approach
29
Table 2Number of Prior Roles and Probability of Being a CLEVEL
NPRIOR Probability of CLEVEL=1
One or two .02
Five or more .18

Edward P. Lazear Leadership: A Personnel Economics Approach
30
Table 3Dependent Variable = CLEVEL
1Logit
2Clustered
Logit
3Clustered Logit
4 Linear
ProbabilityRegression
5FixedEffectLinear
ProbabilityRegression
6FixedEffectLogit
NPRIOR .064(.008)
.064(.011)
.143(.035)
.002(.002)
.017(.004)
.168(.024)
EXP .054(.004)
.054(.004)
.069(.027)
.011(.001)
.011(.001)
.043(.008)
MBAYEAR .016(.003)
.016(.003)
-.033(.022)
MALE 1.12(0.13)
1.12(0.15)
1.10(0.26)
SPECDIF -.191(.068)
Constant -5.54(0.26)
-5.54(0.32)
-1.07(2.00)
.152(.009)
.075(.011)
log likehood -5051 -5051 -956 -1678
ratio within-to-total
variance .22
Observations 19120 19120 4887 5473 5473(930
persons)
5371(896
persons)
Edward P. Lazear Leadership: A Personnel Economics Approach
31
Table 4Leader Ever Probability by Function, Top and Bottom
Function Name Probability of Ever Being a Leader
Artist, Entertainer, Athlete 0
Corporate Attorney 0
Engineer 0
Product Manger .02
Human Resources .04
Finance (other than senior) .05
... ...
Sales .16
Banker .17
Education .20
Marketing/Communications .22
Lobbyist .22
Finance - Senior .23

Edward P. Lazear Leadership: A Personnel Economics Approach
32
Table 5Course Effects on Leadership and Income
1C-Level
ClusteredLogit
2Log of
Income ClusteredRegression
3C-Level
ClusteredLogit
4Log ofIncome
ClusteredRegression
NPRIOR .141(.034)
-.025(.012)
.137(.034)
-024(.012)
EXP .070(.027)
-.068(.009)
.072(.027)
.068(.009)
MBAYEAR -.030(.024)
.020(.005)
-.030 (.024)
.020(.005)
MALE 1.18(0.21)
.261(.031)
1.21(.208)
.245(.031)
SPECDIF -125(.085)
.003(.016)
-.112(.084)
-.003(.016)
ECONOMICS .147(.073)
-.005(.016)
.156(.073)
-.008(.015)
FINANCE -.103(.058)
.097(.011)
-.098(.058)
.096(.011)
GPA -.300(.141)
.141(.035)
CONSTANT -1.74(2.34)
2.28(0.48)
-.722(2.387)
1.72(0.50)
LOG LIKELIHOOD or
R-square
-951 .12 -948 .13
OBSERVATIONS 4884 4241(1738
groups)
4884 4241(1738
groups)

Edward P. Lazear Leadership: A Personnel Economics Approach
33
Figure 1