lead exposure in children surveillance system (leicss ... · surveillance system, was therefore...
TRANSCRIPT

Lead Exposure in Children Surveillance System (LEICSS) annual report, 2017 Health Protection Report Volume 12 Number 39 2 November 2018

Lead Exposure in Children Surveillance System (LEICSS) annual report, 2017 Health Protection Report Volume 12 Number 39
2
Lead Exposure in Children Surveillance System (LEICSS) annual report, 2017
Key points
• in 2017 there were 50 cases of lead exposure in children notified to Public Health England (PHE)
• 38 of these cases (76%) were notified directly to LEICSS by participating laboratories, the remainder through other routes
• the median delay between a specimen being drawn and transfer of the case to their local HPT for public health action was nine days
• the number of cases detected was lower than the expected incidence of lead exposure based on international population survey data
• there was large variation in case detection rates between PHE Centres • cases were typically 1-4 years of age, male, and resident in more deprived
areas • the median blood lead concentration of cases was 0.68μmol/L (14.08
μg/dl) in 2017.
Key messages and recommendations
• lead is a persistent environmental contaminant that can cause toxicity even at low blood lead concentrations. There is no safe lower threshold of exposure
• children exhibiting pica* or more hand to mouth behaviour in environments with lead hazards are likely at highest risk of exposure
• clinicians should be aware of important sources of lead exposure, children most at risk, and presenting symptoms/signs of exposure
• cases with a blood lead concentration above the public health action level of ≥0.48μmol/L(≥10μg/dl) should be notified to PHE health protection teams for case management.
* The persistent ingestion of non-nutritive substances at an age where this is developmentally inappropriate.-
Lead Exposure in Children Surveillance System (LEICSS) annual report, 2017 Health Protection Report Volume 12 Number 39
3
Background
Exposure to lead can result in severe multi-system toxicity. How this toxicity manifests depends on both the blood lead concentration (BLC), and how rapidly BLC rises. Overt manifestations of toxicity (i.e. lead poisoning), such as anaemia or abdominal pain, accompany higher lead concentrations e.g. BLC>1.93μmol/L (40µg/dl)* [1]. Lead exposures resulting in a lower BLC may not cause such apparent symptoms, but still cause harm, particularly to the central nervous system. Decreased intellectual function and possibly other neuro-behavioural problems such as shortening of attention span and disruptive behaviour are associated with BLCs even below 0.48µmol/L (10µg/dl) [1,2].
Timely removal or abatement of the exposure source is the mainstay of case management, but symptomatic children, and children with blood lead concentration greater than around 1.93μmol/L may also require chelation therapy [2]. Despite successful primary prevention efforts targeted at reducing the use of lead in paints and fuels, lead concentrations in drinking water, and industry emissions resulting in a fall in BLC in children, lead is a persistent contaminant, therefore children can still be exposed to lead already in the environment. With the removal of lead from petrol, ingestion rather than inhalation is now the most common route of exposure in high income countries, particularly from flakes and dust from exposed leaded paint [2]. Leaded paint had wide domestic use in the UK before gradual withdrawal from the 1960s onwards [3]. Children with developmental disorders have been found to have higher blood lead concentrations than other children [4]; such children are at higher risk of exposure due to increased ingestion of lead, e.g. from paint flakes or lead in soil, due to increased mouthing or pica behaviour [5]. Iron deficiency may further increase susceptibility to lead toxicity [6]. Other important potential routes of exposure in children are ingestion of lead-contaminated water, dust from soil exposed to lead from industry or prior lead-containing vehicle emissions, herbal medicine preparations, consumer products not meeting regulatory standards e.g. paint on toys, and secondary exposure from parental hobbies or occupations (e.g. resulting in children being exposed to lead dust on work-clothing) [1].
There are no recent survey data estimating how many children in England are exposed to lead, but international population survey data in conducted in France in 2008/9 [7] estimated 0.09% of 1-6 year-olds had a BLC ≥0.48µmol/L (10µg/dl), and 1.5% a BLC ≥0.24µmol/L (5µg/dl). A survey in the USA in 2013/14 [8] estimated 0.5% of 1-5 year-olds had a BLC ≥0.24µmol/L (5µg/dl). Comparison with historic data strongly suggests a substantial fall in average BLCs [8]. However, population lead exposure is strongly influenced by setting, so these findings give only a broad indication of the potential situation in England.
* Both µmol/L and µg/dL units are commonly used internationally to express blood lead concentrations, where 1 µg/dl = 0.0483µmol/L. Divide the concentration in µg/dl by 20.7 to obtain the concentration in µmol/L.

Lead Exposure in Children Surveillance System (LEICSS) annual report, 2017 Health Protection Report Volume 12 Number 39
4
Lead exposure is diagnosed by a blood test to measure the blood lead concentration. Given the lack of specific symptoms/signs of exposure to lead, evidence for population screening was considered by the National Screening Committee in 2018, but a systematic population screening programme was not recommended [9]. Case detection therefore depends on clinicians having a high clinical suspicion, for example due to the home circumstances of the child increasing the risk of lead exposure, and subsequently ordering a blood test. Surveillance of cases identified by clinicians offers a means of gathering intelligence to guide public health action to prevent further cases of exposure.
The Lead Exposure in Children Surveillance System (LEICSS)
Public Health England (PHE) coordinates LEICSS, a national surveillance system for children resident in England. Formal surveillance of lead exposure in children in England was initiated in 2010 by the Surveillance of Raised Blood Lead Levels in Children (SLIC) study, a joint research study between the British Paediatric Surveillance Unit and the Health Protection Agency (the forebear to PHE). The SLiC study authors recommended implementation of a laboratory-based surveillance system in order to facilitate timely public health management of cases of lead poisoning in children [10]. A pilot system, the Lead Poisoning in Children (LPIC) surveillance system, was therefore instigated in 2014. LPIC was then permanently implemented in 2016 following successful evaluation of the pilot, and its name changed to LEICSS to recognise broader aims of prevention of lead exposure in children, in addition to the rapid recognition of cases of lead poisoning.
A PHE working group oversees LEICSS management, and a steering group with additional representatives from participating laboratories, academia, and NHS clinical toxicology oversee system aims and development (see Steering and Working Group Members in the appendix). LEICSS is one component of the Environmental Public Health Surveillance System (EPHSS) operated by PHE as part of Environmental Public Health Tracking, and the steering group and working group report to the PHE Environmental Public Health Tracking Board.
More information about Environmental Public Health Tracking and EPHSS can be found at: https://www.gov.uk/government/publications/environmental-public-health-surveillance-system.
LEICSS aims are: • timely public health action for individual cases with elevated blood lead
concentration • to inform preventive actions to reduce the incidence of lead exposure in children
in England.

Lead Exposure in Children Surveillance System (LEICSS) annual report, 2017 Health Protection Report Volume 12 Number 39
5
Case reporting to LEICSS LEICSS is a passive surveillance system that integrates reports of incident (newly detected) cases of lead exposure in children from two sources:
• cases reported to PHE directly from the testing biochemistry/toxicology laboratory, or
• searching HPZone* for cases first reported from other sources – eg the managing clinician or an environmental health officer – to their local PHE Health Protection Teams (HPTs)*, or potentially to HPTs via other departments such as PHE Environmental Hazards and Emergencies, and not reported to LEICSS by laboratories participating in surveillance.
Case notification to PHE is voluntary, but encouraged for case management and surveillance purposes. Case reports from biochemistry and toxicology laboratories Reports of cases meeting the following case definition are referred to as ‘laboratory-detected’ cases.
A laboratory-detected case is defined as a child: • with a blood lead concentration ≥0.48μmol/L (equivalent to ≥10μg/dl), as
detected in a UK Accreditation Service (UKAS) accredited biochemistry or toxicology laboratory
• aged under 16 years at the time of first elevated blood lead concentration • resident in England.
LEICSS surveillance staff enter case details onto HPZone following notification. The relevant local HPT is then alerted to investigate and manage the case. This route of notification of the investigating HPT has been found to be more timely than waiting for notification from other sources involved in treating the case e.g. the managing clinician [11]. Case searching on HPZone Reports of cases meeting the following case definition are referred to as ‘HPZone-detected’ cases:
• managed as cases diagnosed with ‘toxic exposure to lead’ by a health protection team based in England
• aged under 16 years at the time of notification to the health protection team • resident in England • not initially notified to LEICSS by a participating biochemistry/toxicology
laboratory. Blood lead concentration data are not routinely recorded on HPZone in a way that makes them available for analyses by LEICSS for these cases.
* HPZone is the public health case management system in England used by PHE Health Proection Teams, the frontline units responsible for investigating and managing public health threats to their local populations

Lead Exposure in Children Surveillance System (LEICSS) annual report, 2017 Health Protection Report Volume 12 Number 39
6
The Supra-regional Assay Service (SAS) Trace Elements laboratories network, and other reporting laboratories
A group of highly specialised diagnostic laboratories, the SAS provides a referral network for specialised laboratory investigations in the UK. Blood lead concentration is performed in six SAS Trace Elements laboratories in England, and it is estimated they perform the vast majority of such tests nationally. All six SAS laboratories participate in LEICSS, and a partnership between the SAS-associate laboratory in Wales (Cardiff Toxicology Laboratory) has been developed to alert LEICSS of England residents whose blood lead concentration may be determined in Cardiff. Other, non-SAS laboratories, have also agreed to report cases to LEICSS; these are typically located in larger NHS Trusts or are private laboratories. Public health management of cases
A BLC of ≥0.48μmol/L (or 10μg/dl) is the current threshold (‘public health action level’) for public health case management in England. HPTs will take steps to systematically identify and remove the potential source(s) of lead exposure in cases, following guidance in the PHE Lead Action Card [12]. This involves liaison and involvement with other PHE stakeholders, such as the Environmental Hazards and Emergencies department, and non-PHE stakeholders, such as the responsible clinician and local authority where the case resides. Purpose of this report
This report provides a summary of data extracted from the national LEICSS dataset for cases of child lead exposure in residents of England reported to Health Protection Teams during 1 January – 31 December 2017. As the number of cases in each year is small, we have compared the 2017 metrics to the 2015-17 3-year average, using data from cases with report dates between 1 January and 31 December for each of these years. Figures are correct at the time of publication and may be subject to change as new information about cases becomes available.

Lead Exposure in Children Surveillance System (LEICSS) annual report, 2017 Health Protection Report Volume 12 Number 39
7
Surveillance data indicators
Detection of cases of lead exposure in children in England, and support for timely case notification for public health action
Number of unique cases
There were 50 unique cases in 2017*, 76% of which were detected by LEICSS following reports from participating laboratories, similar to the 2015-17 average of 79% (see table 1).
Table 1. Count and percentage of cases, by reporting route to LEICSS, England 2017 Route of detection by LEICSS
Count of cases 2017 (% of total)
Count of cases 2015-17 (% of total)
Direct laboratory reports 38 (76) 91 (79) HPZone search 12 (24) 24 (21) Total 50 115
* Based on date of initial report to HPTs, or date entered onto HPZone if report date missing
Timeliness of reporting by participating laboratories, and onward reporting to health protection teams
In cases reported to LEICSS by participating laboratories in 2017, the median delay between a specimen being drawn and transfer of the case to their local HPT for public health action was nine days (see table 2). The 2015-17 median delay was also nine days. Table 2. Timeliness of case report of laboratory-detected cases to HPTs (delay in days, between specimen date and date of transfer to HPT), England 2017
Year Cases Cases with valid data*
Median days delay LQ - UQ
2015-17 91 82 9 7-14 2017 38 33 9 7-12 * Cases where both a valid specimen date and a valid date of reporting to HPTs were extracted from the LEICSS database; LQ – Lower Quartile, UQ – Upper Quartile
There was a median delay of one day between receipt of a case notification from a participating laboratory, and onward transfer to local health protection teams (see table 3). Most (88%) were transferred within five working days. The greater part of total delay between the sample specimen date, and transfer to local HPTs for public health action is before notification to PHE, but more rapid transfer of cases from LEICSS to HPTs could still be achieved in some cases.

Lead Exposure in Children Surveillance System (LEICSS) annual report, 2017 Health Protection Report Volume 12 Number 39
8
Table 3. Delay between receipt of notification by LEICSS from a laboratory, and transfer of cases by LEICSS to local health protection teams for public health action, England 2017
Year Cases Cases with valid data*
Median days delay LQ -UQ
Number with data (%) transferred within 5 days
2015-17 91 84 1 0-3 76 (90) 2017 38 34 1 0-4 30 (88)
* Cases with both a valid date the laboratory reported to PHE, and a valid date of initial report by LEICSS to the HPT; LQ – Lower Quartile, UQ – Upper Quartile
Occurrence and trends of cases of lead exposure in children
Count and detection rate (by LEICSS) of cases by PHE Centre and year
The number of cases detected by LEICSS from any source increased by 82% from 2016 (see table 4). This increase was seen in London and the South East, the North West and Yorkshire and the Humber. The most likely reasons for this are increased testing of children at risk, and increased case reporting by laboratories as the surveillance system becomes more established, rather than a change in the number of children exposed to lead hazards. Additionally, the total cases each year is a relatively small number, and is therefore prone to change due to random variation, meaning longer observation is required to confirm a trend. The average rate for England 2015-17 was 3.64 cases per million per year. Regional average (2015-17) detection rates varied more than 30-fold: the highest rate was in Yorkshire and the Humber (11.99 cases per million), and the lowest in the East Midlands (0.38 cases per million).
Note regarding detection rate: As lead exposure often causes few or non-specific symptoms, a proportion of cases of lead exposure will remain un-detected by surveillance of clinical cases. International population surveys, which most accurately estimate the number of children exposed to lead suggest we may expect a higher incidence of cases of paediatric lead exposure than we have detected [7,8]. The figures above are not therefore a reliable indicator of the incidence of new cases of lead exposure. Factors affecting how completely cases are ascertained will likely also explain variation in case ascertainment between regions (and therefore variation in detection rates). For instance, PHE are aware of a system introduced by Leeds SAS laboratory (based in Yorkshire and Humber) to actively prompt clinicians to consider testing for lead exposure in children whose blood is being tested for suspected iron deficiency, where that child is also known to have pica [13]. There is also active engagement of local clinicians by this laboratory. This may explain the much higher case incidence in Yorkshire and Humber compared to the national average, suggesting that differences in clinician awareness and testing rate strongly influence case ascertainment by the surveillance system, potentially more than differences in the frequency of lead hazards in the environment between regions. Testing of cases in laboratories not reporting cases to LEICSS may also explain part of the regional variation in case ascertainment, though it is expected SAS labs perform the large majority of BLC tests in children in England. Non-reporting of cases by participating laboratories may also have (more rarely) occurred. Irregular case entry onto HPZone may have prevented some cases being detected by our search, though cases first notified to LEICSS are entered using a standard procedure. Estimating area-specific testing rates would aid the interpretation of case detection rates, but is difficult given the supra-regional catchment of SAS laboratories.

Lead Exposure in Children Surveillance System (LEICSS) annual report, 2017 Health Protection Report Volume 12 Number 39
9
Table 4. Count and percentage of cases, and average detection rate† of cases (per million 0-15 year old children) by PHE Centre and year of notification, England 2015-2017
Region Cases 2015
(%) Cases 2016
(%) Cases 2017
(%) Cases
2015-17 (%)
Average detection rate‡ of cases (per million per year)
2015-17
South East* 5 (16) 0 (0) 4 (8) 9 (8) 1.81
London* 5 (16) 7 (21) 11 (22) 23 (20) 4.27
South West 2 (6) 0 (0) 2 (4) 4 (3) 1.38
West Midlands*
2 (6) 3 (9) 3 (6) 8 (7) 2.35
East Midlands 1 (3) 0 (0) 0 (0) 1 (1) 0.38
North West 4 (13) 6 (18) 11 (22) 21 (18) 5.12
North East 1 (3) 0 (0) 1 (2) 2 (2) 1.43
Yorkshire and the Humber*
9 (28) 12 (36) 16 (32) 37 (32) 11.99
East of England 3 (9) 5 (15) 2 (4) 10 (9) 2.70
ENGLAND 32 33 50 115 3.64
† Should not be interpreted as an estimate of incidence – see Note Regarding Detection Rate (page 8); ‡ The numerator for this indicator is incident cases in 2015-17, and the denominator is the summed mid-year estimate of the 0-15 population for 2016 multiplied by 3. Cases allocated to PHE Centre according to postcode of residence; * PHE Centres where an SAS laboratory that participates in the surveillance system is situated.
Count and detection rate of cases by gender and age
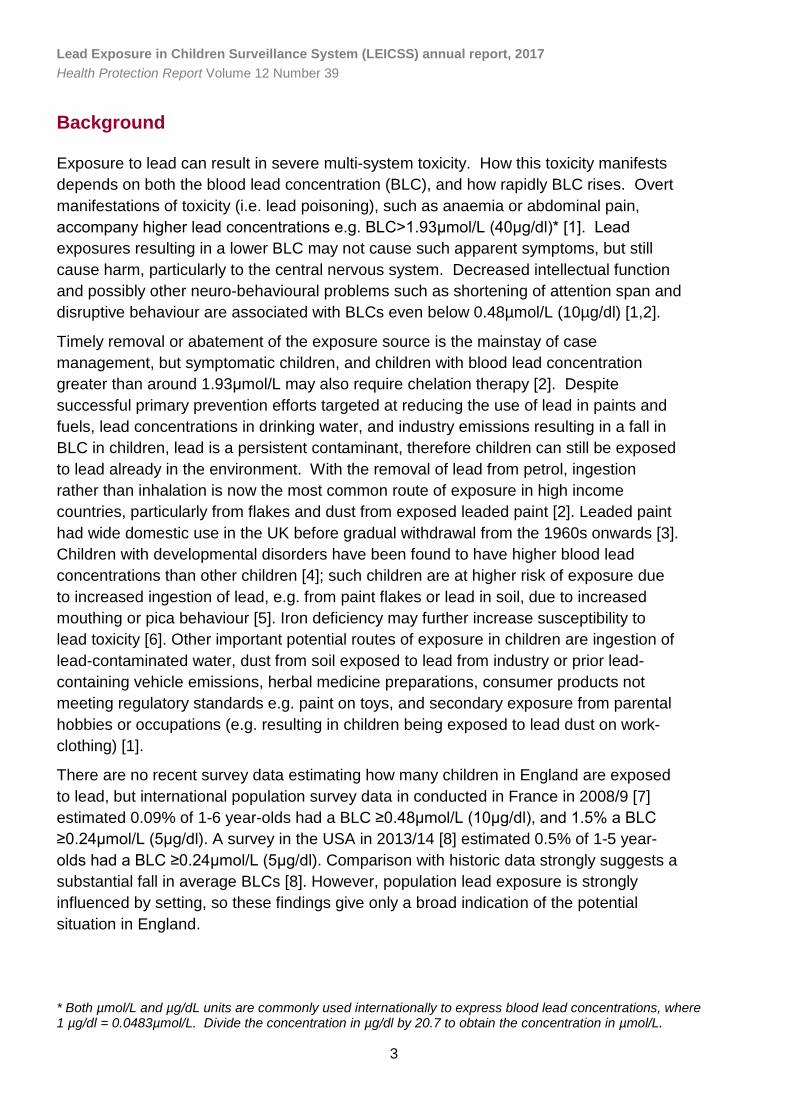
The large proportion (70%) of cases in 2017 were male, a finding in keeping with the 2015-17 average (70%) (see table 5). Males had higher detection rates than females in the same age groups (see figure 1). This gender disparity is also evident in some international survey findings [8], and may reflect a pre-disposition for males to behaviours or comorbidities that result in lead exposure (such as autism [14], itself associated with pica [15]), or a greater susceptibility to lead toxicity, and hence clinical presentation [16].

Lead Exposure in Children Surveillance System (LEICSS) annual report, 2017 Health Protection Report Volume 12 Number 39
10
Table 5. Count and percentage of cases by sex, 2017 and 2015-17 Sex Count of cases 2017 (%) Count of cases 2015-17 (%)
Female 15 (30) 31 (27)
Male 35 (70) 80 (70)
Unknown 0 (0) 4 (4)
Total 50 115 The majority (60%) of cases were of one to four years old in 2017, slightly higher than the three-year average (56%), and the detection rate was highest in 1-4 year olds of either gender (see table 6 and figure 1). Cases in 5-11 years olds made up the next largest percentage (36% in 2017, 38% for 2015-17). There were very few cases in the youngest and oldest age groups. The high percentage of cases in pre-school age children may reflect a greater vulnerability to lead exposure due to mouthing behaviours, as ingestion of lead containing substances (particularly from deteriorating paint) is likely the predominant route of exposure in children [2], and mouthing behaviour is common in this age group. Alternatively, children in this age group may be tested more frequently.
Table 6. Count and percentage of cases by age* group, England, for 2017 and 2015-2017 Age group Count of cases 2017 (%) Count of cases 2015-17 (%)
Under 1 year 0 (0) 3 (3)
1-4 years 30 (60) 64 (56)
5-11 years 18 (36) 43 (38)
12-15 years 2 (4) 5 (4)
Unknown 0 0
Total 50 115 * Age at date of initial report to HPT, or date of entry onto HPZone if this is missing
Lead Exposure in Children Surveillance System (LEICSS) annual report, 2017 Health Protection Report Volume 12 Number 39
11
Figure 1. Average case age-gender* specific detection rate† per million 0-15 year old children per year, England 2015-2017 (n=111 cases with gender and age data)
†The numerator for this indicator is the count of age-gender specific incident cases in 2015-17, and the denominator is the summed mid-year estimate of the age-gender specific 0-15 year old population for 2016 multiplied by 3; *Age at date of initial report to HPT, or date of onset if this is missing
*Age at date of initial report to HPT, or date of entry onto HPZone if this is missing
* Age at date of initial report to HPT, or date of entry onto HPZone if this is missing; † The numerator for this indicator is incident cases in 2015-17, and the denominator is the summed mid-year estimate of the 0-15 population for 2016 multiplied by 3.
Count and percentage of cases by quintile of index of multiple deprivation (IMD) status
IMD provides a measure of deprivation, evaluated across seven domains*, and measured at the area-level. Most (66%) of cases in 2017 lived in areas in the two lowest quintiles of IMD, a percentage similar to the three year average (69%) (see table 7). This is in excess of the expected percentage of cases were it to be similar to the national percentage of the 0-15-year-old population in these two quintiles (45%)**. These observations are similar to patterns of lead exposure by socioeconomic status in US national survey data [8], and may reflect greater exposure to lead containing hazards, a higher frequency of co-morbidities (e.g. iron deficiency anaemia) or other factors pre-disposing to lead toxicity, and/or a greater tendency for clinician testing of children from deprived areas.
* See https://www.gov.uk/government/statistics/english-indices-of-deprivation-2015.
** Calculated using ONS mid-year estimate populations for England, assigned to deciles of IMD 2015: https://www.ons.gov.uk/peoplepopulationandcommunity/birthsdeathsandmarriages/deaths/adhocs/006518deathsandpopulationsbyindexofmultipledeprivationimddecileenglandandwales2001to2015.
1.36
4.01
10.13
2.91
4.95
1.60

Lead Exposure in Children Surveillance System (LEICSS) annual report, 2017 Health Protection Report Volume 12 Number 39
12
Table 7. Count and percentage of cases by quintile of index of multiple deprivation*, England 2017 and 2015-17
* Index of multiple deprivation (IMD) assigned to the Lower-level Super Output Area of the cases’ residential postcode, using IMD scores from 2015
Blood lead concentrations of laboratory-detected cases
The median blood lead concentration (BLC) in 2017 was 0.68 μmol/L, and 0.78 μmol/L in 2015-17 (see table 8). The large majority (93% - data not shown) of blood lead concentrations were <1.93μmol/L in 2015-2017, a concentration most consistent with either being asymptomatic, or with non-specific neuro-behavioural clinical manifestations [1], indicating these children were detected based on high index of clinical suspicion.
Index of Multiple Deprivation Quintile
Count of cases 2017 (%) Count of cases 2015-17 (%)
1. Least Deprived 3 (6) 8 (7)
2. 4 (8) 9 (8)
3. 10 (20) 19 (17)
4. 9 (18) 22 (19)
5. Most deprived 24 (48) 57 (50)
Unknown 0 0
Total 50 115

Lead Exposure in Children Surveillance System (LEICSS) annual report, 2017 Health Protection Report Volume 12 Number 39
13
Table 8. Blood lead concentration (μmol/L) of laboratory-detected cases, England 2017 and 2015-2017
Year Cases
with data / total
cases Min.* Max. Median Lower
Quartile Upper
Quartile Mean
2017 38 / 38 0.48 3.33 0.68 0.52 1.02 0.96
2015-17 95 / 95** 0.48 17.59 0.78 0.55 1.09 1.13
* Only children with a BLC≥0.48μmol/L were eligible for notification to LEICSS; ** Includes 4 HPZone detected cases subsequently reported to LEICSS by participating laboratories with blood lead specimen dates prior to/on the same day as date of report to PHE HPTs.
Children whose death was attributed to lead exposure
This information is taken from data extracted from the PHE HPZone case management system to the LEICSS dataset. Only deaths attributed partly or wholly to lead exposure are shown, and only in cases that meet the LEICSS case definitions. Case information was also corroborated with the investigating HPT. In the period of 2015-2017, PHE HPTs recorded 1 death in a child in England partly or wholly attributed to lead exposure. A case report has since been published, showing the death occurred in a two-year-old boy with pica and iron deficiency who had ingested lead-containing paint, resulting in acute lead toxicity [13]. Lack of clinician awareness of the association between pica and lead exposure was cited as a root cause of the delayed diagnosis and subsequent death of the child. Previous research has shown deaths from lead exposure in children to be very infrequent in England [17].

Lead Exposure in Children Surveillance System (LEICSS) annual report, 2017 Health Protection Report Volume 12 Number 39
14
Duration of case investigation
Most cases that had been concluded by the time of this report required at least 13 weeks of investigation by HPTs before closure. There was no difference between the 2017 investigation duration and 2015-17 median duration of investigation.
Table 9. Duration, in weeks, of the public health investigation of cases* reported to the surveillance system, England 2017 and 2015-17
Year Closed Cases/Total cases Median duration (weeks) 2017 (LQ-UQ)
2015-17 102/115 13 (5-23) 2017 44/50 13 (5-23)
* Period between date of report to HPT and date case closed on HPZone, cases must have been closed at date of data extraction from HPZone; LQ – Lower Quartile; UQ – Upper Quartile.
System developments
Public health action level (and laboratory reporting level)
The public health action level has been lowered over time to reflect both the gradual decline in population exposure, and the changing knowledge that lead exposure in children is associated with toxicity at very low blood concentrations. We now know that that lead exposure is associated with neuro-behavioural impairments at blood concentrations of 0.24μmol/L (5μg/dl) and even lower [1,18]. Lowering the action level would follow international precedent set by recommendations in the USA [19], Australia [20], Germany [21], France [22] and Wales [23], and would offer benefits of case management to more affected children and communities. However, PHE would need to review the evidence to be clear how children and communities would benefit from a lower action level, which children would benefit most, and what action level to choose. Additionally, the likely increase in cases notified will result in resource requirements that would need to be planned for. The LEICSS steering group has therefore decided to consider the feasibility, evidence and arguments for lowering the public health action level and laboratory reporting BLC from 0.48μmol/L (10μg/dl).
Invitation of further laboratories to participate in surveillance
PHE is writing to laboratories in the UK National External Quality Assessment Scheme for Trace Elements (which includes measurement of blood lead concentration) to invite them to participate in case reporting to LEICSS.

Lead Exposure in Children Surveillance System (LEICSS) annual report, 2017 Health Protection Report Volume 12 Number 39
15
Data sharing agreement
We are introducing a new case notification form and a data sharing agreement with participating laboratories. We are also introducing new procedures to enter laboratory data onto HPZone and extract it for analysis. This will remove the need for the current separate laboratory dataset, and should improve laboratory data recording quality.
Recommendations
For the LEICSS steering and working group
• introduce a new case notification form and data sharing agreement with laboratories, and new procedures to record laboratory data directly into HPZone and extract it for analysis. These measures should improve laboratory data recording quality
• introduce methods to extract and collate information from the detailed exposure questionnaires conducted on lead exposure cases by investigating HPTs, in order to collect and analyse data on other potentially important case factors
• survey participating laboratories as to whether they offer laboratory-based systems to prompt clinicians to test for lead exposure in children, or undertake awareness raising activities in their area, for example as implemented in Leeds SAS laboratory [13]
• monitor the developing evidence on laboratory-based systems to prompt testing of children at high risk of lead exposure, for example as implemented in Leeds SAS laboratory [13]
• continue to encourage further laboratories to participate in the surveillance system
• consider the evidence and arguments for lowering the public health action level and laboratory reporting BLC to ≥0.24μmol/L (5μg/dl)
• develop methods to calculate and describe rates of BLC testing by time, place and person
• share the findings of this report with the Royal College of Paediatrics and Child Health, and Royal College of General Practitioners to raise awareness amongst paediatricians and GPs
• develop a broader group of consulting stakeholders including clinical and lay (parent and guardian) representatives.
For laboratories
• participating laboratories should always notify cases to LEICSS by emailing the case notification form to [email protected]
• laboratories interested in participating in the surveillance system should also email [email protected] to express their interest.

Lead Exposure in Children Surveillance System (LEICSS) annual report, 2017 Health Protection Report Volume 12 Number 39
16
For PHE Health Protection Teams
• be aware that there is likely a large variation in clinician awareness, testing and reporting practice for lead exposure in children
• determine which laboratories test for lead exposure in children in their population, and whether the laboratory participates in lead surveillance
• share this report with local paediatricians and GPs to raise awareness of sources of lead exposure, children at most risk, and presenting symptoms/signs of exposure (see box below)
• encourage clinicians to notify them of children with BLC at or above the public health action level of 0.48μmol/L (10μg/dl).
For clinicians
• be aware of the most important sources of lead exposure in children (see box, below)
• be aware of the children at most risk of lead exposure (see box, below), and have a low threshold for screening these children for lead exposure if they may have been exposed to lead hazards
• educate parents/guardians of children at risk about prevention of lead exposure • consider lead exposure as a potential diagnosis in children presenting with
symptoms/signs of acute or chronic lead exposure (see box) • be aware of PHE’s role in managing cases, how to report a case, and of the
case management and surveillance benefits of reporting cases to PHE. See the Other Resources section, below, for details of how to report a case of lead exposure, and for resources offering further guidance on case management.

Lead Exposure in Children Surveillance System (LEICSS) annual report, 2017 Health Protection Report Volume 12 Number 39
17
Sources of lead exposure in children, children at most risk of exposure, and presentations of lead exposure in children
Important sources of lead exposure in children Deteriorating leaded paint (particularly houses built prior to early 1970s). Consumer products (if unregulated): medicines, ceramic cookware, toys. Parental hobbies or occupations (including dust on clothing). Lead water pipes (particularly houses built prior to early 1970s). Contaminated soil/land. Children at most risk of lead exposure Children with pica or increased hand to mouth behaviour (e.g. children with autism or global developmental delay), particularly with iron deficiency. Children who have recently migrated from countries with less regulation to prevent lead exposure. Presentations of lead exposure in children Acute exposure resulting in high BLC: anorexia, abdominal pain, constipation, irritability and reduced concentration, encephalopathy. Chronic exposure: lower BLCs - mild cognitive and behavioural impairments, may contribute to global developmental delay; Higher BLCs - reduced appetite, abdominal pain, constipation, anaemia.

Lead Exposure in Children Surveillance System (LEICSS) annual report, 2017 Health Protection Report Volume 12 Number 39
18
References
1. World Health Organization (2010). Childhood Lead Poisoning.
2. Lead Exposure in Children: Prevention, Detection, and Management (2005).
Pediatrics. 116(4): 1036-46.
3. Johnson L, Barlow PJ, Barratt RS (1984). Lead in Paint - Brushed Aside?
Perspectives in Public Health. 104 (2): 64-7.
4. Lewendon G, Kinra S, Nelder R, Cronin T (2001). Should children with
developmental and behavioural problems be routinely screened for lead? Archives of
Disease in Childhood. 85(4): 286.
5. Centers for Disease Control (1991). Suggested priorities for screening (chapter 6),
https://wonder.cdc.gov/wonder/prevguid/p0000029/p0000029.asp.
6. Kwong WT, Friello P, Semba RD (2004). Interactions between iron deficiency and
lead poisoning: epidemiology and pathogenesis. Science of the Total Environment. 330(1):
21-37.
7. Etchevers A, Bretin P, Lecoffre C, Bidondo ML, Le Strat Y, Glorennec P, et al
(2014). Blood lead levels and risk factors in young children in France, 2008-2009.
International Journal of Hygiene and Environmental Health. 217(4-5): 528-37.
8. Tsoi M-F, Cheung C-L, Cheung TT, Cheung BMY (2016). Continual Decrease in
Blood Lead Level in Americans: United States National Health Nutrition and Examination
Survey 1999-2014. The American Journal of Medicine. 129(11): 1213-8.
9. Bazian Ltd (2018). Screening for elevated blood lead levels in asymptomatic
children aged 1 to 5 years. External review against programme appraisal criteria for the
UK National Screening Committee (UK NSC).
10. Public Health England and British Paediatric Surveillance Unit (2018). Surveillance
of elevated blood lead in children (SLiC): a British Paediatric Surveillance Unit analysis.
11. Crabbe H, Dabrera G, Close R, Morris J, Keshishian C, Leonardi G, Ruggles R
(2016). Lead poisoning in children; evaluation of a pilot surveillance system in England,
2014-15. Abstracts of the 2016 Conference of the International Society of Environmental
Epidemiology (ISEE, ID: 3829).
12. Public Health England. Lead Action Card - Chronic Exposures 2016 [Available from:
http://phenet.phe.gov.uk/Resources/duty-doctors/Environmental-
hazards/Chemical%20resources/Lead-action-card-chronic-exposures.pdf.
13. Talbot A, Lippiatt C, Tantry A (2018). Lead in a case of encephalopathy. BMJ Case
Reports.

Lead Exposure in Children Surveillance System (LEICSS) annual report, 2017 Health Protection Report Volume 12 Number 39
19
14. Loomes R, Hull L, Mandy WPL (2017). What is the male-to-female ratio in autism
spectrum disorder? A systematic review and meta-analysis. Journal of the American
Academy of Child & Adolescent Psychiatry 56(6): 466-74.
15. Matson JL, Belva B, Hattier MA, Matson ML (2011). Pica in persons with
developmental disabilities: characteristics, diagnosis, and assessment. Research in
Autism Spectrum Disorders 5(4): 1459-64.
16. Jedrychowski W, Perera F, Jankowski J, Mrozek-Budzyn D, Mroz E, Flak E, et al
(2009). Gender specific differences in neurodevelopmental effects of prenatal exposure to
very low-lead levels: the prospective cohort study in three-year olds. Early Human
Development 85(8): 503-10.
17. Elliott P, Arnold R, Barltrop D, Thornton I, House IM, Henry JA (1999). Clinical lead
poisoning in England: an analysis of routine sources of data. Occupational and
Environmental Medicine 56(12): 820.
18. Lanphear B, Hornung, R., Khoury J, Yolton K, Baghurst P, Bellinger DC,
CanfieldRL, Dietrich KN, Bornschein R, Greene T, Rothenberg SJ, Needleman HL,
Schnaas L, Wasserman G, Graziano J, Roberts R (2005). Low-level environmental lead
exposure and children’s intellectual function: an international pooled analysis.
Environmental Health Perspectives. 113: 894-9.
19. Centers for Disease Control and Prevention (2012). CDC response to Advisory
Committee on Childhood Lead Poisoning Prevention recommendations. In: “Low level lead
exposure harms children: a renewed call of primary prevention”,
https://www.cdc.gov/nceh/lead/acclpp/blood_lead_levels.htm.
20. National Health and Medical Research Council [Canberra] (2016). Managing
individual exposure to lead in Australia - a guide for health practitioners.
21. Schulz C, Angerer J, Ewers U, Heudorf U, Wilhelm M (2009). Revised and new
reference values for environmental pollutants in urine or blood of children in Germany
derived from the German environmental survey on children 2003-2006 (GerES IV).
International Journal of Hygiene and Environmental Health 212(6): 637-47.
22. Verrier A (2016). Confirmation of blood lead concentration reference values used in
France (Personal communication to Crabbe H).
23. Jones S (2017). Confirmation of blood lead protocol in children in Wales (Personal
communication to Roberts DJ).

Lead Exposure in Children Surveillance System (LEICSS) annual report, 2017 Health Protection Report Volume 12 Number 39
20
Other resources
Steering and working group members
Steering group
Name Organisation
Robie Kamanyire Public Health England Environmental Hazards and Emergencies
Kerry Foxall Public Health England Toxicology
Alan Emond University of Bristol
Susan Hodgson Imperial College
Sally Bradberry City Hospital, Birmingham
Kishor Raja Supra-regional Assay Service Trace Elements laboratories
Further PHE resources for the public health management of cases of lead exposure:
• Lead pages in the Chemicals Compendium https://www.gov.uk/government/publications/lead-properties-incident-management-and-toxicology
• Lead action card (PHE login required) http://phenet.phe.gov.uk/Resources/duty-doctors/Environmental-hazards/Chemical%20resources/Lead-action-card-chronic-exposures.pdf
Resources for clinicians: • Clinicians with clinical lead exposure queries should consult
TOXBASE or call the National Poisons Information Service, see https://www.toxbase.org/
Contacts: • To notify cases (participating labs only): [email protected] • General enquiries: [email protected] • To notify cases (direct to a Health Protection Team) find the
relevant Health Protection Team using the residential postcode of the case: https://www.gov.uk/health-protection-team

Lead Exposure in Children Surveillance System (LEICSS) annual report, 2017 Health Protection Report Volume 12 Number 39
21
Working group
Name Organisation
Araceli Busby (surveillance lead)
Public Health England North East North Central London Health Protection Team
Shanel Reshat Public Health England North East North Central London Health Protection Team
Giovanni Leonardi Public Health England Environmental Epidemiology
Helen Crabbe Public Health England Environmental Epidemiology
Harriet Gordon-Brown Public Health England Environmental Epidemiology
David J Roberts Public Health England Environmental Epidemiology
Tayo Owodunni Public Health England Environmental Epidemiology
Acknowledgement to laboratories
Supra-regional Assay Services Trace Elements laboratories
Birmingham.
Leeds.
Southampton.
Guildford.
London Charing Cross.
London Kings.
Other laboratories notifying cases included in this report
The Doctors’ Laboratory, London.
Cardiff Toxicology Laboratories.

Lead Exposure in Children Surveillance System (LEICSS) annual report, 2017 Health Protection Report Volume 12 Number 39
22
About Public Health England Public Health England exists to protect and improve the nation’s health and wellbeing, and reduce health inequalities. We do this through world-class science, knowledge and intelligence, advocacy, partnerships and the delivery of specialist public health services. We are an executive agency of the Department of Health and Social Care, and are a distinct delivery organisation with operational autonomy to advise and support government, local authorities and the NHS in a professionally independent manner.
About Health Protection Report
Health Protection Report is a national public health bulletin for England and Wales, published by Public Health England. It is PHE’s principal channel for the dissemination of laboratory data relating to pathogens and infections/communicable diseases of public health significance and of reports on outbreaks, incidents and ongoing investigations. Public Health England, Wellington House, 133-155 Waterloo Road, London SE1 8UG Tel: 020 7654 8000 www.gov.uk/phe Twitter: @PHE_uk Facebook: www.facebook.com/PublicHealthEngland
Queries relating to this document should be directed to: Environmental Public Health Tracking, Environmental Epidemiology Team, Chemical and Environmental Effects Department, Centre for Radiation Chemical and Environmental Hazards, Public Health England, Chilton, OX11 0RQ. Email: [email protected]
© Crown copyright 2018 You may re-use this information (excluding logos) free of charge in any format or medium, under the terms of the Open Government Licence v3.0. To view this licence, please visit: OGL or email: [email protected]. Where we have identified any third party copyright information you will need to obtain permission from the copyright holders concerned. Published: November 2018. PHE publications PHE supports the UN gateway number: 2018562 Sustainable Development Goals