le6 aggregate planning - zoominzoomin.idt.mdh.se/course/ppu411/documents/le6_aggregate...
TRANSCRIPT

2017-04-25
1
Antti Salonen
PPU411
1Antti Salonen
What is Aggregate Planning?
Aggregate (or intermediate-term) planning is the process of determining a company´s aggregate plan = production plan.
The aggregate plan specifies how the company will use their existing facilities and equipment most efficiently to reach their goals and satisfy demand.
Capacity expansion is normally achieved though the use of overtime, subcontracting or adding work shifts.
2Antti Salonen
Sales and Operations Plan
Operations planning and scheduling is the process of making sure that demand and supply plans are in balance at all levels!
3Antti Salonen
2017-04-25
2
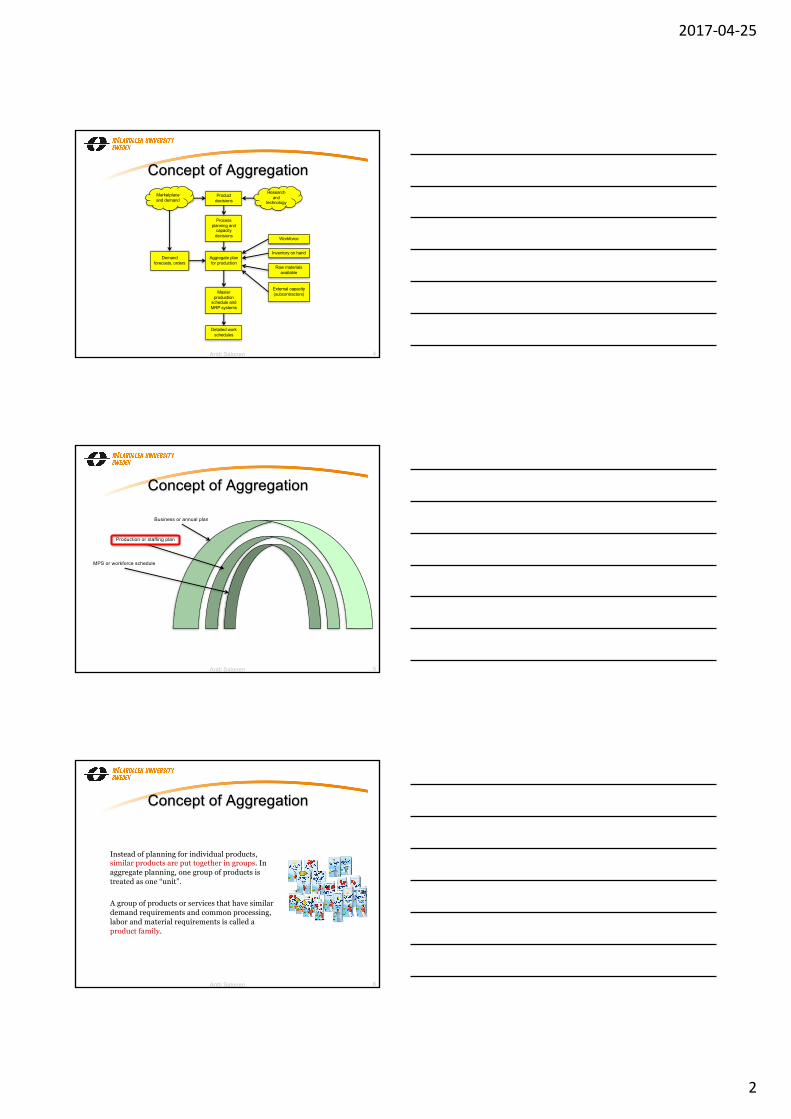
Concept of AggregationProduct
decisions
Workforce
Inventory on hand
External capacity(subcontractors)
Raw materials available
Demandforecasts, orders
Detailed workschedules
Master production
schedule and MRP systems
Aggregate plan for production
Process planning and
capacitydecisions
Research and
technology
Marketplaceand demand
4Antti Salonen
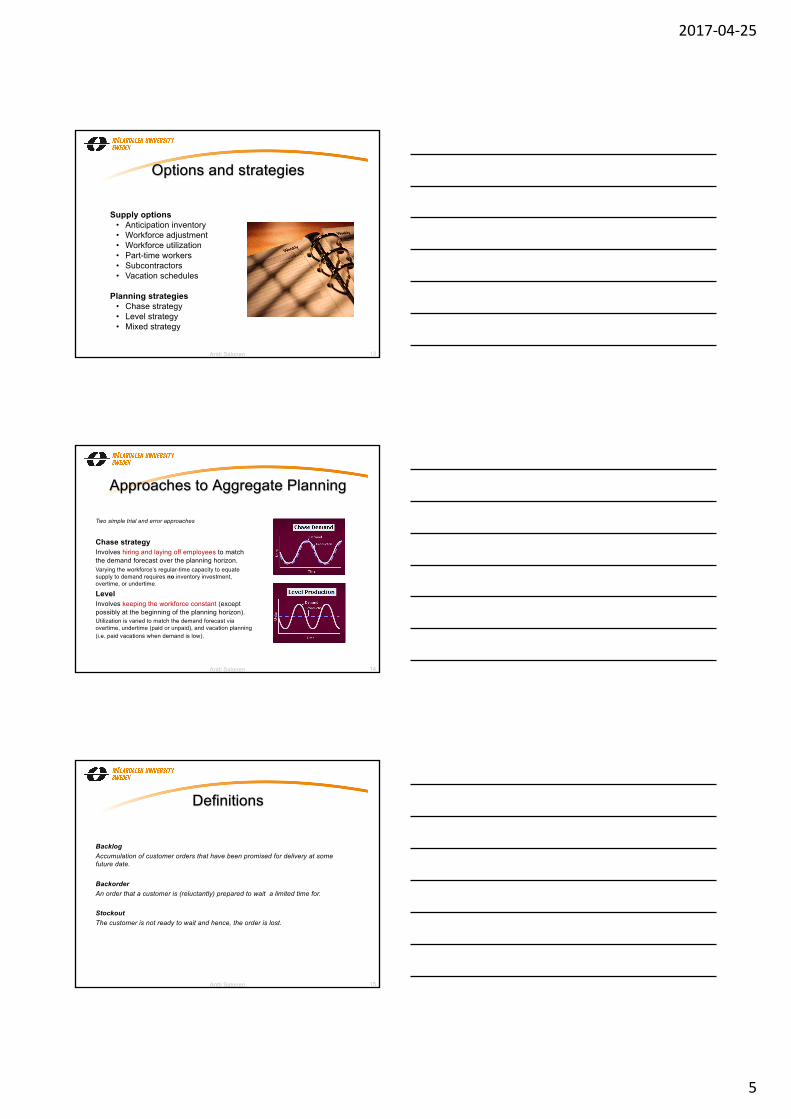
Concept of Aggregation
Business or annual plan
Production or staffing plan
MPS or workforce schedule
5Antti Salonen
Concept of Aggregation
Instead of planning for individual products, similar products are put together in groups. In aggregate planning, one group of products is treated as one “unit”.
A group of products or services that have similar demand requirements and common processing, labor and material requirements is called a product family.
6Antti Salonen

2017-04-25
3
Concept of Aggregation
Product family
Product type
Item
7Antti Salonen
Concept of Aggregation
If demand was absolutely certain, aggregate planning would not be needed. Company could develop a production process and a workforce level that would produce exactly the amount of product needed every month in a repeating cycle while maintaining almost no inventories.
However, in real life demand is uncertain, but so is capacity (e.g. workforce level), materials prices etc.
Þ Aggregate Planning is a dynamic process that requires constant updating!
8Antti Salonen
The Process of Aggregation
Determine requirementsfor planning horizon
No
Yes
Implement and uppdate the plan
Prepare prospective plan for planning horizon
Identify alternatives, constraints and costs
Move ahead to nextplanning session
Is the plan acceptable?
9Antti Salonen

2017-04-25
4
The Process of Aggregation
Step 1: New planning horizon! Update files with actual sales, production, inventory, costs, and constraints.
Step 2: Participate in the forecasting and demand planning to create the authorized demand forecasts, e.g. staff requirements.
Step 3: Update the sales and operations planning spreadsheet for each family, recognizing relevant constraints and costs including e.g. availability of materials from suppliers, machine capacities, or limited storage space.
10Antti Salonen
The Process of Aggregation
Step 4: Have one or more consensus meetings with the stakeholders on how best to balance supply with demand.
Step 5: Present recommendations by product family at the executive S&OP meeting,.
Step 6: Update the spreadsheets to reflect the authorized plan, and communicate the plans to the important stakeholders for implementation.
11Antti Salonen
Inventory Control Systems
• Independent demandItems for which demand is influenced by market conditions and is not related to the inventory decisions for any other item held in stock or produced.
• Dependent demandItems required as components or inputs to a service or product. Dependent demand exhibits a pattern very different from that of independent demand and must be managed with different techniques. (will be covered in upcoming lectures)
12Antti Salonen
2017-04-25
5
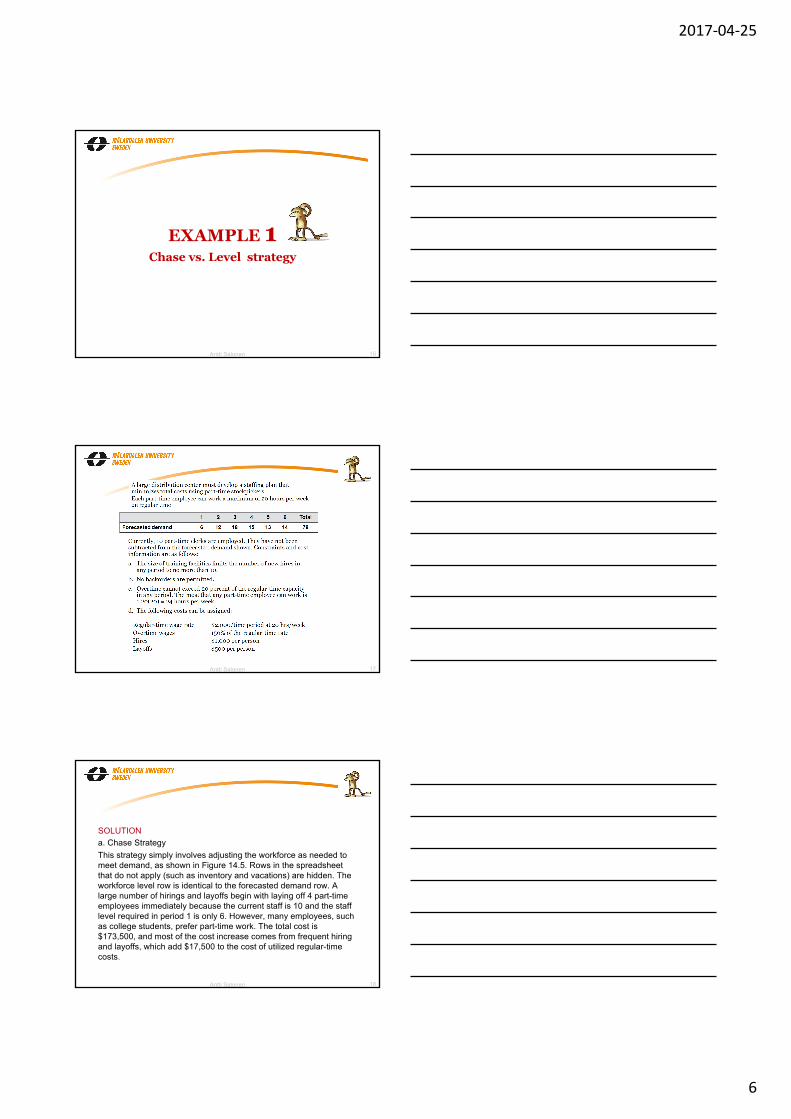
Options and strategies
Supply options• Anticipation inventory• Workforce adjustment• Workforce utilization• Part-time workers• Subcontractors• Vacation schedules
Planning strategies• Chase strategy• Level strategy• Mixed strategy
13Antti Salonen
Approaches to Aggregate Planning
Two simple trial and error approaches
Chase strategyInvolves hiring and laying off employees to match the demand forecast over the planning horizon.Varying the workforce’s regular-time capacity to equate supply to demand requires no inventory investment, overtime, or undertime.
LevelInvolves keeping the workforce constant (except possibly at the beginning of the planning horizon).Utilization is varied to match the demand forecast via overtime, undertime (paid or unpaid), and vacation planning (i.e. paid vacations when demand is low).
14Antti Salonen
Definitions
BacklogAccumulation of customer orders that have been promised for delivery at some future date.
BackorderAn order that a customer is (reluctantly) prepared to wait a limited time for.
StockoutThe customer is not ready to wait and hence, the order is lost.
15Antti Salonen
2017-04-25
6
EXAMPLE 1Chase vs. Level strategy
16Antti Salonen
17Antti Salonen
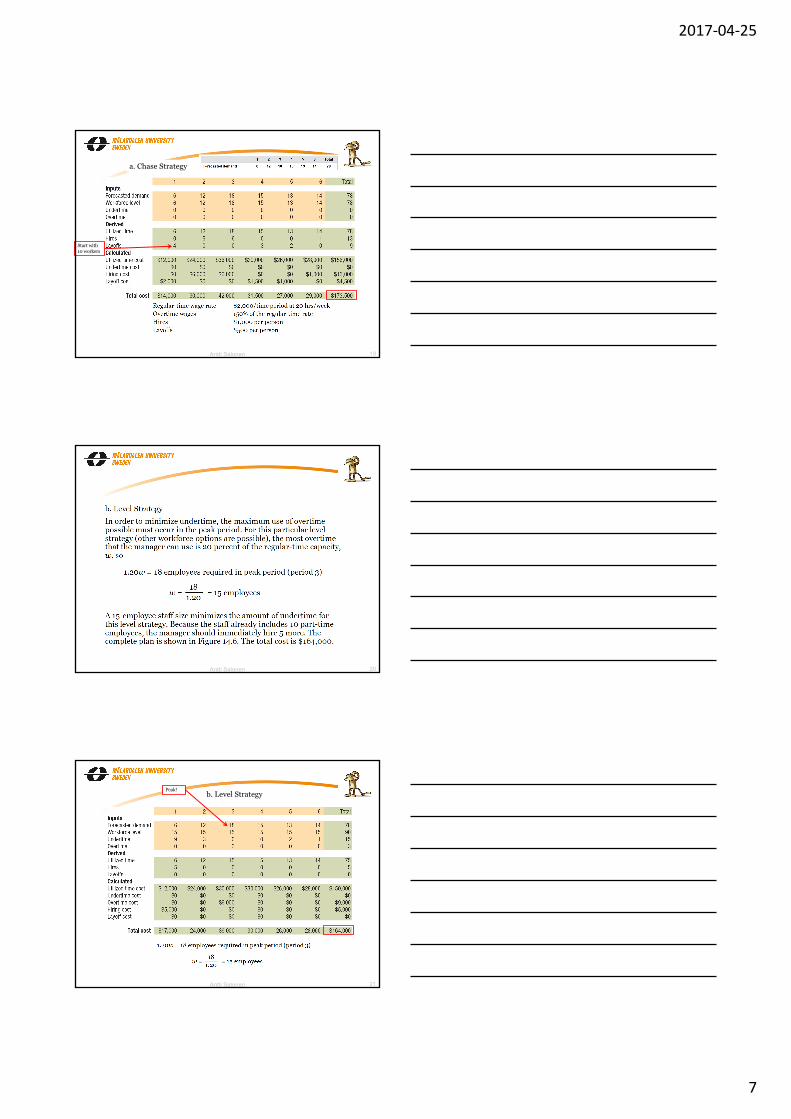
SOLUTIONa. Chase StrategyThis strategy simply involves adjusting the workforce as needed to meet demand, as shown in Figure 14.5. Rows in the spreadsheet that do not apply (such as inventory and vacations) are hidden. The workforce level row is identical to the forecasted demand row. A large number of hirings and layoffs begin with laying off 4 part-time employees immediately because the current staff is 10 and the staff level required in period 1 is only 6. However, many employees, such as college students, prefer part-time work. The total cost is $173,500, and most of the cost increase comes from frequent hiring and layoffs, which add $17,500 to the cost of utilized regular-time costs.
18Antti Salonen
2017-04-25
7
a. Chase Strategy
Start with 10 workers
19Antti Salonen
20Antti Salonen
b. Level StrategyPeak!
21Antti Salonen

2017-04-25
8
EXAMPLE 2Chase and Level strategy
22Antti Salonen
Quarter Aggregatedemand1 10,0002 12,0003 9,0004 11,000
A General Motors Buick plant manufactures several Buick models. The company has forecast its quarterly demands during the next four quarters, which is listed below. The plant can produce approximately 25 autos per quarter for each worker on staff. Workers receive an average of $15,000 per quarter in wages and benefits, and it costs $7,000 to hire and train a new worker and $10,000 to lay off a worker. Workers can be hired or laid off at the beginning of any quarter. GM expects to have 480 workers on staff and 2000 autos in inventory at the end of the current quarter. Any auto held in inventory at the end of a quarter incurs a holding cost of $1,000. Construct an aggregate plan for the next four quarters using the chase and level strategies and compute their total costs.
23Antti Salonen
Quarter Aggregatedemand1 10,0002 12,0003 9,0004 11,000
Chase strategy:
Quarter Aggregatedemand(units)
Planned output(units)
Workers onstaff Workers hired Workers laid off Inventory(units)
0 480 20001 10,000 8,000 320 0 160 02 12,000 12,000 480 160 0 03 9,000 9,000 360 0 120 04 11,000 11,000 440 80 0 0Total (quarters 1-4) 1600 240 280 0
1. Determine the number of workers needed to meet the demand in each quarter (in this example: 25 autos per worker and quarter).
2. Then , adjust the workforce accordingly.
1 2
Salaries: 1600 workers x $15,000/Q = $ 24,000,000Hiring cost: 240 workers x $ 7,000 = $ 1,680,000Layoff cost: 280 workers x $ 10,000 = $ 2,800,000Inventory cost: 0 units x $ 1,000 / unit = $ 0Total cost: = $ 28.480,000
24Antti Salonen
2017-04-25
9
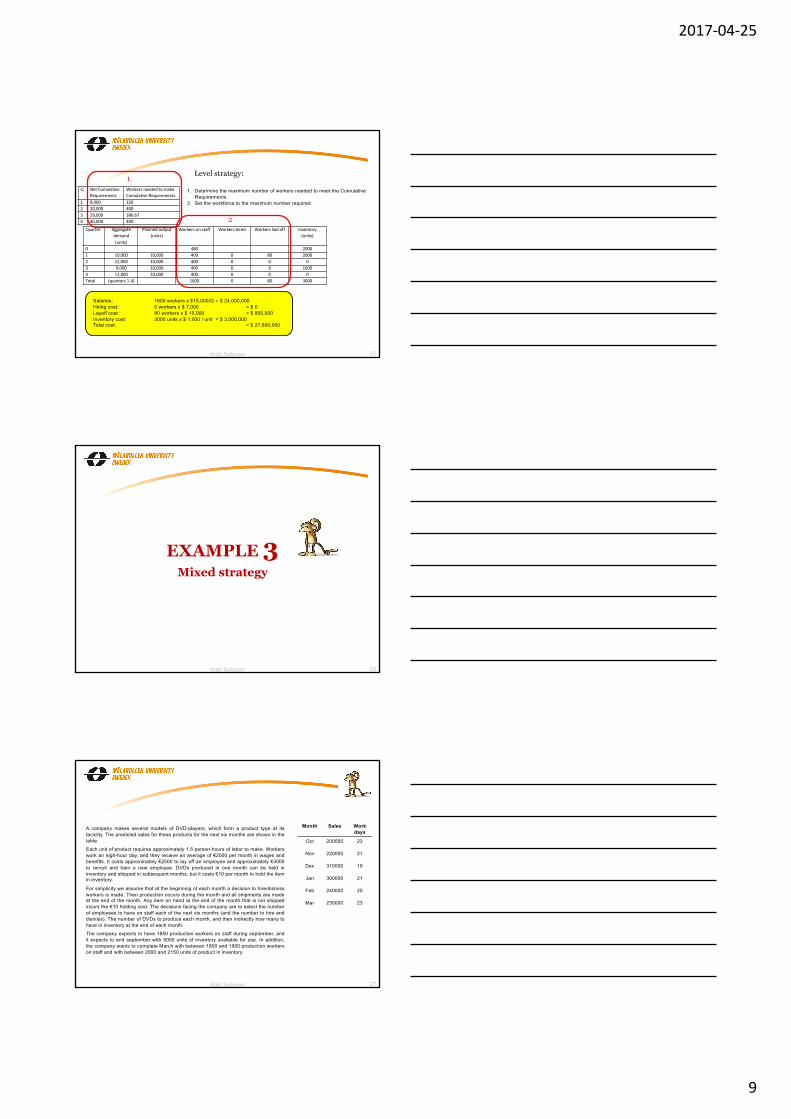
Q NetCumulativeRequirements
Workers needed tomakeCumulative Requirements
1 8,000 3202 20,000 4003 29,000 386.674 40,000 400
Level strategy:
Quarter Aggregatedemand(units)
Planned output(units)
Workers onstaff Workers hired Workers laid off Inventory(units)
0 480 20001 10,000 10,000 400 0 80 20002 12,000 10,000 400 0 0 03 9,000 10,000 400 0 0 10004 11,000 10,000 400 0 0 0Total (quarters 1-4) 1600 0 80 3000
1. Determine the maximum number of workers needed to meet the CumulativeRequirements.
2. Set the workforce to the maximum number required.
1
2
Salaries: 1600 workers x $15,000/Q = $ 24,000,000Hiring cost: 0 workers x $ 7,000 = $ 0Layoff cost: 80 workers x $ 10,000 = $ 800,000Inventory cost: 3000 units x $ 1,000 / unit = $ 3,000,000Total cost: = $ 27,800,000
25Antti Salonen
EXAMPLE 3Mixed strategy
26Antti Salonen
A company makes several models of DVD-players, which form a product type at itsfaciclity. The predicted sales for these products for the next six months are shown in thetable.
Each unit of product requires approximately 1.5 person-hours of labor to make. Workerswork an eigh-hour day, and they recieve an average of €2000 per month in wages andbenefits. It costs approximately €2500 to lay off an employee and approximately €3000to recruit and train a new employee. DVDs produced in one month can be held ininventory and shipped in subsequent months, but it costs €10 per month to hold the itemin inventory.
For simplicity we assume that at the beginning of each month a decision to hire/dismissworkers is made. Then production occurs during the month and all shipments are madeat the end of the month. Any item on hand at the end of the month that is not shippedincurs the €10 holding cost. The decisions facing the company are to select the numberof employees to have on staff each of the next six months (and the number to hire anddismiss). The number of DVDs to produce each month, and then indirectly how many tohave in inventory at the end of each month.
The company expects to have 1850 production workers on staff during september, andit expects to end september with 5000 units of inventory available for use. In addition,the company wants to complete March with between 1800 and 1900 production workerson staff and with between 2000 and 2150 units of product in inventory.
Month Sales Workdays
Oct 200000 23
Nov 220000 21
Dec 310000 19
Jan 300000 21
Feb 240000 20
Mar 230000 23
27Antti Salonen

2017-04-25
10
Chase Strategy
Month Sales Workdays
Oct 200000 23
Nov 220000 21
Dec 310000 19
Jan 300000 21
Feb 240000 20
Mar 230000 23
The company’s net requirements for October are 200000 – 5000 (in inventory) =195000.
The net requirements for later months equal the demand except for March, whichrequires an additional 2000 units for ending inventory.
The number of units that can be produced by an employee each month equals(8h/day x number of work days/month) / (1.5 person-hour/unit) assuming that allworkers produce the maximum number of units each month.
Month A: Net requirements
B: Prod./employee
C = A/BEmployees
Oct 195000 122.67 1590
Nov 220000 112 1965
Dec 310000 101.33 3060
Jan 300000 112 2679
Feb 240000 106.67 2250
Mar 232000 122.67 1892
A
B
C Note that the required number of employees is rounded up to the next integer.
28Antti Salonen
Month No. Of workers
No. Hired
No. Dismissed Net Requirements
Production Endinginventory
Sep 1850 - - - - 5000
Oct 1590 0 260 195000 195045 45
Nov 1965 375 0 220000 220080 125
Dec 3060 1095 0 310000 310080 205
Jan 2679 0 381 300000 300048 253
Feb 2250 0 429 240000 240007 260
Mar 1892 0 358 232000 232092 2352
Apr 1892 - - - - -
Total:(Oct-Mar)
13436 1470 1428 - 3240
Aggregate plan
Total cost for this strategy:Wages: 13436 x 2000=26872000Hiring: 1470 x 3000 = 4410000Dismissal: 1428 x 2500 = 3570000Inventory: 3200 x 10 = 32000Total cost: 34884400
Chase Strategy
29Antti Salonen
Month No. Of workers
No. Hired
No. Dismissed Net Requirements
Production Endinginventory
Sep 1850 - - - - 5000
Oct 1590 0 260 195000 195045 45
Nov 1965 375 0 220000 220080 125
Dec 3060 1096 0 310000 310070 195
Jan 2679 0 381 300000 300048 243
Feb 2250 0 428 240000 240007 250
Mar 1892 0 358 232000 232092 2342
Apr 1892 - - - - -
Total:(Oct-Mar)
13436 1470 1428 - 3240
Aggregate planChase Strategy
30Antti Salonen
Since this number exceeds the capacity of one worker, the number of workers can be
adjusted downwards.
Total cost for this strategy:Wages: 13436 x 2000=26872000Hiring: 1470 x 3000 = 4410000Dismissal: 1428 x 2500 = 3570000Inventory: 3200 x 10 = 32000Total cost: 34884400
2017-04-25
11
Month No. Of workers
No. Hired
No. Dismissed Net Requirements
Production Endinginventory
Sep 1850 - - - - 5000
Oct 1590 0 260 195000 195045 45
Nov 1964 374 0 220000 219968 13
Dec 3060 1096 0 310000 310080 93
Jan 2678 0 382 300000 299936 29
Feb 2250 0 428 240000 240007 36
Mar 1892 0 358 232000 232092 2128
Apr 1892 - - - - -
Total:(Oct-Mar)
13434 1470 1428 - 2344
Aggregate plan
Total cost for this strategy:Wages: 13434 x 2000=26868000Hiring: 1470 x 3000 = 4410000Dismissal: 1428 x 2500 = 3570000Inventory: 2344 x 10 = 23440Total cost: 34871440
Chase Strategy
31Antti Salonen
Also this is adjusted downwards.
Mixed Level/Chase Strategy
A simple way to construct an aggregate plan that keeps personnel adjustments to a minimum is to first compute thenet cumulative requirements for each period; the net requirements summed for all periods in the planning horizon upto that period.
Then, for each month we compute the minimum stable workforce that would be required to produce the net cumulativerequirements up to that point.
Last, we identify the Peak requirements of employees for handling the cumulative production requirements.
Month A: Net cumulativerequirements
B: CumulativeProd./employee
C = A/BEmployees
Oct 195000 122.67 1590
Nov 415000 234.67 1769
Dec 725000 336 2158
Jan 1025000 448 2288
Feb 1265000 554.67 2281
Mar 1497000 677.33 2211
Peak
32Antti Salonen
Month No. Of workers
No. Hired
No. Dismissed Net Requirements
Production Endinginventory
Sep 1850 - - - - 5000
Oct 2288 438 0 195000 280669 85669
Nov 2288 0 0 220000 256256 121925
Dec 2288 0 0 310000 231843 43768
Jan 2288 0 0 300000 256256 24
Feb 2250 0 38 240000 240007 31
Mar 1892 0 358 232000 232092 2123
Apr 1892 - - - - -
Total:(Oct-Mar)
13294 438 396 - 253540
Aggregate plan
Total cost for this strategy:Wages: 13294 x 2000=26588000Hiring: 438 x 3000 = 1314000Dismissal: 396 x 2500 = 990000Inventory: 253540 x 10 = 2535400Total cost: 31427400
Mixed Level/Chase Strategy
33Antti Salonen

2017-04-25
12
Scheduling
Scheduling will be covered in a comming lecture…
34Antti Salonen
Relevant book chapters
• Chapter: “Planning and scheduling operations”:– Operations planning and scheduling across the organization– Stages in operations planning and scheduling– Managing demand– Sales and operations plans
35Antti Salonen
36Antti Salonen
Next session on Thursday 2017-04-27
Workshop
2017-04-25
13
37
Workshop?
The various techniquesTheoretical discussions or questions on
the content of the book chapter.
You need to send me questions in advance, no later than Wednesday 2017-04-26