ldef data: comparisons with existing models … · ldef data: comparisons with existing models...
TRANSCRIPT

LDEF DATA: COMPARISONS WITH EXISTING MODELS
Cassandra Coombs, Alan Watts, John Wagner and Dale Atkinson
POD Associates, Inc.
2309 Renard P1, SE
Suite 201
Albuquerque, NM 87106
ABSTRACT
The relationship between the observed cratering impact damage on the Long Duration
Exposure Facility (LDEF) versus the existing models for both the natural environment of
micrometeoroids _ and the man-made debris: was investigated. Experimental data was provided
by several LDEF Principal Investigators, Meteoroid and Debris Special Investigation Group
(M&D SIG) members, and by the Kennedy Space Center Analysis Team (KSC A-Team)
members. These data were collected from various aluminum materials around the LDEF
satellite. A PC (personal computer) computer program, SPENV, was written which
incorporates the existing models of the Low Earth Orbit (LEO) environment. This program
calculates the expected number of impacts per unit area as functions of altitude, orbital
inclination, time in orbit and direction of the spacecraft surface relative to the velocity vector,
for both micrometeoroids and man-made debris. Since both particle models are couched in
terms of impact fluxes versus impactor particle size, and much of the LDEF data is in the form
of crater production rates, scaling laws have been used to relate the two. Also many
hydrodynamic impact computer simulations were conducted, using CTH _, of various impact
events, that identified certain modes of response, including simple metallic target cratering,
perforations and delamination effects of coatings.
Work performed under contract to Lockheed ESC/NASA Johnson Space Center;
Contract No.: 960-12-171, SC 02N0165768. POD Contract No.: 019201
619
https://ntrs.nasa.gov/search.jsp?R=19930020186 2018-06-10T14:23:32+00:00Z

INTRODUCTION
Since the return of LDEF there has been a continuous gleaning of impact data, from both
the activities of the M&D SIG and from individual PI's. A large number of impact craters have
been studied for almost all possible surface orientations relative to the velocity vector (i.e., the
direction of orbital motion, RAM direction), and cover a wide size range from below 10 _tm to
5.3 ram. The target materials range from AI 6061-T6 frame components (studied in this report)
to various painted surfaces and glasses. The individual craters have been carefully documented
with regard to exact position on the various plates, and flame components (longerons and
intercostals) of LDEF, and each specific impact event has been studied with regard to crater
size, lip dimensions and any associated cracking or delamination (Figures la and lb). The data
have been reduced to the form of impact fluences (hits per unit area, or the integral of the crater
production rates) versus crater diameter for various surface orientations. These data are then
compared with the predictions of the two existing "standard" models for micrometeoroids and
debris fluxes for Low Earth Orbit (LEO).
MODELLING THE PARTICLE ENVIRONMENT
"620
POD has written a PC-based computer code SPENV (SPace ENVironment) which
incorporates the Cour-Palais' model of near-Earth micrometeoroids and the Kessler _ model of
debris in LEO. The code predicts the "impact fluences" (note: we define this term to mean the
time-integrated areal density of impacts) as functions of altitude, orbital inclination, specific
time period in orbit, and orientation of the LDEF surfaces relative to the velocity vector: e.g.,
RAM, SPACE, EARTH, SIDES and TRAIL (Figure 2). In theLDEF terminology of some
these surfaces are EAST, SPACE, EARTH, NORTH & SOUTH, and WEST, respectively.
Since both the micrometeoroid and debris models presently assume symmetry about the
velocity vector the two SIDE predictions are normally identical. However, a small
misallignment of the RAM surface of 8 degrees introduces a small asymmetry to the data.
Details of the SPENV code and its use of the models are given in Atkinson et al. 4

space• . spall crater thermal
....... ........._.......
(la)
Rings
pace
ome
pall
Crater
(lb)
Figures la and lb: (a) Schematic cross-section of an impact into painted aluminum. (b)
Schematic plan view of a "typical" crater in painted material measured on LDEF. A slight
asymmetry is typical for most craters. Note: diagrams are not to scale.
621

Ea,.'lhFa<:_ngEnd
Figure 2: Illustration of LDEF's orientation while in gravity-gradient stabilized Earth orbit. Note
RAM, SIDES (top and bottom on figure),TRAIL, EARTH, and SPACE faces.
622

Themicrometeoroid model takes into account the shielding subtended by the Earth as seen by
LDEF, and thus is a function of altitude. For cratering predictions the mean density of
micrometeoroids has been set at 0.5 grn/cm 3 as suggested by Cour-Palais a. (In reality, the true
density of micrometeoroids is uncertain. Captured particles have had densities of up to 3.5
gm/cm 3. However, the recommended flux model of Cour-Palais is itself based on the lower
density and would need revising if the density were changed). The micrometeoroid model
assumes that the particles arrive at the Earth uniformly from all directions (Le., appear
geocentric). This is not strictly true, but is a reasonable approximation for the 5.75 year
exposure time period of LDEF, since during this time the LDEF orbit underwent about 38
complete cycles of precession and thus "sampled" a large region of the 47_ solid angle of space.
The debris model assumes a density of aluminum (2.8 gm/cm 3) for particles about 1 cm
diameter, which decreases for larger pieces (since large pieces are not chunky bodies but rather
pseudo-porous items such as bits of plates, antennas, and so on), and increases for smaller sizes
to about 4.0 gm/cm 3, which is representative of alumina propellent particles and flakes of paint
pigment.
The debris model presently assumes pseudo-circular orbits, which immediately prevents
collisions on the TRAIL surface of LDEF. The LDEF data, based on impact fluence and both
scanning electron microscopy (SEM) s and secondary ion mass spectrometry (SIMS) _ analysis,
is revealing that debris particles did impact on the TRAIL surfaces. The obvious explanation is
that some of the debris are in elliptical orbits. Kessler has been aware of the limitations of his
original model, but until recently had little data with which to update it. With the new LDEF
data Kessler now concludes that there are significant amounts of debris (i.e., about 20-30 times
that tracked by Space Command) in GPS transfer-type orbits at low inclination. 7 This debris
should mainly be aluminum oxide effluent from orbital transfer rocket firings.
POD has also independently used an ephemeris code to identify the possible orbit of the
particle causing the largest crater observed on LDEF. This crater (5.3 mm) occurred on an
623
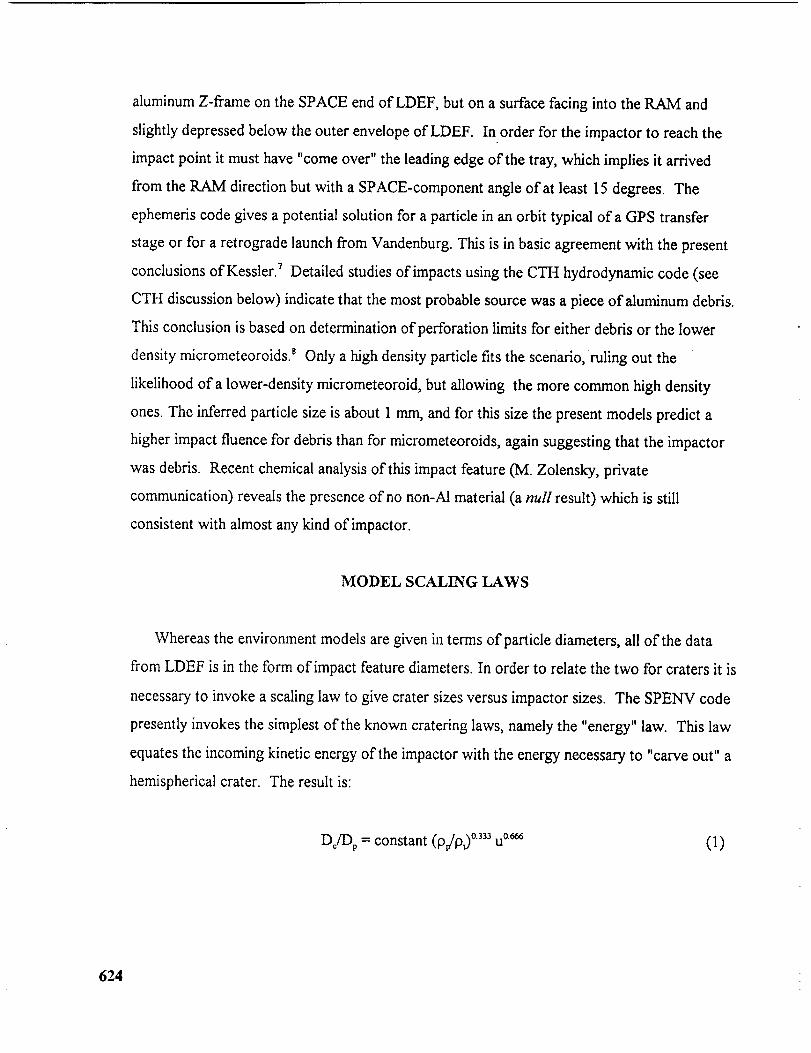
aluminumZ-flameon the SPACEendof LDEF, but ona surfacefacinginto theRAM and
slightlydepressedbelowtheouterenvelopeof LDEF. In orderfor the impactorto reachthe
impactpoint it musthave"comeover" the leadingedgeof thetray,which impliesit arrived
from theRAM directionbut with a SPACE-componentangleof at least15degrees.The
ephemeriscodegivesapotentialsolutionfor aparticlein anorbit typicalofa GPStransfer
stageor for a retrogradelaunchfrom Vandenburg.This is in basic agreement with the present
conclusions of Kessler. 7 Detailed studies of impacts using the CTH hydrodynamic code (see
CTH discussion below) indicate that the most probable source was a piece of aluminum debris.
This conclusion is based on determination of perforation limits for either debris or the lower
density micrometeoroids. _ Only a high density particle fits the scenario, ruling out the
likelihood of a lower-density micrometeoroid, but allowing the more common high density
ones. The inferred particle size is about 1 mm, and for this size the present models predict a
higher impact fluence for debris than for micrometeoroids, again suggesting that the impactor
was debris. Recent chemical analysis of this impact feature (M. Zolensky, private
communication) reveals the presence of no non-Al material (a null result) which is still
consistent with almost any kind of impactor.
MODEL SCALING LAWS
Whereas the environment models are given in terms of particle diameters, all of the data
from LDEF is in the form of impact feature diameters. In order to relate the two for craters it is
necessary to invoke a scaling law to give crater sizes versus impactor sizes. The SPENV code
presently invokes the simplest of the known cratering laws, namely the "energy" law. This law
equates the incoming kinetic energy of the impactor with the energy necessary to "carve out" a
hemispherical crater. The result is:
Do/Dp = constant (p/pt) 0"333 U0'666 (1)
624

k_..
4-a
(D
E°_
-0
6Ok._
.Q(D
I....
Q.4_a
(D
E
-(3
(D
_3t_
0I
II
ii!
!
I
!
i
ANGLE FROM RAM
Figure 3: Plot of Dc/Dp versus angle from RAM for debris, in the plane parallel to the Earth.
The numbers adjacent to the curves indicate the orbital inclination for that particular curve.
625

4
3.5
3
2.5MICROMETEOROID
2
1.5
1
0.5
0
L I i.-----.__ , i !
...................................... _.................... o......................... _......................
................................ t............
I
........................ t-
l
I
w
i
I
i
i
z
i
, _ , ! .I. , ! !..t .I I t t t t t _ _
0 20 4O 6O 80 100 120 140 160 180
ANGLE FROM RAM
Figure 4: Plot of Dc/Dp versus angle from RAM (velocity vector) for micrometeoroids,
assuming a density of 0.5 gm/cm 3, in the plane parallel to the Earth.
626

where D c is the crater diameter, Dp is the particle diameter, 9p and Pt are the impactor and target
densities, u is the impactor speed normal to the target surface, and the constant is determined
by laboratory experiments) This equation is sensitive to the normal component of impact
velocity, and the existing particulate models predict that practically none of the impacts are
normal. Further, the impact velocities are themselves functions of arrival direction and thus of
the orientation of a specific surface relative to the RAM. Consequently, the value of DJDp is a
function of surface orientation which is also a function of orbital inclination, and, in principle, of
altitude. Figures 3 and 4 illustrate this dependence for debris and micrometeoroids, respectively.
Figure 5 shows the distribution of relative debris impacts in the form of a polar plot versus the
RAM direction ("butterfly plot") based on the Kessler model. These impacts are in the plane
parallel to the surface of the Earth. The corresponding impact speeds are given by the relation
v = 15.4 cos A km/s, where A is the angle between the RAM direction (zero degrees) and the
apparent approach direction of the debris. The component of the impact velocity along the
normal to a surface is given by v = 15.4 cos A cos (B-A) km/s, where B is the angle between
the surface normal and the RAM direction. For the RAM surface itself this reduces to the value
v = 15.4 cos 2 A km/s. If the angle (B-A) exceeds 1800 then impacts cannot occur on that
surface. The data in Figure 3 is obtained by integrating over all the possible angles of approach
for a specified surface, based on the relative weighting given by the Kessler model (this
weighting explains the butterfly shape).
Figure 6 shows the distribution of average impact speeds versus approach direction for the
micrometeoroids (RAM direction equals zero degrees). This polar plot represents a body of
revolution symmetric about the RAM axis. The effect of Earth-shielding is to remove a section
of the solid angle for this figure, which results in a modification of the impact fluxes for all
surfaces except that facing towards SPACE. The source of data for this plot is that due to
Erickson 9 which describes the relative number of micrometeoroids versus speed as seen from
the Earth (so-called "stationary satellite" data). This data is transformed into the reference
627

150 °
180 °
Kessler F(v) Function
90 °
120 ° 60 °
3O
/i
\\
\
\\
\
F(v)=
30 °
0
impacl /m**2/yr/(km/s)
210 ° 330 °
240 ° 300 °
270 °
Inclination = 28.5 deg
Figure 5: Plot of polar distribution versus angle from RAM (velocity vector) for debris, in the
plane parallel to the Earth, for LDEF.
15- :
628

Average velocity vs. polar angle
150 °
!
180 °t
i
90 °
120 ° 20 6O °
\
\
Ii
/!
;..... /
210 ° 330 °
24O ° 30O o
270 °
MICROMETEOROIDS
Figure 6: Plot of polar distribution of impact velocity versus angle from RAM (velocity vector)
for micrometeoroids. This figure is axisymmetric about the RAM axis, and ignores Earth
shielding.
629

frame of the orbiting satellite to produce Figure 6. As with debris the effects of
micrometeoroid impacts are obtained by integrating over all particles taking into account the
components of velocity along the normal to the specific surface.
There are several other proposed crater scaling laws (e.g., Cour-Palais _'_°and Christiansen _1). In
general, the differences in these laws are variations in the power indices for densities (and/or
masses) and velocity. Since the indices are less than unity, the effect is a relatively small shift in
the values of Dg'Dp. The data are presented in the form of cumulative fluences, or rather, impacts
per area for craters greater than or equal to a specified size, versus crater size. The effect of
changes in scaling law is primarily a horizontal shill in tile plots. For example, changing the
power index for density from 0.333 to 0.5 moves the curves by only a factor of 1.34 even for
the extreme case of a tantalum impactor (density 16.6 gm/cm 3) into aluminum (density 2.8 gm/cm3),
and clearly has no effect for symmetric impacts such as aluminum into aluminum. Likewise, a change
in the assumed density ofa micrometeoroid (e.g., from 0.5 gm/cm 3 to 3.0 grrdcm 3) produces a factor
of 1.82 or 2.45 for power indices of 0.333 and 0.5, respectively.
CTH HYDROCODE CALCULATIONS
The CTH computer code _ from Sandia Laboratory, Albuquerque, has been used to simulate
several classes of impacts. In order to benchmark the code, specific calculations were done to
replicate laboratory-generated ballistic penetration (i.e., perforation) cases for aluminum.
These data were provided by Fred H6rz of NASA JSC. Material parameters were adjusted in
the CTH runs until good replications were obtained. The agreements involved standard,
acceptable Equation of State (EOS) and constitutive data for the impactors and targets, and in
particular, identified the aluminum targets as AI 1100 with temper H16 (H6rz could not specify
the exact temper of his samples, but the suggested solution is very credible being a reasonably
common alloy). Details of these comparisons are given in the Appendix.
630

The CTH results were then plotted as functions of perforation limits for various aluminum
sphere diameters versus normal impact velocities, and for various aluminum wall thicknesses,
and the data were fitted analytically by least-squares techniques. The result was a fit very
similar to the perforation-limit conditions predicted by the McDonnell equation. 1: Within the
accuracy of determination of the "best-fit" equation for the CTH data, the results essentially
agreed with the predictions of McDonnell, except for about a 20% decrease in the prediction of
wall thickness. Based only on this fact, we presently recommend use of the McDonnell
equation for perforation predictions, at least for symmetric AI/A1 conditions (Note, we have not
yet validated the "strength" term in the McDonnell equation). This equation is:
a"= 1.023d/.°5' .476( rA,/,,3 u°.'' (2)
where T is the wall thickness, dp is the particle diameter, densities (13) refer to particle or target,
respectively, cr values are the yield strengths of Al or the target, and u is the normal impact
speed. For a symmetric aluminum into aluminum (AI/AI) impact this becomes:
T = 1.023 dp1'°56u °664 (3)
The corresponding "best-fit" from CTH for A1/A1 impacts was:
T = 0.81 (+/- 0.20) dp°937sc+'°'°s) u °62s¢+t-°°9) (ref.8) (4)
CTH has been used to simulate impacts on coated materials in order to understand such
effects as the "ring" and "dome" structures seen on painted aluminum, together with localized
delamination effects. To date, the CTH runs have been able to simulate the formation of
"domes" and demonstrate the development ofdelaminations. However, while the runs have
predicted transient "ring" motions (i. e., Rayleigh wave ripples propagating away from the
impact site), we have not yet identified the parameters necessary to cause a "freezing" of these
waves to yield permanent rings. It appears that the behavior is very sensitive to the amplitude
631

w_io
)-
i into _l(3.'2E-3(:m] _t &_C ',,:n'_/s
-'oF:oi
tO
0
-10
-_0
-30 I
-40
-0,5
I t i , i I i f__.&___
-0.3 -O.; 0.1 0.3 ,5
2DC Bloc_ _ X (IO'_cm)
POD Pcnelro!:on Tesl to dupl;coFe deIom:.',c!;o, o! lh;n foyers.
FRQ-_XJ C 6/tB/£2:6:10:07 CTH 0 T;m_=O.
AI203(,4.0E-3cm) into ,q(3.OE-3cm) at g.O0 km/_
40 ,.- '' dl(m')
_" ]-- c-: r±-_:_.'cr"Y-- "7,,:
• ,<_ - __
" iii-30 F-40 t , : I I L._-._L_ [ I I n
-0.5 -0.3 -0. I O. I 0.3 .5
2DC Block I X (lO'_cm)
POD Peneftaf;on Te_I }o dupl;c_le delcm;no_ion Of th_n foyers.
FRQ_J,N 6/_8/92 20:22:0G CTH 4_0 T:me:2.00142x_O-'
A1203(4.0E-3cm) Tn!o AI(S.OE-3cm) o! _.DO km/_"
z 0 , , r--- , , ; -_(_i,._:)
)-- I 0 I_.:_
II _.:o:
-_0 ][_v_
-30 ]-- 4 0 I I I I ] I l .if
- .5 -0,3 -O.I 0,! 0.3 0,5
2DC Bloc_< I X (_O'_cm)
POD Penelralion Tes! le dupl;eoie delcmInaficr of ]h_n ;eyer_.
FRQBAN 6/19/92 I0:3ra:34 CTI4 132_ T;m_=B.OOB_xI_ "_
Figure 7: Example results from a CTH run where an alumina projectile impacted a 2-layer
target at 9.0 km/s. Time is in sec. Note the factor of 100 vertical exaggeration.
632
3 C, _- -.'.0,'_'.o--1._.13_,v. x_
2,?
10
T
- 4 0 I I I , I I I T r __l
- .5 -0,3 -O,I 0.1 0.3 0,5
2De Dtock I X (10-1cm)
PO0 Penebaiion Tesi ia dupIIeoledelarnln_Iionof lhln layers.
FYRFHY G 6/_2-_,I_217'.5_'.4r_CTI-I. 0 Time=O.
Al{_0urn)in!o Al(3Oum) & ,_1203(30um) o_ 9.OO kin/
l f_..-,,..._ _.._._,__'_l_.,'_ .........'o _.,....,_.._,.,, -. t,_ _.__ .........._..:o,,,,'I%_,..o,,o;_ _.......'
i_---_"-._-c-_'_:-_'l.,_;:s_' "v-v_ _,_ ;b_-_._Z'_;+uq
-_0 "I
-20 % iC3v_°-30
-40 I I ___I I I I
-O.S -0.3 -0.I 0.I 0.3 0.5
2DC Bl_c!_I X (I0-_¢m)
POD PenelroIion Te_l Io duptiealedelemTna_ionof INn layers.
FYS._CL 6/26/92 00:17:50 CTFI 546 Time:2.0011Gxt0-;
Al(8Oum_ in% A](30um) Z¢ A1203(30um) d_ S.00 kin/
-20 _%%o_ q,':_
-30
--40 I I ,l _Z_t t _ I '
-0. -0.3 .-0.I 0.I 0.3 .5
2DC Bloe_ 1 X (10"_cm)
POD Ponelrafio,nTes} 1o dupl;coledelonnTneIiona[ lhin layers.
FYSACL 6126192 12:22:15CTH 1211 Tirn_=S.O0015xlO-_
Ti(o
)..
"C_.a?o
)-
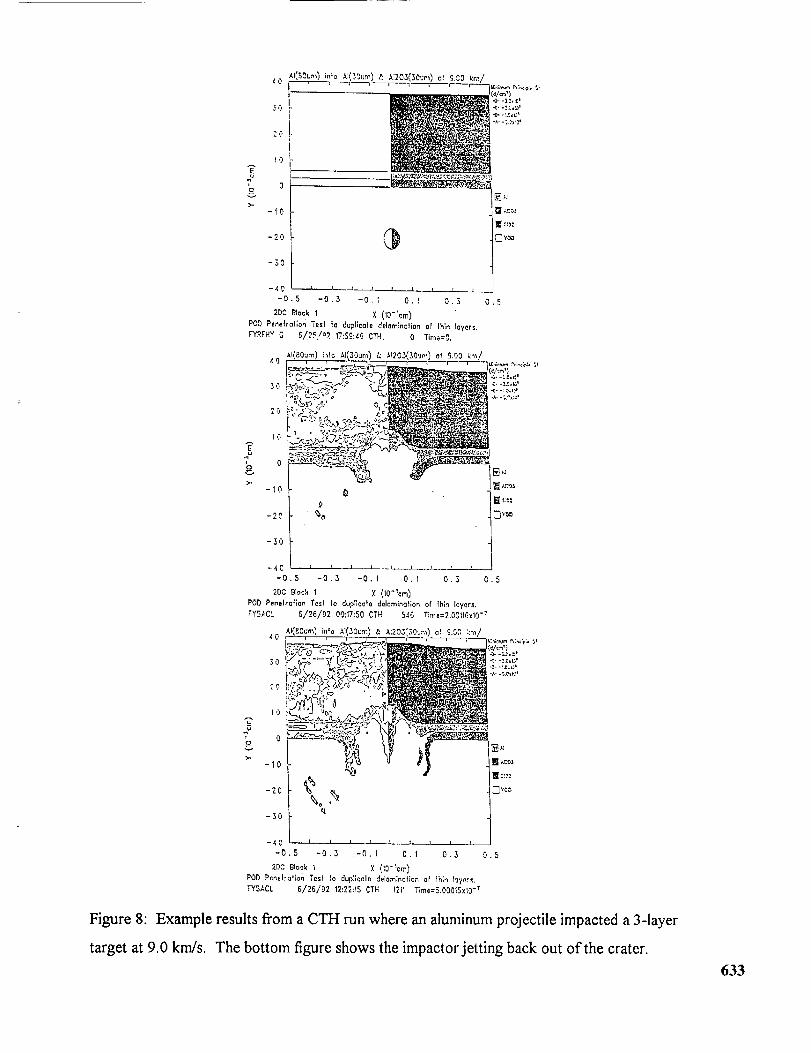
Figure 8: Example results from a CTH run where an aluminum projectile impacted a 3-layer
target at 9.0 km/s. The bottom figure shows the impactorjetting back out of the crater.633

of the induced wave structure and the yield strength of the materials, since the CTH
calculations either gave rapidly dampened waves or else indicated material loss due to localized
jetting around the impact site. We do not presently understand this since basically all of the
painted surfaces exhibited "rings" and the impact conditions cannot have been identical. Figures
7 and 8 show some typical CTH results. These example problems include an aluminum coating
on a silica substrate (Figure 7) and a two-layer alumina/aluminum coating on silica (Figure 8).
In both cases the impactors have been alumina or aluminum. Parameter options investigated
include impact speed and interlayer adhesion strength. In each figure, the sequence progresses
from the top to bottom, with the top image at 0 time. Projectile velocity was 9.0 km/s for both
examples.
=
The effect of interlayer (bond) strength is interesting. For zero strength the layer locally
"peels back" by a small amount around the impact hole in the layer and the layer debonds
rapidly in a radial manner away from the hole, such that the entire layer essentially jumps off the
substrate. The silica substrate develops a typical crater. As the bond strength is increased so
the debonding becomes limited to a region around the impact site, but at the expense of greater
localized peel back at the hole edge. Depending on details, the local peel back can resemble the
standard lips for a metal target impact, or can spall offand cause secondary ejecta. If the
coating is a brittle one (alumina) with high compressive yield strength but low fracture strength,
the tendency is to crack off the lips. Conversely, for the soi_ metal (AI) coating the tendency is
to develop considerable plastic/molten flow, and droplets peel off.
In all high speed (>9 krrds) impacts modelled to date, the impacting particle (whether brittle
alumina or soft aluminum) has always been forged into a self-forming jet structure which expels
itself back out of the hole. This occurs because the impact pressures are sufficiently high to
cause gross plastic flow at elevated (shock induced) temperatures, and the geometry causes
convergence effects, thus producing the jet. The result is that only small portions of the
impactor remain within the crater. We cannot presently identify the exact amount of material
remaining, since this involves "late-time behavior" and requires long computer run times. This

behavioris consistentwith manyLDEF observations,wherefrequentlythe impactoris either
difficult or impossibleto identifydueto limitedor zeroremnants.In particular,the calculations
indicatethat the impactordoesnot needto completelyvaporizein orderto explainnegligible
remnants.For thetwo-layercoatingproblemboth layerspeelbackanddelaminatefrom each
otherandthesubstrate.Figure8 showssucha case,andindicatesthe complicatedmorphology
aroundtheimpactsite.
Of relevantinterestto thisdiscussionis somedataprovidedbyMaxwell Laboratory,San
Diego.13WorkersthereusedtheflashX-ray machine,Blackjack 5, to throw debris particles at
single crystal silicon. The latter target was simultaneously surface heated by the associated
X-ray plasma. The result was the development of ring structures very similar to those seen on
LDEF. The pictures resemble a frozen version of the "stone in a pond" effect! The postulated
explanation is that the hot surface (almost molten) of the silicon was forced to undergo plastic
yielding due to the Rayleigh waves, and that hysteresis "locked in" the ripples.
LDEF EXPERIMENTAL RESULTS
Data utilized in this portion of the study originated from three sources: (1) For craters
larger than 0.05 cm diameter, measurements were taken by the LDEF Meteoroid and Debris
Special Investigation Group's (M&D SIG) Kennedy Space Center Analysis Team on the entire
LDEF aluminum structure, TM and (2) for craters larger than 0.01 cm diameter, measurements
were taken by the authors from specific aluminum experiment tray covers and sun shields, and
(3) for craters larger than 0.001 cm diameter, measurements were taken by See et al. _5on
LDEF intercostals. Separate environment models were utilized to make predictions for the
meteoroids and debris and computed using the SPENV model. For meteoroids, the Cour-Palais
et al.1 model was used with the Kessler-Erickson velocity distribution as described by Zook. 9
For debris, the Kessler model 2 was used. Our SPENV program models both the
micrometeoroid and debris environments that may be encountered by a spacecraft in an orbit
635
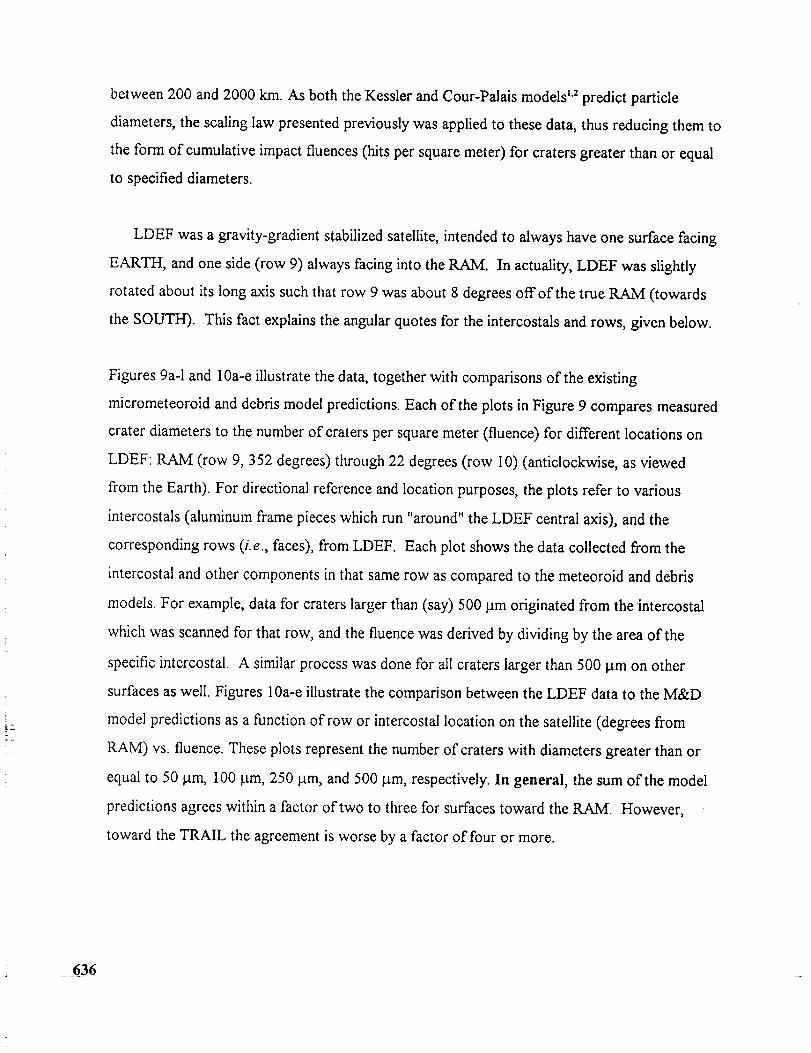
between 200 and 2000 km. As both the Kessler and Cour-Palais models _a predict particle
diameters, the scaling law presented previously was applied to these data, thus reducing them to
the form of cumulative impact fluences (hits per square meter) for craters greater than or equal
to specified diameters.
LDEF was a gravity-gradient stabilized satellite, intended to always have one surface facing
EARTH, and one side (row 9) always facing into the RAM. In actuality, LDEF was slightly
rotated about its long axis such that row 9 was about 8 degrees offofthe true RAM (towards
the SOUTH). This fact explains the angular quotes for the intercostals and rows, given below.
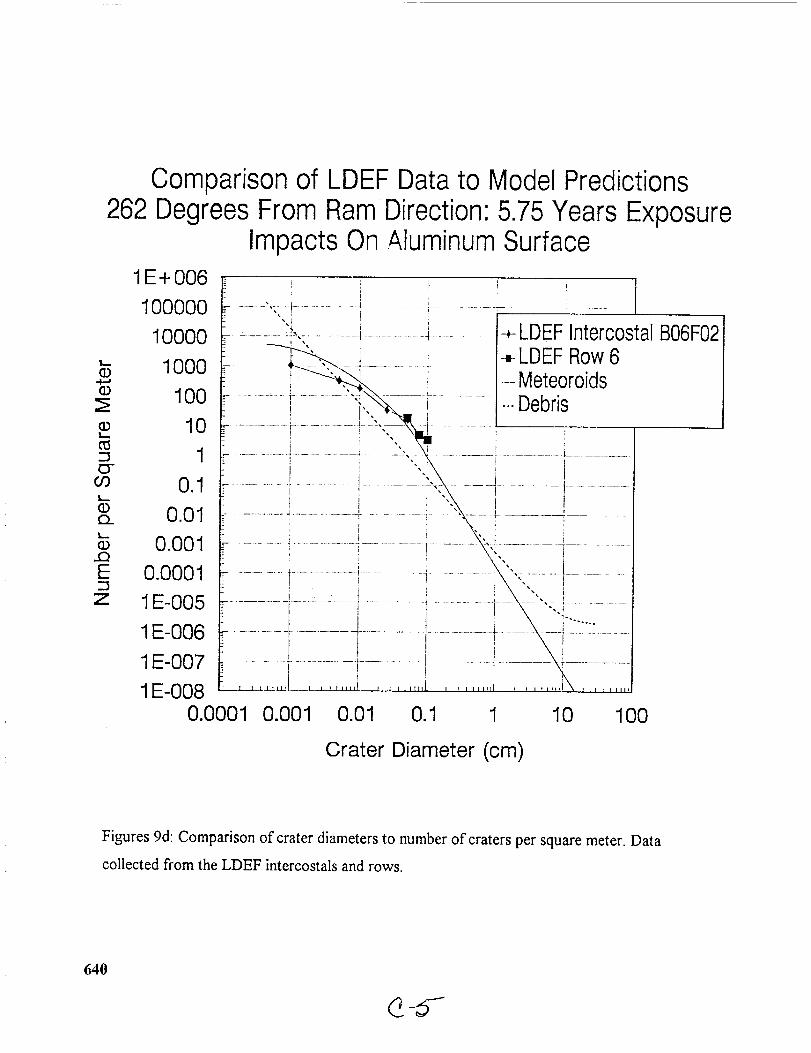
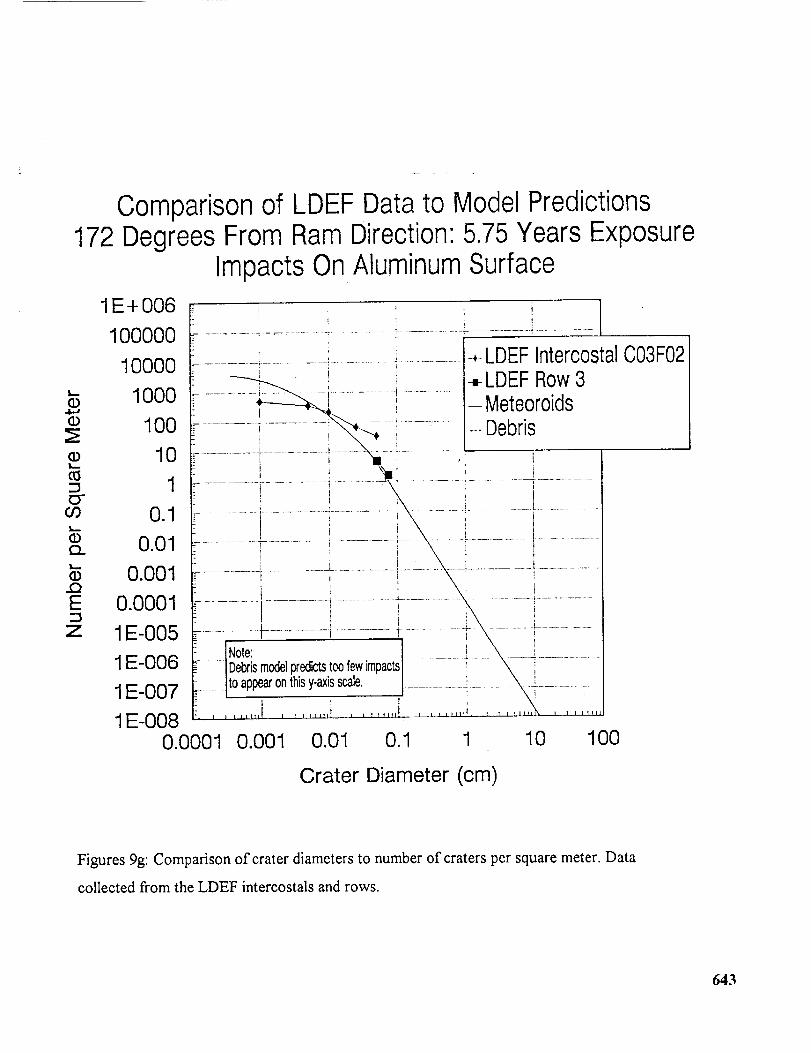
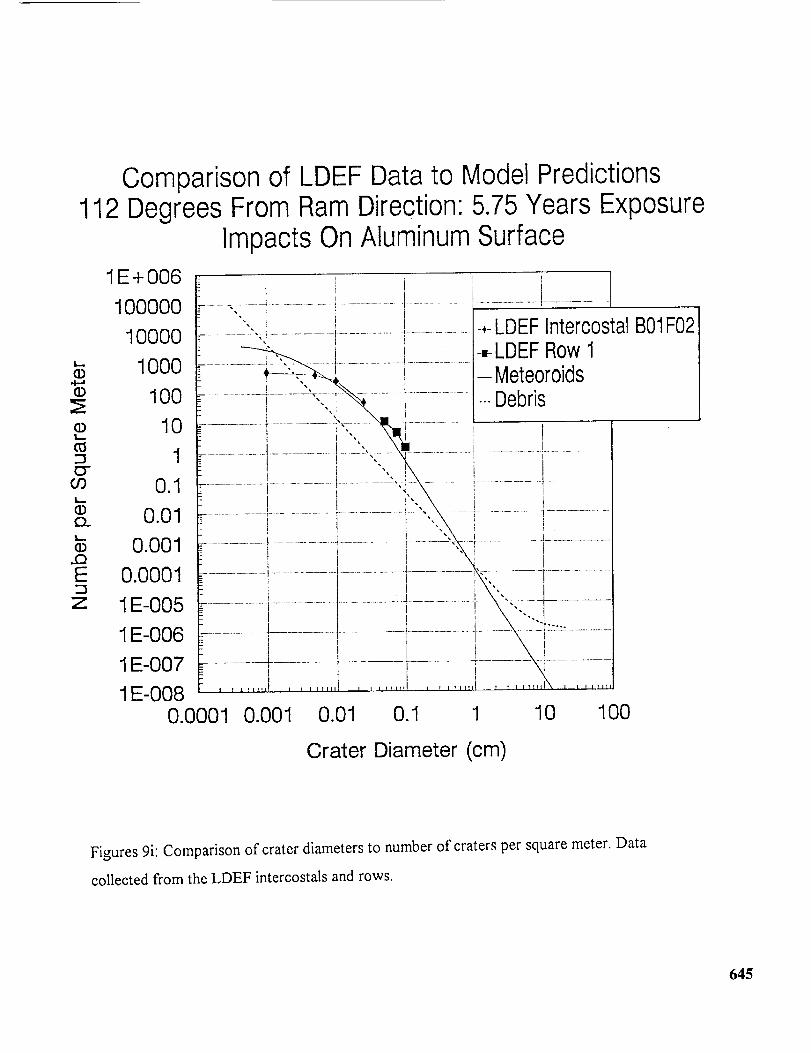
Figures 9a-1 and 10a-e illustrate the data, together with comparisons of the existing
micrometeoroid and debris model predictions. Each of the plots in Figure 9 compares measured
crater diameters to the number of craters per square meter (fluence) for different locations on
LDEF: RAM (row 9, 352 degrees) through 22 degrees (row 10) (anticlockwise, as viewed
from the Earth). For directional reference and location purposes, the plots refer to various
intercostals (aluminum frame pieces which run "around" the LDEF central axis), and the
corresponding rows (ke., faces), from LDEF. Each plot shows the data collected from the
intercostal and other components in that same row as compared to the meteoroid and debris
models. For example, data for craters larger than (say) 500 p.m originated from the intercostal
which was scanned for that row, and the fluence was derived by dividing by the area of the
specific intercostal. A similar process was done for all craters larger than 500 lam on other
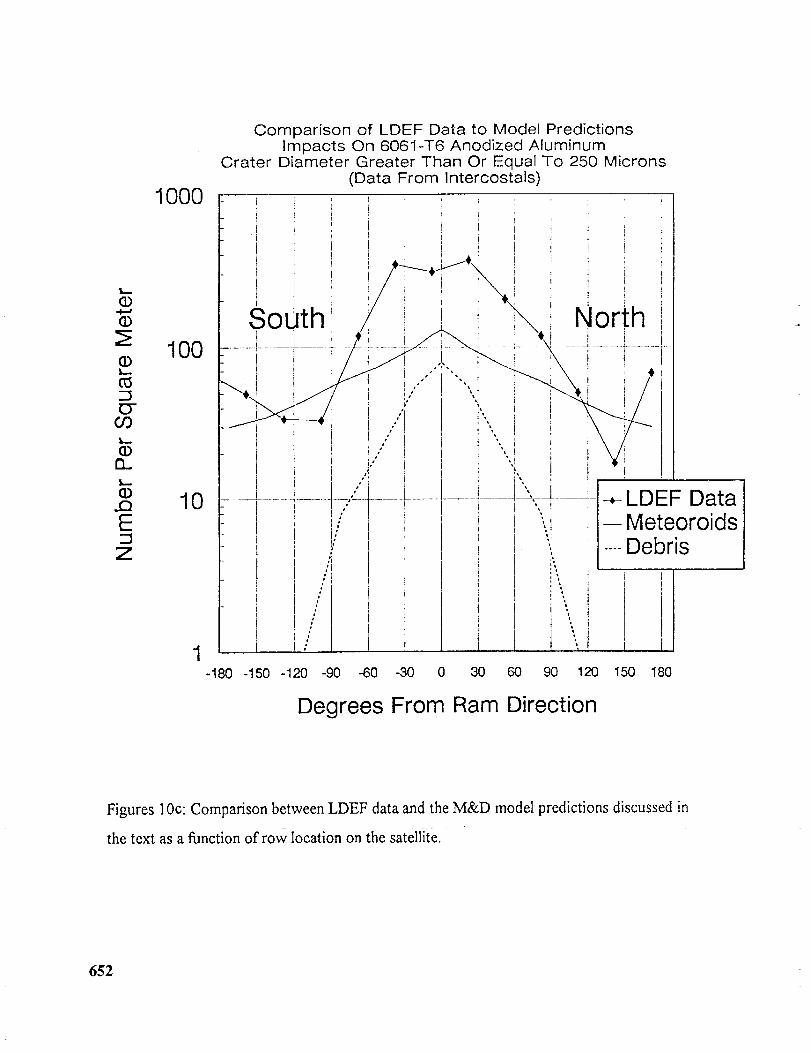
surfaces as well. Figures 10a-e illustrate the comparison between the LDEF data to the M&D
model predictions as a function of row or intercostal location on the satellite (degrees from
RAM) vs. fluence. These plots represent the number of craters with diameters greater than or
equal to 50 lam, 100 lam, 250 t.tm, and 500 gm, respectively. In general, the sum of the model
predictions agrees within a factor of two to three for surfaces toward the RAM. However,
toward the TRAIL the agreement is worse by a factor of four or more.
636

,.i.-.I
a3-1o
CO
Q.I,.-,
.OE-1
Z
Comparison of352 Degrees From Ram
Impacts On1E + 006
1OOOOO
10000
1000
IO0
10
..................................
0.1
0.01 ............
0.001
0.0001
1E-005
1E-O06
1E-O07 .....
1E-O080.0001 0.001
LDEF Data to Model PredictionsDirection: 5.75 Years ExposureAluminum Surface
"'. + LDEF Intercostal F09F02-,,-LDEF Row 9
Meteoroids..-Debris
O.01 O.1 1 10 100
Crater Diameter (cm)
Figures 9a: Comparison of crater diameters to number of craters per square meter. Data
collected from the LDEF intercostals and rows.
637

L...
©
O
©
EFcO
_3O..I,..-
©..QE
Z
Comparison of LDEF Data to Model Predictions322 Degrees From Ram Direction: 5.75 Years Exposure
Impacts On Aluminum Surface1E+ 006
10OOO0
10000
1000
IO0
10
1
0.1
0.01
0.001
0.0001
1E-O05
1E-006
1E-007
1E-O08
1
I+ LDEF Intercostal F08F02
-,,-LDEF Row 8Meteoroids
.-.Debris
0.0001 0.001 0.01 0.1 1 10 100
Crater Diameter (cm)
Figures 9b: Comparison of crater diameters to number of craters per square meter. Data
collected from the LDEF intercostals and rows.
638

0'3L,,
O..
E
Z
Comparison of LDEF Data to Model Predictions292 Degrees From Ram Direction: 5.75 Years Exposure
Impacts On Aluminum Surface1E+006
10O0OO
10000
1000
100
10
1
0.1
0.01
0.001
0.0001
1E-005
1E-O06
1E-007
1E-0080.0001 0.001 0.01 0.1 1 10 100
Crater Diameter (cm)
Figures 9 c: Comparison of crater diameters to number of craters per square meter. Data
collected from the LDEF intercostals and rows.
639
-1O"O3L--
©{3_
(D
E"-1
Z
Comparison of LDEF Data to Model Predictions262 Degrees From Ram Direction: 5.75 Years Exposure
Impacts On Aluminum Surface1E + 006
1OOO0O
1OO0O
IOO0
IO0
10
1
0.1
0.01
0.001
0.0001
1E-O05
1E-O06
1E-O07
1E-O080.0001
i ! , , |/
".i i
................................:'--,-....................i ................._.................+ LDEF Intercostal B06F02_ i, ..-.. , -,,-LDEF Row 6
_ Meteoroids
................ -----1-q[r_ --m - _ - - _ . _._------m----mm i-- m ........ """Debris
............................. a...... i..................................................._-\.-.'- ......i ....................
.....................I................."..............................[.....................................\-i ...................., I i i \!
I i t \! I I frail I I ltlll I r t f flffl I F 1 lll!]l IL I I ?llfl 1 .I I III1!
0.001 0.01 0.1 1 10 100
Crater Diameter (cm)
Figures 9d: Comparison of crater diameters to number of craters per square meter. Data
collected from the LDEF intercostals and rows.
640

I,..
©2;
i,._
Gi
I:D"
'i,.,,.
©O..
..QE.m
Z
Comparison of LDEF Data to Model Predictions232 Degrees From Ram Direction: 5.75 Years Exposure
Impacts On Aluminum Surface1E + 006
100OO0
10000
1000
100
10
1
0.1
0.01
O.O01
0.0001
1E-O05
1E-O06
1E-007
1E-0080.0001
i .........................! t
",, r i LDEF Intercostal E05F02_ .. ................. _............................................................. -_-
"',_ i , -,-LDEF Row 5.... ":i...."--,\_ ........................_........................Meteoroids........................i:'-,,...............:_; .............i.........................-Debris
• , \.................... i-............................ ! ..... _ ............................. _.................
, , \
...................... t .................................. !............................ _....................... 4-..... :................
i i ! I X .....,
........ I , x___u._l___........ I ........ I ........ \ ......
O.OO1 O.O1 O.1 1 10 1OO
Crater Diameter (cm)
Figures 9e: Comparison of crater diameters to number of craters per square meter. Data
collected from the LDEF intercostals and rows.
641

202
.4=.a
(1)
O"O0
(D
lt.._
..Q
E-1
Z
Comparison of LDEF Data to Model PredictionsDegrees From Ram Direction: 5.75 Years Exposure
Impacts On Aluminum Surface1E + 006
10OOOO
1000O
1000
100
10
1
0.1
0.01
0.001
0.0001
1E-O05
1E-O06
1E-O07
1E-O080.0001
' i I................................................!.......................i........... ........................................................................................_........................................,..........................+ LDEFIntercostalF04F02
........... -,LDEF Row4................_ --_ ...............................................-Meteoroids
.................................................................._ ....................................-.Uebns
; [ ' i i.........................................................................)' ..................................i...................i....... ..............................!......................{.............................i ......................_.........................r.................
, '"--_...........i...........................i................................................X........._,.............i...........",. ] I _ \ : i
............._ .........\-!......................i.............
.................. t.................".........................................................4............. -4- ....................i "- i i
I
............._ .......\-! ...........................
.........................!.................................:"- .........................I...................Xi........,,_, ,,,,i , .......X ........
0.001 0.01 0.1 1 10 100
Crater Diameter (cm)
Figure 9f: Comparison of crater diameters tO number of craters per square meter Data
collected from the LDEF intercostals and rows.
642
172
i,m,
C-O0
O..i.,,,.
..QE
Z
Comparison of LDEF Data to Model PredictionsDegrees From Ram Direction: 5.75 Years Exposure
Impacts On Aluminum Surface1E + 006
.............................................,.....................................................-+-LDEFIntercostalC03F02
Crater Diameter (cm)
Figures 9g: Comparison of crater diameters to number of craters per square meter. Data
collected from the LDEF intercostals and rows.
643

142
©
O"03
O..
(D
E
Z
Comparison ofDegrees From Ram
Impacts On1E + 006
100000
10000
1000 {,,,100 ""
10
1
0.1
0.01
0.001
0.0001
1E-O05
1E-O06
1E-007
1E-O080.0001
LDEF Data to Model PredictionsDirection: 5.75 Years ExposureAluminum Surface
............................... I , i
....i.............................._..........................+LDEF Intercostal-,,-LDEFRow 2-Meteoroids.--Debris
0.001 0.01 0.1 1 10 100
Crater Diameter (cm)
Figures 9h: Comparison of crater diameters to number of craters per square meter. Data
collected from the LDEF intercostals and rows.
644
112Comparison of LDEF Data to Model PredictionsDegrees From Ram Direction: 5.75 Years Exposure
Impacts On Aluminum Surface
I,...
O
O
(I.)I,..
or)I,..,,
(])c'>E
Z
1E + 006
10O00O
10000
1000
IO0
10
1
0.1
O.01
0.001
0.0001
1E-O05
1E-O06
1E-O07
1E-0080.0001
• , , LDEF Intercostal BO1F02.................... "- i ...................................'................................... f ........................................-+-
_" ' , LDEFRow1-, i i 41-
"_,. [, -Meteoroids.........................................................Debris
................................... 1............. 2...............................................................................................
............ t III "'"_ XJ _! i
I } ", : ! .......
=_,- .........................................................! it ............................--?"!,- X"_ ...................... I_ ....................... !i
: t i i'-,\ i t.........................._...................................._..............................._--_" \ ......._ ...........................i...........................
L '-,.X i
...........................................................................................................! i ii i iiiiii_:i_i,, _',i ..................................._ 11...............
..................................................................................................... i ..........................
i I i "', i
I t i -- ...............................r..........................1..................._ ..........\ ...........t...............i1 ' ...................................!........ I
/
0.001 0.01 0.1 1 10 100
Crater Diameter (cm)
Figures 9i: Comparison of crater diameters to number of craters per square meter. Data
collected from the LDEF intercostals and rows.
645

82
'1,.._.
(D
(D
(D
O-CO
(DO_
(D..QE
Z
Comparison ofDegrees From Ram
Impacts On1E+ 006
100000
1OOOO
1000
IO0
10
1
0.1
LDEF Data to ModelDirection 5.75 YearsAluminum Surface
PredictionsExposure
-,-LDEF Intercostal C12F02-,-LDEF Row 12-Meteoroids...Debris
0.01
0.001
0.0001
1E-005
I E-O06
1E-O07
1E-O080.0001 0.001 0.01 0.1 1 10 100
Crater Diameter (cm)
Figures 9j: Comparison of crater diameters to number of craters per square meter. Data
collected from the LDEF intercostals and rows.

52
00
0i.
O9
(1)0..
©..OE"1
Z
Comparison of LDEF Data to Model PredictionsDegrees From Ram Direction: 5.75 Years Exposure
Impacts On Aluminum Surface1E +006
1OOOO0
10000
1000
IO0
10
1
0.1
0.01
0.001
0.0001
1E-O05
1E-O06
1E-O07
1E-O080.0001
.....................,,_........................................t....................!............................i-'-'-'-',..................................................................+ LDEF lnterc0s
............._ -,-LDEF Row 11..................i _'_L,,,,.............................-Meteoroids......................i...................................."'-_"_-i ..........................Debris
"4",
0.001 0.01 0.1 1 10 100
B11F02
Crater Diameter (cm)
Figures 9k: Comparison of crater diameters to number of craters per square meter. Data
collected from the LDEF intercostals and rows.
647

22Comparison of LDEF Data to Model PredictionsDegrees From Ram Direction: 5.75 Years Exposure
Impacts On Aluminum Surface1E + 006
100000
10000
- 1000O
o 100
10
1O-oo 0.1k.,,
(D0_ O.01
o 0.001
E 0.0001"-Iz 1E-O05
1E-O06
1E-O07
1E-O080.0001
kl..............l+LDEF Intercostal E10F02-,,-LDEF Row 10-Meteoroids--.Debris
it
O.001 0.01 0.1 1 10 100
Crater Diameter (cm)
Figures 91: Comparison of crater diameters to number of craters per square meter. Data
collected from the LDEF intercostals and rows.
648

Overall, the measured data tends to oscillate around the predictions for the micrometeoroids.
More specifically, the Kessler debris model 2 overpredicts the mean flux of small craters (-0.005
cm diameter), while the Cour-Palais micrometeoroid model I slightly underpredicts the mean
flux for these small craters, for the RAM (row 9) surface. A similar divergence has been noted
for the EARTH- and SPACE-facing ends (not covered in this report). This divergence may be
indicative of either elliptical orbital particles from natural or man-made sources, of B-meteoroid
fluxes, or a combination of the two. The Interplanetary Dust Experiment 16data has positively
identified a B-meteoroid component of the natural environment, which is not currently
accounted for in the Cour-Palais model _ we used. Griin el all 7 did, however, take the
13-meteoroids into account when they updated Cour-Palais' model in 1985. This version of the
model is currently being analyzed and incorporated into our in-house SPENV model.
Other observed trends, most clearly seen in Figures 10a-e, include an asymmetry wherein
the impact fluence tends to be greater than the predictions (for the crater sizes measured)
towards the NORTH surface (angles in the range 0 to 180 degrees), and lower than predictions
for the SOUTH surface (180 to 360 degrees, i.e. -180 to -0 degrees on Figures 8a-e). Scrutiny
of Figures 9a-I also reveals a tendency for the data to exceed the predictions for the larger of the
measured craters. Care must be exercised in the interpretation of Figures 10a-e. The "true"
RAM direction is 0 degrees, and the micrometeoroid and debris models assume symmetry about
this direction (the occasional "kinks" in these curves are due only to the interpolation routine in
the graphing utility). If the environments were truly symmetric then the LDEF data would also
be symmetric, regardless of the orientation of the rows and intercostals. The experimental data
imply that the environment is not simply symmetric. We cannot explain this at present.
A caution should be raised with regard to measurements of the smallest craters: the target
material is not pure aluminum alloy, but has an anodized surface (i.e., an effective coating of
alumina). For the larger craters this coating has negligible effect, but for the smallest craters the
coating may constitute the "target". Since alumina has both a higher density and is tougher than
649

_3E_ET
o0
tlL
c_
E=3Z
10000
IOO0
Comparison of LDEF Data to Model PredictionsImpacts On 6061-T6 Anodized Aluminum
Crater Diameter Greater Than Or Equal To 50 Microns(Data From Intercostals)
-,- LDEF Data--Meteoroids......Debris
! !
t' Norlh
i
I
100 I .......-180 -150 -120 -90 -60 -30 0 30 60 90 120 150 180
Degrees From Ram Direction
Figures lOa: Comparison between LDEF data and the M&D model predictions
discussed in the text as a function of row location on the satellite.
650

(1)
(D
(1)
E3O-
00I,...
(1)n
(D.Q
E
Z
I0000
1000
100-180
Comparison of LDEF Data to Model PredictionsImpacts On 6061-T6 Anodized Aluminum
Crater Diameter Greater Than Or Equal To 100 Microns(Data From Intercostals)
So Jth
, _ i I
+ LDEF Data--Meteoroids.....Debris
!' orih
-150 -120 -90 -60 -30 0 30 60 90 120 150 180
Degrees From Ram Direction
Figures lOb: Comparison between LDEF data and the M&D model predictions discussed in
the text as a function of row location on the satellite.
651
},_.
:sO
O-03
d)ZL
..Q
E
Z
1000
100
10
1
Comparison of LDEF Data to Model PredictionsImpacts On 6061-T6 Anodized Aluminum
Crater Diameter Greater Than Or Equal To 250 Microns(Data From Intercostals)
SoOth
+ LDEF Data-- Meteoroids....Debris
!-180 -150 -120 -90 -60 -30 0 30 60 90 120 150 180
Degrees From Ram Direction
Figures lOc: Comparison between LDEF data and the M&D model predictions discussed in
the text as a function of row location on the satellite.
652

1000
(1)
(1)
100OL
"-I
O3
n
O.e 10E
Z
Comparison of LDEF Data to Model PredictionsImpacts On 6061-T6 Anodized Aluminum
Crater Diameter Greater Than Or Equal To 500 Microns(Data From Intercostals)
i
L ii
._. !.,_! i _-
,/
t
! +LDEF DataMeteoroids1 i --
, _ ' .....Debrisi
i
/t!/\ _ I i L......i\ ........i..............[-..........I...................l_....
i \" Nortihi
t i "'. , i-180 -150 -120 -90 -60 -30 0 30 60 90 120 150 180
Degrees From Ram Direction
Figures lOd: Comparison between LDEF data and the M&D model predictions discussed in
the text as a function of row location on the satellite.
653

G)
ET03
rl
(t)Z3E
Z
1000
100
10
Comparison of LDEF Data to Model PredictionsImpacts On 6061-T6 Anodized Aluminum
Crater Diameter Greater Than Or Equal To 500 Microns(Data From LDEF Rows and Longerons)
I + LDEF Data--Meteoroids.....Debris
Ji 1
' ' orlhI
I
:i60 90
1-180 -150 -120 -90 -60 -30 0 30 120 150 180
Degrees From Ram Direction
Figures 10e: Comparison between LDEF data and the M&D model predictions discussed in
the text as a function of row location on the satellite.
654
LDEF
Row//
I
2
3
4
5
6
7
8
9
10
I1
12
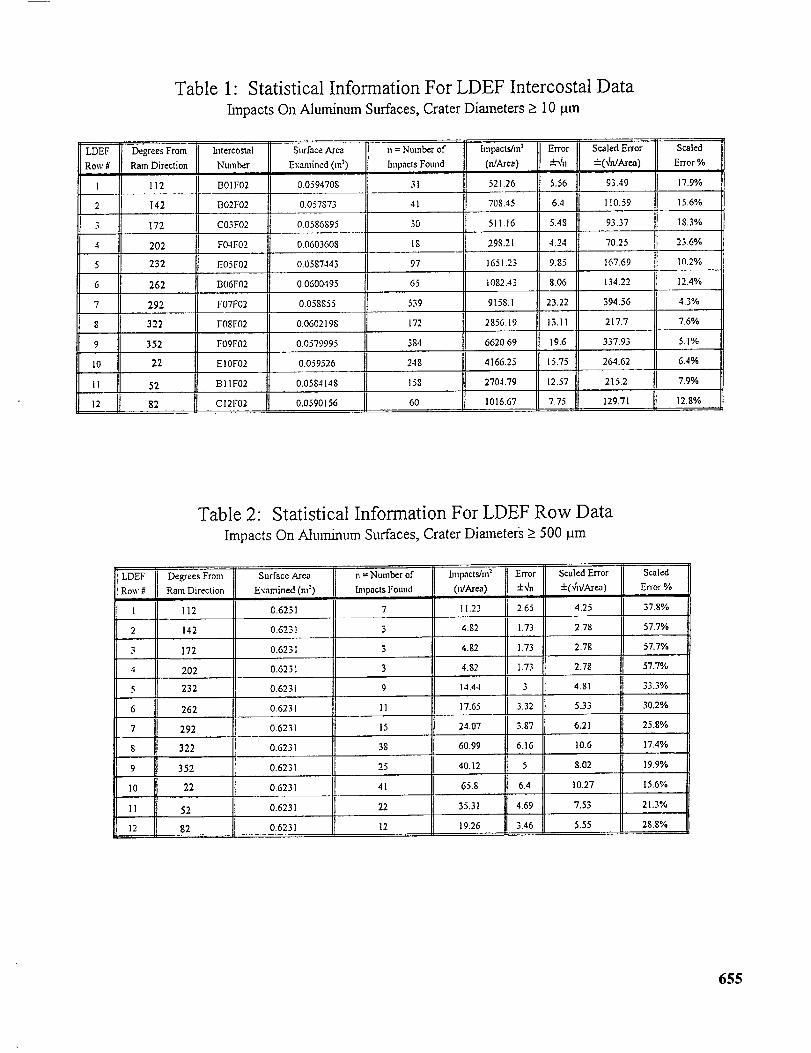
Table 1: Statistical Information For LDEF Intercostal Data
Impacts On Aluminum Surfaces, Crater Dimneters > 10 pan
Degrees From hltercostal
Ram Direction Number
Sltrface Area
Exmnined (m:)
11= Number of
hnpacts Found
31
[mpaclshn:
112 B01F02 0,0594708
142 BO2F02 0.057873 41 708.45
172 C03F02 0.0586895 30 511.16
202 F04F02 0.0603608 18 29821
232 E05F02 0.0587443 97 1651.23
262 BO6F02
292 F07F02
322 FOSF02
352 FO9F02
22 EIOF02
52 BIlF02
0dArea)
521,26
0.059526
0.0600495 65 1082.43
0,058855 539 9158.1
0.0602198 172 2856.19
0.0579995 384 6620,69
248 4166.25
0.0584148
C12F02
158
6O82 0.0590156
2704.79
1016.67
Error
K-xln
5.56
6,4
5.48
4.24
9.85
8.06
23.22
13.11
19.6
15.75
12.57
7.75
Scaled Error Scaled
+(414Ar_a) Error%
93.49 17.9%
110.59 15.6%
93.37 18.3%
70.25 23.6%
167.69 I0,2%
134.22 12.4%
394.56 4.3%
217.7 7.6%
337.93 5.1%
264.62 6.4%
215.2 7.9%
129.71 12.8%
LDEFRow g
1
2
3
4
5
6
7
8
9
10
11
12
Table 2: Statistical Information For LDEF Row Data
Impacts On Aluminum Surfaces, Crater Diameters > 500 I.tm
Degees From
Ram Direction
Surface Area
Examined (m:)
n = Number of
Impacts Found
7112 0.6231
142 0.6231 3 4.82
172 0.6231 3 4.82
202
232
262
292
0.6231
0.6231
0.6231
0.6231
0.6231322
11
15
38
Impacts/m _
0v'Area)
11.23
4.82
14.44
17.65
24.07
60.99
352 0.6231 25 40.12
22 0,6231 41 65.8
O.6231 22 35.3152
82 O.6231 12 19.26
Error
±4n
2.65
1,73
1.73
1.73
3
3.32
3.87
6.16
5
6.4
4.69
3.46
Scaled Error
+(414Area)
4.25
2.78
2.78
2.78
Scaled
Error %
37.8%
57.7%
57.7%
57.7%
4.81 33.3%
5.33 30.2%
6.21 25.8%
10.6 17.4%
8.02 19.9%
10.27 15.6%
7.53 21.3%
5.55 28.8%
655

the underlying aluminum, the result can be to reduce the crater sizes. This effect will produce a
"skew" to the data, such that the plot of cumulative cratering artificially "flattens off" at the
smaller sizes. Presently, we do not know the exact thickness of the anodized layer. However,
we do know that if it is about 1 mil, then all craters below about 100 microns in diameter are
affected.
Since impact events are assumed to be random it is appropriate to apply Poisson statistics to
establish the appropriate standard deviations for the data. Thus, if the number of hits on a given
area is N, the standard deviation is +/- N °5. Table I summarizes the data for the intercostals,
giving the raw hit counts, the corresponding areas, and the resulting standard deviations, while
Table II summarizes similar data for the rows. Since the investigated areas were usually
considerably less than 1 square meter each, the error must be scaled up by the same ratio as the
count rate in order to be consistent for quotes on a per meter squared basis. In Figures %-1
there are overlapping data at some common crater sizes for the intercostals and the rows.
Sometimes these data differ by more than a standard deviation of the individual data points.
This more accurately indicates the true degree of uncertainty in the measured data. Such
variations are to be expected, since Poisson statistics only apply for a truly random flux of
impactors. As a simple example, if debris were really in circular orbits they would exist in
striated orbits, since launches have not been made randomly into every possible altitude. It is
the combination of (a) random collisional breakup, (b) air drag and, (c) initial elliptical launched
orbits, that tend to give a randomization of the debris particles. Likewise, there is no apriori
reason to believe that the micrometeoroids are truly randomly distributed. Data from the IDE 16
experiment on LDEF certainly indicate a degree of non-randomness in time showing apparent
clustering behavior, and the integrated data from the F07F02 intercostal indicate similar effects
with regard to location.
656

CONCLUSIONS
The comparisons provided herein demonstrate a good measure of the relative applicability
of the environment models for first-order engineering design purposes, but illustrate the need
for higher fidelity in the small impactor - spacecraft degradation - regime. One should be
cautious in utilizing these comparisons to validate the micrometeoroid and debris models. The
assumptions underlying these analyses are necessarily simplistic. For example, time-dependent
variations associated with toroids or clouds of debris impactors (as inferred from the IDE
experimental data) are not taken into consideration, nor is the fact that many of the debris
impactors are in elliptical orbits around the Earth. The models and collected data do agree on
several points however. Space debris does exist in all sizes, and has the possibility of growing
into a potentially catastrophic problem, particularly since self-collisions between particles can
rapidly escalate the numbers of small impactors. Kessler has deduced that a "runaway"
escalation (which grows with the square of the population of particles) may already be
occurring at an altitude of about 1000 km, where there is a local peak in the debris population. 2
With regard to statistical errors, the data suggest that the true impact fluence, or flux, is
rarely defined any better than one standard deviation (s.d, Poisson logic) and is frequently only
good to about three standard deviations, as evidenced by the "overlap" data taken on the
intercostals versus the rows. Clearly, an updated model of the debris environment is required
which incorporates elliptical orbits. Kessler 7 is presently addressing this issue, while an
independent study is underway by Divine _8at the Jet Propulsion Laboratory based on
first-principles of orbital dynamics.
Updates in the scaling laws used to predict cratering are also needed. While this present
study concentrated on the aluminum structure, there are many other target materials which
suffered from cratering and/or perforations. Scaling laws are required to relate these various
data. Presently, based on our own independent CTH computer modelling, we conclude that the
657
perforation limit equation of McDonnell 8'_2is credible, at least for symmetric impacts (e.g.,
AI/A1). The McDonnell equation is cited only because it is one that we have been recently
exercising. Other equations, such as those by Cour-Palais or Christiansen may be equally
credible, we simply have not yet performed the necessary comparisons. However, more data
and modelling are needed to establish generalized rules which account for both cratering and
perforations for any combination of impactor/target and for wide ranges of impact speeds and
angles of incidence.
Based on limited attempts to model impact events with the CTH code, we conclude that
this hydrocode has the capability to realistically simulate many experimentally observed
phenomena. A virtue of such a code is the ability to map out the sensitivities to assumed
parameter changes, such as yield strengths, fracture strengths and interlayer bond strengths.
Accordingly, we recommend further such computer studies in order to allow better
understanding of impact events and correlations with experimental data.
658

REFERENCES
1, Cour-Palais B.G. et. al.: Meteoroid Environment Model - 1969 (Near Earth to Lunar
Surface). NASA SP-8013, 1969.
2. Kessler D.J.; Reynolds R.C.; Anz-Meador P.D.: Orbital Debris Environment for Spacecraft
Designed to Operate in Low Earth Orbit. NASA TM-100471, 1988. Also: D.J. Kessler,
Orbital Debris Technical Interchange Meeting, Phillips Laboratory presentation, 2-3 April,
1991.
3. Bell R.L. et al.: The CTH Code (Version 1.024), Structural and Solid Mechanics
Department, Sandia National Laboratory, Albuquerque, NM, October, 1991.
4. Atkinson D.A.; Watts A.; Crowell L.: Final Report: Spacecraft Microparticle
Impact Flux Definition. Prepared for: LLNL, Univ. of Calif. by POD Associates, Inc.,
1991.
5. Berhard R.P., See T.H., Horz F., Projectile Compositions and Modal Frequencies on the
"Chemistry ofMicrometeoroids" LDEF Experiment, Second LDEF Post-Retrieval
Symposium, NASA Conf. Pub., 1992.
6. Simon C.G. et al.: Elemental Analyses of Hypervelocity Micro-Particle Impact Sites on
Interplanetary Dust Experiment Sensor Surfaces (abstract). Second LDEF Post-
Retrieval Symposium, NASA Conf. Pub. 10097, 1992.
7. Kessler D.J.: Origin of LDEF Debris Impacts on LDEF's Trailing Surfaces.
Second LDEF Post-Retrieval Symposium, 11 pp, NASA CP-3194, 1993.
8. Watts A.J.; Atkinson D.R.; Rieco S.F.: LDEFPenetration Assessment: Final
Report. Prepared for Nichols Research Corporation, Dayton, OH by POD Associates, Inc.,
1992.
9. Zook H.A.: Meteoroid Directionality on LDEF and Asteroidal Versus Cometary
Surfaces (abstract). In Lunar and Planet. Sci. Co1_ XXI1, Lunar and Planetary Institute,
Houston, TX, pp. 1385-1386, 1990.
10. Cour-Palais B.G., Hypervelocity Impacts in Metals, Glass and Composites, Proceedings of
the 1986 Symposium, Hypervelocity lmpact, Pergamon Press, 1986.
659

11. Christiansen E.L., Investigation of Hypervelocity Impact Damage to Space Station Truss
Tubes, International Journal of Impact Engineering, Proceedings of the 1989 Symposium,
Vol. 10, 1990, p. 125.
12. McDonnell J.A.M. eta/. : An Empirical Penetration Equation for Thin Metallic Films Used
in Capture Cell Techniques. Nature, 309, pp. 237-240, 1984. Updates with K. Sullivan,
private communication, 1991.
13. Miriam Gersten: Maxwell Laboratory, Personal Communication, March 1992.
14. See T.H. et al.: Meteoroid and Debris Impact Features on the Long Duration
Exposure Facility: A Preliminary Report. NASA JSC #24608, 1990.
15. See T.H. et al.: Detailed examination of LDEF's Frame and the A0178 Thermal
Blankets by the Meteoroid and Debris Special Investigation Group (abstract). Second
LDEF Post-Retrieval Symposium, 1992.
16. Mullholland J.D., and 8 co-authors (1991), IDE Spatio-Temporal Fluxes and High
Time-Resolution Studies of Multi-Impact Events and Long-Lived Debris Clouds, LDEF-
69 Months in Space, First Post-Retrieval Symposium, NASA CP-3134, p. 517-528.
17. Grfin E. et al.: Collision Balance of the Meteoritic Complex. Icarus, 62, 244-272, 1985.
18. Divine N. and Agtiero R. C.: New Meteoroid Model Predictions for Directional
Impacts On LDEF (abstract), Second LDEF Post-Retrieval Symposium, NASA C.P. -
10097, p. 56, 1992.
660

Appendix
CTH Code Validation
661

APPENDIX
CTH CODE VALIDATION
The first task with the CTH code was to perform some type of validation between experimental
results and reproducible computer simulations. The data and results from a series of gas gun
experiments were provided by Dr. Fred H6rz of NASA Johnson Space Center.
The data provided by NASA contained many combinations of materials that were used for the
impactor and the projectile. In order to get reasonably accurate results with the CTH code the
materials chosen had to have material properties that were readily available and well
characterized. Complex compound materials were ruled out, leading to a choice of an aluminum
target and an impactor made of soda-lime glass. Results from the runs are illustrated below in
Table A- 1.
Table A-l: Data Comparison from CTH Run and HOrz et al. (1992)
Shot
Number
785
786
787
788
789
791
ProjectileDiameter
(mm)
3.18
3.18
3.18
3.18
3.18
3.18
Aluminum
Thickness
(mm)
9.53
9.02
8.64
7.62
1.6
19.94
Velocity
(km/see)
5.91
5.8
5.81
5.79
5.87
5.84
Hole
Diameter
(mm)
H(}RZ (1992)
2.24
3.62
7.31
10.19
8.77
13.73"
Hole
Diameter
(mm)
CTH
9.8
10
12.5
12.5
10
11.000"
*These values are for crater diameters; they were not penetrations.
662

Severalmodelswereavailablein theCTH code,however,theonechosenwasthe
Mie-Gr_neisen.Thevariablesusedin theCTH runs_areshownin TableA-2.
TableA-2: Variablesusedin CTH Calculations
Material
Aluminum
Soda-Lime
Density
(g/cm2.7
2.2
Sound Speed
(cm/sec)
5.31 x 10⁵
5.91 xl05
Griineisen
2.25
0.4
Heat
Capacity
(erg/cm$/eV)
1.049 x 101_
8.744 x 10 _°
Constant in
Linear
Hugoniot
1.34
1.5
The aluminum alloy that was used in the experiments was AI-1100 variety, but the temper was
not known. The temper of the metal can result in large changes in the tensile strength and the
yield strength. In order to match the experimental results, it was necessary to run several
calculations that used a range of yield and tensile strengths. The final values that were arrived at
are listed in Table A-3:
Table A-3: Yield and Tensile Strengths Used in CTH Calculations
Material
Aluminum
Soda-Lime Glass
Yield Strength (kbar)
1.3
10
Poisson Ratio
0.35
0.16
Fracture Stress
(kbar)1.6
1.2
The primary goal of this series of runs was to replicate the wall penetration limit that was seen
in the experimental results. The final values listed above successfully simulated this
experimental limit. Exact replication of the hole diameters for penetration was not expected,
since only small changes in velocity or material properties produce rapid changes in the
perforation. The aluminum alloy that best matched the NASA-JSC data was identified as
AI-1100-H16. The data chosen for the soda-lime glass were based on quotes from
manufacturers and reference data for various glasses. The CTH calculations indicated only a
moderate sensitivity to parameter changes for the glass impactor, but large sensitivity to the
663

values for the aluminum target. No attempt has yet been made to model other experimental
data, such as that for the A1 foils used by McDonnell.
664