ldar case study - us epa · 12/14/2015 1 improving safety maximizing profits reducing emissions...
TRANSCRIPT
12/14/2015 1
IMPROVING SAFETYMAXIMIZING PROFITSREDUCING EMISSIONS
MAINTAINING COMPLIANCE
LDAR Case Study Comparison of Conventional
Method 21 vs Alternative Work Practice (Optical Gas Imaging)
Terence Trefiak P.E.
OVERVIEW
• AWP Components/Requirements
• AWP vs Conventional Comparison
• Case Study Data
METHOD 21 AWP• Released in 2008 to address new technology - Optical
Gas Imaging (OGI)• Allows facilities to identify leaking equipment using an
OGI instrument instead of a leak monitor prescribed in 40 CFR part 60, Appendix A-7 (i.e., a Method 21 instrument)
• Provide for emissions reductions at least as equivalent as the current work practice
• Document provides instructions and requirements for using OGI

DETECTION TECHNOLOGIESOGI:FLIR GF 320 or OPGAL EYECGAS
Uses infrared absorption principles of hydrocarbon gases
Allows user to actually see the gas images
Conventional:Gas Detector (EC, FID, PID) & Snoop
Selection based on compound of interest Provides ppm level detection of gas leaks Can be used for leak confirmation

AWP REQUIREMENTS Modified Monitoring Frequencies
• Bi-annual on all components OGI Performance Testing
• Daily performance test to determine minimum detection level at maximum camera distance
Data Recording • Must record video of entire inspection
Leak definition• Not based on PPM
Requires conventional assessment once annually

FREQUENCYM21 –various leak definitions based on parts per million (ppm) and corresponding monitoring frequencies (monthly, quarterly, or annually)AWP – Entire facility, based on detection sensitivity level:
“increased frequency of monitoring to detect larger leaks to compensate for the camera’s inability to detect small leaks”
OGI DETECTION LIMIT• Reference rate of 60 grams/hour • Tests show rates as low as 0.8 grams/hour
using methane• TARGET – average leaks detection minimum
ranges from: 300 to 1500 PPM (2.5 g/hr to 10 g/hr)
• Environmental conditions have impact on limit (wind speed, delta T, background scene)

3RD PARTY MDLR• Minimum Detected leak rate (MDLR)• 1-Pentene - 5.6g/hr• Benzene - 3.5g/hr• Butane -0.4g/hr• Ethane - 0.6g/hr• Ethanol - 0.7g/hr• Ethylbenzene - 1.5g/hr• Ethylene - 4.4g/hr• Heptane - 1.8g/hr• Hexane - 1.7g/hr• Isoprene - 8.1g/hr• MEK - 3.5g/hr
• Methane - 0.8g/hr • Methanol - 3.8g/hr • MIBK - 2.1g/hr • Octane - 1.2g/hr • Pentane - 3.0g/hr • Propane - 0.4g/hr • Propylene - 2.9g/hr • Toluene - 3.8g/hr • Xylene - 1.9g/hr

PERSPECTIVE• 1 Medium leak found 6 months earlier with OGI
vs M21• 250,000ppm vs. 500ppm = 500x bigger • Orders of Magnitude differences in size • Each med-high OGI leak detected equivalent to
hundreds or thousands of small leaks• Higher frequency = faster detection of high
emitters = significant impact on annual emission rates
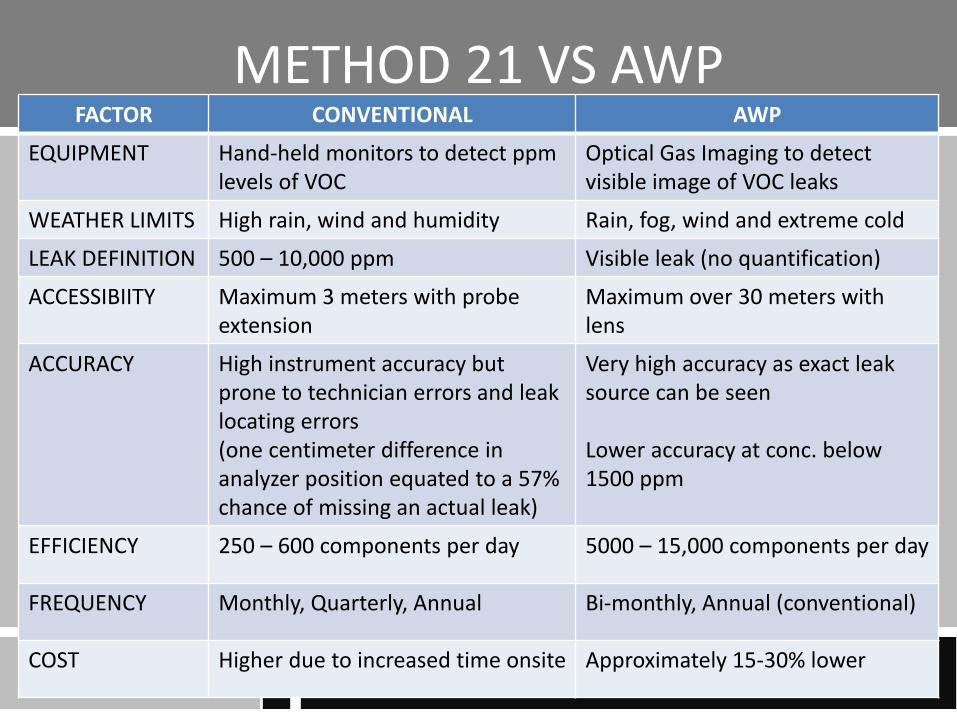
METHOD 21 VS AWPFACTOR CONVENTIONAL AWP
EQUIPMENT Hand-held monitors to detect ppm levels of VOC
Optical Gas Imaging to detectvisible image of VOC leaks
WEATHER LIMITS High rain, wind and humidity Rain, fog, wind and extreme cold
LEAK DEFINITION 500 – 10,000 ppm Visible leak (no quantification)
ACCESSIBIITY Maximum 3 meters with probe extension
Maximum over 30 meters with lens
ACCURACY High instrument accuracy but prone to technician errors and leak locating errors (one centimeter difference in analyzer position equated to a 57% chance of missing an actual leak)
Very high accuracy as exact leak source can be seen
Lower accuracy at conc. below 1500 ppm
EFFICIENCY 250 – 600 components per day 5000 – 15,000 components per day
FREQUENCY Monthly, Quarterly, Annual Bi-monthly, Annual (conventional)
COST Higher due to increased time onsite Approximately 15-30% lower

M21 PITFALLSStaffing Highly competitive mature market has led to low wages
and reflects on hiring standards Significant inconsistency in performances High turnaround and minimal training
Short Cuts LDAR industry continuously battles cheating methods Monotonous tasks
Tag Program Gaps Challenge to keep inventory updated

AWP BENEFITS• Provides equivalent control and is less burdensome to implement • Length of assessments lower (less $)• Able to scan components that were previously unsafe or inaccessible
(reduce scaffolding / manlift requirements)• Can see leak source, preventing leak and repair errors, eliminates “ghost
leaks” • Video image of leak sources and full video record for auditing• Eliminates the need to calculate different monitoring requirements for
different devices simplifying the process• Leaks detected/repaired sooner, significantly lowering annual emission
rates• Amount of emissions released by smaller leaks possibly missed by OGI
surveys are offset by the faster identification (and repair) of larger leaks when surveys are conducted on a more frequent basis.

METHOD 21 CONVENTIONAL VS AWP

METHOD 21 CONVENTIONAL VS AWP

EPA KKK & OOOO• LDAR regulations that applied to NG Processing
Facilities
• New OOOO in draft form, CH4 inclusion
Requirement KKK OOOO
Applicable commence construction, modification or reconstruction before August 23, 2011
commence construction, modification or reconstruction after August 23, 2011
Components Excludes connectors Includes connectors
Leak Definition 10,000 ppm 500 ppm

CASE STUDY• Regulatory Requirement: EPA Subpart OOOO• 6 process units• Over 16,796 components
CASE STUDY COMPONENTS M21 AWP
Compressor 14 Q BM, AConnector 10500 A BM, A
Press Relief Device 146 Q BM, APump 35 M BM, AValve 6101 Q BM, A
TOTAL 16796 12 trips 6 trips
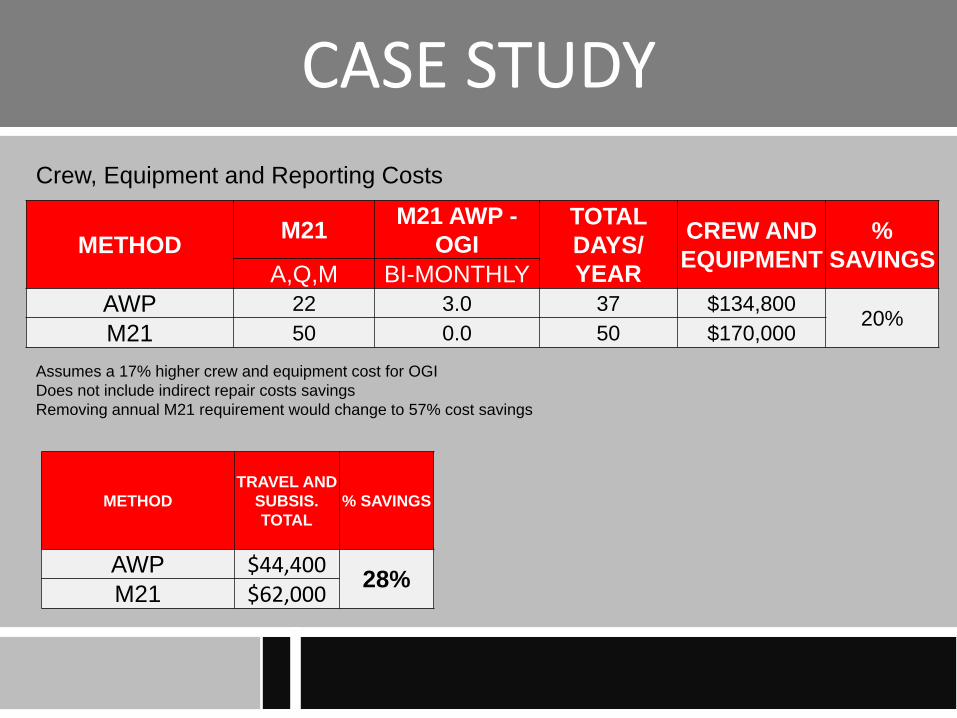
CASE STUDY
METHOD M21 M21 AWP -OGI
TOTAL DAYS/YEAR
CREW AND EQUIPMENT
% SAVINGSA,Q,M BI-MONTHLY
AWP 22 3.0 37 $134,80020%M21 50 0.0 50 $170,000
Crew, Equipment and Reporting Costs
Assumes a 17% higher crew and equipment cost for OGI Does not include indirect repair costs savingsRemoving annual M21 requirement would change to 57% cost savings
METHODTRAVEL AND
SUBSIS. TOTAL
% SAVINGS
AWP $44,400 28%M21 $62,000

LEAK COUNT
Plant 1 Plant 2
Method Leak Count
AWP 561M21 555
Method Leak Count
AWP 335M21 329
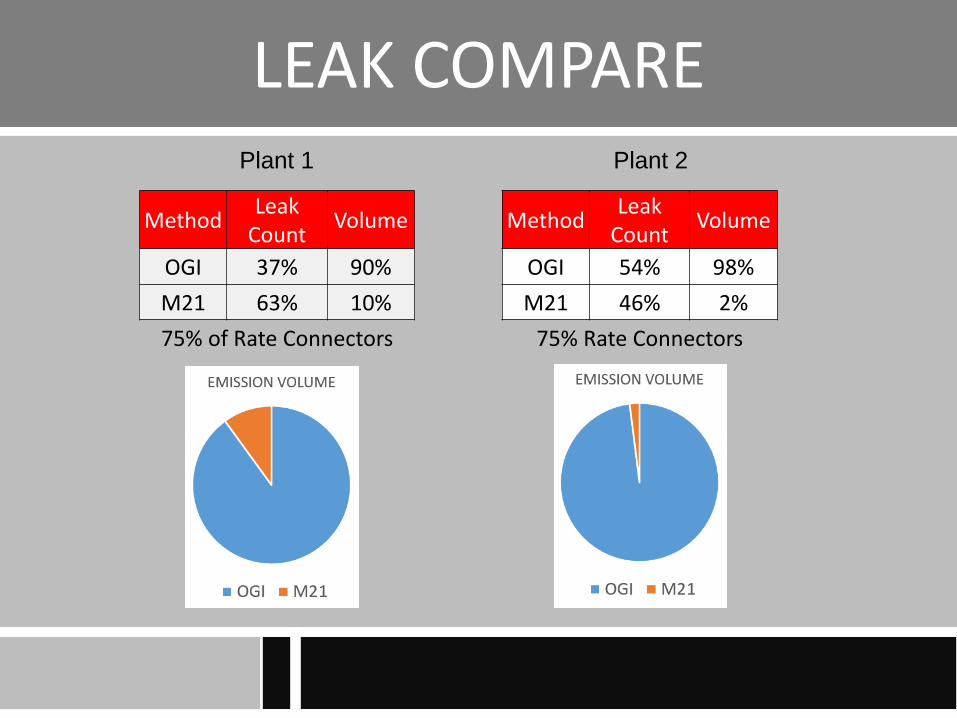
LEAK COMPAREPlant 1 Plant 2
Method Leak Count Volume Method Leak
Count Volume
OGI 37% 90% OGI 54% 98%M21 63% 10% M21 46% 2%75% of Rate Connectors 75% Rate Connectors

OGI USAGE• EPA Subpart W – recommended and most
common technology used• EPA OOOOa – Transmission sites required to
perform OGI LDAR Program• State Level – numerous State requirements
enlisting OGI • Inspection Tool – Federal and State Regulatprs
using OGI for facility inspections
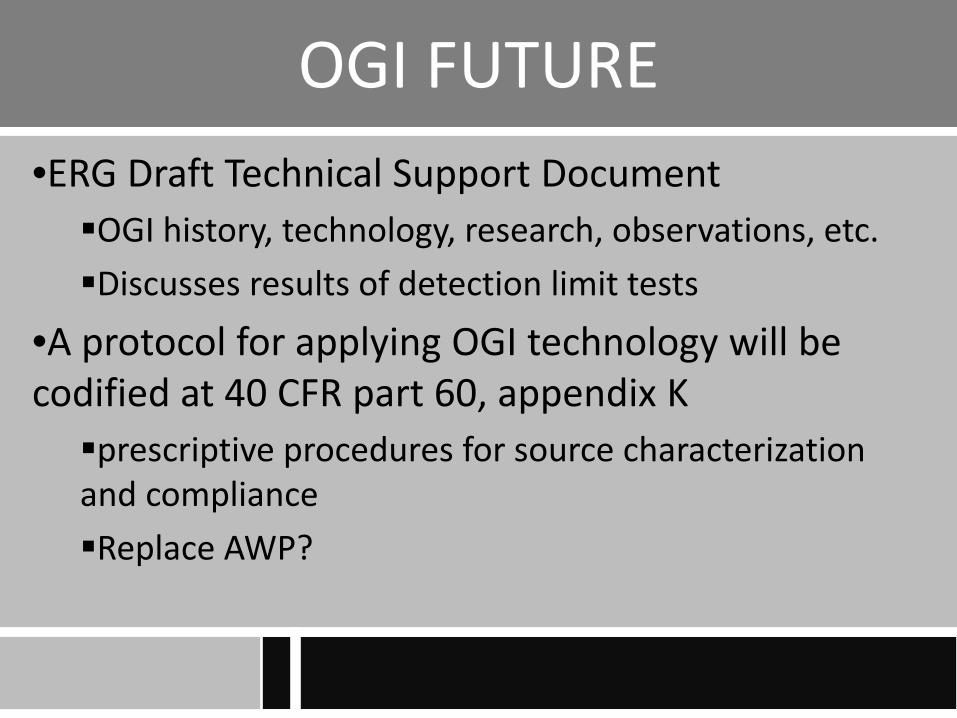
OGI FUTURE•ERG Draft Technical Support DocumentOGI history, technology, research, observations, etc.Discusses results of detection limit tests
•A protocol for applying OGI technology will be codified at 40 CFR part 60, appendix Kprescriptive procedures for source characterization and complianceReplace AWP?