lc-qtof-ms analysis and activity profiles of popular...
TRANSCRIPT
Research ArticleLC-QTOF-MS Analysis and Activity Profiles of PopularAntioxidant Dietary Supplements in Terms of Quality Control
Elwira Sieniawska,1 Tomasz Baj,1 Rafal Sawicki,2 Aleksandra Wanat,1
Krzysztof Kamil Wojtanowski,1 Grazyna Ginalska,2 Grazyna Zgorka,1 andJolanta Szymanska3
1Chair and Department of Pharmacognosy with Medicinal Plant Unit, Medical University of Lublin, Chodzki 1,20-093 Lublin, Poland2Chair and Department of Biochemistry and Biotechnology, Medical University of Lublin, Chodzki 1, 20-093 Lublin, Poland3Chair and Department of Paedodontics, Medical University of Lublin, Karmelicka 7, 20-081 Lublin, Poland
Correspondence should be addressed to Elwira Sieniawska; [email protected]
Received 5 March 2017; Revised 24 April 2017; Accepted 9 May 2017; Published 31 May 2017
Academic Editor: Patricia Morales
Copyright © 2017 Elwira Sieniawska et al. This is an open access article distributed under the Creative Commons AttributionLicense, which permits unrestricted use, distribution, and reproduction in any medium, provided the original work is properlycited.
The dietary supplements with claimed antioxidant activity constitute a substantial part of the dietary supplement market. In thisstudy, we performed the LC-QTOF-MS analysis and investigated the activity profiles of popular antioxidant dietarysupplements from different chemical groups in terms of quality control. The commonly used antioxidant tests and statisticalanalysis revealed that substantial part of the results was comparable if 1 g sample was considered, but while comparing singleand daily doses, significant differences in antioxidant values were noticed in all assays. The best antioxidant activity wasobtained in ORAC assay (from 142 to 13814μM of Trolox equivalents per 1 g of sample), and the strongest correlation occurredbetween TPC and ORAC. The LC-QTOF-MS analysis revealed that catechins were present in samples having the bestantioxidant activity and that dietary supplements showing the weakest activity contained very small amount of any chemicalconstituents.
1. Introduction
Dietary supplements are nowadays a big branch of foodindustry, and their consumption was reported to increase inthe recent years [1]. They are claimed to provide healthbenefits and prevent numerous chronic diseases. Dietarysupplements containing antioxidants (vitamins, glutathione,selenium, and plant polyphenols) are recommended todiminish oxidative stress occurring in the human body andcausing diseases such as atherosclerosis, arthritis, cancer, car-diovascular disease, and inflammation [1, 2]. Because of thegrowing interest in natural antioxidants, it is possible to findin the market more and more new products containingmainly plant extracts, their blends, isolated plant secondarymetabolites, or algae with declared antioxidant properties.The diversity of active compounds is very large; however,
most of them belong to polyphenols. The antioxidant assayscomparing different foods, beverages, or herbs use 1 g or100 g of sample as a unit of measure. However, for finishedproducts (available as dietary supplements), antioxidantactivity should be rather described for a single dose (onetablet/capsule) or recommended by a producer daily dose(number of tablets/capsules taken per day). This newapproach enables the proper comparison of antiradicalpower of dietary supplements used to enrich diet in antioxi-dants. The assessment of activity of a dose taken is importantin dietary supplement industry because it also enables toguarantee a safety of supplemented compounds.
In this paper, we aimed to characterize dietary supple-ments with claimed antiradical activity containing com-pounds from different chemical groups (anthocyanins,biflavonoids, catechins, curcuminoids, flavonoids, phenolic
HindawiOxidative Medicine and Cellular LongevityVolume 2017, Article ID 8692516, 11 pageshttps://doi.org/10.1155/2017/8692516
acids, phlorotannins, proanthocyanidins, and stilbenoids).The performed commonly used antioxidant tests (ORAC,ABTS, and DPPH) as well as the measurement of total phe-nolics with Folin–Ciocalteu reagent enabled to compare forthe first time the activity of single dose and daily dose of eachformulation and to draw the correlations between tests used.In terms of quality control, the LC-QTOF-MS analysis wasused for a chemical characterization of the studied dietarysupplements.
2. Experimental
2.1. Sample Preparation. All dietary supplements (DS) werecommercially available and were bought in the pharmacystore. The active ingredients declared by the manufactureralong with recommended daily dose are listed in theTable 1. Ten capsules or tablets were taken from each pack-age of examined DS. The content of the capsules was quanti-tatively transferred into the conical flask, whereas tabletswere placed in a flask without grinding. Bidistilled water(100mL) was added to the flask, and the content of the vesselwas heated for 1 hour at 37°C and mixed using a magneticstirrer. Then, the mixture was centrifuged at a speed of3300 rpm for 10min, and precipitate was removed by filtra-tion. The obtained aqueous filtrate was freeze-dried (FreezeDryer, Christ Alpha 2–4 LD, Germany). A similar procedurewas repeated for each DS. The lyophilisates were weighedand stored in a vacuum-sealed containers until used.
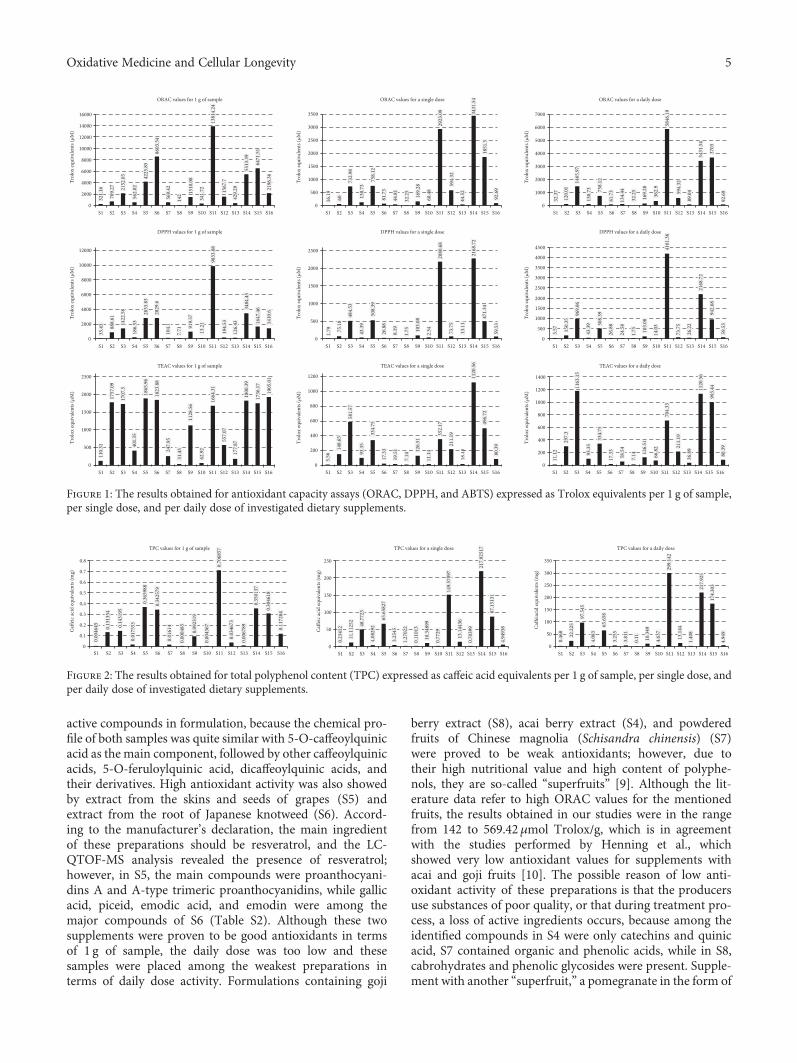
2.2. Determination of Antioxidant Activity. The oxygen radi-cal absorbance capacity assay (ORAC) was adopted from [3],and the α,α-diphenyl-β-picrylhydrazyl (DPPH) assay wasadopted from [4]. 2,2′-Azino-bis(3-ethylbenzothiazoline-6-sulphonic acid) (ABTS) assay followed the method of [5]with modifications for microscale measurements. All reac-tions were done in 3 replicates for each sample (standardand DS samples). Trolox used in the abovementioned testswas dissolved in methanol and diluted to obtain the followingconcentrations: 3.125, 6.25, 12.0, 25.0, 50.0, 100.0, and200.0μM. The samples of DS were prepared by dissolutionof exactly weighted 1mg of each lyophilisate in deionizedwater, and the dilutions of obtained stock solutions were inthe range from 0.01 to 0.1mg/mL depending on the sampleactivity. The results obtained for ORAC, DPPH, and ABTSassays were expressed as Trolox equivalents per 1 g of sample,per single dose, and per daily dose of investigated dietarysupplements.
The total phenolic content assay (TPC) was adoptedfrom [6] with modifications for microscale measurements.The working solution of Folin–Ciocalteu reagent (FCR) wasprepared by 1 : 10 (v/v) dilution of the stock solution withdeionized water. The caffeic acid was dissolved in deionizedwater and diluted to obtain the following concentrations:0.625, 1.25, 2.5, 5.0, 10.0, 20.0, and 40.0μg/mL. The samplesof DS were prepared by dissolution of exactly weighted1mg of each lyophilisate in deionized water to obtain con-centrations in the range from 2.0 to 0.5mg/mL dependingon the sample activity. The experimental wells in the 96-well plate were filled with 10μL of samples or caffeic acid
concentrations, whereas the blank wells received 10μL ofdeionized water. Then, 50μL of FCR was added to everywell, and after 30 seconds, all wells were filled with150μL of saturated sodium carbonate solution. The platewas incubated in the 40°C for 30 minutes. Next, the absor-bance was measured at 740nm using the microplatereader. The plate reader was controlled by Gen5™ DataAnalysis software, which was used also to obtain standardcurve by plotting the absorbance of caffeic acid against itsvarious concentrations. All reactions were done in 3 repli-cates for each sample (standard and antioxidant samples).The results obtained for TPC assay were expressed as caf-feic acid equivalents per 1 g of sample, per single dose, andper daily dose of investigated DS.
2.3. LC-QTOF-MS Analysis. The LC-QTOF-MS analysiswas performed on Agilent 1200 Infinity HPLC chromato-graph hyphenated with QTOF 6530B Accurate-MassQTOF LC/MS system equipped with Dual Agilent Jet Streamspray source (ESI) (Agilent Technologies, Santa Clara, CA,USA) connected with N2 generator (Parker Hannifin Corpo-ration, Haverhill, MA; generating N2 at purities > 99%).HPLC was performed on Gemini® 3μm i.d. C18 with TMSendcapping, 110Å, LC Column 100×2mm, and mobilephase was a gradient of 5% acetonitrile in water (A) and95% acetonitrile in water (B); both phases have a pH valueof 4.5 with addition of 10mM of ammonium formate. Amobile phase gradient was optimized according to the polar-ity of compounds present in the samples. Samples S1, S10,and S14 were analyzed in the gradients 0–45min from 5 to60% of B, 46–55min from 61 to 90% of B, and 56–60min90% of B. For samples S3–S7, S9, S13, and S15, the gradients0–45min from 5 to 40% of B, 46–55min from 41 to 80% of B,and 56–60min from 81 to 90% of B were applied. Samples S2,S8, S11–12, and S16 were separated in the gradients 0–45minfrom 0 to 20% of B, 46–55min from 21 to 60% of B, and 56–60min from 61 to 90% of B. The flow rate was 0.1mL/min.Total analysis time was 75min. ESI-QTOF-MS analysis wasperformed in 2GHz extended dynamic range, negative ioni-zation mode, with fragmentor energy of 160V, drying gastemp: 350°C, drying gas flow: 12 l/min, sheath gas temp:400 °C, sheath gas flow: 12 l/min; nebulizer pressure: 35 psig,capillary V (+): 4000V, and skimmer: 65V. The acquisitionparameters are as follows: auto MS/MS mode; mass range50–1000 amu for MS and 50–1000 amu for MS/MS experi-ment; and 1 spectra/s acquisition. The collision-induced dis-sociation (CID) energy was optimized in the range 10–40V.The identification of compounds present in samples was per-formed by comparison of MS/MS spectra with literature dataand records from METLIN database. The tentative identifi-cation of some derivatives was based on the fragmentationpatterns of known compounds.
2.4. Statistical Analysis. Each antioxidant activity assay wasdone in 3 replicates from the same sample in order to deter-mine the precision of method used. The arithmetic mean andmedian, standard deviation, and coefficient of variation werecalculated for the results obtained by various methods. Cor-relations among data obtained using different assays were
2 Oxidative Medicine and Cellular Longevity
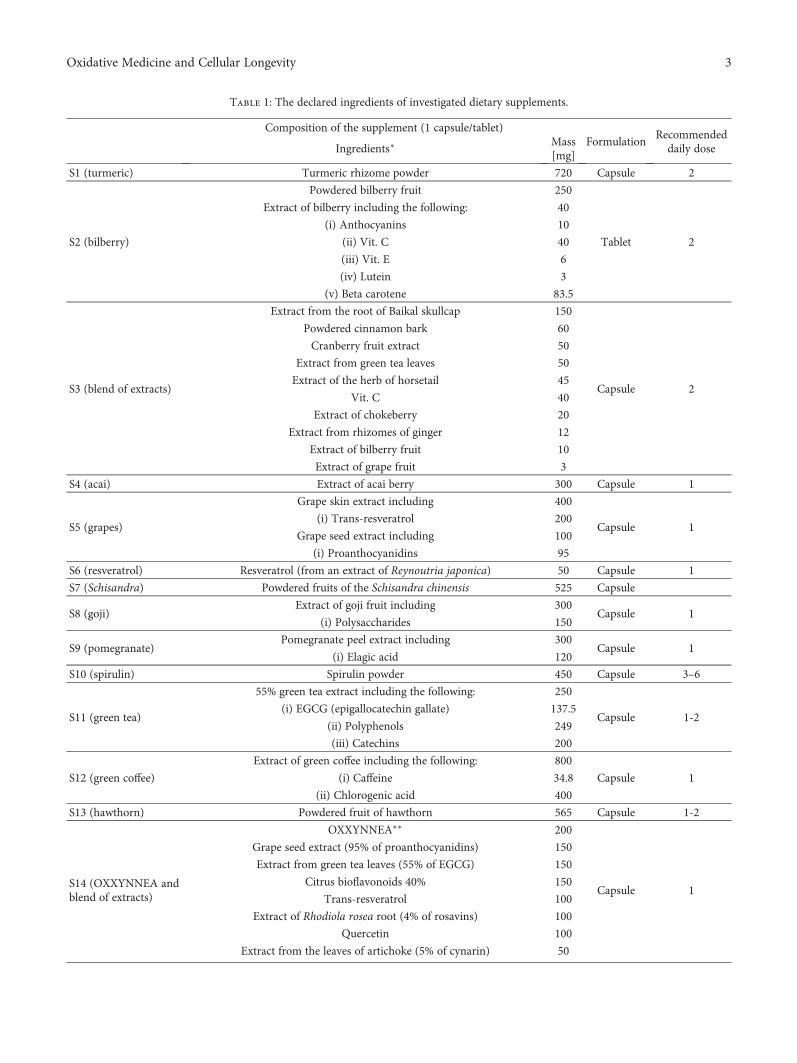
Table 1: The declared ingredients of investigated dietary supplements.
Composition of the supplement (1 capsule/tablet)Formulation
Recommendeddaily doseIngredients∗
Mass[mg]
S1 (turmeric) Turmeric rhizome powder 720 Capsule 2
S2 (bilberry)
Powdered bilberry fruit 250
Tablet 2
Extract of bilberry including the following: 40
(i) Anthocyanins 10
(ii) Vit. C 40
(iii) Vit. E 6
(iv) Lutein 3
(v) Beta carotene 83.5
S3 (blend of extracts)
Extract from the root of Baikal skullcap 150
Capsule 2
Powdered cinnamon bark 60
Cranberry fruit extract 50
Extract from green tea leaves 50
Extract of the herb of horsetail 45
Vit. C 40
Extract of chokeberry 20
Extract from rhizomes of ginger 12
Extract of bilberry fruit 10
Extract of grape fruit 3
S4 (acai) Extract of acai berry 300 Capsule 1
S5 (grapes)
Grape skin extract including 400
Capsule 1(i) Trans-resveratrol 200
Grape seed extract including 100
(i) Proanthocyanidins 95
S6 (resveratrol) Resveratrol (from an extract of Reynoutria japonica) 50 Capsule 1
S7 (Schisandra) Powdered fruits of the Schisandra chinensis 525 Capsule
S8 (goji)Extract of goji fruit including 300
Capsule 1(i) Polysaccharides 150
S9 (pomegranate)Pomegranate peel extract including 300
Capsule 1(i) Elagic acid 120
S10 (spirulin) Spirulin powder 450 Capsule 3–6
S11 (green tea)
55% green tea extract including the following: 250
Capsule 1-2(i) EGCG (epigallocatechin gallate) 137.5
(ii) Polyphenols 249
(iii) Catechins 200
S12 (green coffee)
Extract of green coffee including the following: 800
Capsule 1(i) Caffeine 34.8
(ii) Chlorogenic acid 400
S13 (hawthorn) Powdered fruit of hawthorn 565 Capsule 1-2
S14 (OXXYNNEA andblend of extracts)
OXXYNNEA∗∗ 200
Capsule 1
Grape seed extract (95% of proanthocyanidins) 150
Extract from green tea leaves (55% of EGCG) 150
Citrus bioflavonoids 40% 150
Trans-resveratrol 100
Extract of Rhodiola rosea root (4% of rosavins) 100
Quercetin 100
Extract from the leaves of artichoke (5% of cynarin) 50
3Oxidative Medicine and Cellular Longevity
calculated using Pearson’s correlation coefficient. Statisticalcalculations were performed using the Statistica software ver-sion 10 (StatSoft Inc., Tulsa, OK, USA).
3. Results and Discussion
Dietary supplements are a big part of food and pharmaceuti-cal market worldwide. They do not undergo quality controls;hence, sometimes the obtained activity may be different thanexpected. In this study, dietary supplements with claimedantioxidant activity were tested to check their real value.Preparations consisted of substances from different chemicalgroups (Table 1) (catechins, curcuminoids, flavonoids, phe-nolic acids, phlorotannins, proanthocyanidins, and stilbe-noids) and showed both very high and negligibleantioxidant activities. The water extracts used in this studywere prepared during one hour stirring of dietary supple-ment content in water in 37°C. These conditions were appliedto simulate the release from formulation matrix of the com-pounds soluble in gastrointestinal fluids.
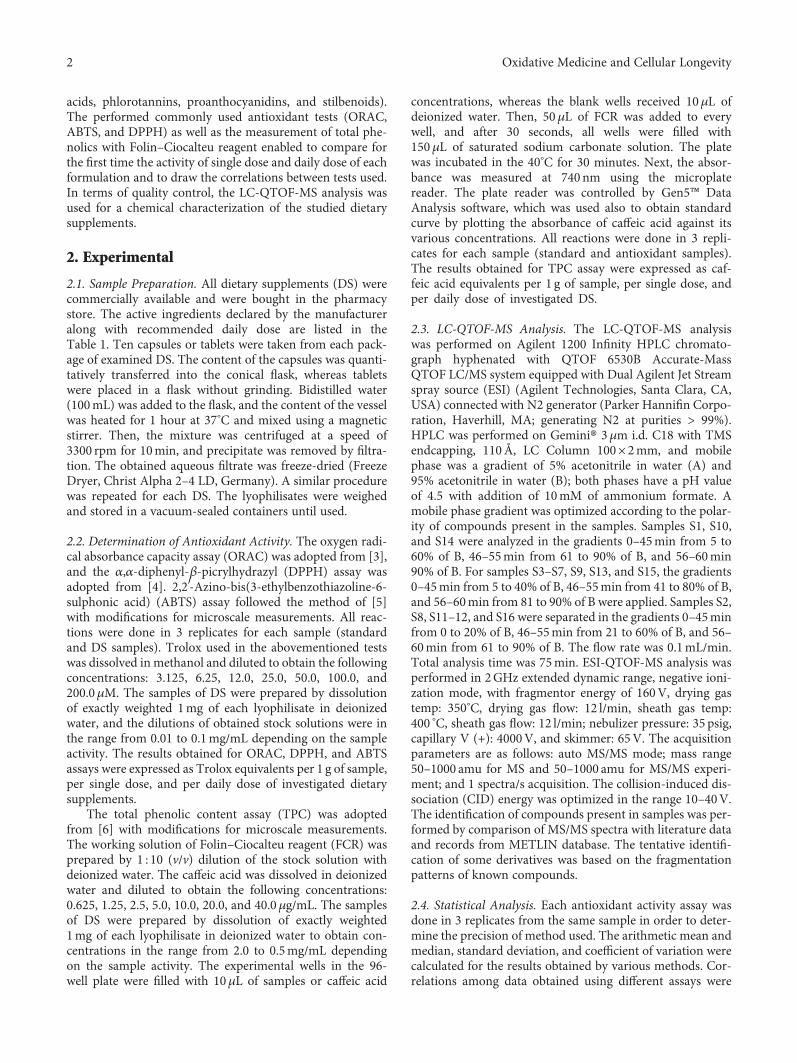
The results obtained in activity assays (Figures 1 and 2)indicated that the activity of standard unit of measure(1 g/100 g) does not correspond to the activity of the doserecommended for diet supplementation. The highest dis-crepancies among the doses were noticed for ABTS assay,where substantial part of the results was comparable if wetake into account the 1 g sample, but totally different patternwas visible for single and daily doses. Smaller differenceswere observed for ORAC and DPPH assays, where the bestactivities were obtained for the same samples. S14 gave thebest result as a single dose, but S11 was the most active as adaily dose (with exception of ABTS assay).
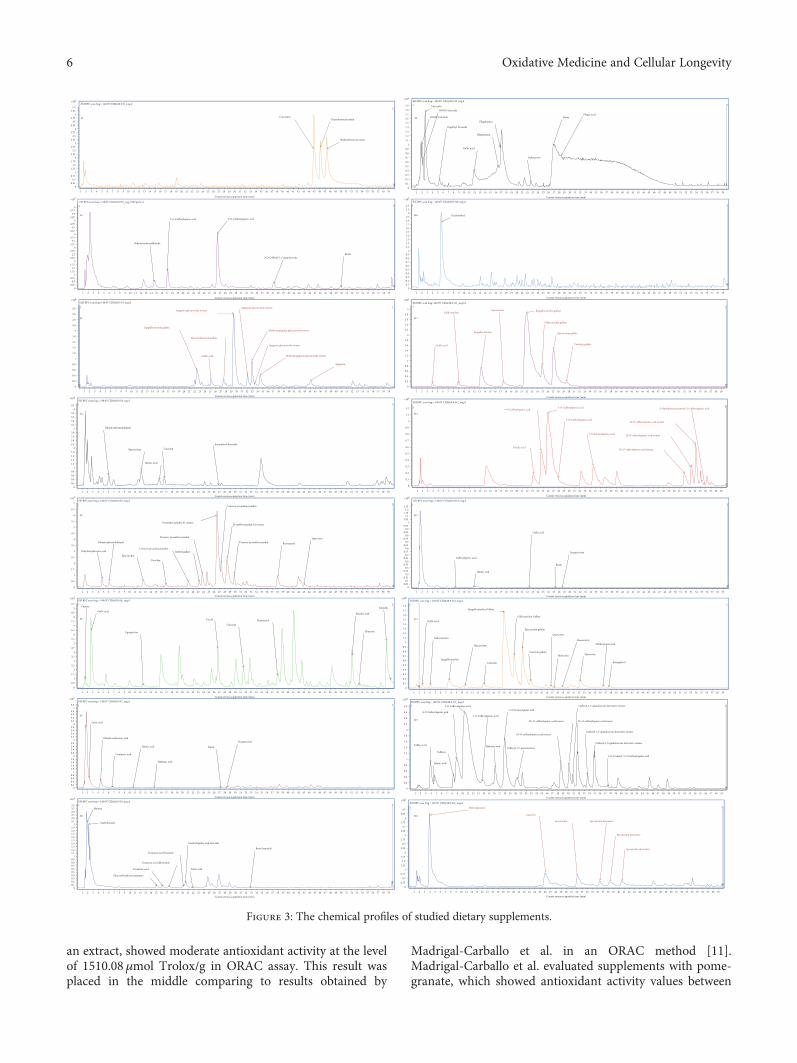
Catechins were the major compounds in the sampleswhich showed the best antioxidant activity (S11 and S14).The supplement with an extract of green tea (S11) containedmainly epi- and gallocatechin gallate as well as epi- andcatechin gallate. The ORAC value obtained for S11(13814.2μmol Trolox/g) corresponds to the highest resultobtained by Seeram et al. who in their study examined
supplements with green tea and described results in the rangefrom 218.7 to 13690.7μmol Trolox/g [7]. It also should benoted that the antioxidant activity of green tea supplementmeasured in the ORAC assay was 1.4 times greater than thatmeasured in the DPPH assay and up to 8.3 times higher thanthat measured in the ABTS method, which can be explainedby the different reaction mechanisms of catechins and usedreagents. This observation is consistent with the resultsobtained by Tabart et al. who showed that flavan-3-ols suchas catechins, epicatechins, and epigallocatechins give a muchhigher antioxidant activity values in the ORAC method thanin ABTS and DPPH assays [8]. The second potent prepara-tion was S14 (OXXYNNEA® and blend of extracts). Accord-ing to the manufacturer, the preparation should containgrape seed extract (95% of proanthocyanidins), extractfrom green tea leaves (55% of EGCG), citrus bioflavonoids40%, extract of Rhodiola rosea root (4% of rosavins),extract from the leaves of artichoke (5% of cynarin),extract of cranberry fruit (10% of proanthocyanidins),trans-resveratrol, quercetin, alpha-lipoic acid, coenzymeQ10, astaxanthin, and lycopene. The performed LC-QTOF-MS analysis (Figure 3, Table S2 available onlineat https://doi.org/10.1155/2017/8692516) confirmed thepresence of catechins, with epigallocatechin gallate as a pre-dominant compound followed by gallocatechin gallate andepicatechin gallate. The other detected compounds were gal-lic acid, flavonoids, and resveratrol. The proanthocyanidins,rosavins, and cynarin were not detected. From the chemicalprofile of this sample, it can be seen that catechins areresponsible for the quite high antioxidant value obtained inthe ORAC assay (5513.39μmol Trolox/g), but the declaredcontent of preparation was not assured. The sample follow-ing catechins in activity was S15. Between the two supple-ments with green coffee extract, only S15 exerted quite highantioxidant activity and this was consistent with total pheno-lic content which reached 304.62 and 34.67mg of caffeic acidequivalents/g for S15 and S12, respectively. Based on thesedata, it can be concluded that the tested supplements of greentea had significantly different quality in terms of quantity of
Table 1: Continued.
Composition of the supplement (1 capsule/tablet)Formulation
Recommendeddaily doseIngredients∗
Mass[mg]
Extract of cranberry fruit (10% of proanthocyanidins) 40
Alpha-lipoic acid 30
Coenzyme Q10 15
Astaxanthin 5
Lycopene 1
Beta carotene 1
S15 (green coffee)An extract of green coffee beans (50% of chlorogenic acid) including 400
Capsule 2(i) Caffeine 20
S16 (Ecklonia)Ecklonia cava extract 25 : 1 (98.8% pure Ecklonia cava—the stem and
leaves standardized to 15% polyphenols and phlorotannins)53 Capsule 1
∗The fillers and additives forming capsule/tablet were omitted; ∗∗OXXYNNEA—the blend of extracts of fruits and vegetables: white and red grapes, oranges,grapefruit, blueberry, papaya, pineapple, strawberries, apples, apricots, cherries, black currants, tomato, carrot, green tea, broccoli, cabbage, onions, garlic oil,wheat germ, cucumber, and asparagus.
4 Oxidative Medicine and Cellular Longevity
active compounds in formulation, because the chemical pro-file of both samples was quite similar with 5-O-caffeoylquinicacid as the main component, followed by other caffeoylquinicacids, 5-O-feruloylquinic acid, dicaffeoylquinic acids, andtheir derivatives. High antioxidant activity was also showedby extract from the skins and seeds of grapes (S5) andextract from the root of Japanese knotweed (S6). Accord-ing to the manufacturer’s declaration, the main ingredientof these preparations should be resveratrol, and the LC-QTOF-MS analysis revealed the presence of resveratrol;however, in S5, the main compounds were proanthocyani-dins A and A-type trimeric proanthocyanidins, while gallicacid, piceid, emodic acid, and emodin were among themajor compounds of S6 (Table S2). Although these twosupplements were proven to be good antioxidants in termsof 1 g of sample, the daily dose was too low and thesesamples were placed among the weakest preparations interms of daily dose activity. Formulations containing goji
berry extract (S8), acai berry extract (S4), and powderedfruits of Chinese magnolia (Schisandra chinensis) (S7)were proved to be weak antioxidants; however, due totheir high nutritional value and high content of polyphe-nols, they are so-called “superfruits” [9]. Although the lit-erature data refer to high ORAC values for the mentionedfruits, the results obtained in our studies were in the rangefrom 142 to 569.42μmol Trolox/g, which is in agreementwith the studies performed by Henning et al., whichshowed very low antioxidant values for supplements withacai and goji fruits [10]. The possible reason of low anti-oxidant activity of these preparations is that the producersuse substances of poor quality, or that during treatment pro-cess, a loss of active ingredients occurs, because among theidentified compounds in S4 were only catechins and quinicacid, S7 contained organic and phenolic acids, while in S8,cabrohydrates and phenolic glycosides were present. Supple-ment with another “superfruit,” a pomegranate in the form of
S16S15S14S13S12S11S10S9S8S7S6S5S4S3S2S1S16S15S14S13S12S11S10S9S8S7S6S5S4S3S2S1S16S15S14S13S12S11S10S9S8S7S6S5S4S3S2S10
7000
ORAC values for a daily doseORAC values for a single doseORAC values for 1 g of sample
6000
5000
4000
3000
2000
1000
0
2500
3000
3500
2000
1500
1000
500
32.3
7
92.6
9
1851
.5
3431
.54
44.5
2
594.
32
2923
.09
60.4
8
169.
28
32.2
5
44.8
1
81.7
3
758.
12
130.
73
732.
98
6016.1
92196
.36
6471
.51
5513
.39
429.
29
1381
4.24
1567
.7
341.
721510
.08
569.
42
142
8603
.54
4225
.85
562.
022152
.03
709.
27
321.
16
Trol
ox e
quiv
alen
ts (�휇
M)
Trol
ox e
quiv
alen
ts (�휇
M)
Trol
ox e
quiv
alen
ts (�휇
M)
120.
01
1465
.97
130.
73 758.
12
81.7
3
134.
44
32.2
5
169.
28
362.
9
594.
32
5846
.19
89.0
4
3431
.54
3703
92.6
9
0
2000
4000
6000
8000
10000
12000
14000
16000
S16S15S14S13S12S11S10S9S8S7S6S5S4S3S2S1S16S15S14S13S12S11S10S9S8S7S6S5S4S3S2S1S16S15S14S13S12S11S10S9S8S7S6S5S4S3S2S10
4500
DPPH values for a daily doseDPPH values for a single doseDPPH values for 1 g of sample
4000
3500
3000
2000
2500
1500
1000
500
0
2000
2500
1500
1000
500
3.57
59.5
3
471.
34
2168
.72
13.1
1
73.7
5
2080
.68
2.3410
3.08
1.758.19
26.8
8
508.
39
43.3
9
484.
53
75.1
8
1.79
1410
.6
1647
.4634
84.4
5
126.
43
9833
.08
194.
53
13.2
1
919.
57
104.
1
7.71
2829
.6
2833
.83
186.
531422
.58
888.
61
35.4
3
Trol
ox e
quiv
alen
ts (�휇
M)
Trol
ox e
quiv
alen
ts (�휇
M)
Trol
ox e
quiv
alen
ts (�휇
M)
150.
35
969.
06
43.3
9 508.
39
26.8
8
24.5
8
1.75 10
3.08
14.0
3
73.7
5
4161
.36
26.2
2
2168
.72
942.
68
59.5
3
0
2000
4000
6000
8000
10000
12000
S16S15S14S13S12S11S10S9S8S7S6S5S4S3S2S1S16S15S14S13S12S11S10S9S8S7S6S5S4S3S2S1S16S15S14S13S12S11S10S9S8S7S6S5S4S3S2S10
1400
TEAC values for a daily doseTEAC values for a single doseTEAC values for 1 g of sample
1200
1000
800
600
400
200
0
1000
1200
800
600
400
200
11.1
280.3
9
496.
72
1120
.56
18.4
5
211.
19352.
17
11.1
4126.
51
7.1419.5
1
17.3
3
334.
75
93.3
5
581.
57
148.
65
5.56
1905
.01
1736
.17
1800
.39
177.
87
1664
.31
557.
07
62.9
2
1128
.56
247.
95
31.4
3
1823
.88
1865
.96
401.
35
1707
.5
1757
.09
Trol
ox e
quiv
alen
ts (�휇
M)
Trol
ox e
quiv
alen
ts (�휇
M)
Trol
ox e
quiv
alen
ts (�휇
M)
297.
3
1163
.15
93.3
5
334.
75
17.3
3
58.5
4
7.14 12
6.51
66.8
2 211.
19
704.
33
36.8
9
1120
.56
993.
44
80.3
9
0
500
1000
1500
2000
2500
110.
31
Figure 1: The results obtained for antioxidant capacity assays (ORAC, DPPH, and ABTS) expressed as Trolox equivalents per 1 g of sample,per single dose, and per daily dose of investigated dietary supplements.
S16S15S14S13S12S11S10S9S8S7S6S5S4S3S2S1S16S15S14S13S12S11S10S9S8S7S6S5S4S3S2S1S16S15S14S13S12S11S10S9S8S7S6S5S4S3S2S10
350
TPC values for a daily doseTPC values for a single doseTPC values for 1 g of sample
300
250
200
150
Caf
feia
cid
equi
vale
nts (
mg)
100
50
0
250
200
150
100
50
0.46
8
4.94
938
87.1
5131
217.
9251
7
0.70
399
13.1
4436
149.
5709
7
0.77
29
10.3
4899
0.11
013
1.27
022
3.25
45
65.6
5827
4.08
29248
.772
3
11.1
1252
0.23
4120.11
7284
0.30
4618
0.35
0137
0.00
6789
0.03
4673
0.70
6857
0.00
4367
0.09
2319
0.00
0485
0.01
614
0.34
2579
0.36
5988
0.01
75530.
1431
95
0.13
1354
0.00
4645
Caf
feic
aci
d eq
uiva
lent
s (m
g)
Caf
feic
aci
d eq
uiva
lent
s (m
g)
22.2
25
97.5
45
4.08
3
65.6
58
3.25
5
3.81
1
0.11 10
.349
4.63
7
13.1
44
299.
142
1.40
8
217.
925
174.
303
4.94
9
0
0.1
0.2
0.3
0,4
0.5
0.6
0.7
0.8
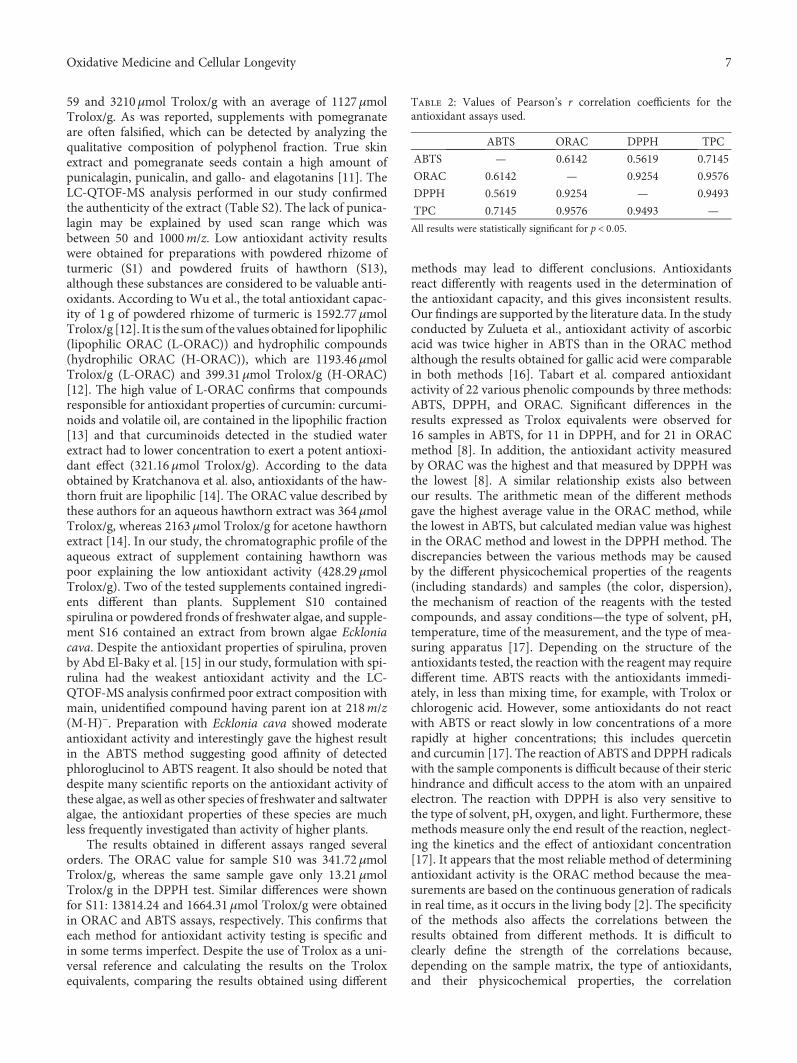
Figure 2: The results obtained for total polyphenol content (TPC) expressed as caffeic acid equivalents per 1 g of sample, per single dose, andper daily dose of investigated dietary supplements.
5Oxidative Medicine and Cellular Longevity
an extract, showed moderate antioxidant activity at the levelof 1510.08μmol Trolox/g in ORAC assay. This result wasplaced in the middle comparing to results obtained by
Madrigal-Carballo et al. in an ORAC method [11].Madrigal-Carballo et al. evaluated supplements with pome-granate, which showed antioxidant activity values between
S1 CurcuminDemethoxycurcumin
Bisdemthoxycurcumin
S2
Dihydroxybenzaldehyde
3-O-Ca�eoylquinic acid 5-O-Ca�eoylquinic acid
3-O-Ca�eoyl-1,5-quinolactoneRutin
S3
S4
Dihydroxybenzaldehyde
Epicatechin CatechinKaempferol hexoside
Quinic acid
S5
Dihydroxybenzaldehyde
Epicatechin
Trimeric proanthocyanidin
Catechin
Methyl gallate
Trimeric proanthocyanidin
Proanthocyanidin A1 isomerProanthocyanidin A1 isomer
Trimeric proanthocyanidin
Trimeric proanthocyanidin Resveratrol
Quercetin
Dihydroxybenzoic acid
S6
S7
Citric acid
Dihydroxybenzoic acid
Quinic acid
Shikimic acid
Rutin
Isoquercitrin
Coumaric acid
S8
Maltose
Maltohexaose
Glucosyl hydroxycinnamate
Coumaric acid
Coumaric acid dihexoside
Coumaric acid hexoside
Feruloylquinic acid trixoside
Citric acid
Rutin hexoside
S9
1 PunicalinHHDP-hexoside
HHDP-hexoside
Digalloyl-hexoside
Ellagitannin
Ellagitannin
Gallotannin
RutinEllagic acid
Gallic acid
S10 Unidenti�ed
S11
S12
S13
Ca�eoylquinic acid
Quinic acid
Gallic acid
Rutin
Isoquercitrin
S14
S15
3-O-Ca�eoylquinic acid
3-O-Ca�eoylquinic acid
5-O-Feruloylquinic acid
Di-O-ca�eoylquinic acid isomer
Ca�eoyl-1,5-quinolactone derivative isomer
Di-O-ca�eoylquinic acid isomer
Ca�eoyl-1,5-quinolactone derivative isomer
Ca�eoyl-1,5-quinolactone derivative isomer
3-O-Feruloyl, 3-O-Ca�eoylquinic acid
Di-O-ca�eoylquinic acid isomer
Ca�eoyl-1,5-quinolactone
4-O-Ca�eoylquinic acid
Ca�eic acid
Ca�eine
Shikimic acid
Quinic acid
S16
1
-ESI BPC scan frag = 140.0V [email protected] S1_neg.d
-ESI BPC scan frag = 120.0V [email protected] S2_neg_100Vpolar.d
-ESI BPC scan frag=140.0V [email protected] S3_neg.d
-ESI BPC scan frag = 140.0V [email protected] S4_neg.d
-ESI BPC scan frag = 140.0V [email protected] S5_neg.d
-ESI BPC scan frag = 140.0V [email protected] S6_neg.d
-ESI BPC scan frag = 140.0V [email protected] S7_neg.d
-ESI BPC scan frag = 140.0V [email protected] S8_neg.d
×105
5.55.25
54.75
4.54.25
43.75
3.53.25
32.75
2.52.25
21.75
1.51.25
10.75
0.50.25
0
×105
65.75
5.55.25
54.75
4.54.25
43.75
3.53.25
32.75
2.52.25
21.75
1.51.25
10.75
0.50.25
0
×106
2.8
2.6
2.4
2.2
2
1.8
1.6
1.4
1.2
0.8
0.6
0.4
0.2
0
1
×104
×105
×105
×105
×105
2.62.52.42.32.22.1
21.91.81.71.61.51.41.31.21.1
0.90.80.70.60.50.40.30.20.1
0
1
5.25
4.84.64.44.2
3.83.63.43.2
2.82.62.42.2
1.81.61.41.2
0.80.60.40.2
0
1
2
3
4
9.59
88.5
7.57
6.56
5.55
4.5
3.5
2.5
1.5
0.5
4
3
2
1
0
7
6.5
6
5.5
5
4.5
3.5
2.5
1.5
0.5
3
2
1
0
4
2.83
3.23.43.63.8
44.2
2.62.42.2
21.81.61.41.2
0.80.60.40.2
0
1
1
1
1
1
1Hexose
Gallic acid
Epicatechin
Piceid
CatechinResveratrol
Physcion
Emodin
Emodic acid
1
1
1
1
1
1
1
2 3 4 5 6 7 8 9 10 11 12 13 14 15 16 17 18 19 20 21 22 23 24 25 26 27 28 29 30 31
Counts versus acquisition time (min)
32 33 34 35 36 37 38 39 40 41 42 43 44 45 46 47 48 49 50 51 52 53 54 55 56 57 58 59 1 2 3 4 5 6 7 8 9 10 11 12 13 14 15 16 17 18 19 20 21 22 23 24 25 26 27 28 29 30 31 32 33 34 35 36 37 38 39 40 41 42 43 44 45 46 47 48 49 50 51 52 53 54 55 56 57 58 59
1 2 3 4 5 6 7 8 9 10 11 12 13 14 15 16
Epigallocatechin gallate
Apigenin glucuronide isomerApigenin glucuronide isomer
Methoxyapigenin glucuronide isomer
Gallocatechin
Epigallocatechin
Epicatechin Epigallocatechin gallate
Gallocatechin gallate
Epicatechin gallate
Catechin gallateGallic acid
4-O-Ca�eoylquinic acid3-O-Ca�eoylquinic acid
3-O-Ca�eoylquinic acid
5-O-Feruloylquinic acid
Di-O-ca�eoylquinic acid isomer
Di-O-ca�eoylquinic acid isomer
Di-O-ca�eoylquinic acid isomer
O-dimethoxycinnamoyl, O-ca�eoylquinic acid
Ferulic acid
Phloroglucinol
Catechin
Epicatechin Epicatechin derivative
Epicatechin derivative
Epicatechin derivative
Methoxyapigenin glucuronide isomer
Apigenin
Apigenin glucuronide isomer
Epicatechin monogallate
Gallic acid
17 18 19 20 21 22 23 24 25 26 27 28 29 30 31 32 33 34 35 36 37 38 39 40 41 42 43 44 45 46 47 48 49 50 51 52 53 54 55 56 57 58 59 1
1
2 3 4 5 6 7 8 9 10 11 12 13 14 15 16 17 18 19 20 21 22 23 24 25 26 27 28 29 30 31 32 33 34 35 36 37 38 39 40 41 42 43 44 45 46 47 48 49 50 51 52 53 54 55 56 57 58 59
1 2 3 4 5 6 7 8 9 10 11 12 13 14 15 16 17 18 19 20 21 22 23 24 25 26 27 28 29 30 31 32 33 34 35 36 37 38 39 40 41 42 43 44 45 46 47 48 49 50 51 52 53 54 55 56 57 58 59
1 2 3 4 5 6 7 8 9 10 11 12 13 14 15 16 17 18 19 20 21 22 23 24 25 26 27 28 29 30 31 32 33 34 35 36 37 38 39 40 41 42 43 44 45 46 47 48 49 50 51 52 53 54 55 56 57 58 59
1 2 3 4 5 6 7 8 9 10 11 12 13 14 15 16 17 18 19 20 21 22 23 24 25 26 27 28 29 30 31 32 33 34 35 36 37 38 39 40 41 42 43 44 45 46 47 48 49 50 51 52 53 54 55 56 57 58 59
1 2 3 4 5 6 7 8 9 10 11 12 13 14 15 16 17 18 19 20 21 22 23 24 25 26 27 28 29 30 31 32 33 34 35 36 37 38 39 40 41 42 43 44 45 46 47 48 49 50 51 52 53 54 55 56 57 58 59
1 2 3 4 5 6 7 8 9 10 11 12 13 14 15 16 17 18 19 20 21 22 23 24 25 26 27 28 29 30 31 32 33 34 35 36 37 38 39 40 41 42 43 44 45 46 47 48 49 50 51 52 53 54 55 56 57 58 59
1 2 3 4 5 6 7 8 9 10 11 12 13 14 15 16 17 18 19 20 21 22 23 24 25 26 27 28 29 30 31 32 33 34 35 36 37 38 39 40 41 42 43 44 45 46 47 48 49 50 51 52 53 54 55 56 57 58 59
1
1 2 3 4 5 6 7 8 9 10 11 12 13 14 15 16 17 18 19 20 21 22 23 24 25 26 27 28 29 30 31 32 33 34 35 36 37 38 39 40 41 42 43 44 45 46 47 48 49 50 51 52 53 54 55 56 57 58 59
1 2 3 4 5 6 7 8 9 10 11 12 13 14 15 16 17 18 19 20 21 22 23 24 25 26 27 28 29 30 31 32 33 34 35 36 37 38 39 40 41 42 43 44 45 46 47 48 49 50 51 52 53 54 55 56 57 58 59
1 2 3 4 5 6 7 8 9 10 11 12 13 14 15 16 17 18 19 20 21 22 23 24 25 26 27 28 29 30 31 32 33 34 35 36 37 38 39 40 41 42 43 44 45 46 47 48 49 50 51 52 53 54 55 56 57 58 59
1 2 3 4 5 6 7 8 9 10 11 12 13 14 15 16 17 18 19 20 21 22 23 24 25 26 27 28 29 30 31 32 33 34 35 36 37 38 39 40 41 42 43 44 45 46 47 48 49 50 51 52 53 54 55 56 57 58 59
1 2 3 4 5 6 7 8 9 10 11 12 13 14 15 16 17 18 19 20 21 22 23 24 25 26 27 28 29 30 31 32 33 34 35 36 37 38 39 40 41 42 43 44 45 46 47 48 49 50 51 52 53 54 55 56 57 58 59
1 2 3 4 5 6 7 8 9 10 11 12 13 14 15 16 17 18 19 20 21 22 23 24 25 26 27 28 29 30 31 32 33 34 35 36 37 38 39 40 41 42 43 44 45 46 47 48 49 50 51 52 53 54 55 56 57 58 59
×105
1.91.81.71.61.51.41.31.21.1
0.90.80.70.60.50.40.30.20.1
0
1
×105
×106
×106
×106
×106
×106
×105
4.54.25
3.753.5
3.25
2.752.5
2.25
1.751.5
1.251
0.750.5
0.250
2
3
4
1.92
2.12.2
1.81.71.61.51.41.31.21.1
0.90.80.70.60.50.40.30.20.1
0
3
2.8
2.6
2.4
2.2
1.8
1.6
1.4
1.2
0.2
1
0.8
0.6
0.4
0
2
1
1.2
1.1
1
0.9
0.8
0.7
0.6
0.5
0.4
0.3
0.2
0.1
0
1.251.2
1.151.1
1.051
0.950.9
0.850.8
0.750.7
0.65
0.550.5
0.450.4
0.350.3
0.250.2
0.15
0.050.1
0
0.6
1.8
1.7
1.6
1.5
1.4
1.3
1.2
1.1
0.9
1
0.8
0.7
0.6
0.5
0.4
0.3
0.2
0.1
0
2.6
2.8
2.4
2.2
2
1.8
1.6
1.4
1.2
0.8
0.6
0.4
0.2
0
1
-ESI BPC scan frag = 140.0V [email protected] S9_neg.d
-ESI BPC scan frag = 140.0V [email protected] S10_neg.d
-ESI BPC scan frag=140.0V [email protected] S11_neg2.d
-ESI BPC scan frag = 140.0V [email protected] S12_neg.d
-ESI BPC scan frag = 140.0V [email protected] S13_neg.d
-ESI BPC scan frag = 140.0V [email protected] S14_neg.d
-ESI BPC scan frag = 140.0V [email protected] S15_neg.d
-ESI BPC scan frag = 140.0V [email protected] S16_neg.d
Gallic acid
Gallocatechin
Epigallocatechin
Epicatechin
Epigallocatechin Gallate
Gallocatechin Gallate
Epicatechin gallate
Quercitrin
Myricetin
Resveratrol
Quercetin
Methoxyquercetin
Kaempferol
Catechin gallate
Catechin
Counts versus acquisition time (min)
Counts versus acquisition time (min)
Counts versus acquisition time (min)
Counts versus acquisition time (min)
Counts versus acquisition time (min)
Counts versus acquisition time (min)
Counts versus acquisition time (min)
Counts versus acquisition time (min)
Counts versus acquisition time (min)
Counts versus acquisition time (min)
Counts versus acquisition time (min)
Counts versus acquisition time (min)
Counts versus acquisition time (min)
Counts versus acquisition time (min)
Counts versus acquisition time (min)
1
1
1
1
1 1
11
1 1
1 1
1 1
11
Figure 3: The chemical profiles of studied dietary supplements.
6 Oxidative Medicine and Cellular Longevity
59 and 3210μmol Trolox/g with an average of 1127μmolTrolox/g. As was reported, supplements with pomegranateare often falsified, which can be detected by analyzing thequalitative composition of polyphenol fraction. True skinextract and pomegranate seeds contain a high amount ofpunicalagin, punicalin, and gallo- and elagotanins [11]. TheLC-QTOF-MS analysis performed in our study confirmedthe authenticity of the extract (Table S2). The lack of punica-lagin may be explained by used scan range which wasbetween 50 and 1000m/z. Low antioxidant activity resultswere obtained for preparations with powdered rhizome ofturmeric (S1) and powdered fruits of hawthorn (S13),although these substances are considered to be valuable anti-oxidants. According to Wu et al., the total antioxidant capac-ity of 1 g of powdered rhizome of turmeric is 1592.77μmolTrolox/g [12]. It is the sumof the values obtained for lipophilic(lipophilic ORAC (L-ORAC)) and hydrophilic compounds(hydrophilic ORAC (H-ORAC)), which are 1193.46μmolTrolox/g (L-ORAC) and 399.31μmol Trolox/g (H-ORAC)[12]. The high value of L-ORAC confirms that compoundsresponsible for antioxidant properties of curcumin: curcumi-noids and volatile oil, are contained in the lipophilic fraction[13] and that curcuminoids detected in the studied waterextract had to lower concentration to exert a potent antioxi-dant effect (321.16μmol Trolox/g). According to the dataobtained by Kratchanova et al. also, antioxidants of the haw-thorn fruit are lipophilic [14]. The ORAC value described bythese authors for an aqueous hawthorn extract was 364μmolTrolox/g, whereas 2163μmol Trolox/g for acetone hawthornextract [14]. In our study, the chromatographic profile of theaqueous extract of supplement containing hawthorn waspoor explaining the low antioxidant activity (428.29μmolTrolox/g). Two of the tested supplements contained ingredi-ents different than plants. Supplement S10 containedspirulina or powdered fronds of freshwater algae, and supple-ment S16 contained an extract from brown algae Eckloniacava. Despite the antioxidant properties of spirulina, provenby Abd El-Baky et al. [15] in our study, formulation with spi-rulina had the weakest antioxidant activity and the LC-QTOF-MS analysis confirmed poor extract composition withmain, unidentified compound having parent ion at 218m/z(M-H)−. Preparation with Ecklonia cava showed moderateantioxidant activity and interestingly gave the highest resultin the ABTS method suggesting good affinity of detectedphloroglucinol to ABTS reagent. It also should be noted thatdespite many scientific reports on the antioxidant activity ofthese algae, as well as other species of freshwater and saltwateralgae, the antioxidant properties of these species are muchless frequently investigated than activity of higher plants.
The results obtained in different assays ranged severalorders. The ORAC value for sample S10 was 341.72μmolTrolox/g, whereas the same sample gave only 13.21μmolTrolox/g in the DPPH test. Similar differences were shownfor S11: 13814.24 and 1664.31μmol Trolox/g were obtainedin ORAC and ABTS assays, respectively. This confirms thateach method for antioxidant activity testing is specific andin some terms imperfect. Despite the use of Trolox as a uni-versal reference and calculating the results on the Troloxequivalents, comparing the results obtained using different
methods may lead to different conclusions. Antioxidantsreact differently with reagents used in the determination ofthe antioxidant capacity, and this gives inconsistent results.Our findings are supported by the literature data. In the studyconducted by Zulueta et al., antioxidant activity of ascorbicacid was twice higher in ABTS than in the ORAC methodalthough the results obtained for gallic acid were comparablein both methods [16]. Tabart et al. compared antioxidantactivity of 22 various phenolic compounds by three methods:ABTS, DPPH, and ORAC. Significant differences in theresults expressed as Trolox equivalents were observed for16 samples in ABTS, for 11 in DPPH, and for 21 in ORACmethod [8]. In addition, the antioxidant activity measuredby ORAC was the highest and that measured by DPPH wasthe lowest [8]. A similar relationship exists also betweenour results. The arithmetic mean of the different methodsgave the highest average value in the ORAC method, whilethe lowest in ABTS, but calculated median value was highestin the ORAC method and lowest in the DPPH method. Thediscrepancies between the various methods may be causedby the different physicochemical properties of the reagents(including standards) and samples (the color, dispersion),the mechanism of reaction of the reagents with the testedcompounds, and assay conditions—the type of solvent, pH,temperature, time of the measurement, and the type of mea-suring apparatus [17]. Depending on the structure of theantioxidants tested, the reaction with the reagent may requiredifferent time. ABTS reacts with the antioxidants immedi-ately, in less than mixing time, for example, with Trolox orchlorogenic acid. However, some antioxidants do not reactwith ABTS or react slowly in low concentrations of a morerapidly at higher concentrations; this includes quercetinand curcumin [17]. The reaction of ABTS and DPPH radicalswith the sample components is difficult because of their sterichindrance and difficult access to the atom with an unpairedelectron. The reaction with DPPH is also very sensitive tothe type of solvent, pH, oxygen, and light. Furthermore, thesemethods measure only the end result of the reaction, neglect-ing the kinetics and the effect of antioxidant concentration[17]. It appears that the most reliable method of determiningantioxidant activity is the ORAC method because the mea-surements are based on the continuous generation of radicalsin real time, as it occurs in the living body [2]. The specificityof the methods also affects the correlations between theresults obtained from different methods. It is difficult toclearly define the strength of the correlations because,depending on the sample matrix, the type of antioxidants,and their physicochemical properties, the correlation
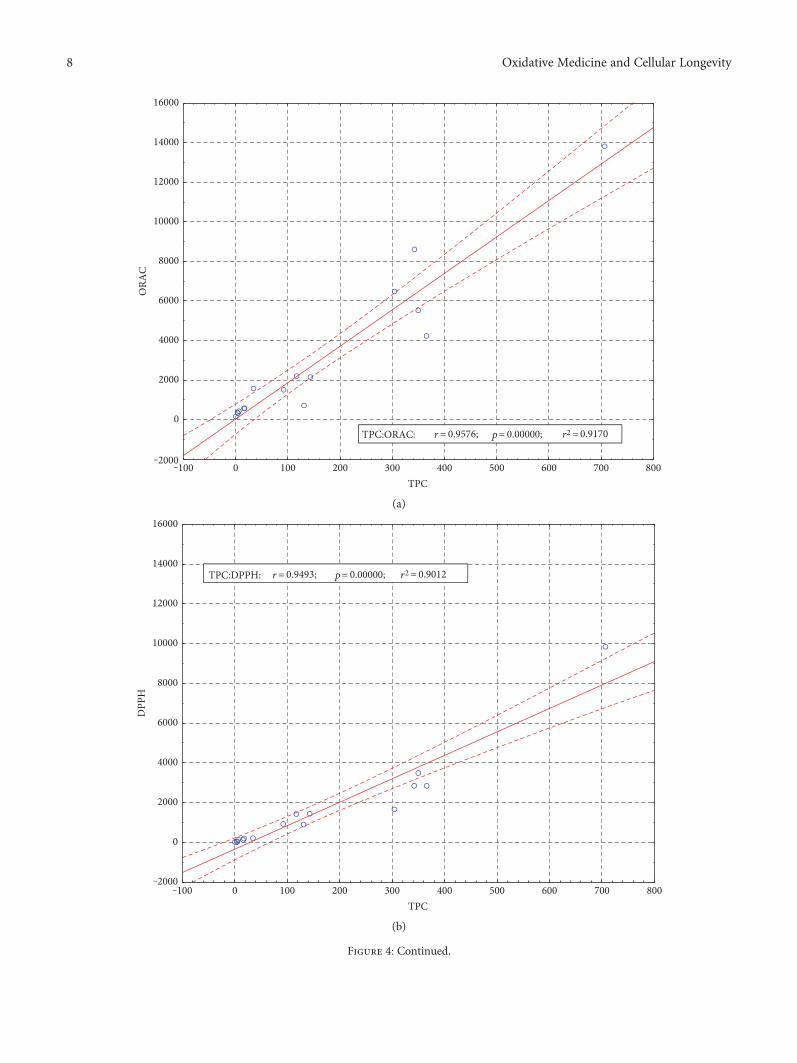
Table 2: Values of Pearson’s r correlation coefficients for theantioxidant assays used.
ABTS ORAC DPPH TPC
ABTS — 0.6142 0.5619 0.7145
ORAC 0.6142 — 0.9254 0.9576
DPPH 0.5619 0.9254 — 0.9493
TPC 0.7145 0.9576 0.9493 —
All results were statistically significant for p < 0 05.
7Oxidative Medicine and Cellular Longevity
‒100 0 100 200 300 400 500 600 700 800TPC
‒2000
0
2000
4000
6000
8000
10000
12000
14000
16000
ORA
C
TPC:ORAC: =r2 0.9170= 0.00000;p0.9576;r=
(a)
‒100 0 100 200 300 400 500 600 700 800TPC
‒2000
0
2000
4000
6000
8000
10000
12000
14000
16000
DPP
H
TPC:DPPH: =r2 0.9012= 0.00000;p0.9493;r=
(b)
Figure 4: Continued.
8 Oxidative Medicine and Cellular Longevity
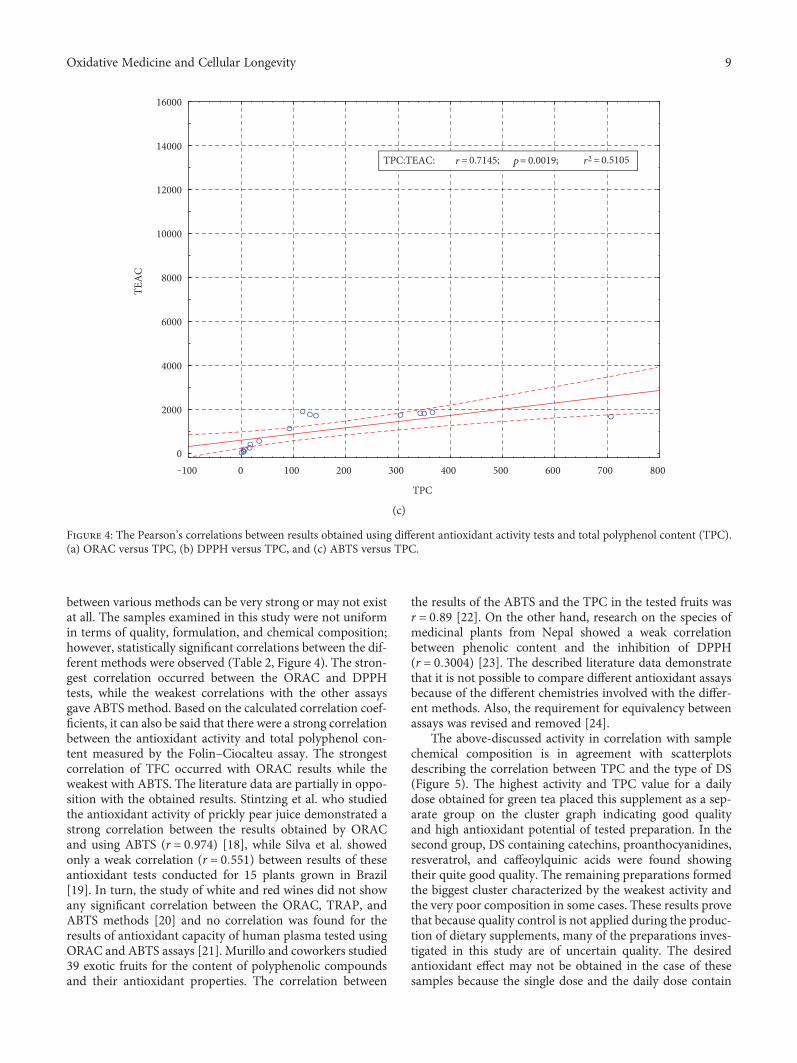
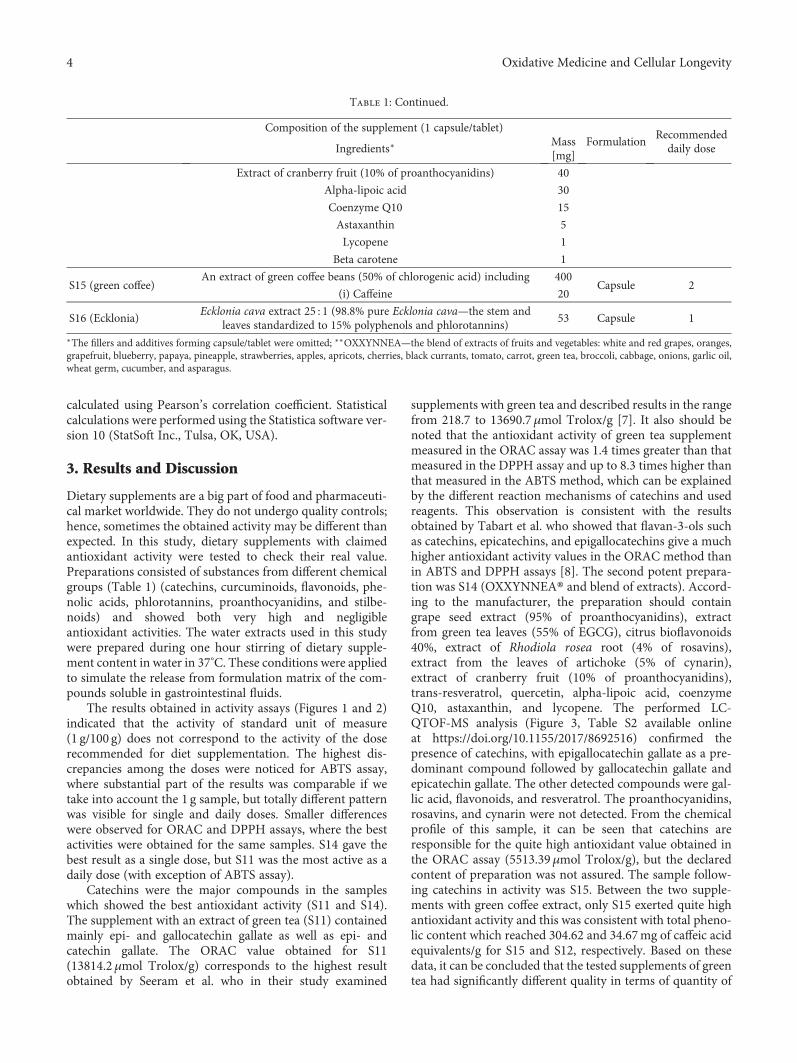
between various methods can be very strong or may not existat all. The samples examined in this study were not uniformin terms of quality, formulation, and chemical composition;however, statistically significant correlations between the dif-ferent methods were observed (Table 2, Figure 4). The stron-gest correlation occurred between the ORAC and DPPHtests, while the weakest correlations with the other assaysgave ABTS method. Based on the calculated correlation coef-ficients, it can also be said that there were a strong correlationbetween the antioxidant activity and total polyphenol con-tent measured by the Folin–Ciocalteu assay. The strongestcorrelation of TFC occurred with ORAC results while theweakest with ABTS. The literature data are partially in oppo-sition with the obtained results. Stintzing et al. who studiedthe antioxidant activity of prickly pear juice demonstrated astrong correlation between the results obtained by ORACand using ABTS (r = 0 974) [18], while Silva et al. showedonly a weak correlation (r = 0 551) between results of theseantioxidant tests conducted for 15 plants grown in Brazil[19]. In turn, the study of white and red wines did not showany significant correlation between the ORAC, TRAP, andABTS methods [20] and no correlation was found for theresults of antioxidant capacity of human plasma tested usingORAC and ABTS assays [21]. Murillo and coworkers studied39 exotic fruits for the content of polyphenolic compoundsand their antioxidant properties. The correlation between
the results of the ABTS and the TPC in the tested fruits wasr = 0 89 [22]. On the other hand, research on the species ofmedicinal plants from Nepal showed a weak correlationbetween phenolic content and the inhibition of DPPH(r = 0 3004) [23]. The described literature data demonstratethat it is not possible to compare different antioxidant assaysbecause of the different chemistries involved with the differ-ent methods. Also, the requirement for equivalency betweenassays was revised and removed [24].
The above-discussed activity in correlation with samplechemical composition is in agreement with scatterplotsdescribing the correlation between TPC and the type of DS(Figure 5). The highest activity and TPC value for a dailydose obtained for green tea placed this supplement as a sep-arate group on the cluster graph indicating good qualityand high antioxidant potential of tested preparation. In thesecond group, DS containing catechins, proanthocyanidines,resveratrol, and caffeoylquinic acids were found showingtheir quite good quality. The remaining preparations formedthe biggest cluster characterized by the weakest activity andthe very poor composition in some cases. These results provethat because quality control is not applied during the produc-tion of dietary supplements, many of the preparations inves-tigated in this study are of uncertain quality. The desiredantioxidant effect may not be obtained in the case of thesesamples because the single dose and the daily dose contain
‒100 0 100 200 300 400 500 600 700 800
TPC
0
2000
4000
6000
8000
10000
12000
14000
16000
TEAC
TPC:TEAC: =r2 0.5105= 0.0019;p0.7145;r=
(c)
Figure 4: The Pearson’s correlations between results obtained using different antioxidant activity tests and total polyphenol content (TPC).(a) ORAC versus TPC, (b) DPPH versus TPC, and (c) ABTS versus TPC.
9Oxidative Medicine and Cellular Longevity
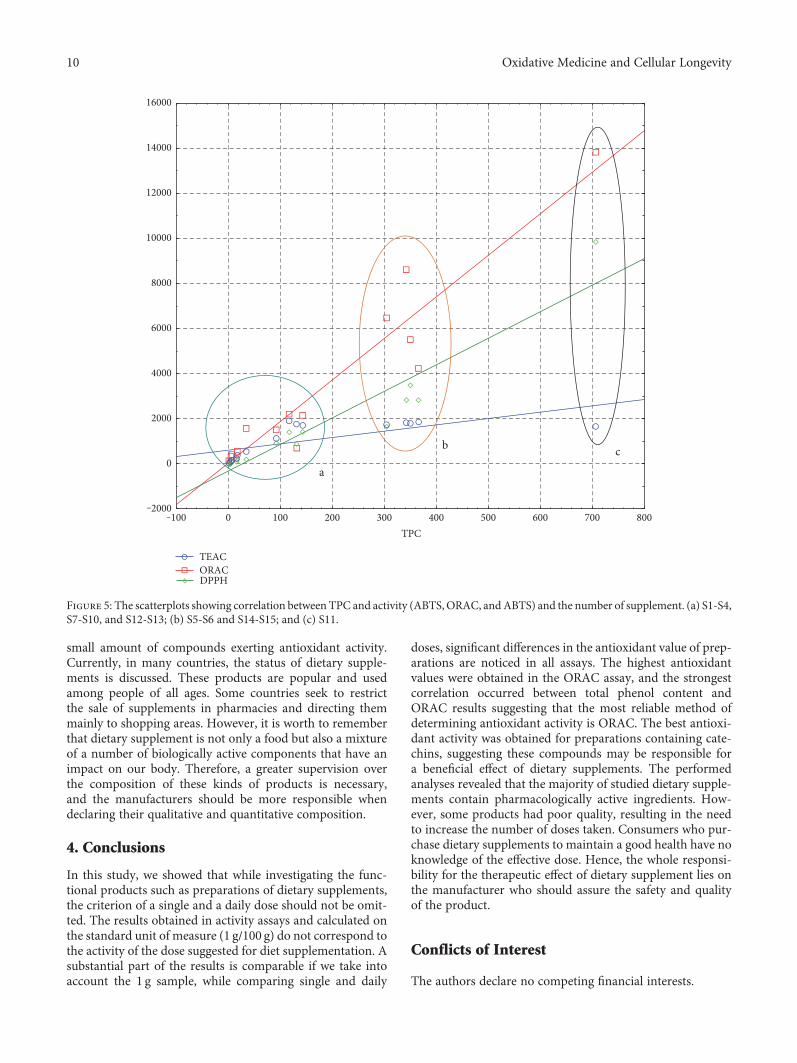
small amount of compounds exerting antioxidant activity.Currently, in many countries, the status of dietary supple-ments is discussed. These products are popular and usedamong people of all ages. Some countries seek to restrictthe sale of supplements in pharmacies and directing themmainly to shopping areas. However, it is worth to rememberthat dietary supplement is not only a food but also a mixtureof a number of biologically active components that have animpact on our body. Therefore, a greater supervision overthe composition of these kinds of products is necessary,and the manufacturers should be more responsible whendeclaring their qualitative and quantitative composition.
4. Conclusions
In this study, we showed that while investigating the func-tional products such as preparations of dietary supplements,the criterion of a single and a daily dose should not be omit-ted. The results obtained in activity assays and calculated onthe standard unit of measure (1 g/100 g) do not correspond tothe activity of the dose suggested for diet supplementation. Asubstantial part of the results is comparable if we take intoaccount the 1 g sample, while comparing single and daily
doses, significant differences in the antioxidant value of prep-arations are noticed in all assays. The highest antioxidantvalues were obtained in the ORAC assay, and the strongestcorrelation occurred between total phenol content andORAC results suggesting that the most reliable method ofdetermining antioxidant activity is ORAC. The best antioxi-dant activity was obtained for preparations containing cate-chins, suggesting these compounds may be responsible fora beneficial effect of dietary supplements. The performedanalyses revealed that the majority of studied dietary supple-ments contain pharmacologically active ingredients. How-ever, some products had poor quality, resulting in the needto increase the number of doses taken. Consumers who pur-chase dietary supplements to maintain a good health have noknowledge of the effective dose. Hence, the whole responsi-bility for the therapeutic effect of dietary supplement lies onthe manufacturer who should assure the safety and qualityof the product.
Conflicts of Interest
The authors declare no competing financial interests.
TEACORAC
‒100 0 100 200 300 400 500 600 700 800TPC
‒2000
0
2000
4000
6000
8000
10000
12000
14000
16000
a
b c
DPPH
Figure 5: The scatterplots showing correlation between TPC and activity (ABTS, ORAC, andABTS) and the number of supplement. (a) S1-S4,S7-S10, and S12-S13; (b) S5-S6 and S14-S15; and (c) S11.
10 Oxidative Medicine and Cellular Longevity
Acknowledgments
This work was developed using the equipment purchasedwithin the Agreement no. POPW.01.03.00-06-010/09-00Operational Program Development of Eastern Poland2007–2013, Priority Axis I, Modern Economy, Operations1.3. Innovations Promotion.
References
[1] K. R. Martin and C. L. Appel, “Polyphenols as dietary sup-plements: a double-edged sword,” Nutrition and DietarySupplements, vol. 2, pp. 1–12, 2010.
[2] F. Shahidi and Y. Zhong, “Measurement of antioxidant activ-ity,” Journal of Functional Foods, vol. 18, pp. 757–781, 2015.
[3] D. Huang, B. Ou, M. Hampsch-Woodill, J. A. Flanagan, andR. L. Prior, “High-throughput assay of oxygen radical absor-bance capacity (ORAC) using a multichannel liquid handlingsystem coupled with a microplate fluorescence reader in 96-well format,” Journal of Agricultural and Food Chemistry,vol. 50, no. 16, pp. 4437–4444, 2002.
[4] N. P. Meléndez, V. Nevarez-Moorillon, R. U. Rodriguez-Herrera, J. E. Espinoza, and C. O. Aguilar, “A microassayfor quantification of 2.2-diphenyl-1- picrylhydracyl (DPPH)free radical scavenging,” African Journal of BiochemistryResearch, vol. 8, no. 1, pp. 14–18, 2014.
[5] R. Re, N. Pellegrini, A. Proteggente, A. Pannala, M. Yang, andC. Rice-Evans, “Antioxidant activity applying an improvedABTS radical cation decolorization assay,” Free Radical Biol-ogy and Medicine, vol. 26, no. 9-10, pp. 1231–1237, 1999.
[6] V. L. Singleton and J. A. Rossi, “Colorimetry of total phenolicswith phosphomolybdic– phosphotungstic acid reagents,” TheAmerican Journal of Enology and Viticulture, vol. 16, no. 3,pp. 144–158, 1965.
[7] N. P. Seeram, S. M. Henning, Y. Niu, R. Lee, H. S. Scheuller,and D. Heber, “Catechin and caffeine content of green teadietary supplements and correlation with antioxidant capac-ity,” Journal of Agricultural and Food Chemistry, vol. 54,pp. 1599–1603, 2006.
[8] J. Tabart, C. Kevers, J. Pincemail, J. O. Defraigne, andJ. Dommes, “Comparative antioxidant capacities of phenoliccompounds measured by various tests,” Food Chemistry,vol. 113, pp. 1226–1233, 2009.
[9] M. B. Medina, “Determination of the total phenolics in juicesand superfruits by a novel chemical method,” Journal of Func-tional Foods, vol. 3, pp. 79–87, 2011.
[10] S. M. Henning, Y. Zhang, V. G. Rontoyanni et al., “Variabilityin the antioxidant activity of dietary supplements from pome-granate, milk thistle, green tea, grape seed, goji, and acai:effects of in vitro digestion,” Journal of Agricultural and FoodChemistry, vol. 62, pp. 4313–4321, 2014.
[11] S. Madrigal-Carballo, G. Rodriguez, C. G. Krueger, M. Dreher,and J. D. Reed, “Pomegranate (Punica granatum) supple-ments: authenticity, antioxidant and polyphenol composi-tion,” Journal of Functional Foods, vol. 1, pp. 324–329, 2009.
[12] X. Wu, G. R. Beecher, J. M. Holden, D. B. Haytowitz, S. E.Gebhardt, and R. L. Prior, “Lipophilic and hydrophilic anti-oxidant capacities of common foods in the united state,”Journal of Agricultural and Food Chemistry, vol. 52,pp. 4026–4037, 2004.
[13] M. E. M. Braga, P. F. Leal, J. E. Carvalho, and M. A. Meireles,“Comparison of yield, composition, and antioxidant activity ofturmeric (Curcuma longa L.) extracts obtained using varioustechniques,” Journal of Agricultural and Food Chemistry,vol. 51, pp. 6604–6611, 2003.
[14] M. Kratchanova, P. Denev, M. Ciz, A. Lojek, and A. Mihailov,“Evaluation of antioxidant activity of medicinal plants con-taining polyphenol compounds. Comparison of two extractionsystems,” Acta Biochimica Polonica, vol. 2, pp. 229–234, 2010.
[15] H. H. Abd El-Baky, F. K. El Baz, and G. S. El-Baroty, “Charac-terization of nutraceutical compounds in blue green algaspirulina maxima,” Journal of Medicinal Plants Research,vol. 10, pp. 292–300, 2008.
[16] A. Zulueta, M. J. Esteve, and A. Frígola, “ORAC and TEACassays comparison to measure the antioxidant capacity of foodproducts,” Food Chemistry, vol. 114, pp. 310–316, 2009.
[17] K. M. Schaich, X. Tian, and J. Xie, “Reprint of “hurdles andpitfalls in measuring antioxidant efficacy: a critical evaluationof ABTS. DPPH. And ORAC assays”,” Journal of FunctionalFoods, vol. 18, pp. 782–796, 2015.
[18] F. Stintzing, K. M. Herbach, M. R. Mosshammer et al., “Color,betalain pattern, and antioxidant properties of cactus pear(Opuntia spp.) clones,” Journal of Agricultural and FoodChemistry, vol. 53, pp. 442–451, 2005.
[19] E. M. Silva, J. N. Souza, H. Rogez, J. F. Rees, and Y. Larondelle,“Antioxidant activities and polyphenolic contents of fifteenselected plant species from the Amazonian region,” FoodChemistry, vol. 101, pp. 1012–1018, 2007.
[20] D. Pérez, F. Leighton, A. Aspee, C. Aliaga, and E. Lissi, “Acomparison of methods employed to evaluate antioxidantcapabilities,” Biological Research, vol. 33, pp. 71–77, 2000.
[21] C. C. Wang, C. Y. Chu, K. O. Chu et al., “Trolox-equivalentantioxidant capacity assay versus oxygen radical absorbancecapacity assay in plasma,” Clinical Chemistry, vol. 50,pp. 952–954, 2004.
[22] E. Murillo, G. B. Britton, and A. A. Durant, “Antioxidant activ-ity and polyphenol content in cultivated and wild edible fruitsgrown in Panama,” Journal of Pharmacy and BioalliedSciences, vol. 4, pp. 313–317, 2012.
[23] B. K. Ghimire, E. S. Seong, E. H. Kim et al., “A comparativeevaluation of the antioxidant activity of some medicinal plantspopularly used in Nepal,” Journal of Medicinal PlantsResearch, vol. 10, pp. 1884–1891, 2011.
[24] R. L. Prior, “Oxygen radical absorbance capacity (ORAC):new horizons in relating dietary antioxidants/bioactivesand health benefits,” Journal of Functional Foods, vol. 18,pp. 797–810, 2015.
11Oxidative Medicine and Cellular Longevity

Submit your manuscripts athttps://www.hindawi.com
Stem CellsInternational
Hindawi Publishing Corporationhttp://www.hindawi.com Volume 2014
Hindawi Publishing Corporationhttp://www.hindawi.com Volume 2014
MEDIATORSINFLAMMATION
of
Hindawi Publishing Corporationhttp://www.hindawi.com Volume 2014
Behavioural Neurology
EndocrinologyInternational Journal of
Hindawi Publishing Corporationhttp://www.hindawi.com Volume 2014
Hindawi Publishing Corporationhttp://www.hindawi.com Volume 2014
Disease Markers
Hindawi Publishing Corporationhttp://www.hindawi.com Volume 2014
BioMed Research International
OncologyJournal of
Hindawi Publishing Corporationhttp://www.hindawi.com Volume 2014
Hindawi Publishing Corporationhttp://www.hindawi.com Volume 2014
Oxidative Medicine and Cellular Longevity
Hindawi Publishing Corporationhttp://www.hindawi.com Volume 2014
PPAR Research
The Scientific World JournalHindawi Publishing Corporation http://www.hindawi.com Volume 2014
Immunology ResearchHindawi Publishing Corporationhttp://www.hindawi.com Volume 2014
Journal of
ObesityJournal of
Hindawi Publishing Corporationhttp://www.hindawi.com Volume 2014
Hindawi Publishing Corporationhttp://www.hindawi.com Volume 2014
Computational and Mathematical Methods in Medicine
OphthalmologyJournal of
Hindawi Publishing Corporationhttp://www.hindawi.com Volume 2014
Diabetes ResearchJournal of
Hindawi Publishing Corporationhttp://www.hindawi.com Volume 2014
Hindawi Publishing Corporationhttp://www.hindawi.com Volume 2014
Research and TreatmentAIDS
Hindawi Publishing Corporationhttp://www.hindawi.com Volume 2014
Gastroenterology Research and Practice
Hindawi Publishing Corporationhttp://www.hindawi.com Volume 2014
Parkinson’s Disease
Evidence-Based Complementary and Alternative Medicine
Volume 2014Hindawi Publishing Corporationhttp://www.hindawi.com