layered double hydroxide nano-carrier for controlled
TRANSCRIPT

1 | P a g e
Layered Double Hydroxide Nano-carrier for Controlled Delivery of Drug Molecules
A Thesis Submitted in Partial Fulfilment of the Requirements for the Degree of
Bachelor of Technology
by
Ramu Ranjan Meher(Roll No. 108CR038)
Department of Ceramic EngineeringNational Institute of Technology,
Rourkela, Odisha.2012

2 | P a g e
Layered Double Hydroxide Nano-carrier for Controlled Delivery of Drug Molecules
A Thesis Submitted in Partial Fulfilment of the Requirements for the Degree of
Bachelor of Technology
by
Ramu Ranjan Meher(Roll No. 108CR038)
Supervisor:Dr. Sudip Dasgupta
Department of Ceramic EngineeringNational Institute of Technology,
Rourkela, Odisha2012

3 | P a g e
National Institute of Technology Rourkela
CERTIFICATE
This is to certify that the thesis entitled, “Layered Double Hydroxide Nano-carrier for
Controlled Delivery of Drug Molecules” submitted by Mr. Ramu Ranjan Meher
(108CR038) in partial fulfilments for the requirements for the award of Bachelor of
Technology degree in Ceramic Engineering at National Institute of Technology, Rourkela
is an authentic work carried out by him under my supervision and guidance.
To the best of my knowledge, the matter embodied in the thesis has not been
submitted to any other University/Institute for the award of any Degree or Diploma.
Date: Dr. Sudip Dasgupta
Assistant Professor
Department of Ceramic Engineering
National Institute of Technology
Rourkela–769008

4 | P a g e
ACKNOWLEDGEMENTS
With deep regards and profound respect, I avail this opportunity to express my deep
sense of gratitude to Dr. Sudip Dasgupta, Assistant Professor, Department of Ceramic
Engineering, N.I.T. Rourkela, for introducing the present research topic and for his inspiring
guidance, valuable suggestion and constructive criticism throughout this research work. It
would have not been possible for me to bring out this project report without his support and
constant guidance.
I would also like to express my gratitude, to all the faculties of Department of
Ceramic Engineering, whose vast knowledge in the field of science and technology has
enlightened me in different areas of this experimental research work.
I am indebted to Dr. B .G. Mishra (H.O.D, Department of Chemistry, N.I.T Rourkela)
for allowing me to carry out various tediouswork in his laboratory. I am also indebted to Mr
Sanjay Kumar Swain for helping me in all respect of laboratory work and sharing with me his
valuable experiences.
Last but not the least; I am thankful to my parents and friends for their constant
support and encouragement.
Date: Ramu Ranjan Meher
108CR038

5 | P a g e
ABSTRACT
Ibuprofen intercalated Mg-Al Layered Double Hydroxide nanohybrids have been prepared
for controlled delivery of anti-inflammatory drug molecule ibuprofen (IBU). NSAID such as
ibuprofen in anionic form has been intercalated in situ into the interlayer space of LDH nano-
particle during coprecipitation of hydroxides. LDH-drug nanohybrids have been
characterized using DLS, XRD, FTIR, and EDX. The XRD patterns shows a decrease in
diffraction angle and anincrease in the interlayer spacing of basal planes of LDH-IBU which
is due to the presence of ibuprofen in the interlayer. FTIR analysis indicates that ibuprofen
molecules are intercalated into the hydroxide interlayer space and are stabilized by
electrostatic forces, intermolecular bonds and Vanderwall’s interaction. Stretching vibration
of hydroxyl group of ibuprofen at 2980 cm-1 in LDH-IBU confirms the presence of ibuprofen
in the interlamellar space of LDH-IBU. Drug release behaviour of LDH-drug nanohybrids
have been evaluated in vitro using UV-Visible spectroscopy in simulated body fluid (SBF) of
physiological pH. The drug release behaviour of LDH-IBU nanohybrid shows an initial burst
release followed by a slower, steady and sustained release for later time period and
importantly more than 95 % of drug was released in 72 hours in SBF.

6 | P a g e
LIST OF ABBREVIATIONS
Serial Number Abbreviation Full form
1 LDH Layered Double Hydroxide.
2 LDH 9 Layered Double Hydroxide synthesised at pH 9.
3 LDH 10 Layered Double Hydroxide synthesised at pH 10.
4 LDH 11 Layered Double Hydroxide synthesised at pH 11.
5 LDH-IBU Ibuprofen intercalated LDH synthesised at pH 10.
6 PSD Particle Size Distribution.
7 XRD X- Ray Diffraction.
8 FTIR Fourier Transform Infrared Spectroscopy.
9 EDX Energy Dispersive X-ray Spectroscopy
10 SBF Simulated Body Fluid
LIST OF TABLES
Table
Number
Table description Page
Number
1 Average particle size and Poly Dispersive Index of LDH. 27
2 Weight % and Atomic % of elements detected by EDX for LDH 9. 29
3 Weight % and Atomic % of elements detected by EDX for LDH 10. 30
4 Weight % and Atomic % of elements detected by EDX for LDH 11. 31
5 Value of 2θ, ‘d’ spacing and peak intensity for LDH and LDH-IBU. 36
6 Variation of Absorbance, Concentration of ibuprofen and Cumulative
release of ibuprofen in SBF with respect to time.
45

7 | P a g e
LIST OF FIGURES
Figure Number Figure description Page
1 PSD: Intensity vs. size plot for LDH synthesised at pH 9. 24
2 PSD: Volume percent vs. size for LDH synthesised at pH 9. 24
3 PSD: Intensity vs. size plot for LDH synthesised at pH 10. 25
4 PSD: Volume percent vs. size for LDH synthesised at pH 10. 25
5 PSD: Intensity vs. size plot for LDH synthesised at pH 11. 26
6 PSD: Volume percent vs. size for LDH synthesised at pH 11. 27
7 EDX plot of LDH 9 showing various elements concentration. 29
8 EDX plot of LDH 10 showing various elements concentration. 30
9 EDX plot of LDH 11 showing various elements concentration. 31
10 Comparative XRD patterns of LDH 9, LDH10 and LDH 11. 33
11 XRD patterns of LDH-IBU synthesised at pH 10. 35
12 Comparative XRD patterns of LDH 10 and LDH-IBU. 36
13 Representation of interlayer expansion due to drug intercalation. 37
14 FTIR plot (Transmittance vs. wave number plot) of LDH 10. 39
15 FTIR plot (Transmittance vs. wave number plot) of ibuprofen. 40
16 FTIR plot (Transmittance vs. wave number plot) of LDH-IBU. 41
17 Comparative FTIR plot of LDH, ibuprofen and LDH-IBU. 42
18 Variation of Absorbance with concentration for drug ibuprofen 44
19 Cumulative percent release of ibuprofen in SBF vs. time. 46
8 | P a g e
CONTENTS
CERTIFICATE………………………………………………………………………….03
ACKNOWLEDGEMENT………………………………………………………………04
ABSTRACT……………………………………………………………………………..05
LIST OF ABBREVIATIONS …………………………………………………………..06
LIST OF TABLES…......................................................................................................06
LIST OF FIGURES……………………………………………………………………...07
CHAPTER 1: INTRODUCTION…...............................................................................09
CHAPTER 2: LITERATURE REVIEW………………………………………………..12
CHAPTER 3: EXPERIMENTAL PROCEDURES……………………………………..16
3.1. PREPARATION OF LDH……………………………………………….....17
3.2. PREPARATION OF LDH-IBU…………………………………………….19
3.3. CHARECTERISATIONS…………………………………………………..21
CHAPTER 4: RESULTS AND DISCUSSION………………………………………....23
4.1. PSD ANALYSIS…………………………………………………………....24
4.2. EDX ANALYSIS…………………………………………………………...29
4.3. XRD ANALYSIS…………………………………………………………...33
4.4. FTIR ANALYSIS…………………………………………………………...39
4.5. DRUG RELEASE STUDY ………………………………………………...44
CHAPTER 5: CONCLUSION………………………………………………………..…47
REFERENCES…………………………………………………………………………..49

9 | P a g e
CHAPTER 1
INTRODUCTION
10 | P a g e
INTRODUCTION
Layered Double Hydroxides (LDHs) are generally minerals and synthetically
prepared materials that have surface layers formed of positively charged brucite type layer
made up of mixed metal hydroxides of divalent and trivalent metals with exchangeable
intercalated negatively charged species in between the two surface layers which compensate
for the positive charge of the brucite layer.
Chemical composition of LDH is generally expressed as follows:
M(II)1-x M(III)x (OH)2 (An-)x/n × y H2O
Where M(II) is divalent metal cation, M(III) is trivalent metal cation, ‘A’ is interlayer anionic
species, ‘n’ is charge on interlayer anion, ‘x’ and ‘y’ are fraction constants.
LDH have many physical and chemical properties that are surprisingly similar to
those of clay mineral. These properties are their layered structure, wide chemical
compositions (due to variable isomorphous substitution of metallic cations), variable layer
charge density, ion-exchange properties, reactive interlayer space and rheological and
colloidal properties. But because of their anion-exchange properties, LDH are known as
‘anionic clays’.
Anticancer drug molecules such as Methotrexate, 5-Flurouracil and anti-inflammatory
drug molecule such as ibuprofen are negatively charged; hence they can be intercalated into
the LDH molecule for the delivery into targeted location in human body. As many of the
biomolecules are negatively charged, they can also be intercalated into LDH for gene of
DNA delivery.
The brucite type layer is of structure with hydroxyl (OH-) groups in hexagonal close
packingand each divalent metal cation is octahedrally coordinated to six OH- groups and

11 | P a g e
these octahedra share edges to form the layers. Because all octahedrally coordinated sites
between oxygen layers are occupied by cations, this structure is described as trioctahedral;
each OH- group is surrounded by three occupied octahedral positions.
LDH-drug nanohybrids have a positive zeta potential, therefore the nanohybrid
particles can approach and adhere to the negatively charged cell membrane via electrostatic
interaction. These nanohybrids are internalized into the cell by phagocytosis (LDH
agglomerates, particles larger than 500nm) and endocytosis (individual crystallite of smaller
size, < 300nm). Endocytosis leads to quicker uptake of LDH nanoparticles. The cellular
uptake can be enhanced by decreasing the particle size, adjusting the zeta potential and
conjugating the ligands to enhance the receptor mediated endocytosis process.
Using LDH as drug delivery agent is advantageous because of its easy preparation,
particle size control, versatile composition, very good biocompatibility, pharmaceutical
antacid behaviour, very low cytotoxicity, surface charge density can be controlled, provide
protection to drug molecule, easy attachment of targeting moiety.
Similar to intercalation process, de-intercalation can also occur by ion exchange
method with the surrounding ions such as Cl- and/or phosphates. More possible release
pathway is the acidic dissolution of hydroxide layer due to the low pH in the intracellular
environment. This is the only pathway for release of big anionic species.

12 | P a g e
CHAPTER 2
LITERATURE REVIEW

13 | P a g e
LITERATURE REVIEW
LDH shows tremendous promise in its use as a controlled drug delivery system
because of its ability to intercalate drug molecule in its interlayer space and its non-toxicity in
living tissues. Many researchers have investigated its potential as a carrier of functional
biomolecule in recent past.
Jin-Ho Choy et al [1] synthesised nanohybrids of LDH, methotrexate (MTX) and
LDH, folinic acid by ion exchange reaction. They showed that the intercalated molecules are
stabilized in the tilted longitudinal monolayer mode by electrostatic forces.The further carried
out cellular uptake test of MTX–LDH nanohybridsin SaOS-2 cell line (Osteosarcoma) in
vitro by MTT assay and inferred that the proliferation of SaOS-2 cell is suppressedmore
stronglyby MTX–LDH hybrid than with MTX alone. Hence they concluded thatLDH
increases the drug release rate along with acting as abiocompatible delivery medium.
Zhongliang Wang et al [2] synthesised LDH containing 5-Flurouracil (5-FU) by
reconstruction method. They stated that the stabilisation of 5-FU in the LDH interlayer is due
to electrostatic forces and intermolecular forces. They further studies the release of the drug
and found that and rapid release in followed by sustained release of the drug molecule over
time.
Manjusha Chakraborty et al [3] synthesised nanovector for delivery of anticancerous
drug containing methotrexate (MTX) in ZnAl-layered double hydroxide(LDH) by
anionexchange method. They produced nanoparticles of range 100–300nm by ion-exchange
method. They revealed using small angle XRD that the interplannar spacing has been
increased from 8.9 Aº to 21.3 Aº after MTX intercalation. Using thermogravimetric analysis
they showed that the thermal stability of the MTX increase when it is intercalated in the
LDH. They studied the release profile of the drug inphosphatebuffersaline(PBS) and inferred

14 | P a g e
that the drug sustained for 48 hours and release occurred by a diffusion model given by
Rigter-Peppas.
Jae-Min Oh et al [4] intercalated methotrexate (MTX) into MgAl layered double
hydroxide by co-precipitation method.To check the toxicity of LDHs they used the normal
one (human fibroblast) and the osteosarcoma cell culture lines (Saos-2 and MG-63) in
laboratory and inferred that no harm effect is seen on the cells used for a concentration of
LDH up to 500 ug/mL. They also partially confirmed that LDH is non-toxic to human cells
and it also enhances cellular permeation. Anticancerousactivity of MTX-LDH
nanoparticleswere determined using MTT and BrdU bioassay with the bone cancer cell
culturelines (Saos-2 and MG-63) and proved that the anticancerous efficacy of MTX-LDH is
much higher than that of pristine LDH.
Weishen Yang et al [5] studied the thermal behaviour of Mg–Al–CO3 layered double
hydroxide. They suggested that the double layer structure remain intact on heating to 70-
190ºC, only the loosely bound interlayer water molecules are released at this temperature.
The disappearance of OH− group in a Al–(OH)–Mg structure begins at 190ºC, and is the
conformation is completely lost at 280ºC.The transformation of the LDH structure begins in
same temperatures range. They inferred thatdisappearance of OH− group in a Mg–(OH)–Mg
structure begins at 280ºC, and is the conformation is completely lost at the temperature
405ºC.Degradation of LDH structure starts after reaching this temperature value. Carbonate
evolution started from lower temperature but high rate of carbonate loss is seen after reaching
the temperature of 410ºC and all the carbonates are lost after reaching the temperature 580ºC
after which the material become amorphous metal stable mixed oxides.
L. Mohanambe et al [6] synthesized nanovectors of nonsteroidal anti-inflammatory
drug molecules (NSAID) Ibuprofen, Diclofenac, and Indomethacin in Mg-Al layered double

15 | P a g e
hydroxide and used molecular dynamics (MD) simulationsto determine the interlayer
structure, orientation and geometry of the intercalated species. They confirmed bilayer
arrangement of drug molecule in the interlamellar space. The geometry of the Diclofenac and
Indomethacin changed on intercalation while there is no change in geometry of ibuprofen.
They said the change is geometry is due to electrostatic forces between the electronegative
chlorine in drug and the positively charged metal hydroxide layer of the anionic clay. The
change in geometry occurs without distorting the layer structure.
Manjusha Chakraborty et al [8] synthesised LDH-MTX nanovector by ex situ and in
situ processes. Analysing the XRD pattern they said that MTX molecules are present in
interlamellar space and are in stabilizedintiltedlongitudinalconformation. From FTIR spectra
they found two hydroxyl peaks of MTX and inferred that MTX was successfully intercalated
in the LDH-MTX nanovector. From HRTEM image they confirmed the increase in the
interlamellar spacing. Further they suggested that synthesis route is responsible for the size
and morphology of the nanovectors.

16 | P a g e
CHAPTER 3
EXPERIMENTAL PROCEDURE
17 | P a g e
EXPERIMENTAL PROCEDURE
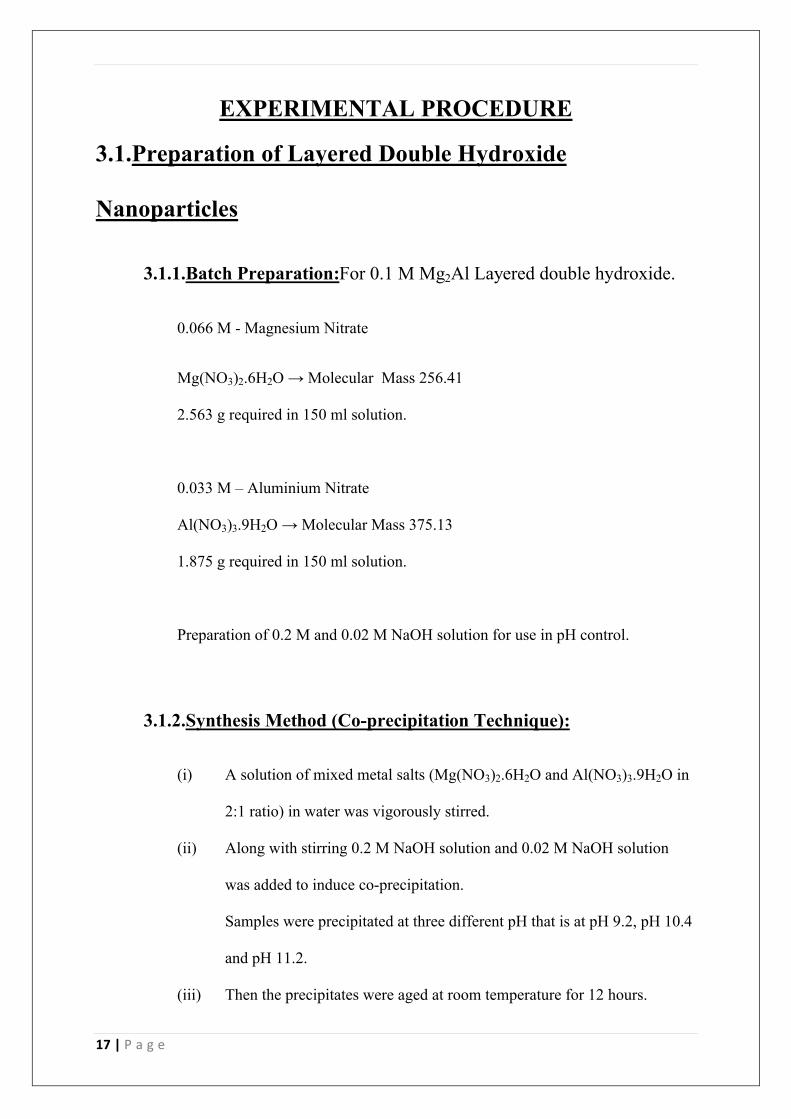
3.1.Preparation of Layered Double Hydroxide
Nanoparticles
3.1.1.Batch Preparation:For 0.1 M Mg2Al Layered double hydroxide.
0.066 M - Magnesium Nitrate
Mg(NO3)2.6H2O → Molecular Mass 256.41
2.563 g required in 150 ml solution.
0.033 M – Aluminium Nitrate
Al(NO3)3.9H2O → Molecular Mass 375.13
1.875 g required in 150 ml solution.
Preparation of 0.2 M and 0.02 M NaOH solution for use in pH control.
3.1.2.Synthesis Method (Co-precipitation Technique):
(i) A solution of mixed metal salts (Mg(NO3)2.6H2O and Al(NO3)3.9H2O in
2:1 ratio) in water was vigorously stirred.
(ii) Along with stirring 0.2 M NaOH solution and 0.02 M NaOH solution
was added to induce co-precipitation.
Samples were precipitated at three different pH that is at pH 9.2, pH 10.4
and pH 11.2.
(iii) Then the precipitates were aged at room temperature for 12 hours.
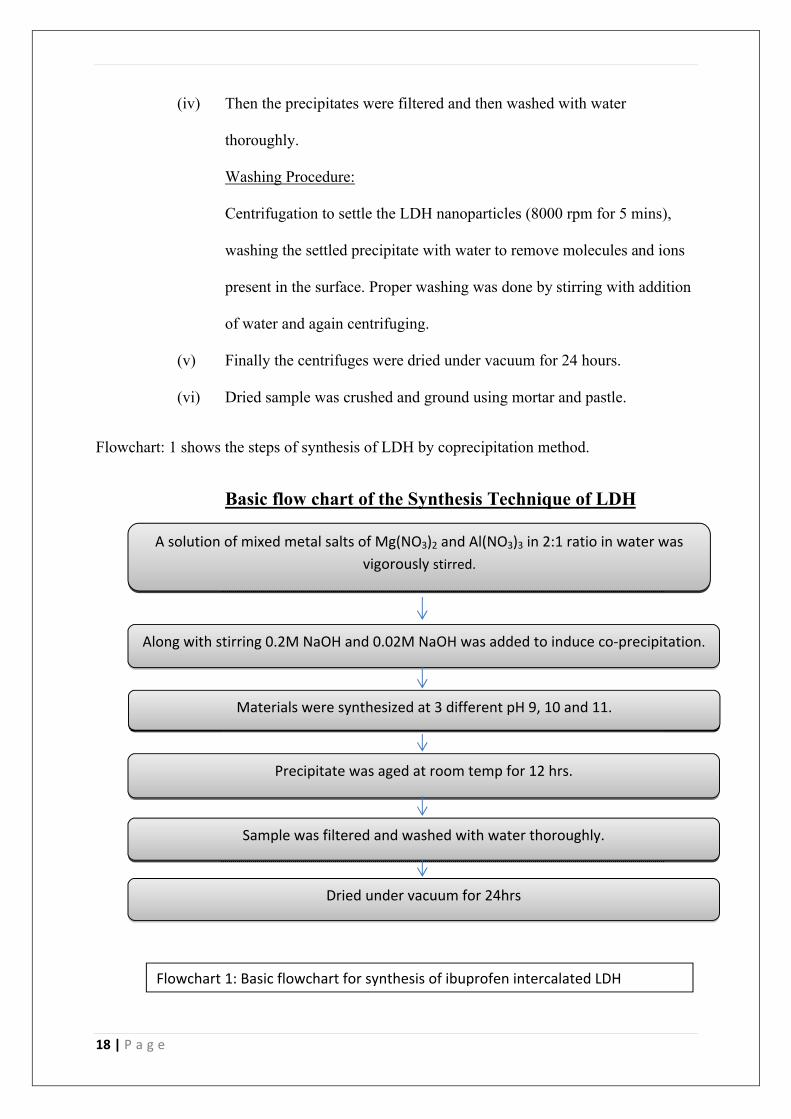
18 | P a g e
(iv) Then the precipitates were filtered and then washed with water
thoroughly.
Washing Procedure:
Centrifugation to settle the LDH nanoparticles (8000 rpm for 5 mins),
washing the settled precipitate with water to remove molecules and ions
present in the surface. Proper washing was done by stirring with addition
of water and again centrifuging.
(v) Finally the centrifuges were dried under vacuum for 24 hours.
(vi) Dried sample was crushed and ground using mortar and pastle.
Flowchart: 1 shows the steps of synthesis of LDH by coprecipitation method.
Basic flow chart of the Synthesis Technique of LDH
A solution of mixed metal salts of Mg(NO3)2 and Al(NO3)3 in 2:1 ratio in water was vigorously stirred.
Along with stirring 0.2M NaOH and 0.02M NaOH was added to induce co-precipitation.
Materials were synthesized at 3 different pH 9, 10 and 11.
Precipitate was aged at room temp for 12 hrs.
Sample was filtered and washed with water thoroughly.
Dried under vacuum for 24hrs
Flowchart 1: Basic flowchart for synthesis of ibuprofen intercalated LDH

19 | P a g e
3.2.Preparation of drug ibuprofen intercalated Layered
Double Hydroxide Nanoparticles
3.2.1. Batch Preparation: : For ibuprofen intercalated Mg-Al LDH.
0.066 M - Magnesium Nitrate
Mg(NO3)2.6H2O → Molecular Mass 256.41
2.563 g required in 150 ml solution.
0.033 M – Aluminium Nitrate
Al(NO3)3.9H2O → Molecular Mass 375.13
1.875 g required in 150 ml solution.
3.2.2. Synthesis Method (Co-precipitation Technique):
(i) Decarbonated water was prepared by continuously purging nitrogen over
deionised water for 3hrs and 15 mins.
(ii) Mixed metal salts (Mg(NO3)2.6H2O and Al(NO3)3.9H2O in 2:1 ratio) in
water were added and was vigorously stirred.
(iii) 0.203 gm. of drug molecule was added with continuous nitrogen purging
and vigorous stirring.
(iv) NaOH pellets were added to make pH 10 and induce coprecipitation.
(v) After vigorous stirring for 3 hrs. and 30 mins the precipitate was aged at
room temperature for 24 hrs.
(vi) Then the precipitate was washed in deionised water twice by
Ultracentrifugation, 12000 rpm / 5mins. Then dried in vacuum for 24 hrs.
Flowchart: 2 shows the basic steps of synthesis of LDH-IBU

20 | P a g e
Basic flow chart of the Synthesis Technique of LDH-IBU
Preparation of decarbonated water
(3hrs 15mins Nitrogen purging)
Addition of Nitrates
(Mg(NO3)2 and Al(NO3)3 in 2:1 ratio)
5mins rapid stirring
Addition of drug molecule
(0.203 gram of Ibuprofen was added)
NaOH pellet addition to make the pH ~ 10
(10 number of NaOH pellets were added)
Vigorous stirring to induce Co-precipitation
(3hrs 30mins stirring)
Aged at room temperature for 24hrs
(Without exposure to atmosphere, Parafilm sealing)
Washing 2 times in distilled water
(Ultracentrifugation, 12000 rpm / 5mins)
Continuous Nitrogen Purging and stirring
(Purging rate around 30 ml/min)
Oven drying for 24hrs.
Flowchart 2: Basic flowchart for synthesis of Ibuprofen intercalated LDH nanoparticles.
21 | P a g e
3.3. Characterisations
3.3.1Particle Size Analysis
Particle size analysis of the LDH samples synthesised at different pH was
determined using Dynamic Light Scattering (DLS) using the Zetasizer
machine.
3.3.2. Energy Dispersive X-ray Analysis
EDX or Energy Dispersive X-ray analysis of the samples of LDH 9, LDH 10
and LDH 11 were done in Scanning Electron Microscope equipment.
3.3.3. XRD Analysis
XRD analysis of all the synthesised samples were done and compared to get
the knowledge about any change in structure.
3.3.4. FTIR Analysis
FTIR analysis was done for LDH, drug ibuprofen, and LDH-IBU and the
relative plot were determined to get the comparative change in bond structure
and vibration due to intercalation of drug molecule in LDH.
3.3.5. Release Rate Study
Using UV-Visible spectroscopy the linear plot between drug concentration
and absorbance was obtained for 260 nm UV radiations. From the linear plot
of absorbance vs. concentration the relation between the two parameters were
determined.

22 | P a g e
Then the drug ibuprofen release study was done in SBF from the LDH-IBU
nanohybrid. The absorbance of ibuprofen with respect to time in SBF was
determined using UV-Vis spectroscopy and from the absorbance data the
concentration of the drug was calculated from the liner plot of absorbance vs.
concentration determined earlier.
SBF preparation was done using A. Cuneyt Tas [7] method.

23 | P a g e
CHAPTER 4
RESULTS AND DISCUSSION

24 | P a g e
RESULTS AND DISCUSSION
4.1. Particle Size Distribution Analysis:
4.1.1. LDH 9
Intensity distribution
Fig 1: Intensity vs. size plot for LDH synthesised at pH 9.
Volume distribution
Fig 2: Volume percent vs. size plot for LDH synthesised at pH 9.
Average particle size obtained in this case is 118.8 nm.
0
5
10
15
0.1 1 10 100 1000 10000
Inte
nsity
(%
)
Size (d.nm)
Size Distribution by Intensity
Record 4: LDH 9.2 1
0
2
4
6
8
10
12
0.1 1 10 100 1000 10000
Vol
ume
(%)
Size (d.nm)
Size Distribution by Volume
Record 4: LDH 9.2 1

25 | P a g e
Figure 1 represents the intensity vs particle size distribution plot whereas figure 2 shows the
volume vs particle size distribution plot. In both the cases the larger particles around 5-6 m
is originated from the bigger dust particle in the powder suspension which is as obviously
more intense in volume distribution plot in figure 2. The particle size obtained in this case
ignoring the impurities will be less than 100nm.
4.1.2.LDH 10
Intensity distribution
Fig 3: Intensity vs. size plot for LDH synthesised at pH 10.Volume distribution
Fig 4: volume percent vs. size plot for LDH synthesised at pH 10.
0
5
10
15
0.1 1 10 100 1000 10000
Inte
nsity
(%
)
Size (d.nm)
Size Distribution by Intensity
Record 2: LDH10.4 1
0
5
10
15
0.1 1 10 100 1000 10000
Vol
ume
(%)
Size (d.nm)
Size Distribution by Volume
Record 2: LDH10.4 1

26 | P a g e
Figure 3 and figure 4 show the intensity vs particle size and volume vs particle size
distribution plot of LDH synthesized at pH 10. LDH 10 powders showed an average particle
size of 240 nm. In this case also the particle sizes around 5-6 m was originated from fewer
dust particles in the powder suspension coming from air. Very small particles below 100nm
were also present though they were found in smaller concentration.
4.1.3. LDH-11
Intensity distribution
Fig 5: Intensity vs. size plot for LDH synthesised at pH 11.
0
5
10
15
20
25
0.1 1 10 100 1000 10000
Inte
nsity
(%
)
Size (d.nm)
Size Distribution by Intensity
Record 3: LDH11.2 1

27 | P a g e
Volume distribution
Fig 6: Volume percent vs. size plot for LDH synthesised at pH 11.
Figure 5 and figure 6 show the intensity vs particle size and volume vs particle size
distribution plot of LDH synthesized at pH 11 which are unimodal in nature. LDH 11 showed
an average particle size of 170.7 nm.
Table 1: Average particle size and Poly Dispersive Index of LDH synthesised at different pH.
From Table 1, we conclude that the average particle size of 118.8 nm obtained in case of
LDH 9 is the smallest, and that of the LDH 10 is the highest and that is 240.1 nm. Obviously
LDH 11 showed the lowest value of polydispersive index of 0.063 nm as from table 1.
0
5
10
15
20
0.1 1 10 100 1000 10000
Vol
ume
(%)
Size (d.nm)
Size Distribution by Volume
Record 3: LDH11.2 1
Sample name Average particle size (nm) PDI
LDH 9 118.8 0.241
LDH 10 240.1 0.437
LDH 11 170.7 0.063

28 | P a g e
Particle size is an important aspect of LDH as a drug delivery agent. The particle size
determines the following properties:
(i) The rate of absorption of LDH and the transport rate.
(ii) The rate of internalisation into cell. (By phagocytosis or endocytosis)
(iii) The rate of dissolution of LDH in the cytoplasm to release the drug molecule.
All the above aspects suggest that larger particles are not suitable as they decrease the
absorption and transport rate. Larger particles enable phagocytosis which is very slower and
less efficient process in comparison to endocytosis carried out by smaller particles. Ion
exchange of intercalated drug molecules is not possible in case of larger particles, hence
smaller particles below 150 nm are desired.

29 | P a g e
4.2. EDX Analysis
4.2.1. LDH 9
Fig 7: EDX plot of LDH synthesised at pH 9 showing various elements present in the sample
and their concentration.
ELEMENT APP CONC. INTENSITY
CORRN
WEIGHT % ATOMIC %
O 135.00 1.6023 64.81 74.33
Mg 23.24 0.7681 23.27 17.56
Al 9.43 0.6087 11.92 8.10
TOTALS 100.00
Table 2: Weight percent and Atomic percent of elements detected by EDX for LDH
synthesised at pH 9.
From fig 7 and table 2, the elements detected by energy dispersive x-ray analysis were
oxygen, magnesium and aluminium. It suggests that magnesium-aluminium mixed
hydroxides were present in the material and that this mixed hydroxides were in ratio close to

30 | P a g e
2:1 of Mg:Al which was the ratio of the nitrate precursors that we used for the synthesis of
LDH.
4.2.2. LDH 10
Fig 8: EDX plot of LDH synthesised at pH 10 showing various elements present in the
sample and their concentration.
ELEMENT APP CONC. INTENSITY
CORRN
WEIGHT % ATOMIC %
O 156.12 1.5866 63.98 73.63
Mg 28.55 0.7737 23.99 18.17
Al 11.20 0.6055 12.03 8.21
TOTALS 100.00
Table 3: Weight percent and Atomic percent of elements detected by EDX for LDH
synthesised at pH 10.
Figure 8 and table 3 show the energy dispersive x-ray analysis of LDH 10. The elements
detected by energy dispersive x-ray analysis are oxygen, magnesium and aluminium. The

31 | P a g e
atomic percent of magnesium was almost double of that of the aluminium which was the
atomic ratio of Mg and Al in the precursor used. The oxygen atomic percent was around 74
% that for the formation of the layered double hydroxide.
4.2.3. LDH 11
Fig 9: EDX plot of LDH synthesised at pH 11 showing various elements present in the
sample and their concentration.
ELEMENT APP CONC. INTENSITY
CORRN
WEIGHT % ATOMIC %
O 163.33 1.6605 67.47 76.53
Mg 23.59 0.7506 21.55 16.09
Al 9.82 0.6143 10.97 7.38
TOTALS 100.00
Table 4: Weight percent and Atomic percent of elements detected by EDX for LDH
synthesised at pH 11.

32 | P a g e
Figure 9 and Table 4 show the energy dispersive x-ray analysis of LDH 11. It suggests that
the atomic concentration of oxygen is 76 % and that of magnesium-aluminium are 16 % and
around 8% respectively that is in the atomic ratio of 2:1.
From the above EDX plots and tables we confirmed that magnesium aluminium layered
double hydroxides were formed with the Mg and Al ratio 2:1.
Hence we got the LDH as
Mg(II)0.66 Al(III)0.33 (OH)2 (An-)0.33/n × y H2O
Where ‘A’ is interlayer anion that may be nitrate or other exchangeable anions, ‘y’ is a
fraction constant and n is an integer.

33 | P a g e
4.3. XRD Analysis
4.3.1. LDH at different pH
0 1 0 2 0 3 0 4 0 5 0 6 0 7 0 8 0 9 0
Inte
nsi
ty (
a.u
.)
2
p h 9
p h 1 0
p h 1 1
Fig 10: Comparative intensity vs. 2θ plot showing XRD patterns of LDH at different pH.
Figure 10 shows the XRD pattern of as synthesized LDH nanopowder synthesized at
different pH of 9, 10 and 11.
(All peaks obtained are of LDH, first peak is (0 0 3), second one (0 0 6), third one (0 0 9)
LDH 9 (From Fig. 10)
Peak 1 d0 0 3 at 2θ = 10.93º
Peak 2 d0 0 6 at 2θ = 22.79º
d0 0 3 = (λ / 2 sin θ) for n=1 and λ=1.54 Å
34 | P a g e
so d0 0 3 = 8.085 Å
LDH 10 (From Fig. 10)
Peak 1 d0 0 3 at 2θ = 11.49º
Peak 2 d0 0 6 at 2θ = 23.03º
d0 0 3 = (λ / 2 sin θ) for n=1and λ=1.54 Å
so d0 0 3 = 7.403 Å
LDH 11 (From Fig. 10)
Peak 1 d0 0 3 at 2θ = 11.57º
Peak 2 d0 0 6 at 2θ = 23.35º
d0 0 3 = (λ / 2 sin θ) for n=1 and λ=1.54 Å
so d0 0 3 = 7.639 Å
The interplannar spacing d0 0 3 is around 8 Å for the LDH synthesised at three different pH 9,
10, 11.

35 | P a g e
4.3.2. LDH-IBU
0 10 20 30 40 50 60 70 80 90
Inte
nsity
(a.
u.)
Angle 2
LDH+Ibu
Fig 11: Intensity vs. 2θ plot showing XRD patterns of ibuprofen intercalated LDH
synthesised at pH 10. (All peaks are of LDH, first peak is (0 0 3), second one (0 0 6), third
one (0 0 9).
Figure 11 shows the XRD pattern of ibuprofen intercalated LDH sample.
LDH-IBU (From Fig. 11)
Peak 1 d0 0 3 at 2θ = 6.57º
Peak 2 d0 0 6 at 2θ = 18.25º
d0 0 3 = (λ / 2 sin θ) for n=1 and λ=1.54 Å
so d0 0 3 = 13.437 Å

36 | P a g e
4.3.3. Relative plot of LDH-IBU and LDH at pH 10
0 10 20 30 40 50 60 70 80 90
Inte
nsi
ty (
a.u
)
2degree
LDH
LDH+Ibu
0 0 3
0 0 6
0 0 90 0 3
0 0 6 0 0 9
Fig 12: Comparative intensity vs. 2θ plot showing XRD patterns of LDH and LDH-IBU
(ibuprofen intercalated LDH) synthesised at pH 10.
Figure 12 shows the comparative XRD pattern of pristine LDH and ibuprofen intercalated
LDH sample. A left shift for the peaks of basal plane of ibuprofen intercalated LDH sample
is quite evident here.
Table 5: Table showing relative value of first peak 2θ, interplannar spacing and peak intensity
for LDH and LDH-IBU.
LDH LDH-IBU
2θ for first peak 11.49º 6.57º
d0 0 3 7.403 Å 13.437 Å
Peak intensity for first peak High Low
37 | P a g e
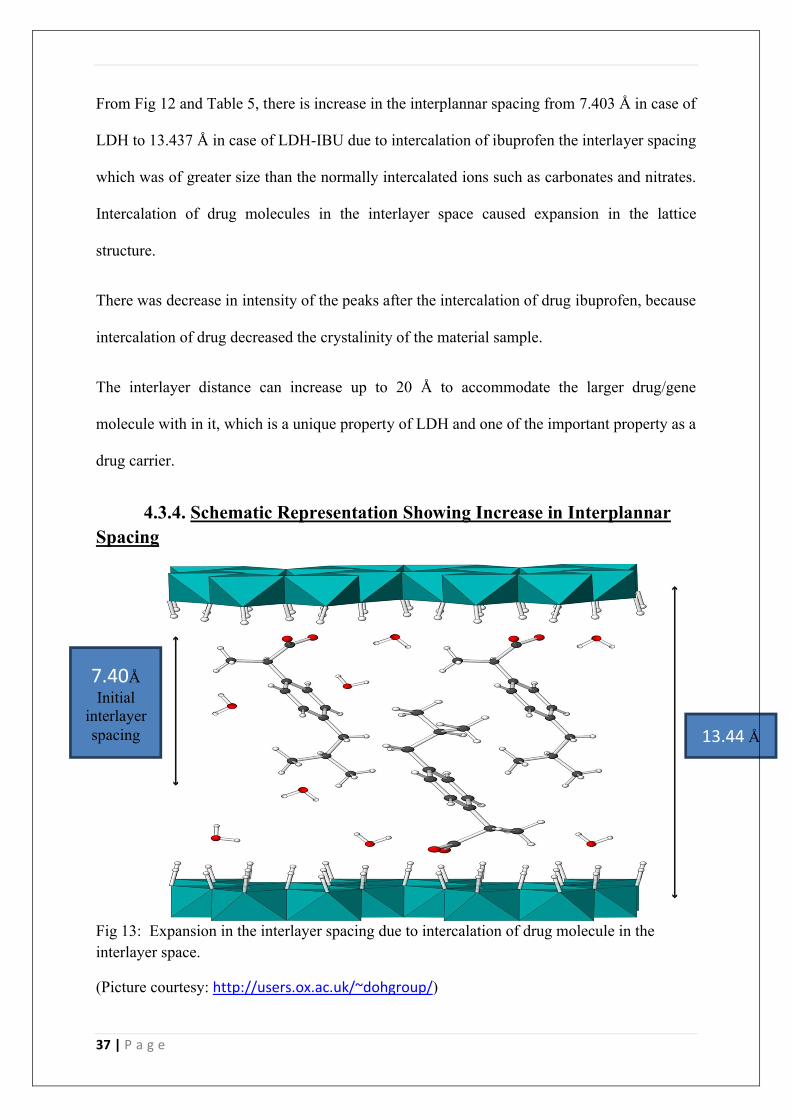
From Fig 12 and Table 5, there is increase in the interplannar spacing from 7.403 Å in case of
LDH to 13.437 Å in case of LDH-IBU due to intercalation of ibuprofen the interlayer spacing
which was of greater size than the normally intercalated ions such as carbonates and nitrates.
Intercalation of drug molecules in the interlayer space caused expansion in the lattice
structure.
There was decrease in intensity of the peaks after the intercalation of drug ibuprofen, because
intercalation of drug decreased the crystalinity of the material sample.
The interlayer distance can increase up to 20 Å to accommodate the larger drug/gene
molecule with in it, which is a unique property of LDH and one of the important property as a
drug carrier.
4.3.4. Schematic Representation Showing Increase in Interplannar Spacing
Fig 13: Expansion in the interlayer spacing due to intercalation of drug molecule in the interlayer space.
(Picture courtesy: http://users.ox.ac.uk/~dohgroup/)
7.40ÅInitial
interlayer spacing 13.44 Å

38 | P a g e
The schematic representation (Fig 13) shows that before intercalation the interlayer spacing
was 7.40Å and the intercalation of drug molecule increased the interlayer spacing to 13.44 Å
due to the large size of the drug ibuprofen. The structure of ibuprofen contains large structure
benzene ring which is responsible for expansion of the lattice.
Ibuprofen ((CH3)2CHCH2C6H4CH(CH3)COOH) is large in comparison to the CO32- and NO3
-
structure. Hence, to accommodate the large structure of the drug molecule the interlayer
spacing is increased and drug is intercalated in the interlayer space. Various bonding between
the layer structure and the drug molecule are establishedsuch as hydrogen bonding,
Vanderwall attraction, electrostatic forces etc. to accommodate the large structure the lattice
has to expand.

39 | P a g e
4. 4. FTIR ANALYSIS
4.4.1. FTIR OF LDH
Fig 14: FTIR plot {Transmittance (% T) vs. wave number (1/cm) plot} of LDH.
From Fig 14, occurrence of different peaks can be explained as follows.
450 cm-1 is due to Lattice vibration of M-OH bond.
650 cm-1 is due to Lattice vibration of M-O bond.
1357 cm-1 signifies presence of carbonate (CO32- ) ions.
1380 cm-1 signifies presence of nitrate (NO3-) ions.
1620 cm-1 signifies bending vibration of water molecules.
3400 cm-1 signifies the stretching of hydroxyl group (both from layer and water
molecules)
5007501000125015001750200025003000350040001/cm
0
10
20
30
40
50
60
70
%T
ldh-r
40 | P a g e
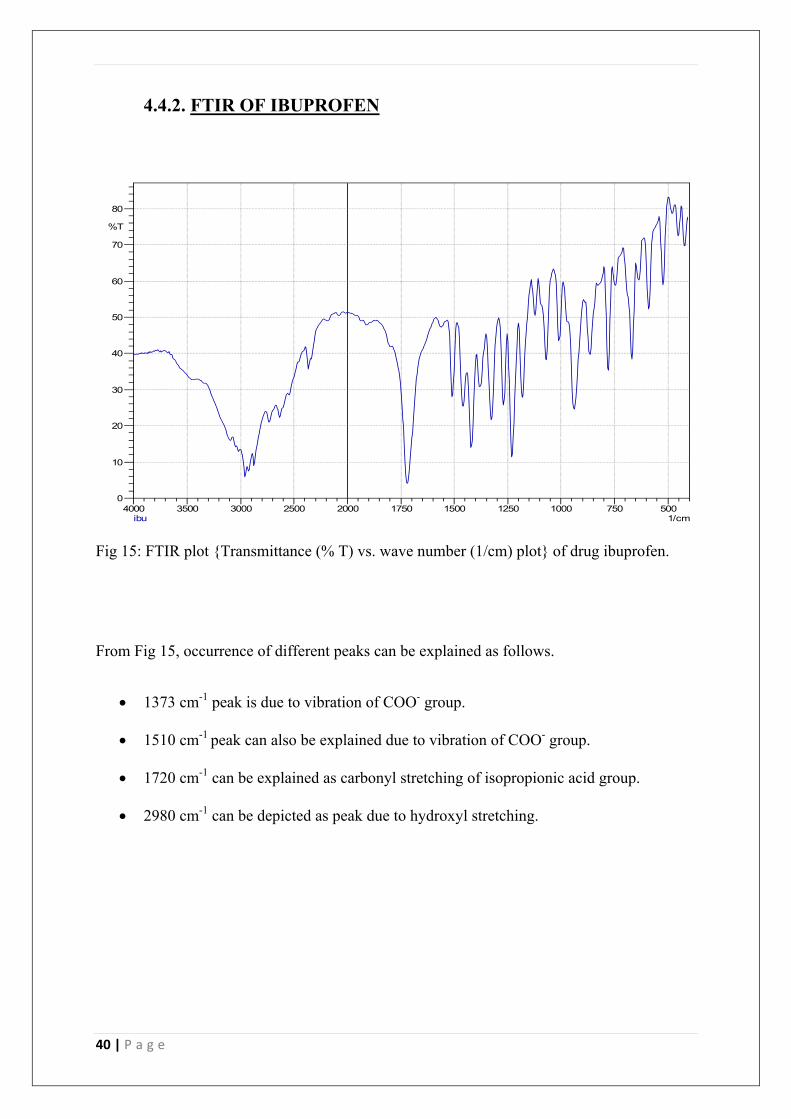
4.4.2. FTIR OF IBUPROFEN
Fig 15: FTIR plot {Transmittance (% T) vs. wave number (1/cm) plot} of drug ibuprofen.
From Fig 15, occurrence of different peaks can be explained as follows.
1373 cm-1 peak is due to vibration of COO- group.
1510 cm-1 peak can also be explained due to vibration of COO- group.
1720 cm-1 can be explained as carbonyl stretching of isopropionic acid group.
2980 cm-1 can be depicted as peak due to hydroxyl stretching.
5007501000125015001750200025003000350040001/cm
0
10
20
30
40
50
60
70
80
%T
ibu
41 | P a g e
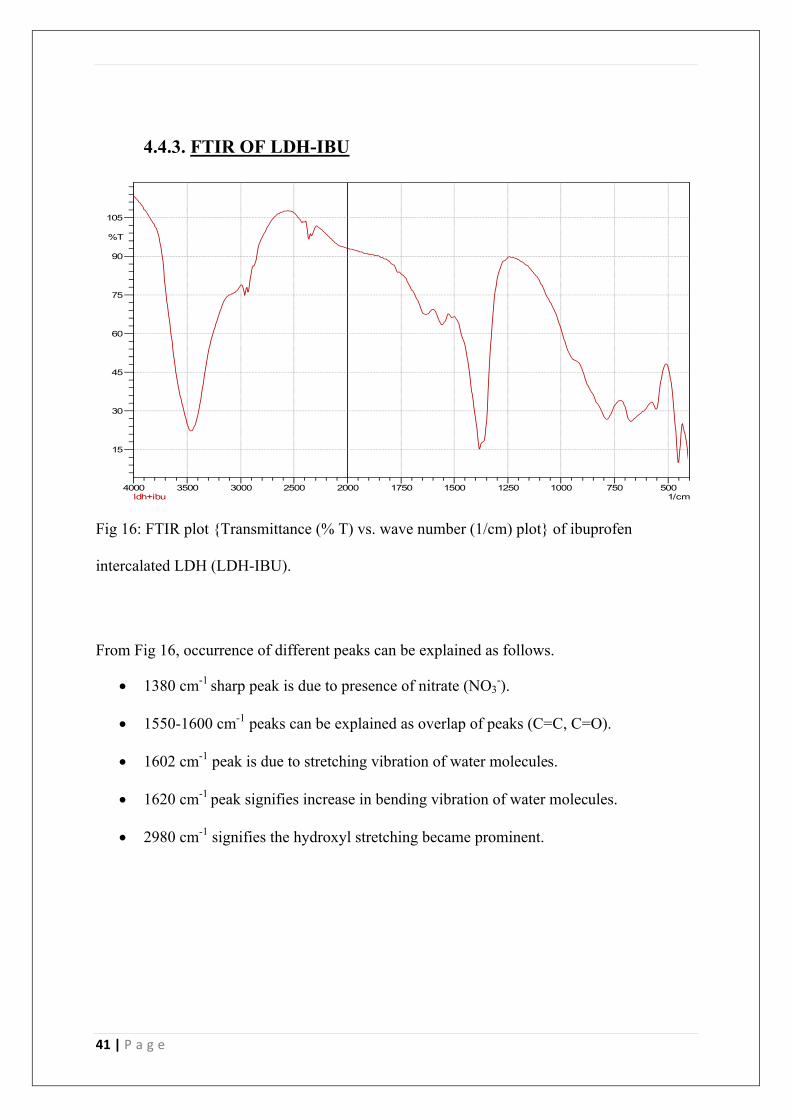
4.4.3. FTIR OF LDH-IBU
Fig 16: FTIR plot {Transmittance (% T) vs. wave number (1/cm) plot} of ibuprofen
intercalated LDH (LDH-IBU).
From Fig 16, occurrence of different peaks can be explained as follows.
1380 cm-1 sharp peak is due to presence of nitrate (NO3-).
1550-1600 cm-1 peaks can be explained as overlap of peaks (C=C, C=O).
1602 cm-1 peak is due to stretching vibration of water molecules.
1620 cm-1 peak signifies increase in bending vibration of water molecules.
2980 cm-1 signifies the hydroxyl stretching became prominent.
5007501000125015001750200025003000350040001/cm
15
30
45
60
75
90
105
%T
ldh+ibu

42 | P a g e
4.4.4. Comparison of FTIR of LDH, IBUPROFEN and LDH-IBU
0 500 1000 1500 2000 2500 3000 3500 4000 4500
Tra
nsm
itan
ce (
a.u
)
Wave number (cm-1)
LDH+ Ibu
Ibu
LDH
Fig 17: Comparative FTIR plot (Transmittance vs. wave number plot) of LDH,
IBUPROFEN, LDH-IBU.
The above plot of Transmittance vs. Wave number is the relative plot of FTIR of LDH 10,
drug ibuprofen and LDH-IBU (ibuprofen intercalated LDH).
From the comparative study of FTIR peaks of LDH, IBU and LDH+IBU as in figure 17, we can draw following conclusions:
1380 cm-1 peak signifies presence of nitrate (NO3-).The peak became sharper in case
of LDH-IBU than that of LDH which also have 1357 cm-1 carbonate peak along with
nitrate peaks.
1606 cm-1 peak is due to stretching vibration of C=C. (This peak is not present in
LDH).

43 | P a g e
1620 cm-1 signifies increase in the bonding vibration of water molecules. (Less
intense peak in LDH).
1550-1600 cm-1 signifies overlap of peaks of C=C and C=O.
450 cm-1 signifies that the peak for lattice vibration of M-OH became more intense.
660 cm-1 signifies that the peak for lattice vibration of M-O became more intense.
2980 cm-1 peak is due to hydroxyl stretching of molecules of ibuprofen which
appeared in LDH-IBU.
1357 cm-1 and 1510 cm-1 peaks are due to occurrence of COO- group vibration.
1720 cm-1 signifies carbonyl stretching of ibuprofen that appeared in LDH-IBU.
44 | P a g e
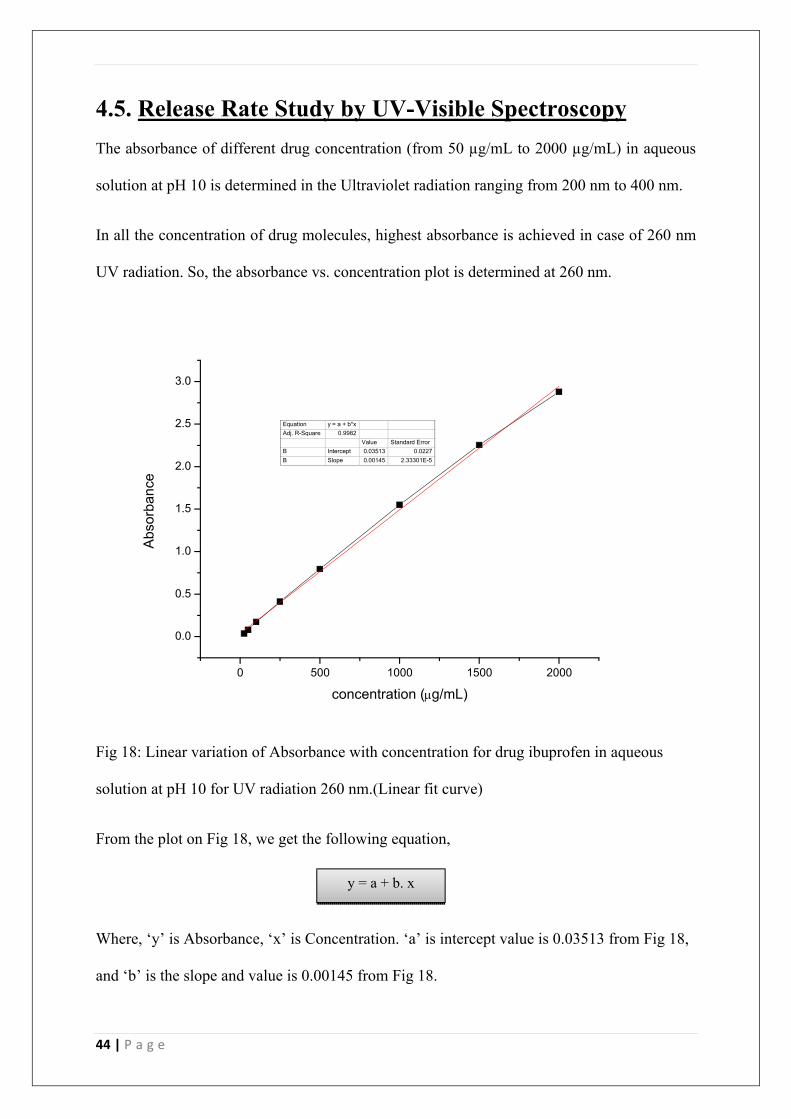
4.5. Release Rate Study by UV-Visible Spectroscopy
The absorbance of different drug concentration (from 50 µg/mL to 2000 µg/mL) in aqueous
solution at pH 10 is determined in the Ultraviolet radiation ranging from 200 nm to 400 nm.
In all the concentration of drug molecules, highest absorbance is achieved in case of 260 nm
UV radiation. So, the absorbance vs. concentration plot is determined at 260 nm.
0 500 1000 1500 2000
0.0
0.5
1.0
1.5
2.0
2.5
3.0
Abs
orba
nce
concentration (g/mL)
Equation y = a + b*x
Adj. R-Square 0.9982
Value Standard Error
B Intercept 0.03513 0.0227
B Slope 0.00145 2.33301E-5
Fig 18: Linear variation of Absorbance with concentration for drug ibuprofen in aqueous
solution at pH 10 for UV radiation 260 nm.(Linear fit curve)
From the plot on Fig 18, we get the following equation,
Where, ‘y’ is Absorbance, ‘x’ is Concentration. ‘a’ is intercept value is 0.03513 from Fig 18,
and ‘b’ is the slope and value is 0.00145 from Fig 18.
y = a + b. x

45 | P a g e
The equation becomes y = 0.00145.x + 0.0351 and this equation is used to find out unknown
concentration of drug molecule.
RELEASE STUDY
The release of the drug molecules in SBF (Simulated Body Fluid) in the given time period is
calculated by determining the absorbance by using UV visible spectroscopy and further the
concentration the drug is calculated from absorbance using the equation obtained from the
linear plot in Fig 18.
TIME (in hour) ABSORBANCE CONC. (µg/mL) CUMMULATIVE %
RELEASE
0.5 0.0893 37.3818 20.01
1 0.1297 65.3310 34.95
2 0.1461 76.4966 40.92
4 0.1788 99.0617 52.98
6 0.2040 116.4345 62.29
12 0.2369 139.1379 74.44
24 0.2670 159.9035 85.55
48 0.2850 172.3035 92.19
72 0.2927 172.6276 95.04
Table 6: Variation of Absorbance, Concentration of ibuprofen and Cumulative release of
ibuprofen in SBF with respect to elapsed time in SBF.
From the data obtained in the Table 6, we can determine the release rate by plotting the
cumulative release vs. time plot, which is shown in Fig 19.

46 | P a g e
0 10 20 30 40 50 60 70 800
10
20
30
40
50
60
70
80
90
100C
umm
ulat
ive
% r
elea
se
Time (in hours)Fig: Release rate of drug Ibuprofen in SBF (Simulated Body Fluid)
Fig 19: Cumulative percent release of drug molecule in SBF (pH 7.4) vs. time.
From Table 6 and Fig 19, we come to the conclusion that, in 1 hour time around 35 % of the
drug ibuprofen was released. In 4 hours more than 50 % drug was released. Cumulative drug
release after 12 hour was more than 75 %. In 24 hour time more than 85 % drug was released.
In 72 hours more than 95% drug release was achieved.

47 | P a g e
CHAPTER 5
CONCLUSION

48 | P a g e
CONCLUSIONS
Non-steroid anti-inflammatory drug ibuprofen intercalated Mg-Al layered double hydroxide
was synthesized using coprecipitation method. The nanopowders synthesised were in the size
range between 100 to 200 nm. XRD analysis showed that there is an increase in d003 spacing
from 7.40 Å for pristine LDH to 13.44Å for ibuprofen intercalated LDH due to the
intercalation of larger ibuprofen molecule in the interlayer space of LDH. FTIR analysis
indicated hydroxyl and carbonyl stretching of ibuprofen in LDH-IBU sample confirming the
presence of ibuprofen in LDH. The drug release study in in vitro simulated body fluid using
UV-Vis spectroscopy showed that 50 % drug molecules were released in 4 hours and more
than 95 % release was achieved after a time period of 72 hours.
49 | P a g e
REFERENCES
1. Jin-Ho Choy et al, “Layered double hydroxide as an efficient drugreservoir for
folate derivatives”, Biomaterials 25 (2004) 3059–3064.
2. Zhongliang Wang et al, “Synthesis and properties of Mg2Al layered double
hydroxidescontaining 5-fluorouracil”, Journal of Solid State Chemistry 178 (2005)
736–741.
3. Manjusha Chakraborty et al, “Methotrexate intercalated ZnAl layered double
hydroxide”, Journal of Solid State Chemistry.
4. Jae-Min Oh et al, “Efficient delivery of anticancer drug MTX through MTX-LDH
nanohybridsystem”, Journal of Physics and Chemistry of Solids 67 (2006) 1024–
1027.
5. Weishen Yang et al, “A study by in situ techniques of the thermal evolution of the
structureof a Mg–Al–CO3layered double hydroxide”, Chemical Engineering Science
57 (2002) 2945 – 2953.
6. L. Mohanambe et al, “Anionic Clays Containing Anti-Inflammatory Drug Molecules:
Comparison of Molecular Dynamics Simulation and Measurements”, J. Phys. Chem.
B 2005, 109, 15651-15658.
7. A. Cuneyt Tas, “Synthesis of biomimetic Ca-hydroxyapatite powders at 37ºC in
synthetic body fluids”, Biomaterials 21 (2000) 1429-1438.
8. Manjusha Chakraborty et al, “Layered double hydroxide: Inorganic organic conjugate
nanocarrier for methotrexate”, Journal of Physics and Chemistry of Solids
72(2011)779–783.
9. Amal A. Elkordy et al, “Dissolution of ibuprofen from spray driedand spray chilled
particles”, University of Sunderland, Department of Pharmacy.

50 | P a g e
10. Jae-Min Oh et al, “Inorganic Drug-Delivery Nanovehicle Conjugated with Cancer-
Cell-Specific Ligand”, Jou of Advanced Functional Materials.
11. Zhi Ping Xu et al, “Inorganic nanoparticles as carriers for efficient cellular delivery”,
Chemical Engineering Science 61 (2006) 1027 – 1040.
12. Zhi Ping Xu et al, “Layered double hydroxide nanomaterials as potential cellular drug
delivery agents”, Pure Appl. Chem., Vol. 78, No. 9, pp. 1771–1779, 2006.
13. P Nalawade et al, “Layered double hydroxides: a review”, Jou of Sci. and Ind.
Research, Vol. 68, 2009, pp.267-272.
14. C. Forano et al “Layered double hydroxides”, Developments in Clay Science, Vol. 1,
2006.
15. José L. Arias,“Novel Strategies to Improve the Anticancer Action of5-Fluorouracil by
Using Drug Delivery Systems”, Molecules 2008, 13, 2340-2369; DOI:
10.3390/molecules13102340.
16. G. V. Manohara et al, “Structure and Composition of the Layered Double Hydroxides
of Mg and Fe: Implications for Anion-Exchange Reactions”, DOI:
10.1002/ejic.201100104.
17. Yan Hua Xue et al, “The construction and characterization of layered doublehydroxides
as delivery vehicles for podophyllotoxins”, J Mater Sci: Mater Med (2008) 19:1197–
1202.