laurence shatkin, phd senior product developer jist publishing
TRANSCRIPT

Choose a College Major That Makes Sense in
Today’s EconomyLaurence Shatkin, PhD
Senior Product DeveloperJIST Publishing

Survey: Most popular response (80%):
◦ “To find better job opportunities” Next most popular:
◦ “To reach my goals in life”◦ “To earn more”
Why go to college?

What do the trends in the economy mean for your plans for college?

Routine physical tasks Routine decisions Examples
◦ Welding◦ Call routing◦ Travel reservations◦ Retail sales◦ Warehousing
Big trend #1: automation
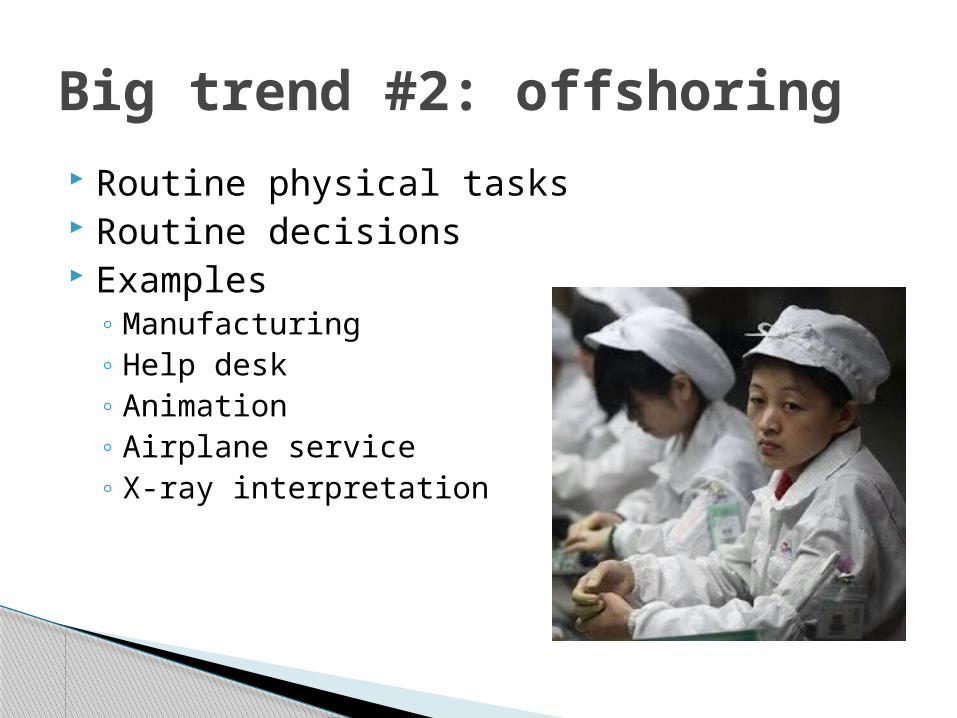
Routine physical tasks Routine decisions Examples
◦ Manufacturing◦ Help desk◦ Animation◦ Airplane service◦ X-ray interpretation
Big trend #2: offshoring
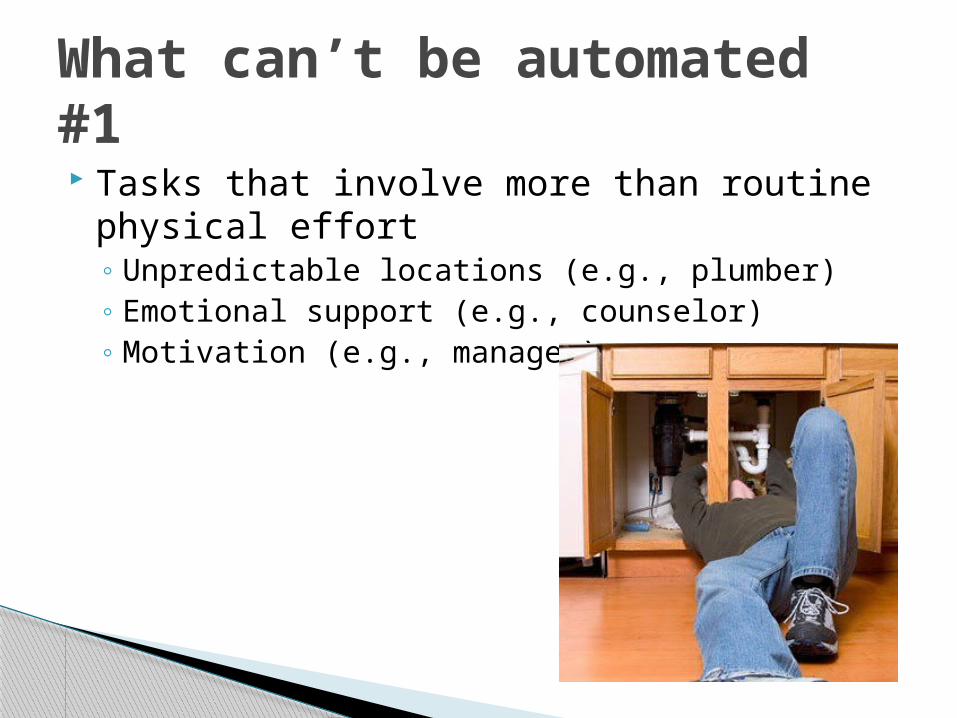
Tasks that involve more than routine physical effort◦ Unpredictable locations (e.g., plumber)◦ Emotional support (e.g., counselor)◦ Motivation (e.g., manager)
What can’t be automated #1

Nonroutine decision making◦ Airport trolley vs. airport van◦ SurveyMonkey vs. employment interviewer◦ Red-light camera vs. police officer
What can’t be automated #2

Tasks where the client/object is on-site◦ Personal contact (e.g., most health care,
grooming)◦ Physical contact (e.g., auto repair, plumbing)◦ Physical intervention (e.g., law enforcement,
firefighting)◦ Time constraint (e.g., fresh food)
What can’t be offshored #1

Tasks that require highly skilled personal communication◦ Help desk (sometimes)◦ Creative collaboration (e.g., comedy writer, app
developer)◦ In-person entertainment (e.g., musician)
What can’t be offshored #2

High-skill jobs are growing Middle-skill jobs are shrinking
◦ Because of automation◦ Because of offshoring
Low-skill jobs are growing
Result: “Hollowing-out” of the workforce

Source: Census Bureau. Analysis by Jaison R. Abel and Richard Dietz, Liberty Street Economics

Data: Census Bureau. Graph: The New York Times.

Job-specific◦ Adjusting an automobile fan belt◦ Performing a CAT scan◦ Programming an e-commerce website
Transferable◦ Mathematics◦ Complex problem solving◦ Critical thinking
Job-specific skills versus transferable skills

High-skill job or low-skill job:what’s the difference in pay?

Occupations Using Mathematics
at 3 Skill Levels
Very High
mathematicians, physicists, mechanical engineers $68,511
Mediumtravel agents, driver/sales
workers, librarians $40,657
Very Lowbailiffs, telemarketers,
crossing guards $27,470

Occupations Using Complex Problem Solving
at 3 Skill Levels
Very High
foresters, economists, sales managers $80,276
Mediumchefs and head cooks,
radiation therapists, roofers $41,671
Very Lowfloral designers, file clerks,
cashiers $23,393
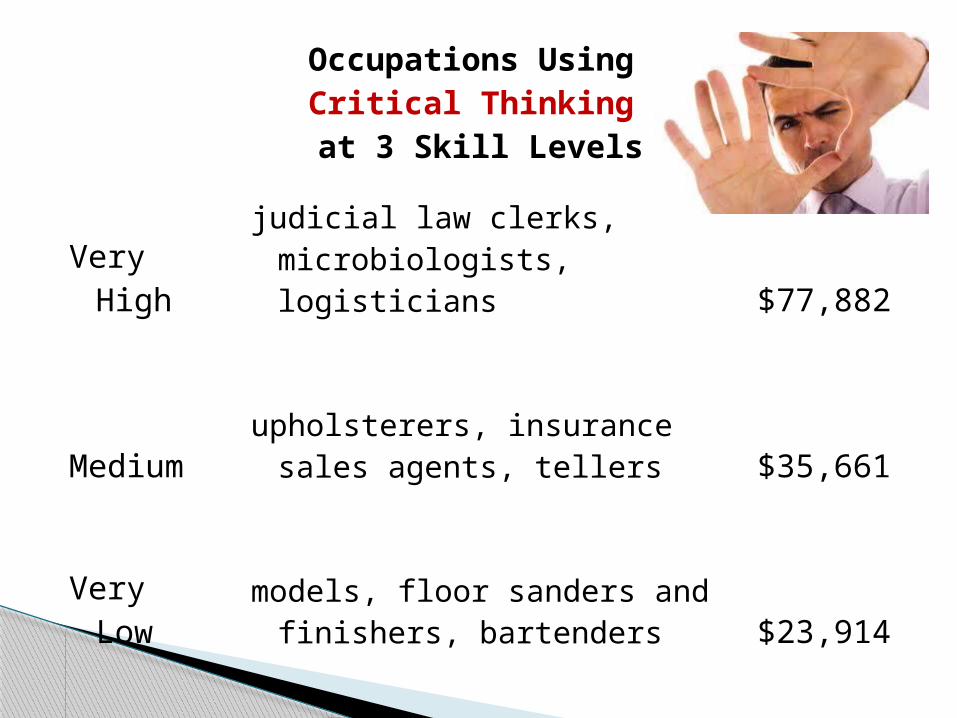
Occupations Using Critical Thinking at 3 Skill Levels
Very High
judicial law clerks, microbiologists, logisticians $77,882
Mediumupholsterers, insurance sales
agents, tellers $35,661
Very Lowmodels, floor sanders and
finishers, bartenders $23,914

Which transferable skills have the biggest earnings payoff?

Skills linked to highest incomeSkill Definition
Judgment and Decision Making
Weighing the relative costs and benefits of a potential action.
Complex Problem Solving
Identifying complex problems, reviewing the options, and implementing solutions.
Active Learning Working with new material or information to grasp its implications.
Reading Comprehension
Understanding written sentences and paragraphs in work-related documents.
Critical Thinking Using logic and analysis to identify the strengths and weaknesses of different approaches.
Time Management
Managing one’s own time and the time of others.

Which skills are used by jobs with the fastest growth?

Skills linked to fastest growthSkill Definition
Service Orientation
Actively looking for ways to help people.
Active Listening Listening to what other people are saying and asking questions as appropriate.
Active Learning Working with new material or information to grasp its implications.
Speaking Talking to others to effectively convey information.
Social Perceptiveness
Being aware of others’ reactions and understanding why they react the way they do.
Writing Communicating effectively with others in writing as indicated by the needs of the audience.

I want it all: earnings and job growth

Note: Lower score means higher ranking.

What industries use these highly rewarding skills at the highest levels?

3.2
3.4
3.6
3.8
Average Rating on Highly Rewarding Skills

Which are the most rewarding industries?

Min
ing, q
uarry
ing, a
nd oil an
d gas
ext
ract
ion
Retail T
rade
Utiliti
es
Man
agem
ent o
f Com
panies an
d Ente
rpris
es
Man
ufact
uring
Tran
spor
tatio
n and W
areh
ousin
g
Prof
essio
nal, S
cientifi
c, a
nd Tec
hnical S
ervice
s$0
$10,000
$20,000
$30,000
$40,000
$50,000
$60,000
$70,000
$80,000
$90,000$77,422
$72,937 $70,787 $67,541 $66,723 $63,879 $62,834
Average Annual Earnings for Bachelor's+ Occupations

Const
ruct
ion
Prof
essio
nal, s
cientifi
c, te
chnica
l svc
s
Health
car
e & s
ocial a
ssist
ance
Admin
istra
tion &
suppor
t
Arts, e
nterta
inm
ent,
& recr
eatio
n
Real e
stat
e, re
ntal,
leas
ing
Other
svc
s (e
xcep
t public
adm
in.)
0.0%
5.0%
10.0%
15.0%
20.0%
25.0%
30.0%
35.0%
40.0%35.0% 34.2%
31.6%29.2%
20.5%18.8% 18.2%
Workforce Change 2010-20 for Bachelor's+ Occupations

Note: Lower score means higher ranking.
Retail T
rade
Prof
essio
nal, S
cientifi
c, a
nd Tec
hnical S
ervice
s
Const
ruct
ion
Min
ing, q
uarry
ing, a
nd oil an
d gas
ext
ract
ion
Tran
spor
tatio
n and W
areh
ousin
g
Admin
istra
tion &
suppor
t
Real E
stat
e an
d Ren
tal a
nd Lea
sing
0
2
4
6
8
10
12
14
16
18
Industries Ranked Highest for Both Earnings and Growth, Bachelor's+ Occupations
GrowthEarnings

What’s the best place to prepare for highly rewarding jobs and industries?

Source: Anthony P. Carnevale, Stephen J. Rose, and Ban Cheah, The College Payoff: Education, Occupations, Lifetime Earnings
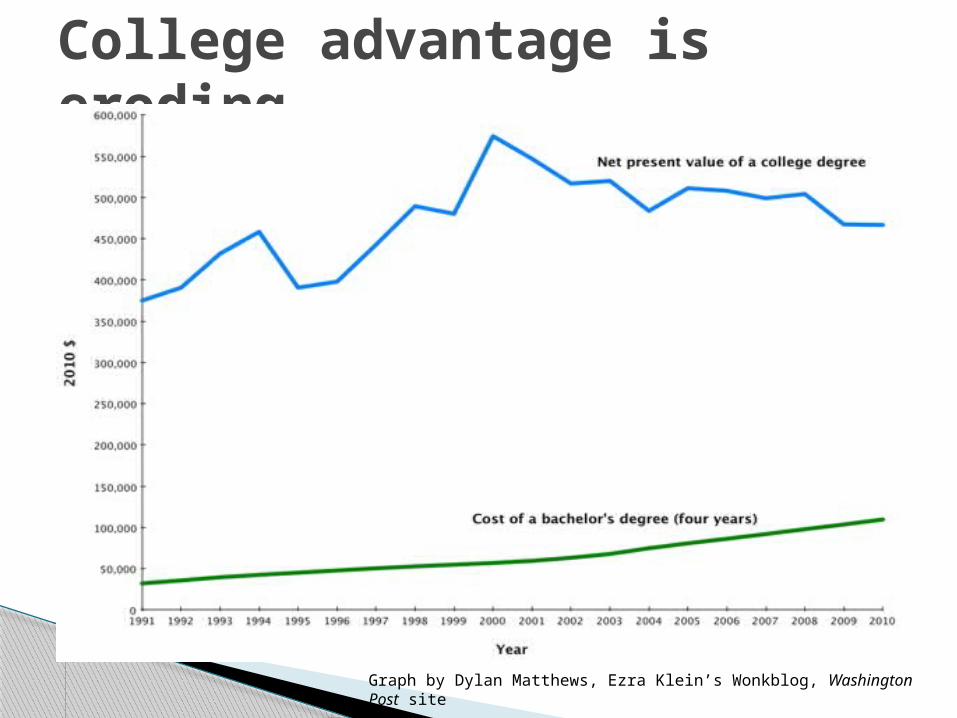
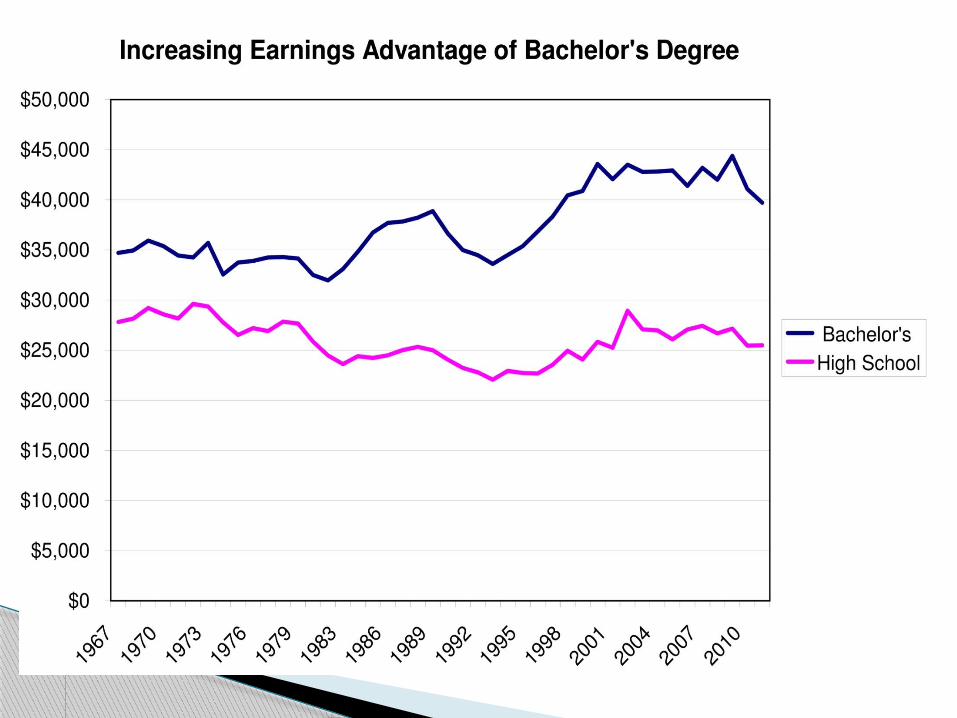
College advantage is eroding
Graph by Dylan Matthews, Ezra Klein’s Wonkblog, Washington Post site

Which of these college fields offer the biggest payoff?
Agricultural sciences
Biological sciences
Business
Computer science
Education
Engineering
Health professions
Humanities
Mathematics
Physical sciences
Social sciences

Source: National Survey of College Graduates, 2003
Engi
neer
ing
Compu
ter s
cienc
e
Mat
hem
atics
Phys
ical s
cienc
es
Busin
ess
Health
pro
fess
ions
Biolo
gica
l scie
nces
$-
$10,000
$20,000
$30,000
$40,000
$50,000
$60,000
$70,000
$80,000
$90,000
$100,000
$85,962 $85,418
$68,814 $68,728 $66,271 $64,395
$55,240
Median Annual Earnings, Bachelor's
Note: For Health professions, includes those with higher degrees.
Health
pro
fess
ions
Biolog
ical scien
ces
Compu
ter s
cien
ce
Busin
ess
Social scien
ces
Human
ities
Educ
ation
0.0%
2.0%
4.0%
6.0%
8.0%
10.0%
12.0%
14.0%
16.0%15.2%
14.9% 13.5%
12.6% 12.3% 12.1% 11.7%
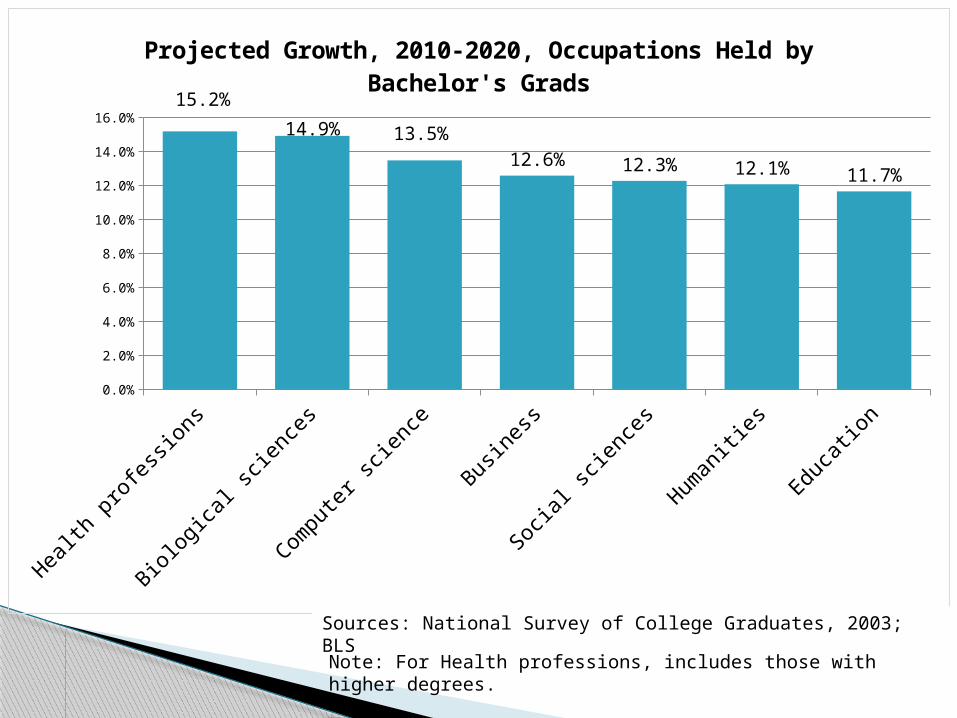
Projected Growth, 2010-2020, Occupations Held by Bachelor's Grads
Sources: National Survey of College Graduates, 2003; BLS
Note: For Health professions, includes those with higher degrees.

Compu
ter s
cienc
e
Health
pro
fess
ions
Biolo
gica
l scie
nces
Busin
ess
Engi
neer
ing
Mat
hem
atics
Phys
ical s
cienc
es0
2
4
6
8
10
12
14
Fields Ranked Highest for Both Earnings and Growth, Bachelor's Occupations
GrowthEarnings
Note: Lower score means higher ranking.

Which specific college majors offer the biggest payoff?
Earnings Job Growth Job Openings

Medical Preparatory Programs $100,000 Computer Systems Engineering $85,000 Pharmacy $84,000 Chemical Engineering $80,000 Electrical and Electronics Engineering $75,000 Mechanical Engineering $75,000 Aerospace, Aeronautical, and Astronautical Engineering $74,000 Computer Science $73,400 Industrial Engineering $73,000 Physics and Astronomy $72,200
Highest-paying (average of top 5 jobs employing bachelor’s grads)
Sources: National Survey of College Graduates, 2003; Bureau of Labor Statistics

Biology and Life Sciences 20.0%Computer Science 19.8%Health and Medical Technology 18.3%General Mathematics 17.8%Physical Therapy 17.6%Medical Preparatory Programs 16.5%Electrical and Electronics Engineering Technology 16.2%Physics and Astronomy 14.8%Information Systems 14.4%Mathematics and Science Teacher Education 13.9%
Fastest-growing (average of top 5 jobs employing bachelor’s grads)
Sources: National Survey of College Graduates, 2003; Bureau of Labor Statistics

Med
ical P
repa
rato
ry P
rogr
ams
Compu
ter S
cienc
e
Phys
ics a
nd A
stro
nom
y
Elec
trica
l and
Elect
ronics
Eng
inee
ring
Tech
nology
Gener
al M
athe
mat
ics
Info
rmat
ion
System
s
Applie
d Mat
hem
atics
, Ope
ratio
ns R
esea
rch,
and
Sta
tistic
s0
5
10
15
20
25
30
Majors Ranked Highest for Both Earnings and Growth, Bachelor's Occupations
GrowthEarnings
Note: Lower score means higher ranking.

But money isn’t everything!

Agricu
ltura
l scie
nces
Biolo
gica
l scie
nces
Busin
ess
Compu
ter s
cienc
e
Educ
atio
n
Engi
neer
ing
Health
pro
fess
ions
Human
ities
Mat
hem
atics
Phys
ical s
cienc
es
Socia
l scie
nces
82%
84%
86%
88%
90%
92%
94%
96%
98%
100%
Overall Satisfaction with Job
DissatisfiedSatisfied
Source: National Survey of College Graduates, 2003

Agric
ultu
ral s
cien
ces
Biolog
ical scien
ces
Busin
ess
Compu
ter s
cien
ce
Educ
ation
Engine
ering
Health
pro
fess
ions
Human
ities
Mat
hem
atics
Phys
ical scien
ces
Social scien
ces
0%
10%
20%
30%
40%
50%
60%
70%
39.5%
31.7%34.8%
59.1%
40.3%44.5%
58.1%
26.1% 28.1% 30.3%
20.2%
Percent Who Said Their Job is Closely Related to Their Major
Source: National Survey of College Graduates, 2003

Agricu
ltura
l scie
nces
Biolo
gica
l scie
nces
Busin
ess
Compu
ter s
cienc
e
Educ
atio
n
Engi
neer
ing
Health
pro
fess
ions
Human
ities
Mat
hem
atics
Phys
ical s
cienc
es
Socia
l scie
nces
0%
10%
20%
30%
40%
50%
60%
70%
80%
90%
100%
Reason Not Working in Field of Major
Pay, promotion opportunities
Working conditions (hours, equipment , environment)
Job location
Change in career or pro-fessional interests
Family-related reasons
Not available
Other reason
Source: National Survey of College Graduates, 2003

Agr
icultu
ral s
cien
ces
Biologica
l scien
ces
Bus
ines
s
Com
pute
r scien
ce
Edu
catio
n
Eng
inee
ring
Hea
lth p
rofe
ssions
Hum
aniti
es
Mat
hem
atics
Phy
sical scien
ces
Soc
ial s
cien
ces
0%
2%
4%
6%
8%
10%
12%
14%
16%
18%
20%
7.3%8.1% 7.4%
5.2%
10.9%
4.4%
18.5%
11.6%
8.7%
6.3%
9.9%
Percentage Who Work Part-Time
Source: National Survey of College Graduates, 2003

Agr
icultu
ral s
cien
ces
Biologica
l scien
ces
Bus
ines
s
Com
pute
r scien
ce
Edu
catio
n
Eng
inee
ring
Hea
lth p
rofe
ssions
Hum
aniti
es
Mat
hem
atics
Phy
sical scien
ces
Soc
ial s
cien
ces
0
10
20
30
40
50
60
45.343.3 43.9 44.3
40.944.9
39.8 40.2 41.243.3 41.6
49 49.8 50.3 50.346.5
50.7 50 49.1 50.2 50.1 48.5
Average Work Schedule: Hours per Week and Weeks per Year
Average Hours per Week Average Weeks per Year
Source: National Survey of College Graduates, 2003

Agricu
ltura
l scie
nces
Biolo
gica
l scie
nces
Busin
ess
Compu
ter s
cienc
e
Educ
atio
n
Engi
neer
ing
Health
pro
fess
ions
Human
ities
Mat
hem
atics
Phys
ical s
cienc
es
Socia
l scie
nces
0%
10%
20%
30%
40%
50%
60%
70%
80%
90%
100%
Employer's Sector of the Economy
Education
For-profit
Not-for-profit
Self-employed
Government/military
Other
Source: National Survey of College Graduates, 2003

If you’re not satisfied with your career, it doesn’t matter how much money you earn.
If you’re not satisfied with your major, it doesn’t matter what career it prepares for.
Nonmonetary needs your major should satisfy:◦ Your interests◦ Your aptitudes◦ Your skills◦ Your personality type
“He who is contented is rich.” –Lao Tzu

Contact informationLaurence Shatkin
• E-mail: [email protected]• Web: www.shatkin.com• Twitter: @LaurenceShatkin• Blog: www.careerlaboratory.blogspot.com• Facebook: Laurence Shatkin, Career Information Author