laura dresser joel rogers - cows - home · · 2012-07-11laura dresser joel rogers ... the median...
TRANSCRIPT

The State of
Working Wisconsin
Laura DresserJoel Rogers
Center on Wisconsin Strategy
8116 Social Science, University of Wisconsin-Madison, Madison, WI 53706-1393TEL 608-263-3889 FAX 608-262-9046 INTERNET http://www.cows.org/

The Center on Wisconsin Strategy (COWS)
The Center on Wisconsin Strategy (COWS), based at the University of Wisconsin-Madison with a field office in Milwaukee, is a research and policy center dedicated toimproving economic performance and living standards in the State of Wisconsin. COWSconducts research on regional economic trends; generates ideas for alternative economicdevelopment; works with business, labor, and communities to implement those policies;and draws policy lessons from that experience for application. Uniting independentuniversity research with public purpose, COWS seeks to put the “Wisconsin Idea” intopractice.
Authors
Laura Dresser is a labor economist and the research director of COWS. She hascontributed to COWS labor market projects in Dane County and Milwaukee and was a co-author of the first two editions of the State of Working Wisconsin. She has publishedarticles on changing labor market opportunities of young black women, urban jobsstrategies, and women’s economic history. Her research and policy focus includes improvinglabor market opportunities for low-income women, regional labor market systems, andservice sector productivity.
Joel Rogers is the John D. MacArthur Professor of Law, Political Science, andSociology at the University of Wisconsin-Madison, and the founder and director of COWS.Rogers, author of the previous two editions of State of Working Wisconsin, has writtenwidely on American politics and public policy, political theory, and U.S. and comparativeindustrial relations. His most recent books are What Workers Want (Cornell, 1999), MetroFutures: Economic Solutions for the Cities and their Suburbs (Beacon, 1999) andAmerica’s Forgotten Majority: Why the White Working Class Still Matters (Basic, 2000). Acontributing editor of The Nation and Boston Review, a MacArthur Foundation Fellow, anda longtime social and political activist as well as academic, he was identified by Newsweekas one of the 100 Americans most likely to affect U.S. politics and culture in the 21st
century.
Acknowledgments
Our release of this report corresponds with the national release of The State ofWorking America, 2000–2001 by the Economic Policy Institute, a non-partisan researchinstitute in Washington, D.C. We thank EPI for their generous support of this project in theform of data and other technical assistance. We also thank the Ford Foundation and theUniversity of Wisconsin-Madison for their support.
Thanks also to Annette Bernhardt, Scott Mangum, and Matthew Zeidenberg forresearch and analysis.

Table of ContentsExecutive Summary.......................................................................... i
1. Growth, Unemployment, and the Workforce................................. 1Wisconsin’s Economic Growth ............................................................................. 2Wisconsin’s Industrial Base .................................................................................. 4Wisconsin Population and Workforce ................................................................... 5Counties in Wisconsin .......................................................................................... 8The Ingredients for a Lasting Labor Shortage ...................................................... 9
2. Income & Poverty ...................................................................... 11Rising Median Income for Four Person Families ................................................. 12The Time Crunch ............................................................................................... 14Poverty ............................................................................................................... 14Playing by the Rules, but Barely Getting By ........................................................ 16
3. Income Inequality and State Taxes ............................................ 19Growing Income Inequality in Wisconsin............................................................ 19Inequality of Wealth is Even More Extreme ........................................................ 21The State’s Tax Structure Exacerbates Income Inequality .................................. 22You Get What You Pay For................................................................................... 24
4. Wages in Wisconsin ................................................................... 25Trends in Wisconsin Wages ................................................................................ 25The Gender Gap in Wages .................................................................................. 28The Race Gap..................................................................................................... 31The Education Gap ............................................................................................ 32Wages, Industries, and Unions ........................................................................... 33
5. Poverty-Wage Jobs ..................................................................... 37The Growth in Poverty-Wage Jobs ...................................................................... 37What Makes for Bad Job Quality? ...................................................................... 40The Geography of Poverty Wages ........................................................................ 44
6. Toward a Policy Agenda for Working Wisconsin ......................... 47Building the High Road in Wisconsin ................................................................. 49Improve Job Quality in the State ........................................................................ 49Support Working Families .................................................................................. 51Reduce Racial Disparity by Focusing on Education and Training ....................... 53Rebuild Our Metro Areas and Discourage Statewide Sprawl .............................. 53

Data Sources & Methodology ......................................................... 55Current Population Survey & Decennial Census................................................. 55Real Median Wages............................................................................................. 56
Table & Figure Notes ..................................................................... 57Frequently Cited Sources ................................................................................... 57Table Notes ........................................................................................................ 57Figure Notes ....................................................................................................... 59
County Data .................................................................................. 61

The economic expansion that began in 1991 has turned out to be longer and strongerthan any other in American history. Over the last five years, economic growth anddeclining unemployment rates have started to bear fruit for working families’
incomes. Even so, the typical American family is working more hours, wage inequalityremains high, poverty has stagnated rather than fallen, and poor job quality is still a seriousAmerican problem.
Where do Wisconsin workers and families stand in this picture? Are we doing betteror worse than the national average, better or worse than our own recent past? How equallyare we distributing the fruits of growth, and have things improved for our poorest workers?
The State of Working Wisconsin, 2000 is our attempt to answer these questions withthe best and most recent information available. Drawing on a wide variety of data we findthat median family income and median wages are up and growing in the 1990s. Still, thereis cause for concern: our families are working longer hours, income inequality here is on therise, and many of Wisconsin’s workers remain stuck in low-wage jobs.
These findings are summarized here and detailed in the full report. First, a wordabout “income” and “wages.” Income means all sources of money — wages, salaries,interest, dividends, and cash entitlements — available to a family. The median family isexactly at the middle of the income distribution: half of families have higher income, andhalf have lower. Wages refer to the hourly earnings of an individual’s primary job. Wages,therefore, measure how individual workers are faring, and more importantly, the quality ofthe jobs they hold.
Executive Summary
i

State of Working Wisconsin
Key Findings
The median family income in Wisconsin is up and has recently beengrowing at almost double the national rate.
For the nation as a whole, the annual growth rate of family income in the 1990s was0.5 percent. But Wisconsin nearly doubled that rate, with incomes growing by 0.9 percenteach year. This is clearly good news, news that is shared with the rest of the region.
Nevertheless, it is worth remembering that annual income growth of greater than 2percent was the norm in the first 30 years of the post-war period. So the performance of thelate-1990s is very good by recent standards, but compared to what many working familiesgrew up expecting, even these improved rates of growth are sluggish.
Moreover, the hours that American families work are at an all-time high. The medianAmerican family with two children has the equivalent of 1.73 full-time workers, committing3,600 hours to the labor force per year; we know that the work ethic in Wisconsin is evenstronger.
ii
������������� ��� ��� ���������������������������������� ����������������
������������
������������ ������� ���� ���� ������� �������
���� ��� � � ���� ������ ���� ����
��������� ����� � � � ������ �� ����������� � ���� ������ ������ ��� ���������� ������ ������ ������ ��� ������� ������ ������ � �� � ��� ������ �!�� � ���� ������ ������ ��� �������"��#� � ���� ������ ������ ��� ���
�������� �������������������������

Executive Summary
��������� � ���!����������������������������������
��������������������������������������������� ������������
iii
Overall, median wages are moving upward, but are down from 1979 forwhite men, African-Americans, and full-time workers.
Median wages have increased every year since 1995 and are now back at their levelsof a decade ago. Even so, the median wage in Wisconsin remains nearly 5 percent below thelevel of 1979 — despite all the improvements in workforce education and productivity sincethat time. Trends are more sobering when viewed by race and gender groups, with blacksand white men in the state substantially below their 1979 wages.
The wage status of full-time workers is of particular interest, because they are morelikely to be family “breadwinners.” Wages for this group went up only $0.20 per hour from1989–99: a two-cent increase each year for the decade. This slight gain still leavesWisconsin’s breadwinners fully 9.4 percent below their median wage in 1979. Disturbingly— and paradoxically — those working the most in our economy are gaining the least from it.
��������� � ���!��� �"������������#����� $� �������������������������������
����������������� ������������������ ���� ���� ������� �������
$%���&�'"��()"(� � ��� ��� � ����� ����� ����*����()"(� ���� ����� ����� ���� ���
����������������������������������
6.00
8.00
14.00
10.00
12.00
16.00
$18.00
19
99
do
lla
rs $13.51
$10.98
$10.27$ 9.96
1979 1991 19991983 1987 1995
White Men
White Women
Black Women
Black Men
State of Working Wisconsin
�� ��������������� $� �������!��%� � ���!��&'�����������!"������������#���$%��&������������
����������������������������������
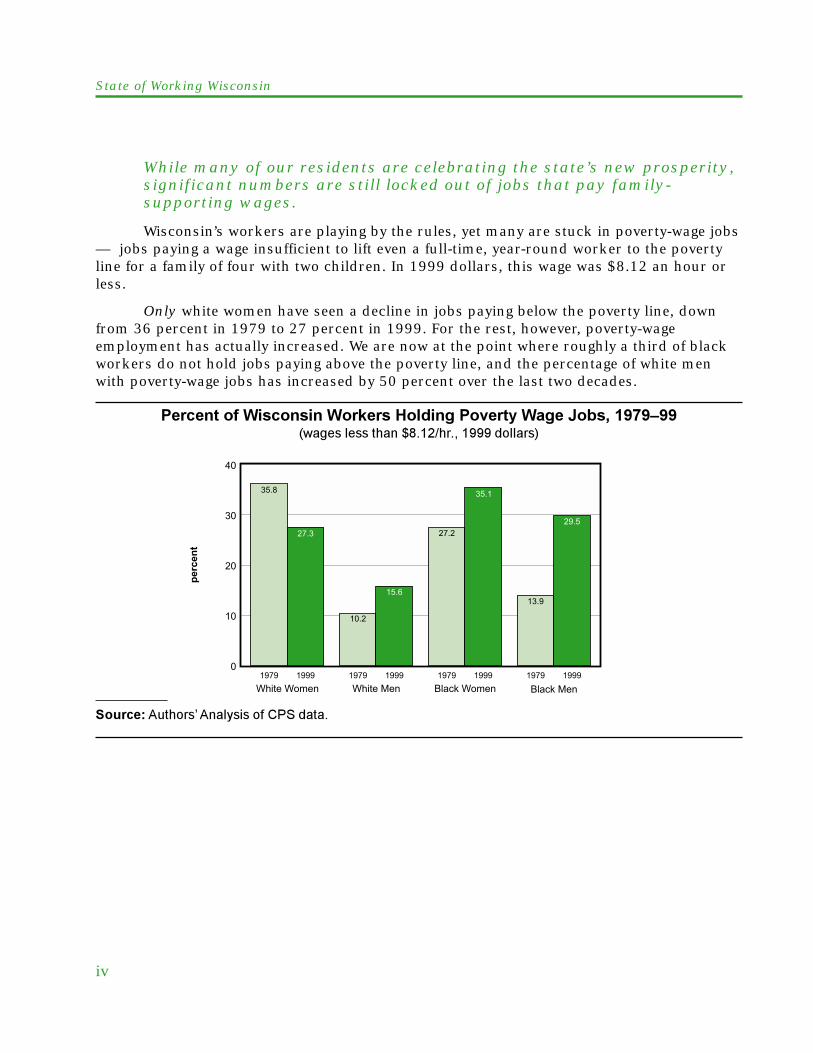
While many of our residents are celebrating the state’s new prosperity,significant numbers are still locked out of jobs that pay family-supporting wages.
Wisconsin’s workers are playing by the rules, yet many are stuck in poverty-wage jobs— jobs paying a wage insufficient to lift even a full-time, year-round worker to the povertyline for a family of four with two children. In 1999 dollars, this wage was $8.12 an hour orless.
Only white women have seen a decline in jobs paying below the poverty line, downfrom 36 percent in 1979 to 27 percent in 1999. For the rest, however, poverty-wageemployment has actually increased. We are now at the point where roughly a third of blackworkers do not hold jobs paying above the poverty line, and the percentage of white menwith poverty-wage jobs has increased by 50 percent over the last two decades.
iv
0
10
20
30
40
perc
en
t
1979 1999 1979 1999 1979 1999 1979 1999
Black MenWhite Men Black Women
35.8
27.3 27.2
35.1
13.9
29.5
10.2
15.6
White Women

Executive Summary
#(���� ����������)*�+� ���!��,%� �#��������������
���������������������������'��������������������(�����&����)*�+�
… belowthe poverty line
31.8%
Moved above the poverty line 46.5%
Still below the poverty line 53.5
… abovethe poverty line
68.2%
Still above the poverty line 89.0%
Moved below the poverty line 11.0Moved below the poverty line 11.0
Where didthey end up in 1997?
In 1990, percent of workerswho had quarterly earnings...
Job quality is a problem in Wisconsin for a number of reasons, including:
� the growth of low-wage service industries;� the large number of entry-level, non-unionized jobs;� lack of access to full-time work; and� the fact that low-wage jobs often “trap” workers.
On this final point, low-wage jobs not only pay very little, but over the long run, theyoften lead to low-wage careers, even in the prosperous ‘90s. In 1990, almost a third (31.8percent) of Wisconsin workers had quarterly earnings that fell below the poverty line. Eightyears later, more than half of those (53.5 percent) still had earnings below the poverty line.By contrast, of the workers who in 1990 held a higher paying job, the vast majority (89percent) still did in 1997.
v

State of Working Wisconsin
�����-(��!��� �������������������)�������.����)�������.������������"��
��������������"����&� �����������������������������������������,��"���������������������&�$)))�
vi
The strong Wisconsin economy masks growing inequality.
From the late 1970s to the late 1990s, the average real income of Wisconsin familiesin the bottom fifth of earnings fell 3 percent, to $17,324. By contrast, families in the topquintile saw their average income rise over 30 percent, to $141,588. In the middle of theincome distribution, the median family fared better than the bottom, but not as well as thetop.
-10
0
10
20
30
40
perc
en
t
PoorestFifth
SecondFifth
MiddleFifth
FourthFifth
RichestFifth
-3
3
810
30

Executive Summary
Building a High Road EconomyPreserving Wisconsin’s traditions, and extending and sustaining our economic
prosperity, requires an agenda to improve the quality of jobs, support working families,reduce racial disparity, and strengthen our cities.
Improve Job Quality
� Increase the state’s minimum wage and index it for inflation� Support and expand unionization by improving opportunities for collective
bargaining� Improve and expand workforce development and training initiatives� Improve accountability in state and local economic development programs
through mandatory scoring and reporting criteria� Encourage and increase employee ownership through regional investment funds,
stock ownership plans, and worker cooperatives
Support Working Families
� Adjust the federal Earned Income Tax Credit (EITC) so it phases out more slowly(as income increases), and expand the credit for married two-earner couples
� Expand access to state child care assistance and support initiatives to improvethe quality of jobs for child care workers
� Extend health insurance coverage by improving Badger Care enrollment andeligibility
� Reform Wisconsin’s tax system to make it more progressive
Reduce Racial Disparity by Focusing on Education and Training
� Reform the current system of funding primary education and modify revenuecaps to ensure educational attainment is based on ability rather than zip code
� Prepare non-college bound high school students for the transition from schoolto work
Rebuild Metro Areas and Discourage Statewide Sprawl
� Encourage regional policies that capture natural linkages in our metro areas andpromote regional equity
� Promote cooperative urban redevelopment strategies that create familysupporting jobs and return economic opportunity lost to suburban sprawl
� Use the state’s recently enacted Comprehensive Planning law to control growthand reduce costly, inefficient development
� Improve our use of federal transportation enhancement funds
Pursuing such a course would bring great benefit to the state, but perhaps the mostimportant result of this report will be increasing civic dialogue about the state of workingWisconsin. Only when we all know the facts can we get to work solving the problems.
vii

State of Working Wisconsin

1. Growth, Unemployment,and the Workforce
Across the nation, working families were disappointed by the early years of the1990s economic expansion. Their incomes and wages stagnated and poverty ratesincreased, despite low unemployment. The period was one of worker insecurity,
downsizing, and low productivity growth. The press reported widely on the “joblessrecovery,” as families found themselves stressed, fearful of job loss, and working more hourssimply to tread water.
But the expansion that began in 1991 has turned out to be longer and stronger thanany other in American history. Over the last five years, economic growth and ever decliningunemployment rates have begun to bear fruit: wages are up, especially at the bottom of thelabor market; new workers are being drawn into the labor force; and workers are movingfrom substandard, irregular jobs to more permanent and more regular jobs. Thisturnaround from the widespread wage declines of the 1980s and early 1990s is long-awaitedgood news for working Americans.
Even so, the typical American family is working more hours, is taking on historichousehold debt burdens, and often fails to receive adequate health care and pensioncoverage. And some long-term problems cannot be reversed by such a brief period. Wageinequality remains high, poverty has stagnated rather than fallen, and poor job quality,especially as measured by the share of workers with very low-wage jobs, is still a substantialAmerican problem.
These national trends are documented and described in The State of WorkingAmerica 2000-2001, by economists Lawrence Mishel, Jared Bernstein, and John Schmitt,which is the latest edition of a report that the Economic Policy Institute in Washington, DC,produces every two years.
Where do Wisconsin workers and families stand in this picture? Is the long economicexpansion also paying off here in the Badger State? Are we doing better or worse than thenational average, better or worse than our own recent past? What are the trends in wagesand income in our state? How equally are we distributing the fruits of growth, and havethings improved for our poorest workers?
The State of Working Wisconsin, 2000 is our attempt to answer these questions withthe best and most recent data available. Drawing on a wide variety of data on family incomes,taxes, wages, unemployment, and poverty, it examines the impact of today’s economy onWisconsin workers and families.

2
State of Working Wisconsin
This is our third edition of The State of Working Wisconsin, first issued in 1996 andagain in 1998. In the past, we showed that many of the most distressing national trends inworkers’ economic well-being were also evident in Wisconsin. Indeed, we found that in manyways Wisconsin workers had been more badly hit than workers nationally.
In this edition of The State of Working Wisconsin — which relies on data through1999 — we are happy to report some better news. The last five years of expansion havepositively affected earnings; in some areas Wisconsin is a national leader in their rebound.Even so, challenges remain, especially in terms of economic inequality and job quality in thestate.
In succeeding chapters, we will examine income, wage, and job trends in muchgreater detail. By way of introduction and background to that discussion, however, we usethe rest of this chapter to offer an overview of the Wisconsin economy, sketching theindustrial structure of the state and its performance on a variety of conventional measures ofeconomic strength. We begin with familiar measures — per capita income, unemployment,industrial distribution, and workforce demographics. In the succeeding chapters we moverapidly onto other measures of the well-being of working families in the state, includingfamily income, poverty, and inequality (Chapters 2 and 3). After that, we look at the source ofthese broader trends in income and poverty: trends in wage rates at work and the quality ofjobs in the state (Chapters 4 and 5). We close with some suggestions for policies that canhelp improve the lot of working families in Wisconsin.
In some cases it is useful to compare Wisconsin’s experience to national trends, andwe do so throughout the report. At times it is also useful to consider Wisconsin’sperformance compared to a handful of peer states; for these purposes, we show data fromneighboring states — Illinois, Indiana, Iowa, Michigan, and Minnesota — in order to helpilluminate regional trends and instances where Wisconsin stands out from the trends.
Wisconsin’s Economic GrowthFigures 1.1 and 1.2 summarize the now familiar strengths of Wisconsin’s economy:
relatively strong economic growth (shown by per capita income growth) and a relatively tightlabor market (shown by low unemployment rates). Strong growth and low unemploymenthave dominated the state’s economic news over the last decade.
Wisconsin’s economy has grown at above average rates in recent years. For states, themost up-to-date growth figures are provided by growth in per capita personal income, whichcorrelates closely with the more conventional measure of “product” — or the value of goodsand services produced. Figure 1.1 displays such income figures for Wisconsin and the U.S.since 1969. What it shows is that our economy, and that of the U.S., has grown by more than60 percent over the past 30 years; that Wisconsin remains a bit below the U.S. average in percapita income; that we fell behind during the early 1980s recession; and that in recent yearsour per capita income has grown faster, helping to close the gap that the 1980s produced.
These strong income growth figures over the past several years, in turn, are matchedby strong growth in the number of jobs and low unemployment rates. As Figure 1.2 shows,Wisconsin unemployment rates have historically been below national rates (again with theexception of a few “rust belt” years in the early 1980s). In recent years, however, the gap has

3
Growth, Unemployment, and the Workforce
��������
������������� ����� ����������������
���������������������� ��� ���������
���������
������ ��������� ����� ������������������������������ ������������� ���
���������������������� ��� ���������
15,000
17,000
27,000
25,000
23,000
19,000
21,000
29,000
$31,000
19
99
do
lla
rs
Wisconsin
$27,412
$28,518
1969 1989 19991974 19841979 1994
U.S.
been more substantial than in the past. In 1999, Wisconsin’s unemployment rate was 12th
lowest in the nation, at 3.1 percent, and almost 30 percent below the national rate of 4.2percent.
Like Wisconsin, the entire Midwest region has posted relatively low unemploymentrates in recent years. This is a substantial and welcome turnaround from the 1980s whenthe region was saddled with high unemployment. While Wisconsin’s 3.1 percent rate is ahistoric low for the state, Minnesota, Indiana, and Iowa all have unemployment below 3.1percent. The region’s more heavily industrialized and urbanized states — Illinois and
0
2
8
4
6
10
12
perc
en
t
Wisconsin
U.S.
1979 1991 19991983 1987 1995
3.1
4.2

4
State of Working Wisconsin
Michigan — still post higher unemployment rates than Wisconsin, but their unemploymenthas declined most substantially during the decade.
Low unemployment rates are related to the region’s strong employment growth in the1990s. While only the Northeast posted strong job gains in the 1980s, in the 1990s, jobsgrew rapidly in the Midwest, especially in manufacturing in the early part of the decade andservices throughout the decade. Table 1.1 shows that only Minnesota and Iowa haveexceeded Wisconsin’s job growth in the 1990s. From 1989 to 1999, Wisconsin added morethan half a million new jobs for growth in total employment of nearly 23 percent over thedecade.
Economic growth and unemployment rates are key indicators of economic well-beingand they receive quite a bit of attention. But as a summary of the entire economy, they aresimply too crude. Net economic growth tells us nothing about how the benefits of growth arebeing distributed. Low unemployment tells us nothing of the quality of jobs that people hold.The rest of this report is devoted to drawing a broader, and more complete, picture of thestandard of living of Wisconsin families and how it has changed over the last years.
Wisconsin’s Industrial BaseWisconsin’s workforce numbers about 3 million. Table 1.2 shows the 1998
distribution of employment, by sector, of the 2.6 million workers covered by unemploymentinsurance. It shows, as is the case nationally, that our economy is dominated by services ofdifferent kinds, and maintains a very large manufacturing sector. In fact, nearly one-in-fourworkers hold jobs in the state’s service sector, and nearly one-in-four also hold jobs inmanufacturing. The rest of the state’s workforce — just over half — is spread across diversesectors, with a substantial share working in retail trade and government (which followmanufacturing and services as key sectors for employment).
Manufacturing provides the largest base of well-paid jobs in the state, offeringearnings of $700 per week, or about $36,400 per year on the average. This is substantiallyabove the state average of $591 per week. Other high wage sectors include wholesale trade
�� �����
������������������������������ ������ ���������������������
��������� ����� ��������� ���� ���� ���� ������� ������� �������
��������� �� ���� ��� ���� ���� ������ ����
�������� ������������ ������������ ����������� ������������ ��� �� ���������� ������������ ���������� ����������� ����������� ��� ��� ������� �������������� ����������� ����������� ������������ �� �� ����� ���� ������������ ������������ ���������� ����� ��� �� ����������!� ����� ����� ���� ���� ��� ��� ��
��������� ��� ���� ������������

5
Growth, Unemployment, and the Workforce
($701 per week), mining ($747), construction ($679), and finance, insurance and real estate($698). On average, service jobs pay substantially less than these sectors, $477 a week(about $25,000 a year), and at $275 per week, retail trade offers the lowest average weeklywage of the state’s industries. It is worth noting that average weekly wages are low in theservice and retail sectors due to the preponderance of part-time work in those sectors, inaddition to the low wages they tend to offer. Subsequent chapters on wages and the quality ofjobs in the state will go into these issues in greater detail.
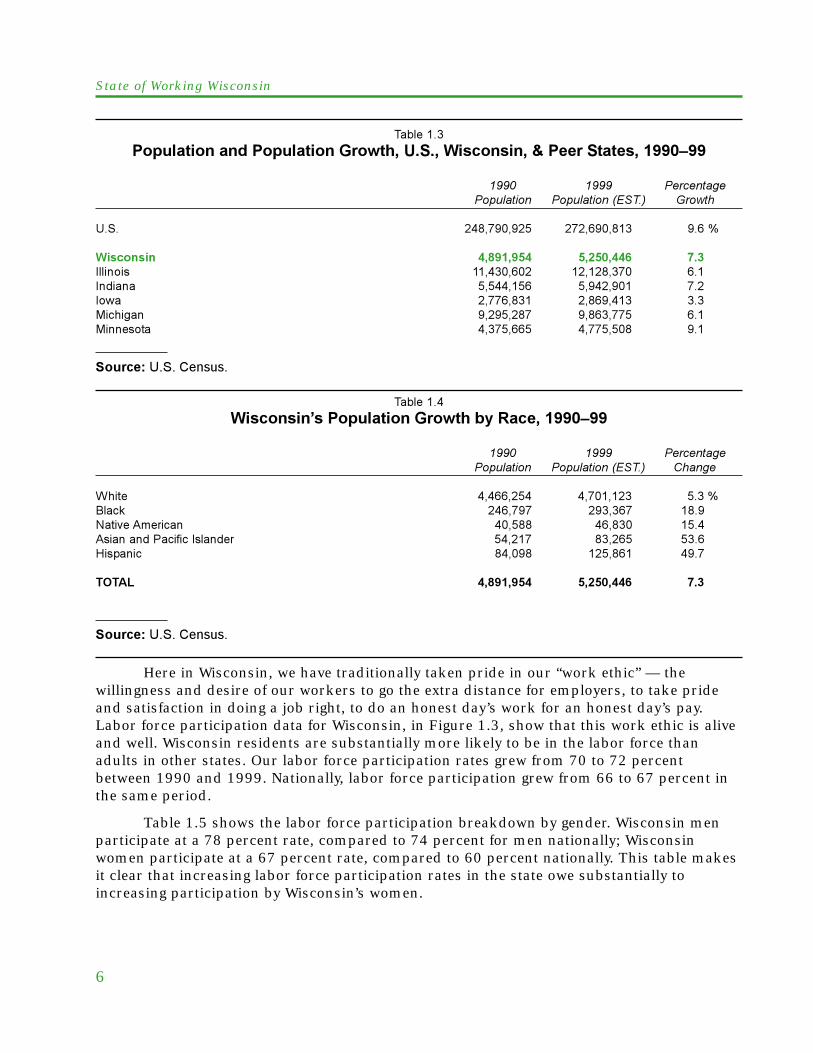
Wisconsin Population and WorkforceWith 5.25 million residents, Wisconsin has posted strong population growth over the
last decade. As shown in Table 1.3, from 1990 to 1999, the state grew 7.3 percent, addingmore than 358,000 residents. Though that is substantial growth, Wisconsin’s populationincrease was still exceeded by the national rate of 9.6 percent over the same period. Ingeneral, growth in the Midwest has lagged behind that of states in the South and West, whichare attracting a greater share of immigrants. However, among peer states, Wisconsin’spopulation growth from 1990-99 leads all except Minnesota.
As shown by Table 1.4, while Wisconsin remains overwhelmingly white in racialcomposition — 90 percent here, as against 82 percent nationally — minority populations aregrowing most rapidly. While 2000 Census data on the racial and ethnic makeup of the stateare not yet available, the 1999 estimates in Table 1.4 imply a growing economic (as well associal) need to pay attention to diversity in our communities and workplaces.
�� ����
� ����� �������������� �������!"�#����$����#� �������#��%��"�������&�������� ������ �������������������� �!�"##$�������
������� ��������� ������ ���� ������������
"������!����������!�#����� ��� ����� $������ ��������� ��� ����� ���%���!���!��� ������� ���� ����������&��!����� ����������������� ����� ����������'��!�!�����%�((�����!���������)� ����*!���!��� ����� ����� ���+ ������������� ������ ����� �����,�!��������� ������� ���� ������������������������-�,����.�!�!��/��,.0 ������ ����� ������1��2���� ������� ����� ������3�2���(��! ������� ����� ����
����� ������� �� ��� ������
��������%�� �����&�����������%���� ��&����������
6
State of Working Wisconsin
Here in Wisconsin, we have traditionally taken pride in our “work ethic” — thewillingness and desire of our workers to go the extra distance for employers, to take prideand satisfaction in doing a job right, to do an honest day’s work for an honest day’s pay.Labor force participation data for Wisconsin, in Figure 1.3, show that this work ethic is aliveand well. Wisconsin residents are substantially more likely to be in the labor force thanadults in other states. Our labor force participation rates grew from 70 to 72 percentbetween 1990 and 1999. Nationally, labor force participation grew from 66 to 67 percent inthe same period.
Table 1.5 shows the labor force participation breakdown by gender. Wisconsin menparticipate at a 78 percent rate, compared to 74 percent for men nationally; Wisconsinwomen participate at a 67 percent rate, compared to 60 percent nationally. This table makesit clear that increasing labor force participation rates in the state owe substantially toincreasing participation by Wisconsin’s women.
�� �����
'��"�� �������'��"�� ��������������� ����� ����'������������(���
��� ���� ���������������� �������� !�"#$% �����
*1 ��������� ��������� ���4
��������� �������� � ���� ����������� ��������� �������� ��������� ��������� �������� ����� �������� �������� ����� ���� ������� ��������� ���������!� ��������� ��������� ��
�������������'������
�� �����
� ����� �)��'��"�� ���������#��*�������(���
��� ���� ���������������� �������� !�"#$% &�����
+ �!� ��������������� ��������������� ���45���6 ���������������� ���������������� ���7�!�2��"(������ ������������������ ������������������ ���"���������)���&����������� ����������������� ����������������� ���8��'���� ������������������ ���������������� ���
����� ��������������� �������� ���� ���
�������������'������

7
Growth, Unemployment, and the Workforce
����������
+�#���,�����'�� � �� ���� ����� ������������(�������
��������������(��������!�'����)��*��
In addition to their work ethic, Wisconsin workers are distinguished by above-averageeducational attainment. Wisconsin is a national leader for its high school graduation rate,and at the upper reaches of education, the Wisconsin Technical College System (WTCS) andthe University of Wisconsin are both considered national leaders in post-secondaryinstitutions. And WTCS and University Extension support unusually high levels of continuingeducation among adults. WTCS alone, for example, serves more than 430,000 Wisconsinadults annually — one-in-nine adults.
�� �����
+�#���,�����'�� � �� ���� ����� ������������(���
'�� ����� (����������� )$"$ ��������� )$"$ ��������� )$"$
���� ���4 ���4 ���4 ���4 ���4 ���4���� �� �� �� �� �� ������ �� �� �� �� �� ������ � �� �� �� �� ��
��������������(��������!�'����)��*��
63
67
65
69
71
73p
erc
en
tp
art
icip
ati
on
U.S.
1990
70
1999
72
1990
66
1999
67
Wisconsin
8
State of Working Wisconsin
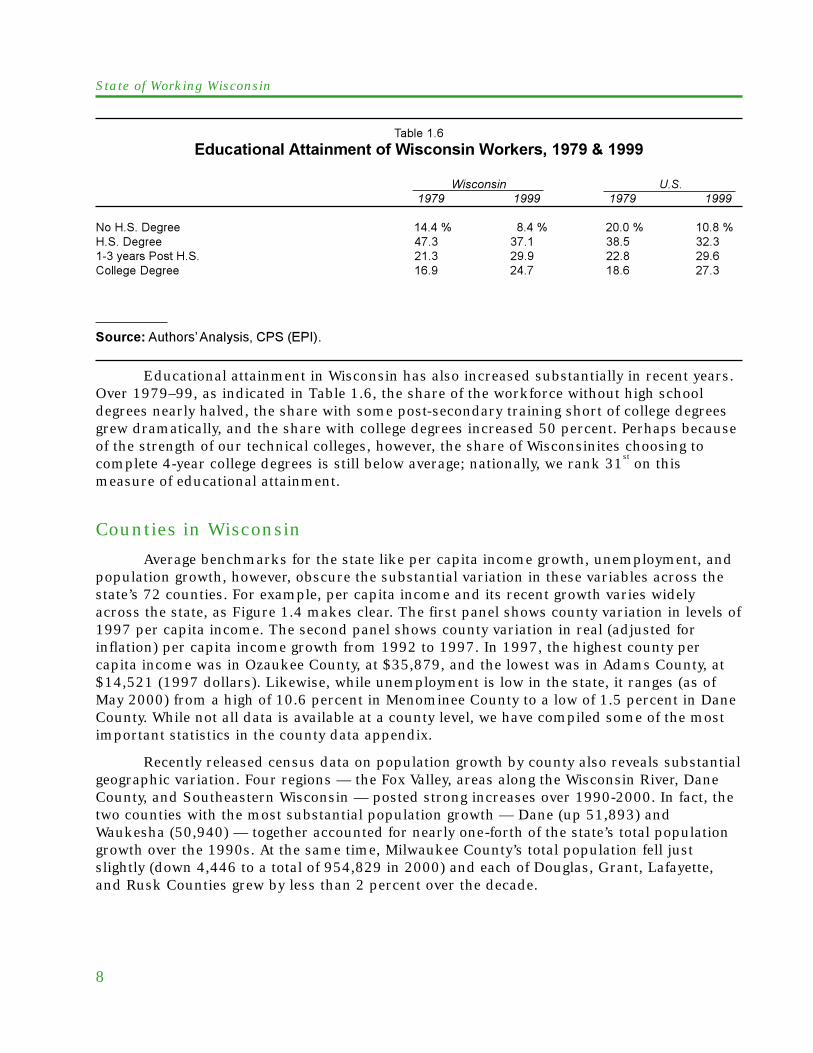
Educational attainment in Wisconsin has also increased substantially in recent years.Over 1979–99, as indicated in Table 1.6, the share of the workforce without high schooldegrees nearly halved, the share with some post-secondary training short of college degreesgrew dramatically, and the share with college degrees increased 50 percent. Perhaps becauseof the strength of our technical colleges, however, the share of Wisconsinites choosing tocomplete 4-year college degrees is still below average; nationally, we rank 31
st on this
measure of educational attainment.
Counties in WisconsinAverage benchmarks for the state like per capita income growth, unemployment, and
population growth, however, obscure the substantial variation in these variables across thestate’s 72 counties. For example, per capita income and its recent growth varies widelyacross the state, as Figure 1.4 makes clear. The first panel shows county variation in levels of1997 per capita income. The second panel shows county variation in real (adjusted forinflation) per capita income growth from 1992 to 1997. In 1997, the highest county percapita income was in Ozaukee County, at $35,879, and the lowest was in Adams County, at$14,521 (1997 dollars). Likewise, while unemployment is low in the state, it ranges (as ofMay 2000) from a high of 10.6 percent in Menominee County to a low of 1.5 percent in DaneCounty. While not all data is available at a county level, we have compiled some of the mostimportant statistics in the county data appendix.
Recently released census data on population growth by county also reveals substantialgeographic variation. Four regions — the Fox Valley, areas along the Wisconsin River, DaneCounty, and Southeastern Wisconsin — posted strong increases over 1990-2000. In fact, thetwo counties with the most substantial population growth — Dane (up 51,893) andWaukesha (50,940) — together accounted for nearly one-forth of the state’s total populationgrowth over the 1990s. At the same time, Milwaukee County’s total population fell justslightly (down 4,446 to a total of 954,829 in 2000) and each of Douglas, Grant, Lafayette,and Rusk Counties grew by less than 2 percent over the decade.
�� �����
��"�� �����-� ������$�� ����� �����.���������������
��������� )$"���� ���� ���� ����
7��81�9����� ����4 ���4 ���4 ����481�9����� ��� ��� ��� ���:��#�����)��!�81 �� �� � ��%�������9����� ��� �� ��� ��
��������������(��������!�'���������

9
Growth, Unemployment, and the Workforce
���������
/�"���0�� � ��� ��� ����� �)��'���/�� ��%�����
��������%�� �����&�����������*�������
The Ingredients for a Lasting Labor ShortageThis review of basics shows that Wisconsin has all the ingredients for a lasting labor
shortage: relatively slow population growth, already high labor force participation rates, andlow unemployment. The state’s labor shortage has much to do with demographics; in thefuture the shortage will likely grow as more people retire out of the labor force than arereplenished by new generations of workers. For example, in 1980 nearly 94,000 Wisconsinresidents turned 18; demographers project that only 78,000 Wisconsin residents will turn 18each year over the next ten years, and starting in 2010, only 67,000 people will reach 18each year. Over that same period, the number of Wisconsin residents reaching retirement agewill grow. Thus the demographic and economic evidence suggest that this labor shortage willbe with us for at least two decades and will be more severe, especially starting a decade fromnow.
The state’s long-term labor shortage will be substantial and will require multiplestrategies to craft a solution. We won’t be able to solve our labor shortage simply byattracting new labor force entrants — with one of the highest participation rates in thenation, there are few groups left to attract into the labor force. Nor will we be able to solve itby simply convincing older workers to stay in the labor force longer, though that may help abit. Drawing new immigrants from other states and nations will also be insufficient, in partbecause many other Midwestern states face a similar problem and will pursue a similarstrategy. Marketing alone will not be enough.
Among these strategies, we must prioritize workforce development. The state mustfind ways to increase the productivity of incumbent workers, especially younger ones, andthus develop a skill base to replace the growing cohort that will soon retire. The laborshortage challenges us to find new ways to increase the skills and opportunities of stateresidents and to build future economic growth on increasing productivity.
$16,942
35,87924,831
18,348-
-
--
-20,723
$14,521
24,83120,723
16,94218,348 -
-
--
--7.3% 0%
11.5 16.38.7 11.5
0 5.35.3 8.7
Per Capita Personal Income,by County, 1997
(1997 dollars)
Change in Per Capita PersonalIncome, by County, 1992-97

State of Working Wisconsin

2. Income & Poverty
The first chapter gave us a broad understanding of the Wisconsin economy, but it didnot provide much insight into how families are actually doing in the state. Why?Because it only offered aggregate data, rather than a detailed look at what is
happening to families in the middle of the income distribution. Similarly, we have not yetanswered the critical question of whether families at the bottom of the income distributionare doing any better than in the past.
“Income” as used here simply means all sources of money — principally wages, butalso salaries, rents, interest, dividends, and cash entitlements — available to an individual orgroup. “Family” denotes a household of two or more related persons living together. Sodefined, some 70 percent of Wisconsinites live in families. Median family income for fourperson families is a key benchmark for the standard of living for Wisconsin working families.The “median” family is exactly at the middle of the income distribution, half of families havehigher income, and half have lower. Obviously, using the median (rather than the average)helps control for those with very high income who move averages up. We choose to focus onfamilies of four because these are generally families with children at home, who account forthe majority of income in the labor market.
“Poverty” is a bit more complicated. We use the most common national definition ofpoverty — the so-called “poverty line” — which had its origins in a “back of the envelope”calculation made by a Department of Agriculture economist in the 1950s. At the time, theaverage family spent about a third of its income on food. The economist calculated the costof minimum diet she considered “fit only for temporary or emergency use,” multiplied it bythree, and suggested that any individual or family (adjusting for more members) with incomebelow that level should certainly be considered “poor.” In the 1960s, the Social SecurityAdministration began to publish poverty statistics based upon this “poverty line,” correctedfor inflation. Ever since, families have been defined as “poor” if their cash income beforetaxes does not exceed this subsistence threshold. The Census Bureau’s poverty thresholdsfor 1999 were: $8,667 for one individual under 65, $11,483 for a family of one parent andone child, $13,423 for a family of one parent and two children, and $16,895 for a family oftwo parents and two children.
This conventional definition of poverty has significant shortcomings. First, as anational definition, it is insensitive to regional differences in the cost of living. Second, theportion of family income absorbed by food expenditures has fallen to about a fifth, as therelative costs of necessities such as housing and health care have risen; if the logic of the old

12
State of Working Wisconsin
calculation were followed, the line should be considerably higher than it is. Third, aminimum diet “fit only for temporary or emergency use” hardly reflects the way peopleactually eat, and is by definition inadequate for long-term sustenance. A more nuanced,updated, and realistic definition of poverty would almost certainly classify many moreAmericans as “poor” than the conventional measure does. Still, because the federalgovernment has used this measure for 40 years, it provides a way of tracking the status ofvery-low income families and individuals over time. For all its flaws, we believe it provides auseful tool for examining those trends in Wisconsin.
Regarding data, at this writing reliable data on income, including family income, areavailable through 1998. And accurate estimation of income and poverty rates of specificpopulations at the state level generally requires merging multiple years of Current PopulationSurvey data. (This is so because income status questions are asked less frequently than wagequestions on the CPS, making sample sizes smaller.) In the report, merged years arereported as ranges, for example, “late-1990s.” Finally, for child poverty by race, it isnecessary to rely on even earlier data, provided by the 1990 Census.
Rising Median Income for Four Person FamiliesThe median family income in Wisconsin is up. This is good news, since during the
first part of the 1990s, incomes were still drifting downward. But the good news is temperedby two facts: family income has grown largely because of increases in the number of hoursworked; and by historical standards, Wisconsin’s income growth remains slow. Nevertheless,after years of sluggish growth, Wisconsin’s families are finally moving ahead.
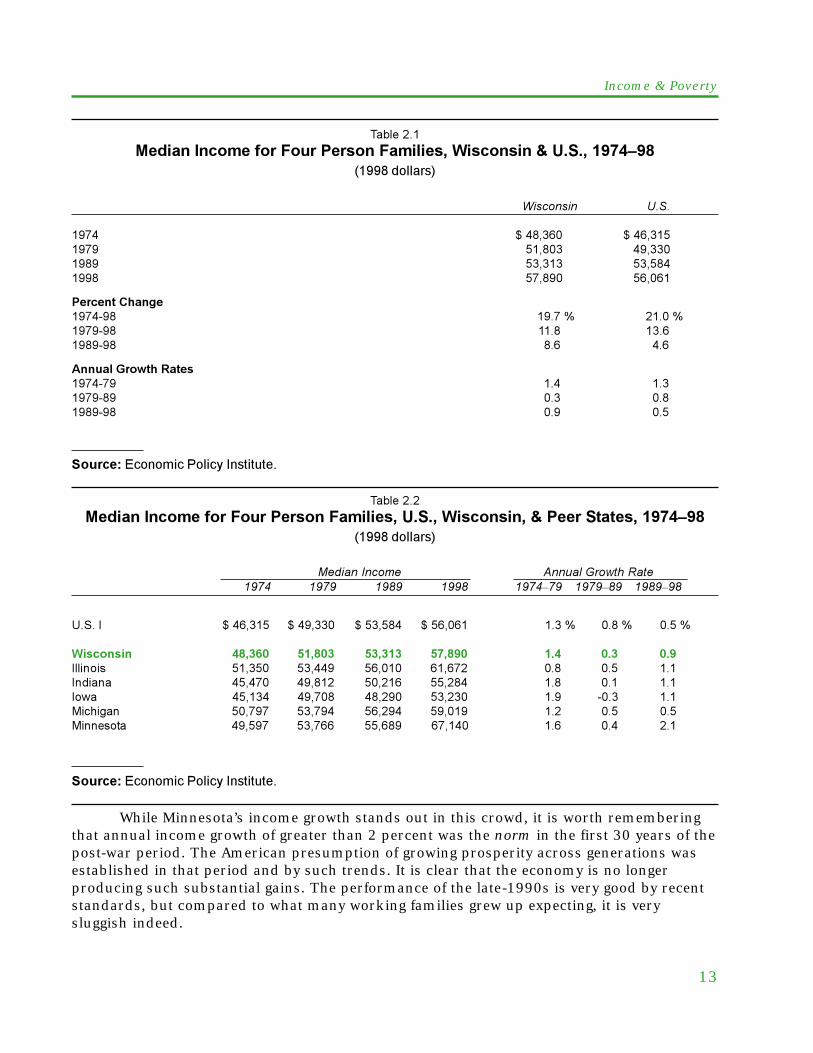
Table 2.1 presents Wisconsin and U.S. median income data for four person families,going back to 1974. It shows that, for four person families, total income in Wisconsin ispresently $57,890 per year, nearly 12 percent above its 1979 level ($51,803). Nationalincome grew nearly 14 percent over that same period, from $49,330 to $56,061. Perhapssurprising, national income growth was stronger in the 1980s than the 1990s. Wisconsinincome, by contrast, recovered from disappointing performance in the 1980s to move aheadmore rapidly in the 1990s.
Throughout the Midwest, incomes have risen for four person families; peer statesshow similar slow growth in the 1980s and surges in the 1990s. In fact, Table 2.2 makesclear that the entire Midwest declined in relative standing during the 1980s, posting annualgrowth rates well below the national rate of 0.8 percent per year. Iowa was hit hardest duringthat decade; family income actually declined there. Michigan and Illinois fared best in the1980s, with growth rates of 0.5 percent per year. Still, this was sluggish compared tonational rates.
By contrast, in the 1990s, these same states often posted growth rates that weredouble the national rate. The national annual growth rate of income in the 1990s was 0.5percent and Wisconsin nearly doubled that, with incomes growing by 0.9 percent each year.Illinois, Indiana, and Iowa all grew at 1.1 percent per year. Median income in Minnesotasurged forward at four times the national rate, growing 2.1 percent per year. Only Michiganmoved at the national growth rate over the last decade. The growth of Wisconsin’s medianincome is clearly good news; news that is shared with the rest of the region, and, in general,exceeded by it.
13
Income & Poverty
�� ����
��� ���%������$���,�"��'������,�� � ���� ����� ������������1��&�"##$�������
��������� )$"$
���� $������� $����������� ������ ���������� ������ ���������� ������ ������
���������� �!�����:�� ����4 ���4����:�� ��� �������:�� �� ��
���" #�$��%���& �������:�� �� ������:�� �� ������:�� �� ��
��������� ��� ���� ������������
While Minnesota’s income growth stands out in this crowd, it is worth rememberingthat annual income growth of greater than 2 percent was the norm in the first 30 years of thepost-war period. The American presumption of growing prosperity across generations wasestablished in that period and by such trends. It is clear that the economy is no longerproducing such substantial gains. The performance of the late-1990s is very good by recentstandards, but compared to what many working families grew up expecting, it is verysluggish indeed.
�� ���
��� ���%������$���,�"��'������,�� � ��������� ����� ����'������������1��&�"##$�������
(����� ������ '����� ����� *�����+ ���� ���� ���� ���+��� ������� �������
*1�� $������� $������� $������� $������� ���4 ���4 ���4
��������� ���������������� ��� � ����� ���� ��� �� ���������� ����������������� ������ ������ ����� �� �� ��������� ����������������� ����� ����� ����� �� �� ������ ����������������� ������ ����� ����� �� :�� ����� ���� ����������������� ������ ����� �������������� � �� ���������!� ����������������� ������ ��������������������� �� �� �
��������� ��� ���� ������������

14
State of Working Wisconsin
The Time Crunch: Substantial Family Work Effort Generates OnlyModest Income Gains
Currently, median family income in Wisconsin exceeds the national median income byonly 3 percent. Given that the state’s labor force participation so substantially exceeds thenational rate (see Table 1.5), this is insufficient payoff for greater work effort in the state.
Data constraints only allow work hours to be analyzed at a national level, but givenWisconsin’s labor force participation trends, we know that the national story very likelyunderestimates the state’s. To see how work hours have increased in recent years, let’s take amarried couple with two kids, a very typical member of the “four person family” populationexamined here. By 1999, we know that such families increased their average annual workeffort to 3,600 hours. That is up 5.3 percent from the 3,418 hours of work posted by suchfamilies in 1989 and fully 18 percent higher than the hours of work for those families in1979.
The hours that American families work are at an all-time high. Committing 3,600hours to the labor force, the median American family with two children has the equivalent of1.73 full-time workers. The commitment of Wisconsin families to the labor market is surelyhigher still. We are reaching a limit to the strategy of increasing hours of work in order tosecure a higher standard of living. At 3,600 hours of work and counting, how much more canfamilies commit to work and reasonably spend time with their kids? It is no surprise thatAmerican families, especially those with small children, feel caught in a time bind: needingtime with their kids as well as income from work, and increasingly forced to choose income.
PovertyWe now turn our attention to the people in the state who have the least income: the
poor. Compared to the rest of the nation, Wisconsin has historically had a lower than averagepercent of its population living below the poverty line, as Figure 2.1 makes clear. Thisremains the case today, with a state poverty rate of 8.8 percent — substantially below thenational rate of 12.7 percent. (The poverty rate is defined as the percent of individuals whosefamily income falls below the poverty line). Indeed, the latest data show Wisconsin as thestate with the second lowest poverty rate in the nation. Only Maryland performs better onthis benchmark. Still, the problem of poverty in Wisconsin is substantial and extreme forspecific groups, such as minority children. At present, more than 460,000 Wisconsinites livein poverty, up from less than 400,000 two decades ago. Notice also that poverty has hoveredconsistently around 9 percent even in the late 1990s, when family incomes at the medianadvanced.
In terms of poverty in the Midwest over the last decade, Wisconsin stands out for lowlevels of poverty, as Table 2.3 shows. Throughout the Midwest, poverty rates fall in the 9-11percent range, substantially below the national rate of 13 percent. But Wisconsin’s povertyrate is lower than any other peer state.
Wisconsin’s position relative to other Midwestern states changes when we consider thetrend in poverty over the decade. In fact, Wisconsin is the only state among this group thatactually posted an increase in poverty. While we remain the lowest in the region, our poverty

15
Income & Poverty
��������
'�2����*��� ��� ����� �����������&(��&
�������������'������
�� ����
'�2����*���������� ����� ����'�����������&&3&��������3�&���� �����������������������������
�������� ��� &���������,�� ����,�� ����,�� � ����,��
*1 ���4 ����4 ��
��������� ��� �� ���������� �� ��� :�������� ��� �� :����� �� �� :����� ���� �� ��� :��������!� ��� ��� :��
�������������'������
advantage on other states has fallen because of this trend. Such stagnation in our povertyrate suggests that there are some families that have been left behind by the economic boom.
Poverty varies substantially by age and sex. In a nutshell, children are much morelikely to be poor than adults, and adult women are much more likely to be poor than men.Good data on poverty for these groups are available only from the 1990 decennial Census(the 2000 data are not yet available). In 1990, Wisconsin children were one and a half timesmore likely to be poor than Wisconsin adults; women accounted for nearly two-thirds (60percent) of non-retirement age poor adults, and nearly three-quarters (74 percent) ofretirement age ones.
0
4
2
14
12
10
6
8
16
18p
erc
en
to
fp
op
ula
tio
nin
po
vert
y
Wisconsin 8.8
12.7
1980 1992 19981983 19891986 1995
U.S.

16
State of Working Wisconsin
It is not surprising that poverty also varies by race, with people of color much morelikely to be poor than members of the white majority. That said, it is always worth recallingthat whites are indeed a majority — even of the poverty population. The common stereotypeof poor people as minorities is simply false. In Wisconsin, nearly three quarters (72 percent)of the poverty population was white in 1990.
Combining minority status with a young age, however, is surely the most likelyguarantee of poverty. In Wisconsin, 9.9 percent of white children were poor in 1990 (againthe most recent reliable data). This is distressing enough, but it is nothing compared to childpoverty rates of 33 percent among Hispanics, 46 percent among Native Americans, 49 amongAsians, and 56 percent among blacks in Wisconsin. While in the nation, too, minoritychildren have much higher rates of poverty than white children, the race differences inWisconsin are among the highest in the nation. Our white child poverty rate, for example,was fifteenth lowest in the nation in 1990, while our black child poverty rate was secondhighest, exceeded only by Louisiana. Here in Wisconsin, black children were more than 5.5times as likely to be poor as white children. In Louisiana, for example, whatever the horrorsof its history of slavery, black children were “only” 3.7 times more likely to be poor.
Whatever a child’s color, however, poverty is very bad news, and a growing populationof poor kids is threatening our state’s future. A mountain of evidence shows that povertydulls children — literally. It lowers their IQ, generates all kinds of learning disorders, andslows their cognitive development. Finally, poverty hurts children — literally — because itgenerates much higher rates of disease and physical disability.
Playing by the Rules, but Barely Getting By: Wisconsin’s WorkingPoor
In Wisconsin, we have focused much policy attention on families who aren’t working.We have focused less attention on the working poor, and that group — playing by the rules,but barely getting by — has grown dramatically in the past 20 years. Figure 2.2 shows thatthe share of working families that were poor has nearly doubled in the state over nearly twodecades — outpacing the national increase in such families. In fact, in the late 1970s, only4.6 percent of working families in the state were poor, over 40 percent below the nationalshare of poor families at that time (7.9 percent). By the mid-to-late 1990s, however,Wisconsin’s advantage relative to the nation had been cut in half, with the state’s share ofimpoverished working families (8.9 percent) falling just over 20 percent short of the nation’s(11.5 percent).
Today, looking at these realities, we should celebrate the growing income that manyfamilies are finally experiencing. But we must also recognize that more progress is needed, ifWisconsin is truly going to share its prosperity with all its residents. The make-do incomestrategy of the past generation — increased work effort — cannot be pursued indefinitely inthe next. And with poverty rates still not declining and minority child poverty at such highlevels, who knows what the next downturn will bring?

17
Income & Poverty
�������
�������$����. � �,�� � ���� ��/� ��������������'�������(�������(�
��������'�����������+��������� ������������
perc
en
t
0
8
4
12
U.S.
1977-79 1977-791987-89 1987-891995-97 1995-97
66
Wisconsin
8.9
11.5
4.6
8.07.9
10.2

State of Working Wisconsin

The income and poverty trends documented in the last chapter suggest that incomeinequality may be on the rise. And indeed it is. In order to fully document this trend,we turn our attention to distributional issues, with a detailed comparison of trends at
the bottom and top of the income distribution.
Wisconsin has traditionally prided itself on its relatively high level of equality. We canstill do so. Even today, only seven states have more equally distributed income. But thistradition is threatened by our wage and income trends, and exacerbated by tax policy. As aresult, inequality has grown in Wisconsin. And during the 1990s — in contrast with the1980s — it has grown faster than in the nation as a whole.
Growing Income Inequality in WisconsinTrends in average real (inflation adjusted) income for each fifth of the income
distribution provide a good yardstick for measuring inequality. Drawing on a nationalanalysis, we produced a report with the Wisconsin Council on Children and Families earlierthis year that compares trends in inequality in the nation and in Wisconsin, entitled “PullingApart: The Strong Wisconsin Economy Masks Growing Inequality.” We draw on that report inthe findings presented below.
The national story of increasing inequality has been well documented and is reviewedin Figure 3.1. From the late 1970s to the late 1990s, the average real income of the poorestfifth of families fell 6 percent. Over that same period, the richest fifth of families experienceda 33 percent income increase. Closer to the top of the income distribution, the story is evenmore extreme; income rose by 55 percent for the richest five percent of families.
Wisconsin mirrors these national trends (Figure 3.1 and Table 3.1). From the late1970s to the late 1990s, average real income of Wisconsin families in the bottom fifth ofearnings fell 2.6 percent to $17,324. At the same time, families in the top income quintilesaw their average income rise over 30 percent, to $141,588. At the middle of the incomedistribution, the median family fared better than the bottom, but not as well as the top. Forthe middle fifth of families, real income grew 7.7 percent to $53,610. So, while middleincome families moved slowly uphill, with an annual increase of income of just $190, thestate’s richest families sprinted forward, each year pulling in over $1,600 more than the yearbefore.
3. Income Inequality andState Taxes

20
State of Working Wisconsin
U.S.
-10
0
10
20
30
40
perc
en
tch
an
ge
PoorestFifth
SecondFifth
MiddleFifth
FourthFifth
RichestFifth
-6
-1
5
11
33
Wisconsin
-10
0
10
20
30
40
perc
en
tch
an
ge
PoorestFifth
SecondFifth
MiddleFifth
FourthFifth
RichestFifth
-3
3
810
30
���������
%������/��� ���$���,�� � ���+������(����+������(��#��, $���$�,�� � ������ ���� ��+��
�������������������!�� ��� ���� ���������������'�����������+��������� �����������!�,---�
While Wisconsin has traditionally been a national leader in terms of income equality,recent trends have narrowed the difference between Wisconsin and its neighboring states.Among peer states, in the late 1970s Wisconsin and Iowa posted the most equal incomedistribution, with the income of the richest fifth of families at just over six times as much asthe income of the poorest fifth of families. At that time, Illinois posted the most unequalincome distribution; their richest families brought in more than 9 times the income of thepoorest families in the state. Over the last decade, however, the growth in Wisconsin’s ratiooutpaced every state in the region — for example, inequality in Wisconsin grew twice as fastas it did in Minnesota.
�� �����
� ����� ��,�� ���%������4�����-2��� ��,�� ���%�������$����* ������ ���������'������, $����$���
%������5 �� #" ����������(�����������(��"###�������
������ �������� ���� ������ � ������ � ������ �����;��� �����;���
,�� ��!���&! $�������� $������ $�������� ���4 ��4���������&! ������ ����� ������ � �)�����!���&! ������ ����� ����� :� :�
�������������������!�� ��� ���� ���������������'�����������+��������� �����������!�,---�

21
Income Inequality and State Taxes
U.S.
-10
0
10
20
30
40
perc
en
tch
an
ge
PoorestFifth
SecondFifth
MiddleFifth
FourthFifth
RichestFifth
1 02
4
15
Wisconsin
-10
0
10
20
30
40
perc
en
tch
an
ge
PoorestFifth
SecondFifth
MiddleFifth
FourthFifth
RichestFifth
-1
24
8
26
Finally, we should point out that Wisconsin’s recent surge in inequality has beenespecially marked. From the late 1980s to the late 1990s, inequality grew rapidly in thestate, in spite of Wisconsin’s strong economic performance. The income of Wisconsin’spoorest families fell slightly while the income of the state’s highest income families grew 26percent (Figure 3.2). Nationally, over the same period, income at the bottom of the incomedistribution rose slightly while the richest fifth of families gained 15 percent. As Figure 3.2makes clear, Wisconsin’s recent growth in inequality far outstrips the national trend.
Inequality of Wealth is Even More ExtremeIncome disparity alone, however, provides only part of the picture. Differences in
wealth—that is, disparities in ownership of stocks and bonds, real estate and other assets—between the upper and lower echelons of American society are even more pronounced andare growing more rapidly than the disparities in income discussed above.
Researchers have long known that a small percentage of Americans own the bulk ofassets. In 1995, for example, one percent of households owned 39 percent of the nation’swealth (and had 13 percent of the nation’s after-tax income). Eighty-four percent of all wealthis owned by the 20 percent of wealthiest households. By contrast, the remaining 80 percentof households hold only 16 percent of all assets. This disparity in wealth is currently greaterthan at any other time since the Great Depression, and the booming stock market hasincreased it. In addition, capital gains income and other income received by high-incometaxpayers have had extraordinary increases over the past few years as the stock market hassoared. Most capital gains income is realized by high-income taxpayers; nearly three-quarters of all capital gains are realized by taxpayers with income exceeding $100,000. One-quarter of all capital gains income is realized by taxpayers with incomes exceeding $1million.
��������
6��� � ���������* � � �%��7"�� �%������/��� ��#��, $���$����%������5 �� #" ���+������(����+������(�
�������������������!�� ��� ���� ���������������'�����������+��������� �����������!�,---�

22
State of Working Wisconsin
���������
� ����� ����������+�����4�8���#��%���������"�����&
��������������������./�������� ��� ���� �!�)����������'�������%�� �����./�����������
Finally, wealth disparity is especially pronounced by race. Available data do not allowus to examine disparity of income or wealth by race for Wisconsin, but the state trends nodoubt echo the national picture. In 1998, the average wealth in black households was only18 percent of the average wealth of white households ($58,300 compared to $320,900, 1999dollars). Additionally, fully 27 percent of black families have zero or negative net wealth whileonly 15 percent of white families do.
In sum, stagnation of income for the poorest families and only moderate increases formedian families stand in marked contrast to the dramatic gains that high income families inthe state have secured over the last decade. In the past, rising tides have lifted all boats, butit is clear that the economy has changed; Wisconsin’s growth has really paid off only for thetop 20 percent of the income distribution.
The State’s Tax Structure Exacerbates Income InequalityPerversely, state and local taxes in Wisconsin are an additional source of inequality. As
Figure 3.3 and Table 3.2 make clear, the combined package of Wisconsin taxes — includingproperty taxes, sales and excise taxes, and income taxes — is almost perfectly regressive,requiring less contribution the higher your income. Looking at the two ends of the earningsdistribution, for example, state and local tax rates for those in the bottom fifth of thatdistribution are about 12.3 percent; for those at its very top (the richest 1 percent of thepopulation), they are 8.5 percent. The poor have a tax burden 45 percent higher than therich. Including the federal deduction for state taxes in this picture only makes it worse. Afterthe federal deduction offset for local taxes, the bottom fifth are still paying at a 12.3 percentrate, but the rich rate drops to 6.2 percent. Here, then, the poor are facing a tax burdentwice that of the rich.
Perc
en
t
10
12
16
14
0Fourth20%
6
8
4
2
Property Taxes
Sales and Excise TaxesIncome TaxesTotal With Federal Offset
Lowest20%
Middle20%
Next15%
Next4%
Top1%
Second20%

23
Income Inequality and State Taxes
�� ����
� ����� ����������+�����4�8���#��%���������"�����&
������ ���� �� � �������������������������������������������������� ��� ��� ��� ��� �������� ����� � !�����
�����!�" #� $%�� #��$ �� #&'$%�� #(�$%�� #���$��� #� $���������)"�� #� $%�� *#��$ �� *#&'$%�� *#(�$%�� *#���$��� *#� $��� ��������
+,��"�������� #%$��� #�'$-�� #&�$��� # '$��� #-�$��� #� �$��� #�(�$���
������������������ �� ��� �� ��� ��� ��� ���3�������1�����:�����2������ �� � � � �� �� ��<! ���1�����-�.=�����:�����2������ �� � �� �� �� �1�����-�.=��������5������� �� �� �� �� �� �� ��
�������������� ��� ��� ��� ��� ��� ��� ���)��'��!#���=��������(����� �� �� �� �� �� � ��<! ���)��'��!#���=�� � � �� �� �� �� ��
����������� ��� ��� ��� ��� ��� ��� ���)������������(����= � � �� �� �� �� ��%��'���!������(����= �� �� �� �� �� � ��
����������� �� � � �� ��� ��� ��
������ !����"�#�����$�#%����&!!����� �� �� ��� �� �� �
��������'���0�������./�1���� �����.���������������./�������� ��� ���� ��
Wisconsin taxes are not only regressive, however, but also fairly high for workingfamilies and the poor. With recent tax cuts, the situation has improved, as Wisconsin’s stateand local tax burden fell from 13.1 percent of personal income to 12.4 of personal income.Even so, Wisconsin remains a relatively high tax state.
For a comparison with other states as shown in Table 3.3, we must rely on data from1995 when Wisconsin burdens were slightly higher; at that point Wisconsin stands out forthe relatively high rates paid. Take, for example, families right in the middle of the incomedistribution. In Wisconsin, they pay 12 percent of their income in taxes. Nationally, thisgroup pays only 9.4 percent, almost a third less. No other state in the region taxes middle-income residents this much. For the bottom fifth of Wisconsin families, the tax rate of 13.6percent is also exceptionally high. It is above the national rate of 12.4 percent for this group,and exceeded only in six states.
Of course, it could be argued that the middle class and poor, even though they pay farabove their fair share of taxes, get more back from the state than those who are better-off.They could be consuming more, or better, public goods — education, transportation, safety,etc. — which are supported by regressive tax dollars. If this were the case, there would beless reason to be concerned about Wisconsin tax regressivity. But there is no evidence thatthis is so, and much evidence that this is not the case. In Wisconsin, as elsewhere, socialservices of almost all kinds have been cut, and such.

24
State of Working Wisconsin
You Get What You Pay For: Thinking About Wisconsin Tax BurdensThe taxes we pay support the services that benefit us — individually and collectively.
States with relatively high personal income tax burdens are among those states with thestrongest economies. Wisconsin’s higher taxes provide more than improved services. Statetax revenues also fund our system of shared revenue — the historic partnership between thestate and local governments. Shared revenue provides both a degree of local property taxrelief as well as a degree of tax equalization between local governments across the state.
But where there are higher taxes there should be correspondingly high tax equitywithin the system. In Wisconsin this is clearly not the case. Moreover, state tax collectionsduring our recent economic boom have not been used to ensure long-term fiscal andeconomic stability. Our state faces a short-term structural deficit of between $500 millionand $1.2 billion. The seriousness of this problem is amplified by the absence of any long-term savings, despite the statutory mandate to appropriate funds as a safeguard againstunforeseen economic circumstances.
Instead, state revenue collections and forecasts of future revenue have been used tofinance politically expedient tax rebates and tax credits. Our public policy and resultingbudget priorities must recognize and plan for a changing economy — that is, somethingslower than our recent boom.
�� �����
��������+�����4�8�*����������������$�,�� ���%������9" � �������:
������ ���� �� � �������������������������������������������������� ��� ��� ��� ��� �������� ����� � !�����
'���� (���)� �����* �����* ����* +���* � �* ����* ��+�*
,����� ���� ���� ���� ���� ��+ +�� ����������� ��� ��� �� �� �� �� ��������� �� ��� �� �� �� �� ��
���� �� ��� �� �� �� �� ����� ���� �� ��� �� �� �� �� ��
�������!� ��� ��� ��� �� �� �� ��
��������� ��� ���� ������������

25
More than in any other developed nation, how you fare in the American economydepends on how you fare in the labor market — on the quality of the job that you, asan individual, are able to get and maintain. In this chapter, we look at trends in the
quality of jobs in Wisconsin, focusing on what most would consider the “bottom line” of jobquality: what they pay.
The news is much better than in the recent past. Median wages have increased eachyear since 1995 and are now well above their values of a decade ago. Even so, the medianwage in Wisconsin remains 5 percent below the level of two decades ago — despite all theimprovements in workforce education and productivity since that time. For full-timeworkers, for white men, for African Americans, and for people without college degrees, thegood news is substantially muted.
Trends in Wisconsin WagesIn this chapter we use data from the Current Population Survey (CPS), conducted by
the Bureau of the Census. The CPS is a national survey of individuals, but it is possible topiece together the individuals surveyed in any given state, and the size of the state sample inany given year (2,321 in Wisconsin in 1999) is large enough to make statistically validinferences about the general population within it. The CPS provides information on wages,hours, industry, and occupation for actual individuals, who in turn are classified by suchdemographic variables as age, sex, race, and education.
In what follows, we analyze wage trends in Wisconsin over the 1979–99 period.Throughout, we use median wages, not means, and report inflation-adjusted data, expressedin 1999 dollars. (For those unfamiliar with this way of reporting: such inflation adjustment iscrucial to making serious comparisons over time, since the real purchasing power of a givendollar declines through inflation. A dollar in 1979, for example, would buy as much as $2.25in 1999. So a worker making $10,000 in 1979 should not be thought of as less well off thana worker making $22,514 in 1999, but rather the same. And a 1999 worker making $10,000is actually making less than half as much, in real terms, as someone making that in 1979.)
Figure 4.1 and Table 4.1 display median hourly wage trends for Wisconsin and theU.S. from 1979–99. Compared to national trends and our own past, Wisconsin’s workforcehas lost ground, but the state’s recent economic boom has begun to make up for thatdecline.
4. Wages in Wisconsin

26
����������
*������� ����� ��� ����� �������������������"###�������
��������������(��������!�'���
�� �����
��� ���;�"������ ���� ����� ��������������#����8�����*����"###�������
.������ /0�0���� �������� �� �������� ��� ���� �������� �� �������� ������� ���� ���� ������� ������� ���� ��������������� �������
�� $���� $����� $����� :���4 ���4 $����� $����� $����� :��4 ��4
-�� ���� ���� ��� :��� :�� ���� ���� ���� :��� :��
+ �!����� ��� ���� ���� :��� :� ��� ���� ���� :�� �
5���6���� ���� ��� ���� :�� :��� ���� ���� ���� :�� �
,���� ��� �� ���� �� ��� ��� �� ���� �� ��
+ �!��+�(�� ��� �� ��� �� ��� ��� ��� ���� �� ��
5���6�+�(�� ���� �� ��� :�� �� ��� ��� �� �� ��
��������������(��������!�'���
In 1979, the median worker in Wisconsin had a 5 percent wage advantage over thenation’s median worker (annually, $1,000 for full-time workers in the state). By 1999, thatwage advantage had disappeared. In fact the national median wage slightly exceededWisconsin’s in 1999. In terms of hourly wages, Wisconsin’s real median wage fell from$12.43 in 1979 to $11.84 in 1999, a decline of 4.7 percent. Over the same period, the realmedian national wage fell but then grew back to its original level, ending up at $11.87 in1999.
10.00
11.50
10.50
11.00
12.00
$12.501
99
9d
oll
ars
Wisconsin
U.S.$11.84
$11.87
1979 1991 19991983 1987 1995

27
Wages in Wisconsin
The economic expansion has finally put the median American worker back at the levelof income attained in 1979. Unfortunately in Wisconsin, median wages are still below 1979levels. It may be tempting to pay attention only to the last five years of wage growth, and thesubstantial gains made since 1989 are indeed important. However, today’s typical workers —much more educated than in 1979, working with better technology, and thus moreproductive — actually make less money than their predecessors just a generation ago. AndWisconsin’s once substantial wage advantage relative to the U.S. for the median worker hasevaporated.
Disaggregating Wisconsin’s population by sex, we see that wage declines haveconcentrated on men. In fact, Table 4.1 shows that men’s wages remain below their 1989values and are nearly 17 percent lower than in 1979. The male median wage fell from $15.87per hour to $13.23 over 1979-99. Nationally, over the same period, men’s wages declined 10percent (down from $14.93 to $13.40 at the median). Wisconsin men fell even farther thanmen nationally. Again, there is improvement in recent years, though in this case“improvement” means stagnation. Wisconsin men’s wages dropped 3.5 percent over 1989–99; nationally, men’s wages dropped only 1 percent. Wisconsin men are falling behind, and inrecent years, falling more swiftly than their national cohort.
Women’s wages in Wisconsin, on the other hand, have improved, albeit more slowlythan women nationally. Over 1979–99, the median wage of Wisconsin women increased 7.6percent — from $9.45 to $10.17 — while women nationally showed a median wage increaseof 9.9 percent — from $9.38 to $10.31. These wage increases are not enormous, by anymeans, but full-time working women at the median are bringing home $1,500 more annually.Notably, Wisconsin women, having lagged behind their national sisters in the 1980s, closedthat gap during the 1990s, posting substantial gains over the period.
Finally, Table 4.2 looks only at full-time workers (Table 4.1 includes both full andpart-time), who are of particular interest because they are more likely to be household orfamily “breadwinners.” From the perspective of these workers, the 1990s have offeredconsiderably less progress than for the overall workforce. In fact, wages for this group wentup only $0.20 per hour from 1989-99: a two-cent increase each year for the decade. Thisslight gain still leaves Wisconsin’s breadwinners fully 9.4 percent below medians in 1979 —while nationally, this group’s wages fell just 3.4 percent over the same period. Disturbingly—and paradoxically—those working the most in our economy are gaining the least from it.
�� ����
������������� ���������� ����������� �� ��"###�������
���� �������� �� �������� ������� ���� ���� ����;�� ����;��
+�������� $����� $���� $���� :���4 ���4*1 ��� ��� ��� :�� ��
��������������(���������

28
State of Working Wisconsin
In summary, Wisconsin’s median wages declined faster than national wages during the1980s, but then made up some of the lost ground in the 1990s. Despite this recent goodnews, however, wages in the state are well below their levels of two decades ago, and —considering the whole of the 1979–99 period — have declined in contrast to the nation. Andas just indicated, what positive wage gains did occur in Wisconsin during the 1990s barelytouched full-time workers and were not experienced at all by men as a group.
The Gender Gap in WagesAs indicated in Table 4.3, women still face a considerable “gender gap” in wages — the
difference between what they earn on average per hour and what men earn. In Wisconsin in1999, as in the U.S., the ratio of women’s to men’s earnings was .77, indicating a gender gapof 23 percent.
Both in Wisconsin and the nation, the gender gap is closing. Unfortunately, as Figure4.2 makes clear, this owes more to the decline in men’s wages than to the rise in women’swages. Nationally, over 1979–99, the ratio of female to male median hourly wages rose 14percentage points, from 63 to 77 percent. However, if men’s wages had remained constantover that period the ratio would have improved only 6 percentage points, to 69 percent. InWisconsin, matters are worse. Our ratio of female to male wages rose from 60 to 77 percentover the period, but if male earnings had remained constant the ratio would have risen onlyto 64 percent. Obviously, it is hardly a victory when gender equity is achieved simply becausemen’s wages decline.
Men’s wage advantage over women results from both their concentration in higher-wage industries and the higher wages that men receive within industries. Thus, industrialstratification by sex contributes to the gender gap. The construction industry provides a casein point. Men are nearly ten times more likely than women to be employed in this relativelyhigh-paying industry, which employs 10 percent of men but just 1 percent of women. Andwithin the industry, the median wage for men is 13 percent higher than the median wage forwomen.

29
Wages in Wisconsin
��������
��������������������������������������� !"!#!!�"###�������
��������������(��������!�'���
�� �����
�$��%���� �%�&���������'���(�����������)��������������(�����)�
���� ���� ����
��������� ��� �� ��*1 ��� ��� ���
��������������(���������
6.00
8.00
14.00
10.00
12.00
16.00
$18.00
19
99
do
lla
rs
Wisconsin Women
U.S. Women
$13.23
$13.40
1979 1991 19991983 1987 1995
Wisconsin Men
U.S. Men
$10.17$10.31

30
State of Working Wisconsin
���������
���������)��������������%���� �%�&����*����( ��� !!!
��������������(��������!�'���
Agriculture
Construction
-40 -35 -30 -25 -20 -15 -10 -5 0
FIRE
Personal Services
Business & Repair Services
Retail Trade
Transportation
Non-Durable Manufacturing
Wholesale Trade
Durable Manufacturing
Professional Services
Public Administration
percent difference, women’s & men’s wages 1999
���������
������������ ��� ���+��( ���(����,� ����*����( ���-������� !!!
��������������(��������!�'���
Figures 4.3 and 4.4 show these two effects. Figure 4.3, recording the distribution ofemployment by sex and industry, shows that women are concentrated in lower-payingsectors. Figure 4.4 shows that, within those industries, women are clustered in the poorer-paying jobs. In Finance, Insurance, and Real Estate (FIRE), for example, the female medianhourly wage was $11.55 per hour in 1999, nearly 40 percent lower than men’s median wageof $18.27. In durable manufacturing, women’s wages were almost 30 percent below those ofmen in the same sector, while in wholesale trade, women’s wages were over 20 percent belowthose of men. Even the professional services industry, with a relatively high concentration ofwomen, exhibits a substantial gap in wages.
= 5% of Female Labor Force= 5% of Male Labor Force
Agriculture
Construction
FIRE
Personal Services
Business & Repair Services
Retail Trade
Transportation
Non-Durable Manufacturing
Wholesale Trade
Durable Manufacturing
Public Administration
Professional and Related Services

31
Wages in Wisconsin
���������
���)�������������������������������������� !"!#!!�"###�������
��������������(��������!�'���
���������
�����)�������������������������������������� !"!#!!�"###�������
��������������(��������!�'���
The Race GapFigures 4.5 and 4.6 display wage trends by race in Wisconsin and the U.S (see also
Table 4.1). The downward trend for blacks in the state is unmistakable. Wages have declinedsubstantially from 1979 values for black Wisconsinites. And this compares poorly both towage trends for whites in the state and to national trends for blacks. Recent years haveproven more positive, however, with wages for both black men and women moving up duringthe late-1990s. This turnaround in wage trends is one among the most positive signs wedocument in this report.
6.00
8.00
14.00
10.00
12.00
16.00
$18.00
19
99
do
lla
rs
U.S.
$13.51
1979 1991 19991983 1987 1995
Wisconsin
$14.75
6.00
8.00
14.00
10.00
12.00
16.00
$18.00
19
99
do
lla
rs
U.S.$10.98
1979 1991 19991983 1987 1995
Wisconsin
$10.84
White Black
6.00
8.00
14.00
10.00
12.00
16.00
$18.00
1999
do
llars
U.S.
$10.27
1979 1991 19991983 1987 1995
Wisconsin
$10.96
6.00
8.00
14.00
10.00
12.00
16.00
$18.00
1999
do
llars
U.S.
$9.96
1979 1991 19991983 1987 1995
Wisconsin
$9.25
White Black
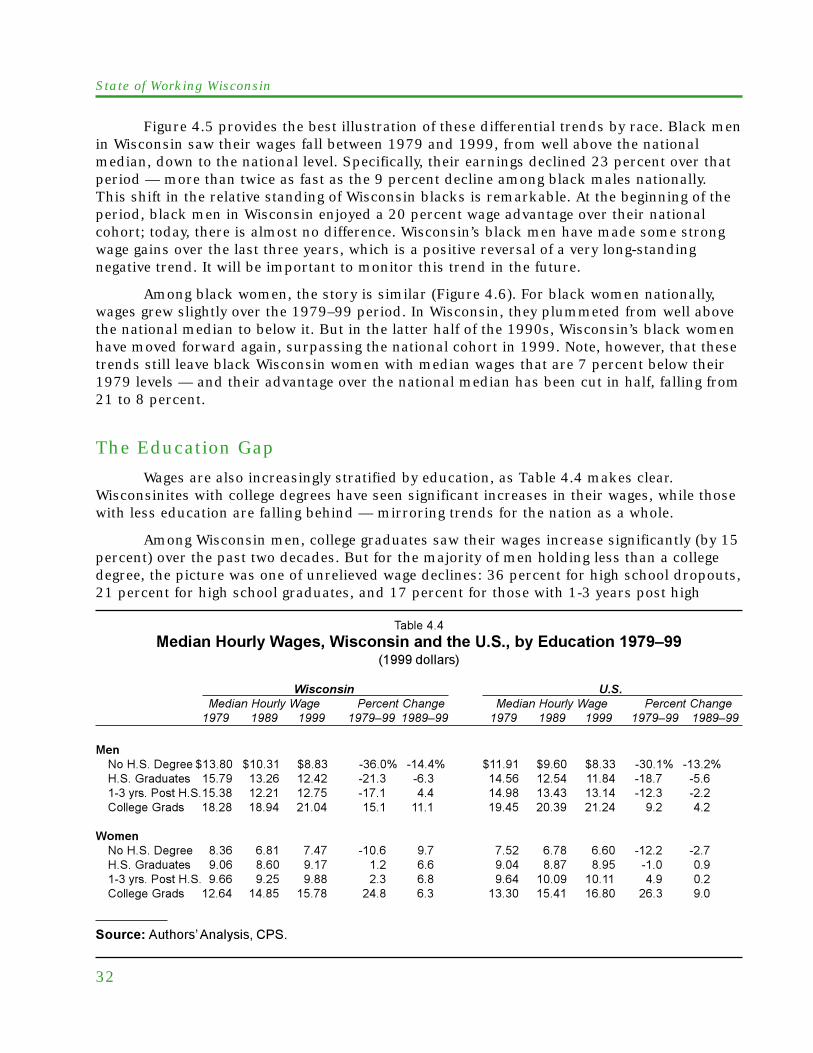
32
State of Working Wisconsin
Figure 4.5 provides the best illustration of these differential trends by race. Black menin Wisconsin saw their wages fall between 1979 and 1999, from well above the nationalmedian, down to the national level. Specifically, their earnings declined 23 percent over thatperiod — more than twice as fast as the 9 percent decline among black males nationally.This shift in the relative standing of Wisconsin blacks is remarkable. At the beginning of theperiod, black men in Wisconsin enjoyed a 20 percent wage advantage over their nationalcohort; today, there is almost no difference. Wisconsin’s black men have made some strongwage gains over the last three years, which is a positive reversal of a very long-standingnegative trend. It will be important to monitor this trend in the future.
Among black women, the story is similar (Figure 4.6). For black women nationally,wages grew slightly over the 1979–99 period. In Wisconsin, they plummeted from well abovethe national median to below it. But in the latter half of the 1990s, Wisconsin’s black womenhave moved forward again, surpassing the national cohort in 1999. Note, however, that thesetrends still leave black Wisconsin women with median wages that are 7 percent below their1979 levels — and their advantage over the national median has been cut in half, falling from21 to 8 percent.
The Education GapWages are also increasingly stratified by education, as Table 4.4 makes clear.
Wisconsinites with college degrees have seen significant increases in their wages, while thosewith less education are falling behind — mirroring trends for the nation as a whole.
Among Wisconsin men, college graduates saw their wages increase significantly (by 15percent) over the past two decades. But for the majority of men holding less than a collegedegree, the picture was one of unrelieved wage declines: 36 percent for high school dropouts,21 percent for high school graduates, and 17 percent for those with 1-3 years post high
�� �����
��������� �����������������������($�����������.����(���� !"!#!!�"###�������
��������� ������� �������� �� �������� ��� ���� �������� �� �������� ������� ���� ���� ������� ������� ���� ��������������� �������
���7��81�9����� $���� $���� $��� :���4 :���4 $���� $��� $��� :���4 :��481�3�����!�� ���� ��� �� :�� :�� ���� ��� ���� :��� :���:��#���)��!�81���� �� ��� :��� �� ���� ���� ���� :�� :%�������3���� ��� ���� ��� ��� ��� ���� ��� �� � �
�� ��7��81�9����� ��� ��� ��� :��� �� �� ��� ��� :� :�81�3�����!�� ��� ��� ��� � �� ��� ��� ��� :�� ���:��#���)��!�81 ��� �� ��� � �� ��� ���� ���� �� �%�������3���� ��� ���� ���� �� �� ���� ���� ���� �� ��
��������������(��������!�'���

33
Wages in Wisconsin
school education. The upshot is that for men, the college/high-school gap has grown at asteep rate, from 16 percent in 1979 to 69 percent in 1999.
Among Wisconsin women, college graduates posted even more substantial gains (25percent) than did their male counterparts. But again, the majority of women do not holdcollege degrees, and for them, the past two decades have been much less kind. Wages havebarely moved for women with some college experience (up 2 percent) or with high schooldegrees (up 1 percent). And among high school dropouts, wages declined by 11 percent. Sofor women, the college/high-school gap has also grown, from 40 percent in 1979 to 72percent in 1999.
Here and in the nation, only the most educated have reaped the benefits of the newprosperity. For the majority of Wisconsin workers (75 percent) who do not hold a four-yearcollege degree, wages have either declined or stagnated.
Table 4.4 does show a promising trend, however. Individuals with some collegeexperience (though not a college degree) have seen their wages grow in the past decade (4percent for men, 7 percent for women). These are workers who have invested in acquiringadditional skills — via Associate’s Degrees or occupation-specific training — and Wisconsinis finally starting to reward their efforts. Note that their national counterparts have seen nosuch gains in recent years, perhaps indirect evidence of the strength of our technical collegesystem.
Wages, Industries, and UnionsThe declining fortunes of workers without a college degree are usually pinned to the
rise of high-tech industries and the increasing need for computer and “knowledge-based”skills. To some extent, it is true that the deindustrialization has hurt less educated workers,with the flight of manufacturing jobs that used to provide family-supporting wages to highschool graduates. But especially in Wisconsin, there is another trend that has actually beenmore important: the decline of wages within manufacturing, driven in large part by thedecline in unions.
Table 4.5 shows how median real wages have changed at the industry level over time.Two decades ago, the highest paying jobs were to be found in the core industries ofmanufacturing, construction, and transportation, with wages that were between 50 and 100percent higher than those in the service sector. But between 1979 and 1999, wages inconstruction fell by 21 percent; in non-durable manufacturing by 19 percent; in durablemanufacturing by 15 percent, and in transportation and communication by 25 percent.Again, these are industries that typically do not require a college degree of front-line workers,and so it is less-educated workers that have been hit strongest.
Especially in recent years, the problem is not so much that manufacturing jobs haveleft the state, but that they pay much less now than they used to. Figure 4.7 underscores thepoint, by showing each industry’s wage change between 1979 and 1999 alongside the percentof the workforce that it employs. In 1999, fully 26 percent of Wisconsin workers heldmanufacturing jobs and another 11 percent held jobs in construction and transportationindustries — a substantial part of the economy. Yet these industries lead the state’s economyin the extent of their wage losses over the past two decades.

34
State of Working Wisconsin
��������
�������������������� �������������������������
������������������� ���������
�� �����
���������������� �������� ����������������������� ���������������������
���� ���� �������� ���
��������������������������������� ������ ������ �� �!"����������� �#� � � �$��%���&��� �������'�������� �� � �$� ����&��� �������'�������� �� �$�� ���������(����������"�))���������������*� ����+�������� ���� � �� �$��,-������������� ���� � �� �#�.����������� �# �$$ ��*���������/��������)��������.������������0��1���� �� � � ��#2������������.�(����0��1���� ��$� ���� �##�3./ ���� �$$� �#�*��'���������0��1���� �� � �$�� ���*� ������)����������� ��$ ���� ��
������������������� ���������
Agriculture
Construction
FIRE
Personal Services
Business & Repair Services
Retail Trade
Transportation
Non-Durable Manufacturing
Wholesale Trade
Durable Manufacturing
Professional Services
Public Administration
-30 -20 -10 0 2010
= 5% of Labor Force in 1999
change in real median wages

35
Wages in Wisconsin
Service industries, by contrast, have seen positive wage growth between 1979 and1999, in some cases quite robust wage growth. And they also employ a substantial portion ofthe workforce. But only some of these industries pay good wages, and rarely do they exceedwage levels found in the more traditional goods-producing sector. It is therefore especiallygood news that wage growth in especially retail trade, personal services, and business andrelated services has been positive in recent years (until the early 1990s, these industriesshowed declining wages).
Still, the manufacturing sector will continue to be a critical part of the economic baseof Wisconsin, and so it is worthwhile to take a closer look at what has happened to it overthe past two decades.
According to county employment data from the state, while some firms shut downand others moved workers abroad, in 1998 there were almost as many manufacturing jobsin the state, 566,000, as there were in 1979, when there were 583,000. But the jobs havemoved. Specifically, firms left Milwaukee, Racine, and Kenosha. Over the 20 year period,those counties lost 96,000 manufacturing jobs, or 45 percent of their base. Meanwhile, therest of the state picked up 78,000 jobs, many with the same employers. The wagesignificance of this is simply stated. Because they are more highly unionized and generallyengaged in more advanced production, manufacturing employers in Milwaukee, Racine, andKenosha pay higher wages — on average, $39,000 per year (1998 dollars). Because they areless highly unionized, and generally engaged in less advanced production, employers in therest of the state pay lower ones — on average, $33,000 annually. Just in this one sector,then, the movement of 78,000 jobs out of the first area meant a loss in worker income in thestate of $421 million annually.
The union story merits elaboration as well. In line with national trends, unionizationin Wisconsin has declined dramatically, falling from about 33 percent of the workforce in theearly 1970s to under 19 percent today. If unionization had been maintained at its previouslevel, union membership in the state would be 352,000 greater than it is today. What’s thewage effect? In Wisconsin in 1998, average hourly wages for a union worker were $16.08, ascompared to $13.03 for the average non-union worker. Yearly, this 23 percent “unionpremium” in pay amounts to $6,060 (calculated on a full-time, year-round basis). Had those352,000 workers gotten it last year, it would have represented a $2.1 billion boost inWisconsin worker income. Evenly distributed over the entire labor force, that would havemeant a $0.41 hourly wage increase for every Wisconsin worker, making our state medianwage $12.25 rather than its current $11.84. Calculated this way, the decline in unionizationin the state can be assigned almost a third of the wage decline over 1979–99.
Unionization has a big spillover on non-union worker wages too, but one that declinesdramatically as union density declines. At 30 percent average density, and density muchhigher in particular sectors of the economy (including the crucial manufacturing one), evennon-union employers need to pay something approaching the union rate to attract and keepskilled workers; unions effectively “take wages out of competition” among employers. Theloss of this wage multiplier on union power is enormous. Finally, the presence of moreunions in an economy is a spur to productivity. Because they do in fact drive up the cost oflabor, employers have to make workers more productive if they are to maintain profits. Thishas positive effects on capital investment, modernization, and other productivity-enhancingmoves, which has additional positive spillovers in the economy.

36
State of Working Wisconsin

The previous chapter offered a broad overview of Wisconsin’s median wage trends,which have been rising steadily in recent years but have not yet rebounded to their1979 levels. In this chapter, we will document an important factor holding back our
progress: the continuing proliferation of low-wage jobs in Wisconsin’s labor market.
The growth in badly-paid jobs helps to explain why even the current strong economyhas not made up the ground that Wisconsinites lost over the past two decades. It also helpsto explain the rising income inequality that we documented in Chapter 3. In order to betterunderstand the magnitude of this problem, we focus our attention on the bottom of the labormarket and document the share of workers earning wages below the poverty line.
Looking to the bottom of the labor market makes it clear that Wisconsin’s boomingeconomy is not paying off for everyone. We find that significant numbers of workers in thestate are still locked out of jobs that pay family-supporting wages — not just women, butincreasingly men as well. Poverty-wage jobs are an especially acute problem for blacks in thestate, and those who stopped their education after high school.
We go further to document factors that make for bad job quality: the strong growth oflow-wage service industries; lack of access to full-time work; the large number of entry-level,non-unionized jobs; and the fact that low-wage jobs often “trap” workers and lead to low-wage careers. Understanding these realities can contribute to the formation of a policyagenda to improve the quality of jobs that Wisconsin’s boom is generating. Policy makers atall levels — elected officials, economic development experts, family advocates, andcommunity leaders — should consider these realities so that we can begin to improve thequality, rather than just the size, of Wisconsin’s job base.
The Growth in Poverty-Wage JobsWe begin by presenting data on trends in “poverty-wage” jobs, using the Current
Population Survey described in the previous chapter. We define these as jobs paying a wageinsufficient to lift even a full-time (40 hours a week), year-round (52 weeks a year) worker tothe poverty line for a family of four with two children. In 1999 dollars, this wage was $8.12an hour or less; if someone worked full-time for the entire year, annual earnings at this ratewould be $16,895.
5. Poverty-Wage Jobs

38
State of Working Wisconsin
Of course, this definition of “poverty wage” is somewhat arbitrary. We could havechosen the poverty line for a family of two, or five, or some other wage level entirely. And notall workers who earn “poverty wages” are actually living in poverty. They may be part of ahousehold or family that has other earners on whom they can rely for support. At the sametime, it is important to remember that workers who earn poverty wages often can find onlypart-time jobs and often have spouses who hold jobs similar to their own — so that poverty-wage jobs are a good indicator of working poor families. Moreover, our interest here is totrack the quality of jobs being generated in Wisconsin, and no one would call eight dollars anhour a good job.
Table 5.1 shows the trend in poverty-wage employment in Wisconsin over time. In1979, one in five Wisconsin workers (21 percent) worked in a poverty-wage job. Over thenext decade, this number increased significantly, to almost one in three workers (30 percent)in 1989. The 1990s then brought a reversal of this upward trend. Poverty-wage employmenthas receded, especially in the last several years, dropping back to 22 percent of all jobs inthe state in 1999. As with median wages, the last several years have boosted the standing ofworkers at the bottom of the labor market and job quality appears to be improving for some.
But this aggregate trend is very misleading. When we break it down for differentgroups, we find that many workers have, in fact, not shared in the overall reduction in low-wage jobs.
We start with the race-sex breakdowns in Table 5.1. Among the four groups, onlywhite women have seen a decline in poverty-wage jobs over time, down from 36 percent in1979 to 27 percent in 1999. This is, of course, an enormously encouraging trend, but clearlythere is still a long way to go. Even with these substantial declines, more than one-in-four
�� �����
�$� ����������������� �� ��.� �����0�1� (���������+������������2$�",3���!�"###�������
�� �� �������!���� ��� �������� ������� ���� ���� ����;�� ����;��
"���+��6��� �� ��� � ���4 :���4
+ �!����� �� ��� ��� �� :���5���6���� ��� �� �� ��� ��
+ �!��+�(�� ��� ��� �� :�� :��
5���6�+�(�� � ��� ��� � :���
����:��(��+��6��� ��� �� ��� ��� :��
7��81�9����� � ��� ��� ��� ��
81�9����� �� ��� �� �� :���
�:��#���'��!�81 �� ��� � :� :���
%�������3���� �� �� �� :��� :���
��������������(���������

39
Poverty-Wage Jobs
���������
0� ���(���������������� �� ��2�($�0�1� (�������3����� !"!#!!/����������! ���$��> ���������������0
��������������(��������!�'���
white women in Wisconsin currently earn poverty wages. White women are still much morelikely to hold poverty-wage jobs than white men, but while in 1979, they were 3.5 times morelikely to hold such jobs, in 1999 they were less than 2 times as likely. This mirrors thedecline in the gender gap in median wages documented in the previous chapter; whitewomen are making progress relative to white men.
For the other three groups, however, poverty-wage employment has actually increased.This is most apparent among black men, where the percent of workers with low-wage jobshas more than doubled over the last two decades (from 14 percent in 1979 to 30 percent in1999). Black women show a similar trend over the same time period, with low-wage jobsgrowing from 27 to 35 percent. Figure 5.1 gives the full historical perspective on this trend.While the second half of the 90s decade brought some relief, over the long run there has beena marked deterioration in job quality for African Americans in this state. We are now at thepoint where roughly a third of black workers does not hold a job that pays above the povertyline.
White men are the least likely to earn poverty wages, as one might expect. In 1999,less than 16 percent held a poverty-wage job. But this represents an increase of 53 percentover 1979, when only one-in-ten held such jobs. In fact, white men are second only to blackmen in the extent of the deterioration in job quality over the past two decades.
The next entry in Table 5.1 focuses on trends for full-time workers only. Part-timejobs generally pay less than full-time ones, and so it might be that some of the increases inlow-wage jobs documented above could just reflect an increase in part-time employment. Thetable does indeed show that full-time workers earn poverty wages less frequently than doesthe overall workforce. But distressingly, it also shows that full-time workers have actually
0
10
40
20
30
50
60
perc
en
t
Black Women
White Women
White Men
Black Men
1979 1991 19991983 1987 1995
35.1
27.3
15.6
29.5

40
State of Working Wisconsin
seen a growth in poverty-wage jobs, in contrast to the workforce as a whole. In 1979, justone in nine (13.5 percent) full-time Wisconsin workers earned poverty wages. In 1999, one insix did (16 percent) — an increase of 19 percent. Clearly, finding a full-time job does notguarantee a good wage in our new economy; this is a serious problem since full-time workersare most likely the main breadwinners in their family.
Finally, less educated workers have suffered the most from the expansion of poverty-wage jobs. Table 5.1 shows that in 1999, more than half of high school dropouts in the stateearned poverty wages, almost double the percent in 1979. High school graduates faredsomewhat better, with only a slight increase over the past two decades. Still, in 1999 roughlyone-in-four (26 percent) high school graduates held a low-wage job. And note that these twogroups of workers still represent the majority of Wisconsinites.
By contrast, workers with some college experience or a college degree saw a steadydecline in poverty-wage jobs over the same period — supporting the argument that skillshave become more important in the new economy. Still, it is worrisome that 23 percent ofWisconsin workers with some post-secondary schooling held a poverty-wage job in 1999.These are workers with Associate’s Degrees, certificates, and occupation-specific training,surely indicators of solid skills. The fact that almost one in four of these workers have badly-paid jobs suggests that Wisconsin is not doing enough to reward its residents’ investments intraining.
To summarize, poverty-wage jobs are an enduring reality of Wisconsin’s economiclandscape, accounting for one-in-five workers. Moreover, such jobs have grown significantlyover the past two decades for African Americans, white men, full-time workers, and thosewith a high school degree or less. In order to fully appreciate the impact of this trend — andthe policy solutions that will be required — we now turn to some of the factors that arecorrelated with low-wage employment.
What Makes for Bad Job Quality?A full understanding of poverty-wage jobs means that we have to look beyond simply
the fact that they don’t pay well. There are systematic factors that make for low-wageemployment, which can tell us a lot about the steps that Wisconsin policy makers need totake in order solve the “bad jobs” problem. Here we document three such factors. First, low-pay service industries play a strong and expanding role in the state’s economy and generate asignificant portion of Wisconsin’s jobs. Second, poverty-wage earners tend to work part-time,in entry-level positions, and in non-union workplaces, making work less stable andsupporting a family more difficult. And third, low-wage jobs tend to trap workers in chronicinstability and lead to low-wage careers over the long run.
In what follows, we compare two groups of Wisconsin workers: those in poverty-wagejobs (as defined earlier with wages equal to or less than $8.12 per hour), and those in whatwe will refer to as “higher-wage jobs” (wages greater than $8.12 per hour).
Low-Wage Service Industries
Wisconsin has historically had a strong manufacturing base, offering middle-classwages and good benefits to workers without a college degree. Like the rest of the nation,

41
Poverty-Wage Jobs
however, Wisconsin has seen a shift from manufacturing to service industries since the early1970s. Although Wisconsin has managed to retain a larger share of manufacturing jobs thanmost states, the majority of its job growth has come from the service sector.
This is both good and bad news. At the upper end of the service sector, there are anumber of industries that pay well. For example, in 1998 the average weekly pay inWisconsin in finance, insurance, and real estate industries was $698 a week (See Table 1.2).This is comparable to the weekly pay in manufacturing ($700) and construction ($679). Yetthere is also another side to the new economy, namely industries that have low weeklyearnings, such as retail trade ($275) and services ($478).
From the perspective of measuring job quality, what is important is that these low-payindustries have grown just as strongly as high-pay industries during the past two decades.For example, between 1979 and 1999, more than a third of Wisconsin’s net job growth (36.4percent) came from retail trade, business and repair services, and personal serviceindustries. This balances out the 32.2 percent contributed by professional services and the10 percent contributed by finance, insurance, and real estate.
With this overall picture in mind, Figure 5.2 shows that in 1999, poverty-wageworkers were much more likely to hold jobs in the bottom of the service sector — again,retail trade, business and repair services, and personal services. Combined, these industriesaccounted for almost half of all poverty-wage jobs (48 percent). By contrast, only 17 percentof higher wage workers held jobs in these industries.
The flip side of the story is that poverty-wage workers are much less likely to holdjobs in manufacturing industries — 12 percent, as compared to 29 percent for higher-wageworkers. The same finding holds for construction, transportation, and wholesale trade. Aswe saw, these are industries which have traditionally done a much better job of providingfamily-supporting wages.
��������
*����( ��+��( ���(������������������� �� ��� !!!
������������������� ���������������������������������������������������������
��������������(��������!�'���
Professional & Related Services, 23%
Manufacturing, 29%
Construction, 7%
Transportation, 7%
Wholesale Trade, 4%
Other, 6%Business, Repair, &Personal Services, 7%
FIRE, 7%
Retail Trade, 10%
Workers with Poverty-Wage Jobs(wage less than $8.12/hr.)
Workers with Higher-Paying Jobs(wage greater than $8.12/hr.)
Professional & Related Services, 23%
Manufacturing, 12%
Construction, 3%
Transportation, 3%Wholesale Trade, 2%
Other, 4%Business, Repair, &Personal Services, 14%
FIRE, 5%
Retail Trade, 34%

42
State of Working Wisconsin
Hours, Unions, and Occupations
Poverty-wage workers face additional obstacles. First, they are less likely to findstable, full-time employment and instead bounce through a series of short-lived jobs. Table5.2 shows that in 1999, the percent of part-time jobs was almost four times higher forpoverty-wage workers than for higher wage workers (41 percent compared to 11 percent,respectively). Moreover, while our data do not have information on weeks worked during theyear, other studies have shown that part-time jobs tend to be part-year jobs as well. Theupshot is that access to stable, long-term jobs is a serious problem at the bottom of the wagedistribution.
A second problem is that poverty-wage jobs are much less likely to be unionized —not surprising, since unions are often able to bargain for higher wages. Still, the gap inrepresentation is striking. In 1999, only 6 percent of poverty-wage workers held union jobs,as compared to 23 percent of higher-wage workers.
Finally, jobs that don’t pay well tend to consist of entry-level and front-line positions.Table 5.2 shows that poverty-wage workers were more likely to hold sales and service jobsthan higher wage workers (49 percent as compared to 15 percent) and less likely to bemanagers, professionals, and technicians (11 percent as compared to 36 percent). Note alsothat when poverty-wage workers do hold manufacturing-related jobs, it is usually not in thebetter paid craft jobs (only 6 percent), but rather front-line labor jobs (19 percent).
This difference in occupations is instructive. For example, the reader may havenoticed that in Figure 5.2, poverty-wage workers were strongly represented in professionalservice industries and in finance, insurance, and real estate (28 percent). These industriesare typically seen as the vanguard of the service sector, filled with managers, stock brokers,and technology wizards. In truth, however, these industries tend to be stratified between atier of high-skill jobs and a tier of low-skill jobs, such as customer service representatives —hence the presence of low-wage workers even in this elite niche.
���"���#�� ���"���#����!���$� ��%�&� ������$� ��%�&�'# ��()�*�+,��*- '# ��.,/)�*�+,��*-
)�����!�+��6����)��!:!�(� ����4 ����4
)�����!�*�����?�� �� �
)�����!����<���'�!�������������)��&������������������ ������� ��� ���1���� ��� ��%������������"�(����!��!�2��1�''��! ��� ���1��2���� ��� ��)���������)�����!�����%��&!�����,�'��� �� ����� ����<'���!�����"���( �����������'��!���������@� ����� ��� ������(����������!�#�-���� ��� �� ��
��������������(��������!�'���
�� ����
/$� ��(� ��(������������������� �� ��� !!!

43
Poverty-Wage Jobs
Workers Get Caught in the Low-Wage Career Trap
An important part of the reality of being a poor worker is that it is a long-term state,one that is very hard to get out of. We call this the ‘stickiness’ of low-wage jobs. For a varietyof reasons, some having to do with the worker, some having to do with the jobs themselves,holding a low-wage job often means chronic cycling from one bad job to another, with littlegain over a career.
In order to illustrate this pattern, we shift to a different dataset that allows us to trackworkers over long periods of time. The Wisconsin Department of Workforce Developmentmaintains Unemployment Insurance data files, which record quarterly earnings forindividuals working in the state. The advantage of these data is that, unlike the CurrentPopulation Survey, we can follow workers over time and record any progress they make interms of earnings. The disadvantage is that very little additional information is available. Wedo not know the workers’ sex, race, or education, for example, and we do not know howmany hours and weeks they worked in a given quarter. In what follows, we present data onthe percent of workers with quarterly earnings that fell at or below the poverty line. Thispercent differs from the ones in Table 5.1 above, because we have not been able to adjust forhours or weeks worked. Still, as we will see, this measure is more than adequate to the taskof identifying workers who are stuck in low-wage jobs over the long term.
In Figure 5.3, we begin by focusing on the year 1990 and record the percent ofworkers who had quarterly earnings insufficient to lift a family of four above the officialpoverty line.
In 1990, almost one in three workers (32 percent) had quarterly earnings that fellbelow the poverty line. Following this group to 1997, we see that eight years later, nearly 54percent of those same workers still held a poverty-earnings job. Only 12 percent hadmanaged to reach the pay range of 150 to 200 percent of the poverty line. And only 9 percenthad managed to rise into what we would consider the middle-class, with quarterly earningsthat were twice the poverty line or more.
���������
�$��0� ���(��������4�2�5�� (� ��.� ������61� ������������������
��������������(��������!�%�� ����(�������������������� ��*� ���!�"##-����"##4�
… belowthe poverty line
31.8%
… abovethe poverty line
68.2%
Where didthey end up in 1997?
In 1990, percent of workerswho held a job with earnings:
Still below the poverty line 53.5%Earned 100-150% of poverty line 25.7Earned 150-200% of poverty line 11.6Earned more than 200% 9.2
Moved below the poverty line 11.0%Earned 100-150% of poverty line 16.1Earned 150-200% of poverty line 21.0Earned more than 200% 52.0

44
State of Working Wisconsin
���������
�$��+��( ���(�������0�1� (���������������������� !!"
��������������(��������!�%�� ����(�������������������� ��*� ���!�"##4�
By contrast, the vast majority of Wisconsin workers who were above the poverty linein 1990 were still above it in 1997. About a third (37 percent) was earning between 150 to200 percent of the poverty line, and more than half (52 percent) were earning at least doublethe poverty line.
Thus there is a serious problem with low-wage jobs, beyond how little they pay in anygiven year. Over the long run, they often lead to low-wage careers.
Now, some might argue that this is purely a function of lack of skill. While the data setused here does not give information on education level, other research on low-wage careershas shown that skill is not the whole story. Low-wage jobs of the type one finds in retail tradeand other service industries exert their own negative pull on worker’s careers: few skills arelearned, and there are few opportunities for promotion.
The Geography of Poverty WagesA common perception is that low-wage jobs are limited to Wisconsin’s inner cities,
perhaps reflecting a less-skilled labor poor or the influx of immigrant workers. But a closerlooks reveals that, in fact, no region in the state is immune to the problem of low-wage work.For the following analyses, we continue to use the State’s Unemployment Insurance recordsand examine quarterly earnings on a county-by-county basis.
The first map in Figure 5.4 takes all Wisconsin workers who had quarterly earnings ator below the poverty line in of 1997. It shows where these workers were located: clearly, thelarge majority was in just a few counties: Milwaukee, Waukesha, Dane, Brown, andOutagamie.
-
--
-
60 6849 59
30 3940 48
Percentage of All Poverty-WageWorkers, by County, 1997
Within Each County, Percentage ofWorkers with a Poverty-Wage Job, 1997
-
--
-
7.83 17.992.76 7.83
0.04 0.740.74 2.76

45
Poverty-Wage Jobs
But this map only tells part of the story. We can also approach the issue from anotherangle, and instead ask, within each county, how many workers had quarterly earnings at orbelow the poverty line? This is a question about communities and the type of opportunitiesthey offer to their residents.
The second map in Figure 5.4 shows, of all the workers within each county, thepercentage that had poverty level earnings. And here, the picture changes dramatically.Residents of rural counties in Wisconsin clearly had a higher likelihood of holding a poverty-wage job than did urban residents.
So in terms of raw numbers, the majority of Wisconsin’s poverty-wage jobs are inurban areas, simply because those areas have most of the jobs in the state. But a higherpercentage of jobs in rural areas pay very low wages.
From a worker’s perspective, the second point is probably the more relevant way oflooking at things, because it indicates the chances of finding a good job. And from acommunity’s perspective, this is also the more relevant way of looking at things, becausewhen there aren’t enough good jobs around, other measures of social health deteriorate. Theupshot, then, is that low-wage jobs are every region’s problem. The challenge of raising livingstandards spans the state, and can only be solved through concerted action on all fronts —urban and rural, regional and statewide.

46

47
Working families in Wisconsin are, on average, better off than they have been in twodecades, and trends point in the direction of further improvement. Even so, someworkers are still falling behind, inequality is on the increase and, at the bottom of
the labor market, many continue to bounce through a series of low-wage, dead-end jobs.How can we maintain and build on the strengths of Wisconsin’s present economy, whilemaking improvement on these problems? In this chapter, we outline some of the policyoptions.
Before doing so, however, we anticipate and respond to four common objections tothinking seriously about these matters in the first place.
We’re Biased
How the economy is doing for working families is a politically charged topic, andinevitably those with different political agendas will “spin” the facts in different ways. Here atCOWS we are sometimes accused of only looking for bad news — and deliberately ignoringfavorable economic trends. We think this charge is unfair, and unsubstantiated. We makeevery effort to be accurate and objective in our documentation, and report the good newsalong with the bad. If there is any “bias” in our focus, it is simply to shine a spotlight on thewell-being of those who make up most of our economy — viz. working families themselves —but whose fate within it is usually not reported on with depth. We do believe, and this showsour values, that in a democratic society the measure of economic performance is whether thefruits of prosperity are widely shared. But this should not a controversial view. It’s justanother way of stating the “American dream” of widening opportunity, and rising livingstandards, for most of the population. And in seeing how that dream is doing, median wagetrends, especially those for specific race, gender, and education groups, speak to the day-to-day reality of working families in the state better than a quick review of job growth or theunemployment rate.
1979 is a Bad Benchmark
A closely related charge is that 1979, the year we use as a benchmark for most over-time comparisons, is an unfair one. That was about the time the U.S. economy beganbehaving differently than it did in the past — when each generation did better than the onebefore, wages rose fairly steadily, and productivity and wage growth tended to go hand in
6. Toward a Policy Agendafor Working Wisconsin

48
State of Working Wisconsin
���������
0 ����(�1�(�������� ��/��&����(����% �2($�� !"7#!8
��������� ��� ���� ������������
hand. But 1979 is not, for workers, the best year of American economic performance; onmost wage and income measures, that pride of place goes to 1973. So we’re not deliberatelychoosing a year in comparison to which everything looks bad. And 1979, because it was ayear for which we have decennial census data, because it’s sufficiently long ago to mark anintervening generation of economic experience, and precisely because it preceded thetroubled wage history of the 1980s-90s, seems like a recommended benchmark. What we atCOWS are trying to make sense of, and working to reverse, are the troubling wage andincome trends of this period. The fact that real wages are still below their 1979 values shows— even after some five years of good economic news for workers — just how far we still needto go.
W2 Will Change All This
Some argue that the basic wage trends reported here will look substantially differentonce the latest effects of welfare reform are known. But this seems very improbable. For onething, we deliberately focus on median wages — again, those at the very center of the incomedistribution — and these (unlike average wages) are insensitive to movements at either tail ofthat distribution, among the very poor or the very well-off. For a second thing, even beforeW2, the welfare population in Wisconsin was only a tiny fraction of the total workforce. It’ssimply not big enough to make much difference in the aggregate numbers.
Productivity Has Turned Around
Finally, some point to the nation’s strong recent showing in annual productivitygrowth as evidence that our time of troubles is now behind us, and that, inevitably, adversewage trends will be reversed. We certainly welcome the recent productivity numbers, andindeed do think that they point to an economy that, at least on this measure, isfundamentally more vibrant than in the recent past. But productivity growth per se doesn’t
80
90
120
100
110
130
140
150
Ind
ex
(1973
=100)
Compensation-Median
Compensation-Median Male
Compensation-Average
1973 1988 19981978 1983 1993
Productivity

49
Toward a Policy Agenda for Working Wisconsin
guarantee that the benefits will trickle down to workers. As Figure 6.1 makes clear, medianwage growth has long lagged substantially behind productivity growth, and has continued toeven during the recent productivity upsurge. Presently, workers are nearly fifty percent moreproductive than they were in 1973, but even average compensation is just over 15 percenthigher than its 1973 value, and among men, and at the median, the news is substantiallyworse. Men are still below their levels of 25 years ago, and the overall median is only a tinybit above it. If this trend is allowed to continue, we’ll have an ever more productive economy,but again one in which the fruits of that effort and intelligence are not widely shared.
Building the High Road in WisconsinWisconsin’s current economic strength permits us to pursue a more inclusive future
for Wisconsin residents. We can choose to embrace and extend Wisconsin’s egalitarian past,and to expand it into the future, but to do so will require careful thinking, bold strategies,and new coalitions. And that means that at least part of what must happen is to let thediscussion on the economy begin. Discussion about the state of our state needs to happenthroughout Wisconsin — inspired by community and faith-based groups, by leaders’ forumsand policy makers, by academics and activists. We offer this report as a contribution to agrowing statewide dialogue on what economic growth has meant for the working families ofWisconsin and what paths our future should follow.
Crafting the solutions for sustaining a shared prosperity will not be a simple process.There is no single “magic bullet” that can ensure it. We do not presume to have all theanswers, but some of what needs to be done is clear enough. Preserving Wisconsin’straditions, and extending our economic prosperity, requires an agenda to improve the qualityof jobs, support working families, reduce racial disparity, and strengthen our cities.
Improve Job Quality in the StateWisconsin’s economic strength affords us the opportunity to make strategic choices
about economic development. This is the chance to raise the floor at the bottom of the labormarket and close off the low-road, low-wage option in the state. To ensure that economicstrength brings prosperity to all we should strengthen the minimum wage and unions,support education and training initiatives, improve business accountability, and increaseemployee ownership in the state.
Raise and Index the Minimum Wage
Increasing the earnings for workers at the bottom of the labor market is one directway to make work pay. Contrary to the popular image, most minimum wage workers aremaking direct contributions to family income.
Increase the state minimum wage and index it for inflation. Ten states have minimumwages higher than the federal level. Washington State, for example, recently enacted anincrease to $6.50 per hour, effective in January 2001, with indexing for inflation insubsequent years.

50
State of Working Wisconsin
Support and Expand Worker Representation
Unions in Wisconsin have a strong history of promoting workers’ interests, promotinghigh-road economic development, and increasing the incomes of state residents. Unions arealso key partners with managers in finding ways to invest in workers. For these reasons, weshould continue to support Wisconsin’s union heritage and look for ways to expand coveragein the state. We should also experiment more, as have other states, in harnessing workerrepresentation as a tool for regulatory enforcement and industrial upgrading.
� Support Project Labor Agreements between contractors and building tradesunions that set the terms and conditions for management and labor onconstruction projects. Last session the Wisconsin Assembly proposed to ban suchagreements on publicly-funded construction projects. That was a mistake.
� Oppose so-called “paycheck protection” laws which severely limit the ability ofunions to defend the interests of their members and those of workers generally.
� Encourage more constructive labor-management relations by including a check onmanagement practice (for example, its record of labor law violations) in publiccontracting.
� Support those unions and firms that are working together, rather than atloggerheads, through state funding of “high road partnerships” betweenmanagement and labor.
Support Education and Training Initiatives that Build Career Ladders
Even as low-wage workers struggle to get out of the low-wage job trap, employers insome of Wisconsin’s best paying industries are struggling to find qualified workers.Wisconsin is in an ideal position to overcome the skills gap in ways that payoff for bothbusinesses and workers. Wisconsin also is home to one of the nation’s premier industrypartnerships, the Wisconsin Regional Training Partnership (WRTP), a partnership of morethan 60 firms in Milwaukee’s durable manufacturing sector that has implemented strategiesto overcome the gap in the Milwaukee region.
� Implement and expand workforce development and training initiatives for thecurrent workforce that allow people to move into family supporting jobs.
� Expand and replicate comprehensive partnerships in leading industries thatsupport technology upgrading, workplace education, and employment assistancefor disadvantaged workers.
Improve Accountability in Economic Development Assistance
Wisconsin provides tens of millions of dollars in economic development to firms everyyear in the name of creating and retaining jobs. Despite the huge amount of money involvedthere is very little reporting to determine if recipients lived up their promises, whether jobswere created or retained, or that the firms we subsidize are supporting working families. It isreasonable to expect accountability and cost-effectiveness in business subsidies funded byWisconsin’s taxpayers.

51
Toward a Policy Agenda for Working Wisconsin
� Implement a reporting system similar to those in Minnesota and Maine to answersuch questions as: how many jobs were created or retained, what were the wagesand employer-provided health care benefits of those jobs, and in what industrieswere those jobs.
� Require local and state agencies to develop criteria for awarding subsidies,including a policy for wages and benefits for newly-created jobs. Requirecompanies that fail to meet their wage and job creation goals within a reasonabletime frame to pay back, with interest, at least a prorated amount of thedevelopment assistance.
Increase Employee Ownership
The Green Bay Packers are famous as an example of a community-owned team thathas maintained above-average winning records, and visited more than a few Super Bowls.Nationally, firms with significant employee stock ownership have outperformed thosewithout, no doubt in part because having an ownership stake in firms gives workers addedreason to be productive.
� Encourage the development of employee stake generally — in the form of workercooperatives, general stock ownership corporations, Employee Stock OwnershipPlans, and other means to “share the wealth.”
� As in Canada, encourage regional investment in high-roading firms throughinvestment funds dedicated to that purpose. Capitalized through worker savings,and encouraged by state tax credits, such funds have shown their capacity to giveworker investors a market rate of return, while promoting desirable employmentin their region — in effect, a double dividend from their investment. And theimproved employment and tax base their investments generate, the Canadianexperience also makes clear, more than make up for the cost of state incentives totheir creation.
Support Working FamiliesWisconsin’s families are working more than ever before. This is a chance to direct
state policy in ways that support families and allow families that are playing by the rules tomake ends meet. To ensure that our working families have the support they need to thrive,we should expand the earned income tax credit, support quality childcare and accessiblehealthcare, and make the state’s taxes more progressive.
Expand the Earned Income Tax Credit
The Earned Income Tax Credit (EITC) provides a tremendous boost to the incomes ofworking poor families. However, the current structure of the federal credit penalizes familieswho earn more. The following change would mitigate the existing work penalty:
� Adjust the federal EITC so it phases out more slowly (as income increases) andexpand the credit for married, two-earner couples. These changes are included in

52
State of Working Wisconsin
a proposal by President Clinton and a plan endorsed by Wisconsin CongressmanPetri. (These changes to the federal EITC would also indirectly boost Wisconsin’sown EITC, since it is linked to the federal credit.)
Make Quality Childcare Affordable
Wisconsin, like most other states, faces a host of challenges in providing access toquality child care for working families. One of the most expensive items in a family’s budget,full-time licensed care typically costs upwards of $7,000 per year. The followingrecommendations would make Wisconsin’s already innovative childcare subsidy programmore successful:
� Make the Wisconsin Shares childcare subsidies more accessible to parentsenrolled in higher education programs;
� Explore the feasibility of expanding access to childcare subsidies to families withincomes up to 250% of the federal poverty line (as allowed by federal rules) toaddress the current “cliff effects” in the childcare subsidy program that occurwhen families reach income limits, and lose benefits before they are able to coverthese costs independently.
� Support pilot initiatives to improve the quality of care for children by improvingthe quality of jobs for child care workers.
Extend Health Insurance
In recent years, Wisconsin has taken significant steps forward to ensure thatincreased numbers of low-income workers have access to health insurance. The state’sinnovative BadgerCare program (which essentially expands access to Medicaid to low-incomeworking families) is generally considered to be a success, with more than 60,000 peopleenrolled. However, specific policy changes are needed to continue the state’s progress inimproving access to health insurance for uninsured low-wage workers and their families,including:
� Eliminate or reduce the BadgerCare premiums that have proven to be a significantimpediment to enrollment for families over 150% of the federal poverty line;
� Assess the feasibility of expanding BadgerCare coverage to families with incomesup to 250% of the federal poverty line (as federal rules allow).
Make Taxes More Progressive
The current tax structure in Wisconsin is clearly regressive — requiring more fromthose who are poor than from those who are rich. We should change that. However done, it isabsurd that our poorest workers now face a higher state and local tax rate than the rich. Thecorporate sector in Wisconsin provides about 6% of the state’s general purpose revenues.Still, the corporate sector received a $64 million annual property tax break in the 1997-1998legislative session, and sought an additional $80 million income tax break in the session justended.

53
Toward a Policy Agenda for Working Wisconsin
� Oppose single sales factor corporate tax apportionment in order to maintain amore equitable distribution of tax burdens between smaller in-state firms andmulti-state corporations.
� Preserve the newly created personal income tax exemption and the increasedstandard deductions to partially offset the overall regressivity of Wisconsin’s taxstructure.
Reduce Racial Disparity by Focusing on Education and TrainingOn indicators from unemployment to wages to child poverty, Wisconsin exhibits
extreme racial disparity. The state’s prosperity allows us the opportunity to makeinvestments that can help close that gap. Moreover, public policy must eliminate structuralbiases in our social institutions and barriers in our economy that reproduce racial inequality.Our egalitarian tradition requires us to pursue such a course that ensures minorities in thestate have the same access to opportunity:
� Reform the current system of funding primary education to ensure constitutionaladequacy and modify the system of revenue caps that limits the ability of localeducators to repair facilities, retain teachers, and improve educational programs.
� Prepare non-college bound high school students for the transition from school-to-work.
Rebuild Our Metro Areas and Discourage Statewide SprawlFrom Milwaukee to Green Bay, Eau Claire to Superior, Wisconsin’s cities and their
surrounding metropolitan regions are facing substantial challenges — including the lossthrough sprawled development of tax base and employment, and the need to raise taxes andfees or cut services because of the freeze on state shared revenue since 1995.
At the same time, our state’s rural and agricultural heritage is threatened by outdatedpolicies and the pressures of suburban development. We are daily converting hundreds ofacres of farmland to housing developments and low-wage industrial sites.
As a state we want to discourage sprawl and reverse its effects on our metro areas andrural landscape alike. Sprawl is wasteful of older infrastructure. It destroys the environmentand raises the costs of “managing” the environment left behind. Sprawled development costsmore per individual to support than dense development. We need policies that concentratehousing and production, and harness the productivity effects — from shared knowledge,easier joint production, denser tax base, and more — that follow from their concentration.
� Encourage regional policies that are neither “state” nor “local” which capturenatural linkages in our metro areas and promote regional equity through tax basesharing or functional consolidation of service delivery.
� Promote cooperative urban redevelopment strategies that create family supportingjobs, restore old “brownfields” sites, and return economic opportunity lost tosuburban sprawl. Milwaukee’s Menomonee River Valley is one example ofsuccessful public/private redevelopment strategies.

54
State of Working Wisconsin
� Use the state’s recently enacted “Comprehensive Planning” law to control growthand reduce costly, inefficient development. Controlling sprawl, however, requiresmore than planning and demands multiple strategies for transportation, housing,stormwater run-off, and more.
* * * * * * *
Taking these steps would begin to improve the situation of Wisconsin working familiesand their children, relieve our environment, and strengthen our industrial base. Of course,enacting such a program will be an enormous task, and one requiring the cooperation ofparties more accustomed to conflict — business and labor, Republicans and Democrats,suburbanites and central city residents, the public and private sectors. What is most difficult— what requires courage — is taking the first step.
We can start by making sure useful, understandable information about our economyis available to citizens of this state. It is this purpose, above all, that The State of WorkingWisconsin 2000 is meant to serve — to help inform and widen popular discussion of theeconomy. It is important too that we make our political leaders’ choices about our economicfuture more visible to citizens, and more accountable. We should increase the transparencyof our legislative and state budget processes, and once more put organized people, notorganized money, in command of their direction.
In the end, though, it bears emphasis that the choices facing us are not about partiesor partisanship, but about our coherence and welfare as a people. As an ancient Declarationreminds us, the basic purpose of democratic government is to further the collective “pursuitof happiness.” Achieving that purpose today, simply and clearly, requires changing the waythat we do business, and government, in this state.

55
Table & Figure Notes
Data Sources &Methodology
The State of Working Wisconsin relies on a range of data sources. The particularsource or sources relied on for any given Table or Figure are identified with them, withnotation as described in the Table and Figure Notes which follows this appendix.
Current Population Survey & Decennial Census
Our primary source is annual U.S. Bureau of the Census compilations of the CurrentPopulation Survey (CPS). From these, the National Bureau of Economic Research (NBER)develops the CPS Outgoing Rotation Group (CPS-ORG) file. This file has been adapted by theEconomic Policy Institute (EPI). We relied on EPI’s version of the file for all of our tabulationsand calculations, except for our calculations of labor force participation, for which we usedthe NBER version of the file, since the relevant variable had been dropped from the EPIversion.
We chose to base our analysis on CPS-ORG data because we believe it is the bestsource for analyzing state and national level wage trends. Unlike the “average wage” seriesproduced by the U.S. Department of Labor, CPS data permit calculation of individual hourlyearnings and the linkage of earnings to demographic characteristics such as race, sex, andeducational attainment. The CPS sample also includes a wide range of workers andemployment situations, and permits comparison between Wisconsin workers and thoseelsewhere. The sample used in our analysis for wage calculations includes all wage andsalary workers with valid wage and hour data. We include all respondents between 18 and 64(inclusive), but exclude the unincorporated self-employed. We exclude individuals withhourly earnings less than $0.50 per hour and more than $100 per hour, in 1989 CPU-X1adjusted dollars. CPS demographic weights were applied to make the sample representativeof the population. All of this is standard in CPS analyses. In the case of labor forceparticipation (for which we used the NBER version of the ORG file), we included the workingage population 16 and above.
In 1994, the CPS altered its categorization for education. Up until then, CPSrespondents were asked their highest grade completed. Since then, they have been asked thehighest degree received. While these two schemes are not perfectly comparable, they providereasonable consistency, especially given the broad educational groups on which this analysisis based. Here we group individuals into four educational categories: high school dropouts,high school graduates, 1-3 years of post high school, college graduates. In the years before1994 we assign individuals with less than 12 years of schools to the first category, those with
56
State of Working Wisconsin
12 year to the second, those with 13-15 to the third, and those with 16 or more to the fourth.For years after 1994, the assignment of those reporting high school or college degrees isstraightforward. Those who report no degree are classed as dropouts, and those reportingany of range of technical or associate degrees are classed in the “1-3 years of post highschool” category, as are those who report having begun college but not completing it.
In addition to the CPS, we sometimes rely on the 1990 U.S. Census. This is obviouslydated, but provides the last reliable source for a variety of more specialized questions,particularly regarding the status of children and racial minorities.
Real Median Wages
In general, we present trends in real median hourly wages. “Real” means inflation-adjusted — in our case, through the standard Consumer Price Index (CPI-U-X1, which,starting with December 1982, is identical to CPI-U). “Median” means the center of adistribution, above which half the distribution lies and below which half lies.
The alternative expression of average wage trends is in terms of an actual average, or“mean,” calculated simply by taking all wages for a population and dividing by its number ofmembers. We disfavor this approach in general on the grounds that means can misleadbecause of outliers in the distribution — in the U.S. today, usually high-income outliers thatdrag them unnaturally up — can blur the picture of what is happening to most people. In thecomparison of Wisconsin to the nation, moreover, the use of means unnaturally disfavors uson grounds of which we should be proud: we have a comparatively equal distribution ofincome, and so less opportunity for upward dragging. Compared to the rest of the nation,then, Wisconsin mean wages look worse than our median wages do, but only because wehave less inequality.
In the CPS, respondents can answer the question regarding wages in one of two ways.If they are paid an hourly wage, they simply report that wage which is used in the analysis. Ifthey are paid on a salary basis, they report their weekly earnings and their usual hours ofwork in a given week. To estimate their hourly wage, we then divide earnings by usual hours.
57
Table & Figure Notes
Table & Figure Notes
Frequently Cited SourcesThe following abbreviations are used throughout the table and figure notes.
CPS – U.S. Department of Labor. Bureau of Labor Statistics, Current Population Survey1979-1997. See appendix on methods for data sources. Two versions of the CPS were used:one provided by the National Bureau of Economic Research and one provided by theEconomic Policy Institute. These are referred to as CPS (NBER) and CPS (EPI) respectively.
EPI – Economic Policy Institute, Washington D.C. (Web site is at http://www.epinet.org/)
DWD UI - Department of Workforce Development, Unemployment Insurance: This is a 5%sample of wage records drawn from the Unemployment Insurance data files that aremaintained by the State of Wisconsin, Department of Workforce Development. The samplewas given to COWS under a license designed to maintain the confidentiality of individualrecords; we therefore report only aggregate data. A worker’s quarterly wage record wasincluded in this sample if he or she held that same job in the previous and followingquarters. This was done in order to ensure that the quarterly earnings reported representearnings for a full quarter of work, not just some part of that quarter.
Table Notes
Chapter 1
1.1 Employment and Employment Growth in the Midwest, 1969–99. EPI, State ofWorking America, 2000–01.
1.2 Wisconsin Employment, Wages, and Number of Establishments, by Industry, 1998.Wisconsin Department of Workforce Development. Current Employment and Wages(CEW) Table 209. Internet address as of 8/23/00: http://www.dwd.state.wi.us/dwelmi/cew_Tbl209_yearly.htm/.
1.3 Population and Population Growth in the Midwest and U.S., 1990–99. U.S. CensusBureau, State Population Estimates. Internet address as of 8/23/00: http://www.census.gov/population/www/estimates/statepop.html/.

58
State of Working Wisconsin
1.4 Wisconsin’s Population Growth, 1990–2000. 1990 data: U.S. Census Bureau,Population estimates for States by race and Hispanic origin. Internet address as of 8/23/00: http://www.census.gov/population/estimates/state/srh/srhus90.txt/. 2000 data:U.S. Census Bureau, State Population Projections. Internet address as of 8/23/00:http://www.census.gov/population/projections/state/stpjrace.txt/.
1.5 Labor Force Participation in Wisconsin and the U.S. For 1980, 1990, and 1999: CPS(NBER). 1970 numbers for Wisconsin are from the 1970 Census, Wisconsin statevolume. 1970 numbers for the U.S. are from U.S. Department of Commerce, Bureauof the Census. Statistical Abstract of the United States: 1999, Table 650, p. 411.
1.6 Educational Attainment of Wisconsin Workers, 1979 and 1999. CPS (EPI).
Chapter 2
2.1 Median Income for Four Person Families, Wisconsin and U.S., 1974–98. EPI, State ofWorking America, 2000–01.
2.2 Median Income for Four Person Families in the Midwest and U.S., 1974–98. EPI, Stateof Working America, 2000–01.
2.3 Poverty Rates in the Midwest and U.S., 1988–89 and 1997–98. EPI, State of WorkingAmerica, 2000–01.
Chapter 3
3.1 Wisconsin Family Income Trends: Average Family Income of the Richest, Middle, andPoorest Fifths of the Income Distribution, late 1970s to late 1990s. Pulling Apart,Economic Policy Institute and Center on Budget and Policy Priorities, January 2000(CBPP Web Site is at http://www.cbpp.org/).
3.2 Wisconsin State and Local Taxes by Income Group, 1998. Institute on Taxation andEconomic Policy, Notes on the Current Wisconsin Tax System. April 20, 2000.
3.3 State and Local Tax Rates as a Share of Family Income Quintiles, 1995. EPI, State ofWorking America, 2000-01.
Chapter 4
4.1 Median Hourly Wages, Wisconsin and the U.S., by Sex and Race. CPS (EPI).4.2 Median Hourly Wages for Full-Time Workers. CPS (EPI).4.3 The Gender Gap in Wages: Ratio of Women’s Median Wage to Men’s. CPS (EPI).4.4 Median Hourly Wages, Wisconsin and U.S., by Sex and Education, 1979–99. CPS
(EPI).4.5 Median Industry Wages in Wisconsin, 1979–99. CPS (EPI).
Chapter 5
5.1 Share of Wisconsin Workers Earning Poverty Wages. CPS (EPI).5.2 Characteristics of Wisconsin Workers, 1999. CPS (EPI).

59
Table & Figure Notes
Figure Notes
Chapter 1
1.1 Economic Growth in Wisconsin and the U.S., 1969–99. Bureau of Economic Analysis,U.S. Department of Commerce. Regional Accounts Data, State Personal Income.Internet address as of 8/23/00: http://www.bea.doc.gov/bea/regional/spi/.
1.2 Unemployment in Wisconsin and the U.S., 1979–99. Bureau of Labor Statistics, U.S.Department of Labor. Local Area Unemployment Statistics. Internet address as of 8/23/00: http://www.bls.gov/news.release/laus.toc.htm/.
1.3 Labor Force Participation, Wisconsin and U.S., 1990–2000. CPS (NBER), 1990, 1999.1.4 County Variation in Wisconsin’s Per Capita Income. Wisconsin Department of
Revenue, Per Capita Personal Income. Internet address as of 8/23/00: http://www.dor.state.wi.us/ra/8tb69297.html/.
Chapter 2
2.1 Poverty Rate in Wisconsin and U.S., 1980–98. Bureau of the Census. Internet addressfor U.S. data as of 8/24/00: http://www.census.gov/hhes/poverty/histpov/hstpov9.html/.Internet address for Wisconsin data as of 8/24/00: http://www.census.gov/hhes/poverty/histpov/hstpov21.html/.
2.2 Share of Working Families with Children that were Poor, 1970s to 1990s. Center onBudget and Policy Priorities, 1999. The Poverty Despite Work Handbook. Washington,DC: Center on Budget and Policy Priorities. Table 28, p. 90.
Chapter 3
3.1 Income Change for Families Late 1970s to Late 1990s, by Fifth of Families (PercentChange). Pulling Apart, Economic Policy Institute and Center on Budget and PolicyPriorities, January 2000.
3.2 Booming Economy, Rising Inequality: Income Change by Fifth of the IncomeDistribution, Late 1980s to Late 1990s. Pulling Apart, Economic Policy Institute andCenter on Budget and Policy Priorities, January 2000.
3.3 Wisconsin State and Local Taxes by Income Group, 1998. Institute on Taxation andEconomic Policy (ITEP), Notes on the Current Wisconsin Tax System. April 20, 2000.(ITEP Web site is at http://www.ctj.org/itep/).
Chapter 4
4.1 Real Median Wage, Wisconsin and U.S., 1979–99. CPS (EPI).4.2 Median Wages by Sex, Wisconsin and U.S., 1979–99. CPS (EPI).4.3 Wisconsin Workforce Distribution Across Industry, by Sex, 1999. CPS (EPI).4.4 Wisconsin’s Median Wage Gender Gap by Industry, 1999. CPS (EPI).4.5 Men’s Real Median Wages, Wisconsin and U.S., 1979–99. CPS (EPI)4.6 Women’s Real Median Wages, Wisconsin and U.S., 1979–99. CPS (EPI).4.7 Change in Real Median Wages by Industry, 1979–99, and Percent of Workforce in
Each Industry, 1999, Wisconsin. CPS (EPI).
60
State of Working Wisconsin
Chapter 5
5.1 Percent of Wisconsin Workers with Poverty Wage Jobs, 1979–99. CPS (EPI).5.2 Industry Distribution of Wisconsin Workers, 1999. CPS (EPI).5.3 The Persistence of Low Quarterly Earnings over Time in Wisconsin. DWD UI.5.4 Percentage of All Poverty Wage Workers, by County, 1997 and Within Each County,
Percentage of Workers with a Poverty-Wage Job, 1997. DWD UI.
Chapter 6.
6.1. Productivity and Hourly Compensation Growth, 1970–98. Economic Policy Institute,State of Working America, 2000–01.

61
Table & Figure Notes
County Data
Sources for County-Level Data
Population, July 1999, estimate and Population, 1990.U.S. Bureau of the Census. Internet address as of 9/13/00: http://www.census.gov/population/estimates/county/co-99-1/99C1_55.txt/.
Unemployment, May 2000.Wisconsin Department of Workforce Development. Internet address as of 9/13/00:http://www.dwd.state.wi.us/notespub/DWDWebMa/36f6_536.htm#Bycounty /.
Civilian Labor Force, May 2000.Wisconsin Department of Workforce Development. Internet address as of 9/13/00:http://www.dwd.state.wi.us/dwelmi/laus_view_current.htm/.
Total Employment and Manufacturing Employment, 1990 and 1998.U.S. Bureau of the Census, County Business Patterns. 1990 data obtained from third-party web site at (as of 9/13/00): http://fisher.lib.virginia.edu/cbp/ 1998 data obtainedfrom Census site (as of 9/13/00): http://tier2.census.gov/cbp_naics/index.html/.
Labor Force Participation, 1997.Data provided by the Wisconsin Department of Workforce Development in response toa request.
Per Capita Income, 1992 and 1997.Wisconsin Department of Revenue. Internet address as of 9/13/00: http://www.dor.state.wi.us/ra/0800copi.html/.
Share of Poverty-Wage Jobs, Within County and Within State.Calculated from a 5% file of unemployment insurance records provided to COWSunder license by the Wisconsin Department of Workforce Development.
W2 Caseload Data, Food Stamps, Medical Assistance, & Child Care Assistance, July 2000.Data provided by the Wisconsin Department of Workforce Development in response toa request.

62
State of Working Wisconsin
���������� ��� ������� ����� ������������� ���������� ���� ���� ����� ���������������������������������� �����
������ ������� ����������� �� ������� !�"# ����$�� ���% ����&��� ���� ���' ����$�' ���� ���' ����$�'
��������� ������ �� ������ ���� ����� ������ � ������ ������� ���� ����� ���� � ��
����� ���� ��� � ���� ���� ���� ����� ��� � �� ��� � ���������� ����� ����� ��� �� ���� � ��� ��� ���� �� � ����������� ����� ���� �� ���� ���� ���� ��� ���� �� ���� ����������� � ��� ����� �� �� �� � ����� ����� ��� ��� �� � ������� �� ��� ������ ���� ��� � ����� ���� ������� ��� ����� � ���� ���������� ���� � �� ��� ��� ����� ����� ����� �� ��� ��� ���������� ���� � ���� � �� � ���� ��� ����� � �� �� ���� ���� ������ � ���� ������ ��� �� ����� ��� ����� ���� ���� ���� ��� ��!!��� ����� � ���� �� � �� ������ � ��� ��� � ��� ��� ���� ���� ���" ��� � ��� �� �� ���� ����� ��� ��� ��� ����� ��� ��� ����#�� ��� ���� � �� � � ����� ���� ����� ���� � �� ��� � ������� ���� � ���� ��� ���� ����� ���� ����� ���� ����� ��� � ���$��� ����� ���� ��� ��� ������ ���� �� ��� ���� � ���� ����� ��$��%� ����� �� � ��� �� �� � ���� ����� ���� ������ ���� ����$��� ����� ������ �� ��� ���� �� ������ ���� ����� ���� ��� $��%��� ���� ���� ��� ���� ������ ����� ������ ���� ����� ����� ��� $��� ������ ����� ��� � �� ������ ����� ����� � � ����� ����� ���&��' ����� ���� ��� � �� ���� � ��� ����� ����� ��� ����� �� � ���(�����)� ���� ���� ���� � ����� � ��� ��� ��� �� �����(���'��'*�) ����� � ���� ��� ��� � ���� � �� ���� ��� ������ ��� � � (����� ��� ��� ���� �� �� � �� � ����� ���� � � � �����+���� ��� ���� ��� ��� ���� ��� �� ������ ��� ���� ����� ����+���� ������ ��� � ��� ���� ���� ������ ����� � �� ����� ��� � ���+����'*�"� ���� ����� �� ���� ��� �� ���� ��� �� ����� ���� � ��,��� ������ ����� ���� ��� � ���� ��� ����� �� ��� � ����,��� ���� ��� �� �� �� �� ��� ���� � � ��� � �����-�)"��� ��� ����� ��� �� ���� ��� ���� ��� � � ����-�������� ���� � ���� ��� ��� ���� ��� �� ����� ���� ���� ����� ���-����� ����� � ���� ���� ��� ���� ��� ��� ��� ����� ��� ���.������ ����� � ���� � �� ��� ���� ���� ��� ���� ����� ����� ���.������� ��� ���� �� ���� ������ ��� ����� ���� ���� ���� ���*�' ����� ����� ���� � � ���� ������ ���� ������ ��� ������ ��� ���*�������� ���� ����� ���� �� �� ����� �� � ���� ��� � ����*��%���� ������ ����� �� ��� ����� �� �� ���� ��� �� �� �� �� � ��*��)��� ����� ���� � ���� ���� � ��� �� ��� ��� ���� ���� ��� /�������) �� �� ���� ��� ���� ���� ����� ������ ��� ����� ����� � �/������� ���� �� ����� ��� ���� ����� ��� ���� ���� ��� ���� ���/�������� ��� ����� �� � ���� ����� ������ ��� � �� ��� ���/��0����� ������ ���� � �� ��� ����� ����� ����� �� � ����� ���/�������� ���� ����� ��� �� ���� ��� ��� � ����� ��� ��� ���/�����"�� ������� ���� ���� �� ������ ����� ���� ��� ������ ���� �����/����� ���� ������ � ���� ������ ������ ������ ��� ���� �� � ��� 1)���� ����� � ��� ���� ��� ����� ��� ���� ���� ����� ����� ���1����� ����� ����� ��� ���� ����� ��� ����� ��� ���� ���� ����1���%���� � ����� ��� � ��� �� ���� � ���� ���� �� ��� �� ��� � ����12��"�� ����� ����� ��� ��� �� �� � ����� ���� ���� ������ � ��3�!�� ����� ����� �� �� ��� ����� ���� �� ��� �� ���3���)� ����� ����� ���� �� ����� ��� � ���� ����� ���� ����� ��� 3��" � ���� ����� ���� �� ��� � �� ����� �� ���� ��� ���3����%� �� �� ����� ��� � �� ����� ��� � ���� ���� ��� �� �� ���3��)� ����� ������ ���� ��� ��� � ����� �� � ��� ��� ��� ���4�)��� ������ ������ �� � ���� � ������ ���� �� �� �� ������ ����4�)����� ������ ���� ��� �� ���� ���� ���� ��� ����� ���� �� 4�)" ������� ������� �� ���� ����� ����� ��� � � �� �� � ��� � ���4��" ������ ����� ��� ��� ���� ����� �� �� ����� ����� ��5��' ���6 ������ ����� ���� ��� ����� ������ ��� � �� ���� ���� ���5��" ���� � ��� ��� �� ������ ���� � �� � ��� ���� � � ���5����� � ��� ����� � � ��� �� � �� �� �� ���� �� �� ���� 5������ ������ ����� ��� ��� ������ ���� ����� � �� ����� ��� � �5��#��%�� ������ ������ �� ���� ���� ���� ������ ��� ����� ������ ��7����� ����� ������ ��� � � ��� ��� ���� ���� ���� ��� ����7���!������ ����� ���� �� � �� � �� � ���� ���� � �� �� � �� �� 8����� ����� ������ �� ��� � ���� ���� ����� ���� ����� �� ���8���� ������ ������ ��� ��� ������ ���� ��� ����� �� ��� � �9������� ������ �� ��� �� ������ � ���� ������ ��� ���� ������ ����9���#��� ������ ������ � �� �� ���� �� �� � � ���� � ��� ���9�����%��� ����� ������� ��� ��� ��� ����� ���� ��� ���� ���� �� 9��"���� �� ���� ��� � ��� �� ���� �� ����� ������ � � � �� ����� � ��9��!�)� ��� ����� ���� ��� ���� � ���� ����� ���� ����� ���� ��9������� ����� ���� ��� �� ���� ���� ���� ���� � � ���9����#�%� � ����� ������� ��� �� ���� ������ �� �� �� ������ ������ �����9��� ����� ����� �� ��� ����� ������ ����� �� ����� ���� �����

63
County Data
��������������� ����������� (& ���) �)��� ���� �!�*+,��� ����� ���%�)� ��!# ������������$(������!- (��� (������ .����! /!!�!���� �� )���
������ .��� ����� ������ ������ ���� .��!�)�����&��� ���& ���% ���&$�% ���% ���% ����&��� ����&��� ����&��� ����&��� ����&��� ����&���
��������� ���� � ���� � ���� ��� ������ ����� ��� ��� ������ ����� ������ ����
����� ��� � ��� � ���� ��� ��� �� �� �� �������� �� ���� ��� ��� ��� ���� � � � � ����� ������ �� ���� ���� ��� ��� ��� � �� ���� ����������� ��� ������ ����� ��� �� � � �� �� ������� ��� ����� ������ ���� �� ���� � �� �� ���� ����� �������� �� ����� ����� �� ��� ��� � � � �� �������� ��� ���� ������ ��� �� ��� � ��� � �� ������ ��� ������ ����� ���� �� ���� � � ��� � ��!!��� ��� ���� ������ ��� ��� ���� �� �� � ���� ��� ���" �� ���� ����� ���� ��� ���� � �� ���� �� ����#�� �� ��� �� ���� ��� ��� � � �� �� � � ���� � ������� ��� ���� � ������ ��� �� ��� � � � � � $��� ��� ��� ����� �� �� ���� �� ��� �� � ���� �� ��$��%� ��� ����� ������ ��� ��� ��� � �� �� ��� ���� �� $��� ��� ������ ������ ��� ��� ��� � �� ��� � �$��%��� �� ������ ���� ��� ��� ���� � �� � ���� ���$��� ��� ���� ������ �� ��� �� �� � �� ����� �&��' ����� ��� ��� ���� ���� ��� ��� �� �� �� ����� ����� ���(�����)� �� ��� � ��� ��� ��� ��� � � �� �� (���'��'*�) �� ������ ���� �� ��� ��� �� �� �� � ���� ��(����� � � ���� ����� ��� ��� �� � �� �� ��+���� �� ������ ���� �� ��� ��� �� � �� ��� �� � ��+���� ��� ����� ������ ���� �� ��� � � � ��� ��+����'*�"� ��� ���� ������ �� �� �� � � � ��� � �,��� ��� ������ ���� ��� ��� �� � � � � � ��� ��,��� �� ���� ����� ���� ��� ��� � � �� ��-�)"��� ��� ���� ���� �� ��� ���� � � � �� ��� ��-�������� ��� ����� ��� �� ��� ��� � �� ��� ����� �-����� ��� ���� ������ �� �� ���� �� �� � � � �� � .������ ��� ������ ����� ��� ��� �� ��� � � � � �� �� ��� ���.������� �� ����� ������ �� ��� ���� � � � � �*�' ����� �� ��� �� ������ �� �� ��� � �� �� ���� ��� ��*�������� ��� ����� ���� � � ��� ��� � � � � � ��*��%���� �� ������ ������ ��� ��� ��� �� � �� � � � �*��)��� �� ������ ������ ���� �� �� � � � ��� �� �/�������) ��� ������ ������ ���� ��� ��� � � � ��� ��/������� �� ���� ������ ���� �� �� �� � �� ��� � ����� ���/�������� ��� ���� ���� �� ��� ��� � � � � ��� �/��0����� �� �� �� �� ��� ��� �� � � � �� � �/�������� ��� ���� ���� ���� ��� ��� � �� ��� � � ��/�����"�� �� ����� ������ �� ��� ��� ��� ����� ���� ����� ��� �� ��� /����� ��� ����� ������ �� ��� ���� �� �� � � �� �� ���1)���� ��� ���� ���� ��� ��� �� � � �� �� ��1����� �� ������ ���� ��� ��� �� � � � �� �� �1���%���� ��� ������ ��� � ���� ��� � � �� � � �� ���� �� 12��"�� ��� ��� ����� ���� �� ���� � � � ��� ���3�!�� ��� ������ ����� �� ��� � � � � � � � 3���)� �� ����� ����� ���� ��� ��� � � � ��� �� �3��" ��� ���� ������ �� ��� ���� � � �� �� ����� ��3����%� ��� ����� ������ �� ��� ��� � � �� � ����� ��3��)� �� ����� ���� ��� ��� �� � �� ��� �� ��4�)��� � ��� � ������ �� �� ���� ��� �� �� �� � ��� �4�)����� �� ���� ���� � ��� ��� � � � ��� �� �4�)" � ���� � ������ �� ��� ��� ��� �� ��� ����� ��� ���4��" �� � � � ������ �� ��� ��� � � � � � � �5��' ���6 ��� ����� ����� ��� ��� �� � � �� � � ��� �5��" ��� ������ ��� ��� �� ��� �� �� � ����� ��5����� �� ����� ����� ���� ��� ��� �� ��� �� ���5������ ��� ������ ������ ���� ��� ��� �� �� �� ��� ��� �5��#��%�� ��� ��� �� � ���� ��� ��� ��� � �� �� �� �� � ��7����� ��� ��� ��� � ��� ���� � � � ��� �� ��7���!������ ��� ������ ��� � �� �� � � � �� ����� ��8����� ��� ����� ��� � ��� �� �� � � � ��� ��� �8���� �� ����� ������ �� ��� �� � � � �� ��� ��9������� ��� ��� �� ����� ��� ��� ��� � �� �� ��� ����� ���9���#��� �� ��� ������ ���� �� ���� � � � ��� � �9�����%��� ��� � ���� ����� ��� ��� ��� �� �� �� ��� ���� ��9��"���� ��� ���� � ������ ���� ��� ���� �� � �� ����� �� � �9��!�)� ��� ���� � ��� � � ��� �� �� �� �� ��� ��� ��9������� �� �� ��� � �� �� �� � � � �� � �9����#�%� ��� ���� � ��� ��� ��� ���� �� �� ��� ��� � ����� �9��� ��� ���� � ��� ���� �� ���� �� �� �� �� �� ��

64
State of Working Wisconsin