lateral confinement effect in shpb test of the sap
TRANSCRIPT
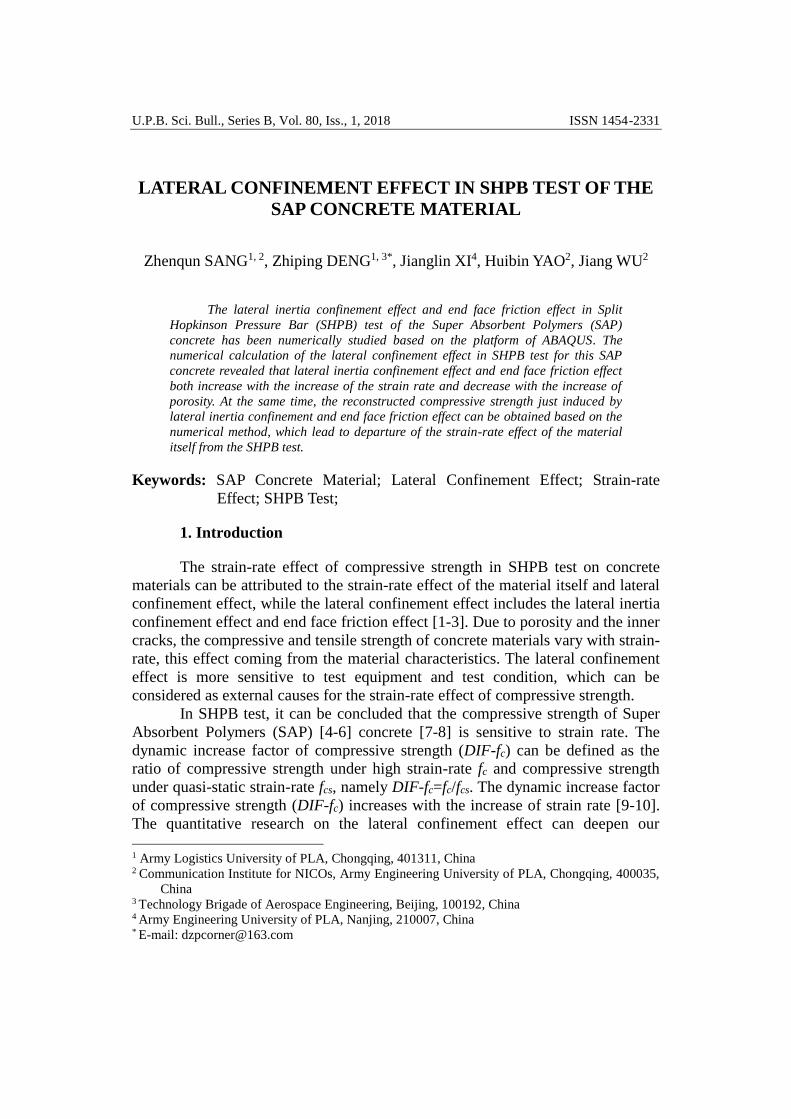
U.P.B. Sci. Bull., Series B, Vol. 80, Iss., 1, 2018 ISSN 1454-2331
LATERAL CONFINEMENT EFFECT IN SHPB TEST OF THE
SAP CONCRETE MATERIAL
Zhenqun SANG1, 2, Zhiping DENG1, 3*, Jianglin XI4, Huibin YAO2, Jiang WU2
The lateral inertia confinement effect and end face friction effect in Split
Hopkinson Pressure Bar (SHPB) test of the Super Absorbent Polymers (SAP)
concrete has been numerically studied based on the platform of ABAQUS. The
numerical calculation of the lateral confinement effect in SHPB test for this SAP
concrete revealed that lateral inertia confinement effect and end face friction effect
both increase with the increase of the strain rate and decrease with the increase of
porosity. At the same time, the reconstructed compressive strength just induced by
lateral inertia confinement and end face friction effect can be obtained based on the
numerical method, which lead to departure of the strain-rate effect of the material
itself from the SHPB test.
Keywords: SAP Concrete Material; Lateral Confinement Effect; Strain-rate
Effect; SHPB Test;
1. Introduction
The strain-rate effect of compressive strength in SHPB test on concrete
materials can be attributed to the strain-rate effect of the material itself and lateral
confinement effect, while the lateral confinement effect includes the lateral inertia
confinement effect and end face friction effect [1-3]. Due to porosity and the inner
cracks, the compressive and tensile strength of concrete materials vary with strain-
rate, this effect coming from the material characteristics. The lateral confinement
effect is more sensitive to test equipment and test condition, which can be
considered as external causes for the strain-rate effect of compressive strength.
In SHPB test, it can be concluded that the compressive strength of Super
Absorbent Polymers (SAP) [4-6] concrete [7-8] is sensitive to strain rate. The
dynamic increase factor of compressive strength (DIF-fc) can be defined as the
ratio of compressive strength under high strain-rate fc and compressive strength
under quasi-static strain-rate fcs, namely DIF-fc=fc/fcs. The dynamic increase factor
of compressive strength (DIF-fc) increases with the increase of strain rate [9-10].
The quantitative research on the lateral confinement effect can deepen our
1 Army Logistics University of PLA, Chongqing, 401311, China 2 Communication Institute for NICOs, Army Engineering University of PLA, Chongqing, 400035,
China 3 Technology Brigade of Aerospace Engineering, Beijing, 100192, China 4 Army Engineering University of PLA, Nanjing, 210007, China * E-mail: [email protected]

4 Zhenqun Sang, Zhiping Deng, Jianglin Xi, Huibin Yao, Jiang Wu
understanding of the strain-rate effect of the material itself and its mechanism [11-
15], meanwhile it can provide a more accurate material parameter in the design of
protection engineering. There is still a lack of relevant literature to discuss the
lateral confinement effect in SHPB test on SAP concrete, which has the
characteristics of porous materials.
In this paper, the lateral inertial confinement effect and end face friction
effect in SHPB experiment of the SAP concrete have been studied based on the
platform of ABAQUS.
2. Numerical Simulation of the Lateral Confinement Effect
2.1 Introduction to the Method
SAP concrete is a kind of porous material with spherical millimeter-size
pores inside the mortar matrix. The average diameter of the saturated SAP is
5mm. In the process of curing, the spherical saturated SAP beads can slowly
dehydrate and separate from the cement paste after shrinkage, and eventually
leave closed millimeter-size pores evenly distributed in the concrete. SAP
concrete have been used in the islands far from the mainland, to substitute the
normal coarse aggregate with saturated SAP and reduce the cost with
transportation of the normal aggregate.
Compressive strength of mortar matrix is related to hydrostatic pressure
inside the materials just like the concrete materials; the compressive strength
increases with the rise of hydrostatic pressure. This hydrostatic pressure
correlation is the internal cause for the lateral confinement effect in SHPB test. In
the numerical research, the "reconstitution" method is adopted, in which the
reconstructed stress - strain curve of the SAP concrete specimens through SHPB
test can be obtained based on the given quasi-static uniaxial compressive stress-
strain curve of the mortar matrix. Many classical dynamic constitutive model of
concrete can obtain the stress under dynamic loading σd based on the stress under
quasi-static loading σs(c) by introducing a enhancement factor ċ/ċs R(ċ) [13] ,
which is the ratio of the strength under dynamic loading σd and quasi-static
loading σs(c), into the constitutive equation, namely:
(c) ( )d s R c (1)
In "reconstitution" method, the material model is required to reflect the
hydrostatic pressure correlation of the materials while not considering the strain-
rate effect (namely the R(ċ)). So, this type of material model can simulate the
influence of the lateral confinement on the stress - strain curve under dynamic
loading. The variation between input stress-strain curve and reconstructed curve
can reveal the degree of deviation from basic assumptions for SHPB
experimental. The utilization of the material model not containing strain-rate
Lateral confinement effect in SHPB test of the SAP concrete material 5
effect of the material itself can attribute the strength enhancement effect in SHPB
test to other interference factors, such as friction, axial and lateral inertia effect
and so on.
2.2 Material Model of the Mortar Matrix
The numerical research conducted in this paper is mainly based on the
experimental data of SHPB test of the SAP concrete with different porosities,
which are 10%, 20%, 30% and 40% respectively, and under quasi-static loading or
dynamic loading with three strain rate levels of 70/s, 100/s and 140/s.
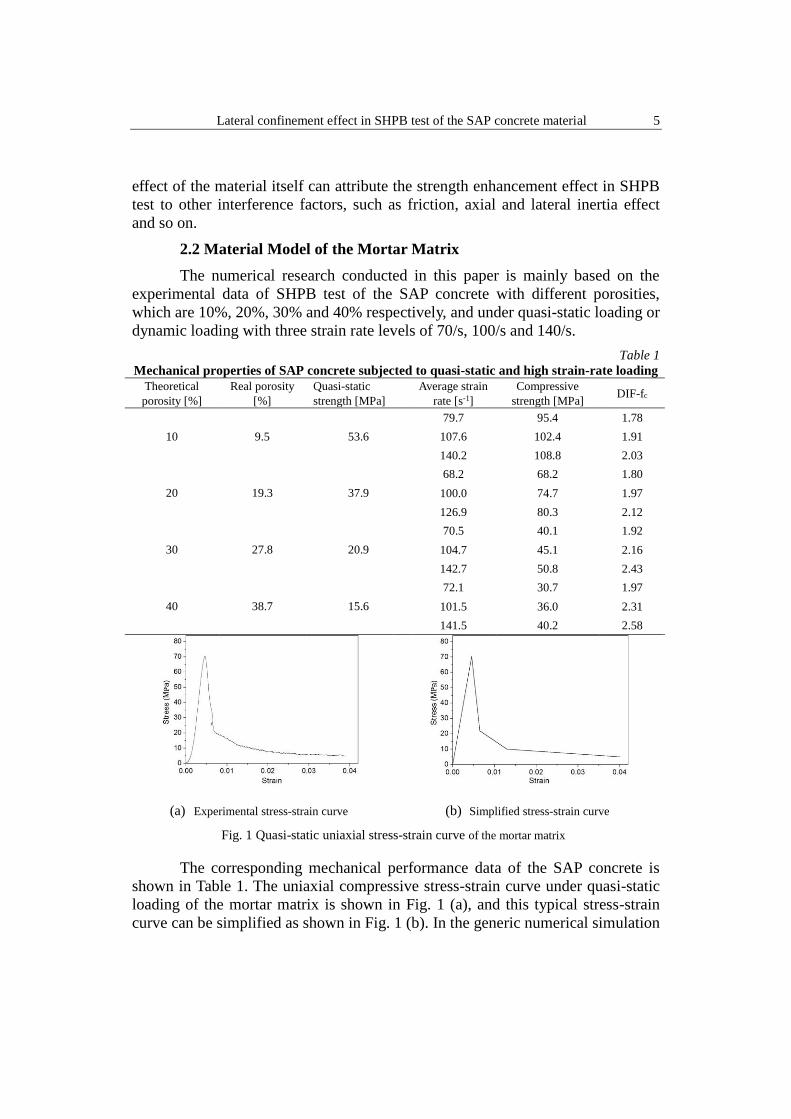
Table 1
Mechanical properties of SAP concrete subjected to quasi-static and high strain-rate loading
Theoretical
porosity [%]
Real porosity
[%]
Quasi-static
strength [MPa]
Average strain
rate [s-1]
Compressive
strength [MPa] DIF-fc
10 9.5 53.6
79.7 95.4 1.78
107.6 102.4 1.91
140.2 108.8 2.03
20 19.3 37.9
68.2 68.2 1.80
100.0 74.7 1.97
126.9 80.3 2.12
30 27.8 20.9
70.5 40.1 1.92
104.7 45.1 2.16
142.7 50.8 2.43
40 38.7 15.6
72.1 30.7 1.97
101.5 36.0 2.31
141.5 40.2 2.58
(a) Experimental stress-strain curve (b) Simplified stress-strain curve
Fig. 1 Quasi-static uniaxial stress-strain curve of the mortar matrix
The corresponding mechanical performance data of the SAP concrete is
shown in Table 1. The uniaxial compressive stress-strain curve under quasi-static
loading of the mortar matrix is shown in Fig. 1 (a), and this typical stress-strain
curve can be simplified as shown in Fig. 1 (b). In the generic numerical simulation

6 Zhenqun Sang, Zhiping Deng, Jianglin Xi, Huibin Yao, Jiang Wu
software ABAQUS, the expanded Drucker-Prager model can describe the
characteristics of the stress-strain relationship shown in Fig. 1, and can also reflect
the hydrostatic pressure correlation of compressive strength for the material while
not considering the strain-rate effect.
2.3 Expanded Drucker-Prager Model
The expanded Drucker-Prager model used in ABAQUS is obtained from
the classic Drucker-Prager elastoplastic model [16], which can reflect the stress
flow phenomenon of concrete due to internal friction associated with confining
pressure. Thus, the expanded Drucker - Prager model can better simulate the
strength increase with rise of confining pressure in concrete materials, and it can
be used to calculate the deformation development during the process of strain
hardening and strain softening in the framework of large deformation dynamics.
The expanded Drucker - Prager model and dynamic finite element algorithm used
in this paper are based on general computing platform of ABAQUS to eliminate
the differences in numerical calculation by different organizations, so that the
follow-up or other people's work can be compared.
3. Establishment of the Numerical Model
3.1 Simplified SHPB Device
The measured incident wave in SHPB experiment is set as the input of
numerical model to reduce model complexity and the amount of calculation,
which will also reduce the difference between numerical simulation and
experiment. In the numerical model, the simplification of the SHPB experimental
device is as following: the conical cross-section of incident bar is simplified to
uniform square section; the length of the incident bar is reduced to 800mm from
the original 3200mm; the length of the transmitted bar is reduced to 800mm from
the original 1600mm. The contraction in length of the incident bar and transmitted
bar can reduce the amount of computation and the time of computation in
condition of guaranteeing the accuracy and at least a full waveform transmitting in
the bars. The simplified test device is shown in Fig. 2, in which the location of the
strain gauge has considered the velocity and transmission time of the stress wave
in the bar. Thus, the recorded stress wave will not be superimposed by the
reflected wave on the interferences to obtain the full waveform. The “two wave
method” has been used to reconstruct the stress - strain curve of the specimen.

Lateral confinement effect in SHPB test of the SAP concrete material 7
Fig. 2 Schematic diagram of the SHPB set-up for numerical simulation
3.2 Parameters of the Material Model
The density of the pressure bar is known, and the linear elastic model is
used to describe its mechanical property; the relevant physical parameters are
shown in Table 2.
Fig. 3 Stress-strain curves in triaxial tests ((a),(b),(c)
is with the confining pressure of 14MPa, 28MPa
and 42MPa respectively)
Fig. 4 Fitting curve of the average
strength data in triaxial tests
The mechanical parameters of the mortar matrix under uniaxial
compression can be obtained from Figure 1, while the parameters such as the
friction angle β and the dilatancy angle Ψ of the expanded Drucker - Prager model
should be determined by a triaxial test. The compressive mechanical behavior
under confining pressure of 14MPa, 28MPa and 42MPa has been tested using a
rock triaxial test system with cylindrical specimens having a diameter of 50mm

8 Zhenqun Sang, Zhiping Deng, Jianglin Xi, Huibin Yao, Jiang Wu
and height of 100mm. During the triaxial test, the specimens were under uniform
confining (σ2=σ3) firstly and then the axial pressure stress σ1 was loaded on the
specimens. The stress difference σ1 – σ3, axial strain ε1, lateral strain ε3 and volume
strain εv=ε1+2ε3 have been recorded during the test, in order to obtain the relation
between the additional stress σ1 and the volume strain εv. A partial test result is
shown in Fig.3. A fit of the average compressive strength under different
confining pressure in the p - t plane (p is equivalent hydrodynamic pressure, t is
deviatoric stress) using linear fit is shown in Fig.4, from which the friction angle
for 46 ° of expanded Drucker-Prager model can be deduced. Park [17] has found
that the influence of dilatancy angle on the simulation of SHPB experiment can
almost be ignored in their numerical research on the impact property of mortar
plate using the expanded Drucker - Prager model. Thus, the value of dilatancy
angle Ψ can be equal to the friction angle β, which means that the deviatoric plane
parameter is K=1, indicating an associated flow rule of the model [18]. In Table 2,
the density, elastic modulus, Poisson ratio and compressive strength of the mortar
matrix are listed as the average value obtained for each specimen in triaxial test.
Table 2
Material properties involved in the numerical model
Material Density
[kg/m3]
Elastic modulus
[GPa]
Poisson
ratio
Compressive
strength [MPa]
Friction
angle β
Dilatancy
angle Ψ K
Pressure bar
7850 210 0.3 400 — — —
Mortar matrix
2172 24.2 0.21 70.5 46° 46° 1
3.3 The input Stress Pulse
Based on the SHPB test of SAP concrete with different porosities under
three different strain rate levels [9], the recorded incident stress waves in the tests
have been loaded as input stress pulse on the incident bar of the SHPB set-up
shown in Fig. 2.
(a) Specimen with porosity 10% (b) Specimen with porosity 20% Fig. 5 Input stress wave pulse on the input end of the incident bar
The typical incident stress waves for specimens with 10% and 20%

Lateral confinement effect in SHPB test of the SAP concrete material 9
porosity under different strain rates in the SHPB test are shown in Fig. 5.
3.4 Mesh Generation
To improve the mesh quality for dynamic calculation, the cross - section
shape of the pressure bar and specimen should be simplified: 1) for the pressure
bar, the circular cross - section was simplified to square cross - section with
original cross - section area, length and volume; 2) the cylinder specimen was
simplified to rectangular shape with the same thickness and volume. The
compressive strength of circular cross-section and square cross-section specimens
of mortar matrix have been tested under strain rate level of 70/s. The result is
shown in Fig. 6, in which the compressive strength and stress - strain curve are
close to each other. Thus, it is acceptable to use square cross - section specimen in
numerical calculation.
Fig. 6 Stress-strain curve of
specimens with circular and square
cross section in SHPB test.
(a)One-eighth of a cell (b) The meshed specimen Fig. 7 Mesh of one-eighth of the unit cell and specimen
with porosity 20%
Table 3
Parameter of the finite element model for specimen
Hole
diameter
[mm]
Theoretical
porosity[%]
Real porosity
[%]
Simulation
porosity [%]
Size of the cell
[mm]
Number
of holes
Number
of
elements
5
10 9.5 9.5 8.7656×8.7656×8.7656 196 84672
20 19.3 19.7 7.000×6.8930×6.8930 405 88290
30 27.8 29.2 5.9033×6.1667×6.1667 600 76800
40 38.7 38.5 5.700×5.4624×5.4624 792 101376
A trial calculation indicated that the mesh quality around the pores was the
main factor that influences the precision of calculation. To avoid hourglass effect
during calculation, the mesh quality must be guaranteed strictly. The structured
mesh technology and C3D8R (eight nodes three-dimensional stress reduced
integral unit) have been adopted to mesh the incident bar, transmitted bar and
specimens. Thus, the random holes originally contained in the mortar must be
arrayed in the numerical model based on the structured mesh, and the meshed
specimen possesses symmetry. The mesh of one-eighth of a cell and the meshed

10 Zhenqun Sang, Zhiping Deng, Jianglin Xi, Huibin Yao, Jiang Wu
specimen with porosity 20% are shown in Fig.7. Based on symmetry, this paper
only establishes a one-fourth model, which requires symmetrical boundary
conditions. The mesh parameters for specimen with different porosities are shown
in Table 3.
4. Lateral Confinement Effect
4.1 Lateral Inertia Confinement Effect
Without regard to the friction of the interface of specimen and bars
(namely the friction coefficient of the interface has been set to zero in the
numerical model), the reconstructed stress-strain curve, and average hydrostatic
curve can be obtained through the numerical calculation. Fig.8 shows the results
for specimen with 20% porosity under strain-rate level 100/s. The increment Δfc,lat,
which is the difference between the reconstructed compressive strength and quasi-
static compressive strength, varies with porosity and strain rate levels as shown in
Fig.9 and Fig.10. The peak values pc of the average hydrostatic pressure curve for
specimens with different porosities and strain rate levels are displayed in Fig.11
and Fig. 12.
Fig.9 and Fig.10 show that, under the same strain rate levels, the
reconstructed compressive strength increment Δfc,lat decreases with the rise of
porosity, which indicates that the growth of compressive strength is more close to
the response of the material itself for high porosity specimens in SHPB test. For
the same porosity, the reconstructed compressive strength increment Δfc,lat of the
SAP concrete specimen increases with rise of strain rate. The increment Δfc,lat with
rise of strain rate of specimen with lower porosity is larger than that of specimen
with relatively high porosity, which indicates that the reconstructed compressive
strength increment Δfc,lat is more sensitive to strain rate for specimen with low
porosity.
Fig.11 and Fig.12 shows that, under the same strain rate, the peak value of
the average hydrostatic pressure curve decreases with increase of porosity. For a
given porosity, the peak value of average hydrostatic pressure increases with the
increase of strain rate. The variation trend of peak value of the average hydrostatic
pressure curve with porosity and strain rate is consistent with reconstructed
compressive strength increment. In Fig.11, the four dotted lines represent 1/3 of
the quasi-static compressive strength of SAP concrete specimens. It can be
concluded form Fig.11 that, for each of the three high strain rate levels and four
porosities, the peak value of the average hydrostatic pressure surpasses 1/3 of the
quasi-static compressive strength and is even bigger than 1/2 of the quasi-static
compressive strength. The peak value of average hydrostatic pressure is higher
than 1/3 quasi-static uniaxial compressive strength fc,qua, which means that: 1) the
other two principal stress σ2, and σ3 are not equal to zero; 2) the specimen inside is
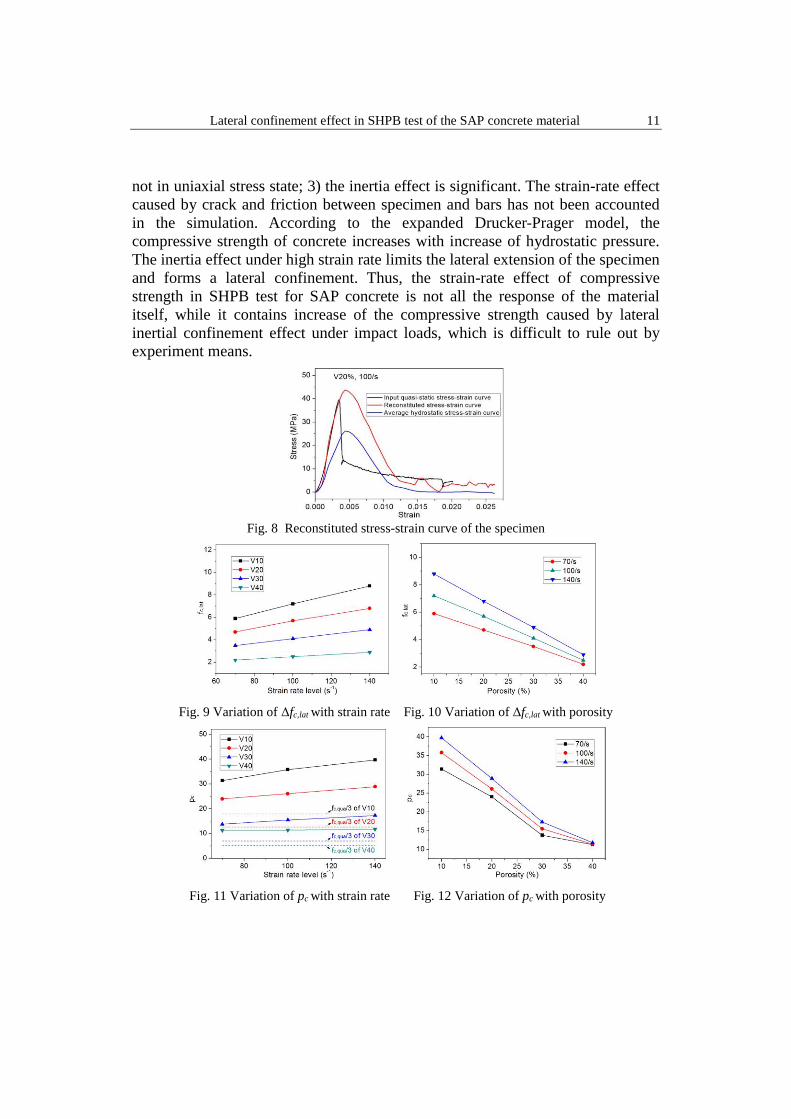
Lateral confinement effect in SHPB test of the SAP concrete material 11
not in uniaxial stress state; 3) the inertia effect is significant. The strain-rate effect
caused by crack and friction between specimen and bars has not been accounted
in the simulation. According to the expanded Drucker-Prager model, the
compressive strength of concrete increases with increase of hydrostatic pressure.
The inertia effect under high strain rate limits the lateral extension of the specimen
and forms a lateral confinement. Thus, the strain-rate effect of compressive
strength in SHPB test for SAP concrete is not all the response of the material
itself, while it contains increase of the compressive strength caused by lateral
inertial confinement effect under impact loads, which is difficult to rule out by
experiment means.
Fig. 8 Reconstituted stress-strain curve of the specimen
Fig. 9 Variation of Δfc,lat with strain rate Fig. 10 Variation of Δfc,lat with porosity
Fig. 11 Variation of pc with strain rate Fig. 12 Variation of pc with porosity

12 Zhenqun Sang, Zhiping Deng, Jianglin Xi, Huibin Yao, Jiang Wu
4.2 End Face Friction Effect
Berthold and Karnes [19] have studied the influence of friction between
the interfaces of the specimen and pressure bars on the result of SHPB test using
numerical simulation method and shown that important stress and strain non-
uniformity exists when the interfaces are not lubricated properly. Moreover, the
research about friction of the interface in SHPB test was based on metal
specimens, in which friction is usually smaller than that of concrete materials. As
for concrete, in the SHPB test, smoothness of the end surface is unable to reach
the standard of metal specimen. The friction effect cannot be ignored even with
lubrication measures to reduce the friction coefficient.
In order to study the influence of end face friction on SHPB experimental
results for SAP concrete with different porosities under different strain rates, the
friction coefficient of the contact surface between SAP concrete specimen and
pressure bar and is set to 0.05, 0.1, 0.2, 0.1 and 0.2 respectively, using contact face
definition in ABAQUS. The reconstructed stress - strain curve can be calculated
based on the numerical model built for research of the lateral confinement effect.
Then, the reconstructed compressive strength fc,lat-μ, which contains the lateral
inertia confinement effect and end face friction effect, can be obtained based on
the reconstructed stress - strain curve. The increment of reconstructed
compressive strength △fc,lat-μ, which is the difference between fc,lat-μ and quasi-
static compressive strength and contains the end face friction effect only, can be
obtained based on the reconstructed strength fc,lat-μ and fc,lat, namely:
, , ,c lat c lat c latf f f (2)
For a given strain rate level, the increment of reconstructed compressive
strength △fc,lat-μ varies with end face friction, and the variation is shown in Fig.13
for specimens with different porosities (just porosity 10% and 20% is shown).
Fig. 13 Variation of △fc,lat-μ with friction coefficient
Fig.13 shows that the increments of reconstructed compressive strength
△fc,lat-μ are all greater than zero, which indicates that the influence of end face
friction on the compressive strength should not be neglected. The increments of

Lateral confinement effect in SHPB test of the SAP concrete material 13
reconstructed compressive strength △fc,lat-μ caused by end face friction increases
with rise of end face friction. The increase speed of △fc,lat-μ with friction
coefficient below 0.2 is relatively high, while the speed slows down gradually
when the friction coefficient surpasses 0.2. For a given friction coefficient and
porosity, △fc,lat-μ increases with strain rate indicating a significant influence on the
compressive strength of end face friction under high strain rates. For low porosity
specimens, when the friction coefficient is greater than 0.2, the impact of friction
on compressive strength is significant, so it is necessary to reduce the friction
coefficient in SHPB experiment.
4.3 Strain Rate Effect of the Material Itself
The increase of compressive strength in the SHPB test under high strain
rate can be attributed to the strain-rate effect of the materials itself, lateral inertia
confinement effect and end face friction effect. In the SHPB experiment, the
dynamic strength increases factor DIF-fc of compressive strength (Dynamic
Increase Factor, it is the ratio of compressive or tensile strength under dynamic
loading and quasi-static loading) obtained from the test can be expressed as:
c- / ( ) /cd cs cd cs csDIF f f f f f f (3)
in which, △fcd is the increment of dynamic compressive strength caused by the
strain rate effect coming from lateral inertia confinement effect, end face friction
effect and strain rate effect of the materials itself, and fcs is the compressive
strength under quasi-static loading. The compressive strength fcs under quasi-static
loading also increases with rise of the loading rate, which usually contributes to
the cyclo-hoop effect. Assuming that the dynamic compressive strength increment
△fcd,r caused by the material itself is not associated with △fc,lat-μ, △fcd can be
represented as:
,r ,= +cd cd cd latf f f (4)
Bringing equation (4) into (3):
c ,r ,- ( + ) /cd cd lat cs csDIF f f f f f (5)
If the strain-rate effect of the material itself is not taken into account, the
dynamic strength growth factor of the compressive strength DIF-△fc,lat-μ is caused
by lateral inertial confinement effect and end face friction effect. Thus, the
increase of the factor DIF-△fc,r caused by the strain rate effect of the material
itself is:
c,r c ,- = - -c d latDIF f DIF f DIF f (6)
Paper [13] shows that the friction coefficient between the concrete
specimen and steel pressure bar in SHPB test can be reduced to about 0.1 by

14 Zhenqun Sang, Zhiping Deng, Jianglin Xi, Huibin Yao, Jiang Wu
applying lubrication properly. Thus, the increment of the reconstructed
compressive strength △fc,lat-μ can be obtained from Figure 8 with friction
coefficient 0.1 to deduce the value of DIF-△fc,lat-μ and DIF-△fc,r, which are
shown in Fig.14, respectively.
Fig. 14 DIF-fcd,lat-μ and DIF-fc,r of specimens with different porosity under three strain rate levels
As shown in Fig.14, DIF-△fc,r increases with increase of porosity and
indicates an obvious strain rate effect. The DIF-△fc,lat-μ increases with porosity,
which reflects that the influence of lateral inertial confinement effect and end face
friction effect is larger for specimen with low porosities. At the same level of the
strain rate, DIF-△fc,r increases with increase of porosity, which show that the
specimen with high porosity has a more significant strain rate effect of material
itself, and it is consistent with SHPB experiment results.
Table 4
Parameter of the fittig equation
Theoretical porosity (%) Parameter a Parameter b
10 0.1499 0.1548
20 0.0746 0.2034
30 0.0141 0.3190
40 0.0063 0.3761
The variation of dynamic strength increase factor of the material itself
with strain rate for SAP concrete specimens with different porosities can be fitted
as equation (7), and the result is shown in Fig.15, which shows a linear relation
between DIF-fc,r and the relative strain rate ċ/ċs (ċ is high strain rate, ċs is the quasi-
static strain rate) in double logarithmic coordinates. The fitting equation is:
c,r
c-
b
s
DIF f ac
(7)
where the coefficients a and b are listed in Table 4.
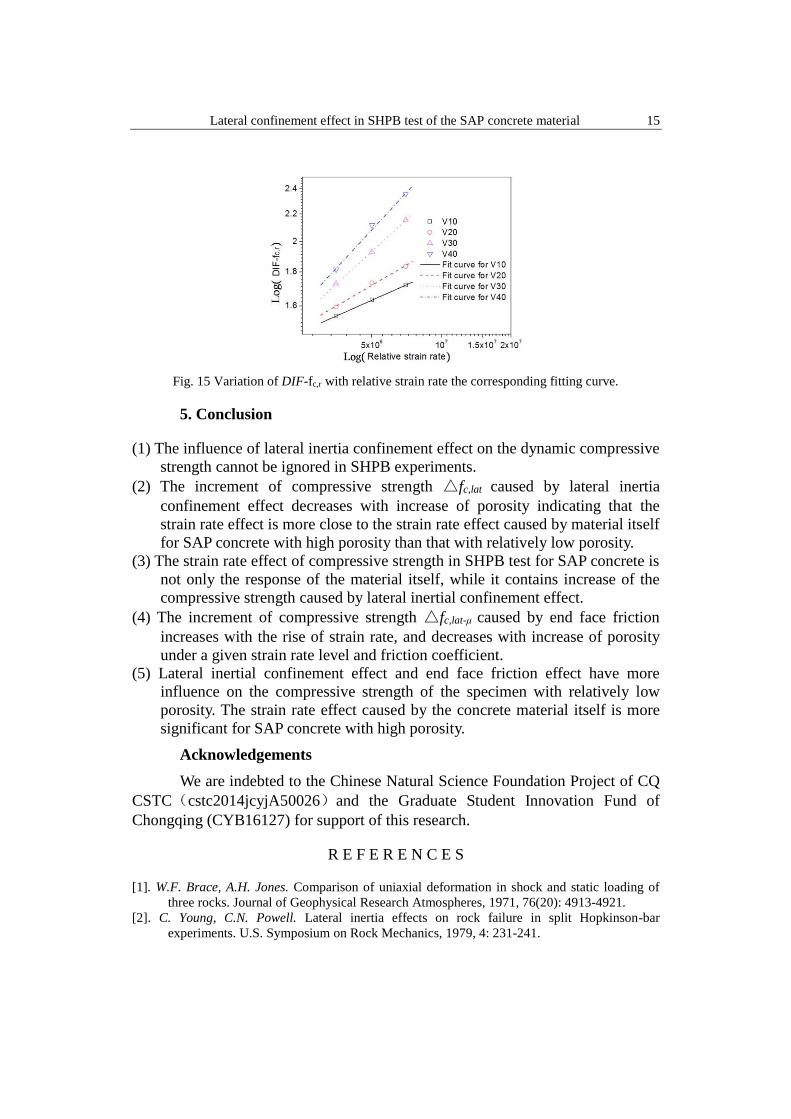
Lateral confinement effect in SHPB test of the SAP concrete material 15
Fig. 15 Variation of DIF-fc,r with relative strain rate the corresponding fitting curve.
5. Conclusion
(1) The influence of lateral inertia confinement effect on the dynamic compressive
strength cannot be ignored in SHPB experiments.
(2) The increment of compressive strength △fc,lat caused by lateral inertia
confinement effect decreases with increase of porosity indicating that the
strain rate effect is more close to the strain rate effect caused by material itself
for SAP concrete with high porosity than that with relatively low porosity.
(3) The strain rate effect of compressive strength in SHPB test for SAP concrete is
not only the response of the material itself, while it contains increase of the
compressive strength caused by lateral inertial confinement effect.
(4) The increment of compressive strength △fc,lat-μ caused by end face friction
increases with the rise of strain rate, and decreases with increase of porosity
under a given strain rate level and friction coefficient.
(5) Lateral inertial confinement effect and end face friction effect have more
influence on the compressive strength of the specimen with relatively low
porosity. The strain rate effect caused by the concrete material itself is more
significant for SAP concrete with high porosity.
Acknowledgements
We are indebted to the Chinese Natural Science Foundation Project of CQ
CSTC(cstc2014jcyjA50026)and the Graduate Student Innovation Fund of
Chongqing (CYB16127) for support of this research.
R E F E R E N C E S
[1]. W.F. Brace, A.H. Jones. Comparison of uniaxial deformation in shock and static loading of
three rocks. Journal of Geophysical Research Atmospheres, 1971, 76(20): 4913-4921.
[2]. C. Young, C.N. Powell. Lateral inertia effects on rock failure in split Hopkinson-bar
experiments. U.S. Symposium on Rock Mechanics, 1979, 4: 231-241.

16 Zhenqun Sang, Zhiping Deng, Jianglin Xi, Huibin Yao, Jiang Wu
[3]. P.H. Bischoff, S.H. Perry. Compression behavior of concrete at high strain-rates. Materials
and Structures. 1991, 24: 425-450
[4]. X.M. Kong, Z.L. Zhang, Z.C. Lu. Effect of pre-soaked superabsorbent polymer on shrinkage
of high-strength concrete. Materials and Structure, 2015, 48 (9): 2741- 2758.
[5]. G.R.D. Sensale, A.F. Goncalves. Effect of fine LWA and SAP as internal water curing agents
. International Journal of Concrete and Structure Materials, 2014, 8 (3): 229-238.
[6]. S. Laustsen, M.T. Hasholt, O.M. Jensen. Void structure of concrete with superabsorbent
polymers and its relation to frost resistance of concrete. Materials and Structure, 2013, 48
(1-2): 357- 368.
[7]. J. Yang, F.Z. Wang, Y.P. Liu. CoMParison of ordinary pores with internal cured pores
produced by superabsorbent polymers. Advanced Materials Research, 2015, 1129: 315-322.
[8]. F.Z. Wang, J. Yang, S.G. Hu, X.P. Li, H. Cheng. Influence of superabsorbent polymers on the
surrounding cement paste. Cement and Concrete Research, 2016, 81: 112-121.
[9]. Z.P. Deng, H. Cheng, Z.G. Wang, G.H. Zhu, H.S. Zhong. Compressive behavior of the cellular
concrete utilizing millimeter-size saturated SAP under high strain-rate loading.
Construction and building materials, 2016, 119: 96-106.
[10]. Z.P. Deng, H. Cheng, G.H. Zhu. Dynamic behavior and constitutive model of super
absorbent polymer concrete under impact loading. International journal of earth sciences
and engineering, 2015, 8(6): 2974-2980.
[11]. J.F. Georgin, J.M. Reynouard. Modeling of structures subjected to impact: concrete
behaviour under high strain rate. Cement and Concrete Composites, 2003, 25(1): 131-143.
[12]. F.V. Donze, S.A. Magnier, L. Daudeville, C. Mariotti, L. Davenne. Numerical study of
compressive behavior of concrete at high strain-rates. Journal of Engineering Mechanics,
1999, 125(10): 1154-1163.
[13]. Q.M. Li, H. Meng. About the dynamic strength enhancement of concrete-like materials in a
split Hopkinson pressure bar test [J]. Solids and structures, 2003, 40: 343-360.
[14]. S.S. Yu, Y.B. Lu, Y. Cai. A numerical method to determine real strain-rate effect for rock-like
materials. Chinese journal of rock mechanics and engineering, 2013, 32(Supp.2): 3283-
3290.
[15]. Q. Fang, J. Hong, J.H. Zhang, L. Cheng, Z. Ruan. Issues of SHPB test on concrete-like
material. Engineering Mechanics, 2014, 31(5): 1-13
[16]. D.C. Drucker, W. Prager. Soil mechanics and plastic analysis or limit design [J]. Quarterly
of Applied Mathematics, 1952, 10: 157-165.
[17] S.W. Park, Q. Xia, M. Zhou. Dynamic behavior of concrete at high strain rates and pressures:
II. numerical simulation. International Journal Impact Engineering, 2001, 25(9): 887-910.
[18] D.C. Drucker, W. Prager. Soil mechanics and plastic analysis or limit design. Quarterly of
Applied Mathematics, 1952, 10: 157-165.
[19]. L.D. Bertholf, C.H. Karnes. Two-dimensional analysis of the split Hopkinson pressure bar
system. Journal of Mechanics and Physics of Solids, 1975, 23: 1-19.