lateral and longitudinal collision risk (a case study
TRANSCRIPT

Lateral and Longitudinal Collision Risk(A Case Study using December 2010 TSD)
Antar Bandyopadhyay
(Joint work with Deepayan Sarkar andBOBASMA Team, AAI)
Workshop on Airspace Safety MonitoringIndian Statistical Institute, New Delhi
May 7, 2012
Antar Bandyopadhyay (ISI, Delhi) Collision Risk Assessment May 7, 2012 1 / 43

Outline
1 Outline
2 IntroductionBackgroundGoalAchievementsData Sets
3 Collision Risk Models (CRMs)
4 Lateral Collision Risk AssessmentModelEstimates
5 Longitudinal Collision Risk AssessmentModelEstimates
6 New things in the Subsequent Analysis
Antar Bandyopadhyay (ISI, Delhi) Collision Risk Assessment May 7, 2012 2 / 43

Introduction Background
Background
We will investigate the collision risk between two aircraft flying overthe Bay of Bengal airspace.
This joint work was presented in the RASMAG 14 meeting at theInternational Civil Aviation Organization (ICAO) Asia Pacific Officeat Bangkok, Thailand on February 24, 2011.
This was the first analysis which we conducted as part of the projectjointly under taken by the Airports Authority of India (AAI) and theIndian Statistical Institute, Delhi Centre under the MoA signedbetween the two organizations on January 13, 2011 .
The goal was to confirm that the Target Level of Safety (TLS)(5× 10⁻⁹ accidents per flight hour), was met.
Note that it was pre-RHS time and so the separation standards were
50 NM lateral separation between all the parallel routes;10 minutes longitudinal separation between front and behind aircrafts.
Antar Bandyopadhyay (ISI, Delhi) Collision Risk Assessment May 7, 2012 3 / 43

Introduction Goal
The Final Goal of the Analysis were
To help India/AAI establish an En-route Monitoring Agency (EMA)for Bay of Bengal and Arabian Sea.
This was of course prestigious for India/AAI.
Moreover this it would help in reducing the current separationstandards and hence a sharp increase in air traffic volume hopefullyleading to positive effect on India’s economy.
Antar Bandyopadhyay (ISI, Delhi) Collision Risk Assessment May 7, 2012 4 / 43

Introduction Achievements
Achievements
This joint work and a subsequent analysis were presented in twosuccessive RASMAG meetings at the International Civil AviationOrganization (ICAO) Asia Pacific Office at Bangkok, Thailand.
Both times the joint report of AAI and ISI was very enthusiasticallyaccepted by the RASMAG and it has finally forwarded toAPANPIRG which later in September 2011 took the decision offormally accepting BOBASMA as an recognized En-RouteMonitoring Agency for the Asia Pacific Region.
Antar Bandyopadhyay (ISI, Delhi) Collision Risk Assessment May 7, 2012 5 / 43

Map of Chennai FIR

Map of Chennai FIR

Introduction Data Sets
Data Sets Used for this Study
Traffic Sample Data (TSD): Traffic sample data from Chennai FIRfor the month of December 2010 was used. Some data pruning wasdone to remove reporting errors in the data.
Note: We use the TSD from Chennai FIR since it is centrally locatedfor the region of study.
Gross Navigational Error (GNE) Data: This consists of the reportsof Gross Navigational Errors were received from India (Chennai,Mumbai, and Kolkata FIRs) and Bangkok for the months of July toDecember 2010
Antar Bandyopadhyay (ISI, Delhi) Collision Risk Assessment May 7, 2012 8 / 43

A Glimpse of the TSD

A Glimpse of the GNE Data
Year Month FIR Flights LLE LLD2010 AUGUST KOLKATA 443 0 02010 SEPTEMBER KOLKATA 423 0 02010 OCTOBER KOLKATA 432 0 02010 NOVEMBER KOLKATA 427 0 02010 DECEMBER KOLKATA 545 0 02010 JULY CHENNAI 2679 0 02010 AUGUST CHENNAI 5173 0 02010 SEPTEMBER CHENNAI 5196 0 02010 OCTOBER CHENNAI 5478 0 02010 NOVEMBER CHENNAI 5258 0 02010 DECEMBER CHENNAI 5432 0 02010 JULY MUMBAI 1838 0 02010 AUGUST MUMBAI 1812 0 02010 SEPTEMBER MUMBAI 1792 0 02010 OCTOBER MUMBAI 1884 0 02010 NOVEMBER MUMBAI 1068 0 02010 DECEMBER MUMBAI 1426 0 02010 JULY BANGKOK 1865 0 02010 AUGUST BANGKOK 2330 0 02010 SEPTEMBER BANGKOK 2297 0 02010 OCTOBER BANGKOK 2234 0 02010 NOVEMBER BANGKOK 2108 0 02010 DECEMBER BANGKOK 2061 0 02011 JANUARY BANGKOK 0 0
Total 54201 0 0
Collision Risk Models (CRMs)
Reich’s Collision Risk Model (CRM)
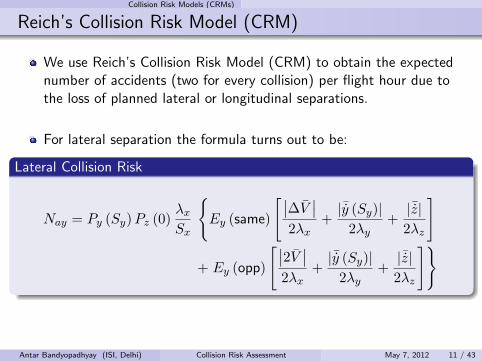
We use Reich’s Collision Risk Model (CRM) to obtain the expectednumber of accidents (two for every collision) per flight hour due tothe loss of planned lateral or longitudinal separations.
Antar Bandyopadhyay (ISI, Delhi) Collision Risk Assessment May 7, 2012 11 / 43
Collision Risk Models (CRMs)
Reich’s Collision Risk Model (CRM)
We use Reich’s Collision Risk Model (CRM) to obtain the expectednumber of accidents (two for every collision) per flight hour due tothe loss of planned lateral or longitudinal separations.
For lateral separation the formula turns out to be:
Lateral Collision Risk
Nay = Py (Sy)Pz (0)λxSx
{Ey (same)
[∣∣∆V ∣∣2λx
+|¯y (Sy)|
2λy+|¯z|2λz
]
+ Ey (opp)
[∣∣2V ∣∣2λx
+|¯y (Sy)|
2λy+|¯z|2λz
]}
Antar Bandyopadhyay (ISI, Delhi) Collision Risk Assessment May 7, 2012 11 / 43

Collision Risk Models (CRMs)
Reich’s Collision Risk Model (CRM)
We use Reich’s Collision Risk Model (CRM) to obtain the expectednumber of accidents (two for every collision) per flight hour due tothe loss of planned lateral or longitudinal separations.
For longitudinal separation the formula turns to be:
Longitudinal Collision Risk
Nax = Py (0)Pz (0)2λx|x|
(|¯x|2λx
+|¯y (0)|2λy
+|¯z|2λz
)×
[M∑k=m
2Q(k) P(K > k)
]
Antar Bandyopadhyay (ISI, Delhi) Collision Risk Assessment May 7, 2012 11 / 43

Collision Risk Models (CRMs)
Assumptions in Reich’s Collision Risk Model
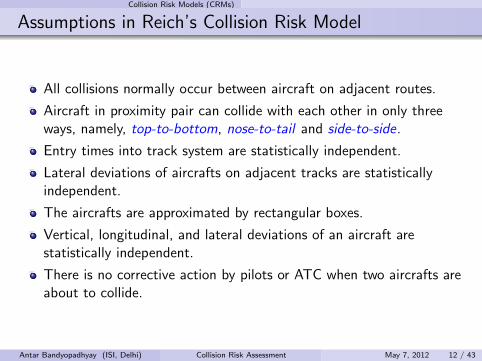
All collisions normally occur between aircraft on adjacent routes.
Aircraft in proximity pair can collide with each other in only threeways, namely, top-to-bottom, nose-to-tail and side-to-side.
Entry times into track system are statistically independent.
Lateral deviations of aircrafts on adjacent tracks are statisticallyindependent.
The aircrafts are approximated by rectangular boxes.
Vertical, longitudinal, and lateral deviations of an aircraft arestatistically independent.
There is no corrective action by pilots or ATC when two aircrafts areabout to collide.
Antar Bandyopadhyay (ISI, Delhi) Collision Risk Assessment May 7, 2012 12 / 43

Collision Risk Models (CRMs)
Assumptions in Reich’s Collision Risk Model
All collisions normally occur between aircraft on adjacent routes.
Aircraft in proximity pair can collide with each other in only threeways, namely, top-to-bottom, nose-to-tail and side-to-side.
Entry times into track system are statistically independent.
Lateral deviations of aircrafts on adjacent tracks are statisticallyindependent.
The aircrafts are approximated by rectangular boxes.
Vertical, longitudinal, and lateral deviations of an aircraft arestatistically independent.
There is no corrective action by pilots or ATC when two aircrafts areabout to collide.
Antar Bandyopadhyay (ISI, Delhi) Collision Risk Assessment May 7, 2012 12 / 43

Lateral CRM Model
Reich’s Lateral Collision Risk Model
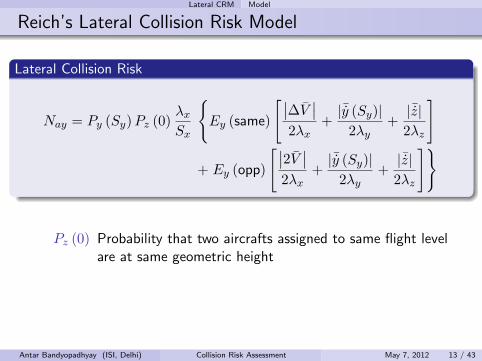
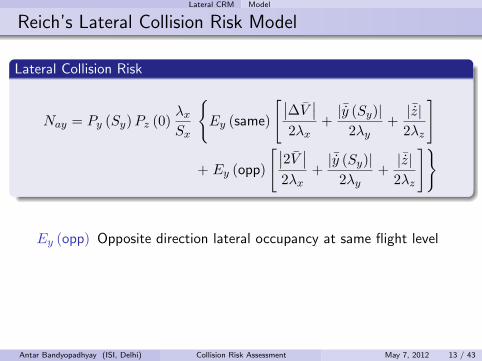
Lateral Collision Risk
Nay = Py (Sy)Pz (0)λxSx
{Ey (same)
[∣∣∆V ∣∣2λx
+|¯y (Sy)|
2λy+|¯z|2λz
]
+ Ey (opp)
[∣∣2V ∣∣2λx
+|¯y (Sy)|
2λy+|¯z|2λz
]}
Nay Expected number of accidents (two for every collision) perflight hour due to the loss of lateral separation betweenaircrafts flying on tracks with planned Sy NM lateralseparation
Antar Bandyopadhyay (ISI, Delhi) Collision Risk Assessment May 7, 2012 13 / 43

Lateral CRM Model
Reich’s Lateral Collision Risk Model
Lateral Collision Risk
Nay = Py (Sy)Pz (0)λxSx
{Ey (same)
[∣∣∆V ∣∣2λx
+|¯y (Sy)|
2λy+|¯z|2λz
]
+ Ey (opp)
[∣∣2V ∣∣2λx
+|¯y (Sy)|
2λy+|¯z|2λz
]}
Sy Minimum planned lateral separation
Antar Bandyopadhyay (ISI, Delhi) Collision Risk Assessment May 7, 2012 13 / 43

Lateral CRM Model
Reich’s Lateral Collision Risk Model
Lateral Collision Risk
Nay = Py (Sy)Pz (0)λxSx
{Ey (same)
[∣∣∆V ∣∣2λx
+|¯y (Sy)|
2λy+|¯z|2λz
]
+ Ey (opp)
[∣∣2V ∣∣2λx
+|¯y (Sy)|
2λy+|¯z|2λz
]}
λx Average length of an aircraft flying in airspace
Antar Bandyopadhyay (ISI, Delhi) Collision Risk Assessment May 7, 2012 13 / 43

Lateral CRM Model
Reich’s Lateral Collision Risk Model
Lateral Collision Risk
Nay = Py (Sy)Pz (0)λxSx
{Ey (same)
[∣∣∆V ∣∣2λx
+|¯y (Sy)|
2λy+|¯z|2λz
]
+ Ey (opp)
[∣∣2V ∣∣2λx
+|¯y (Sy)|
2λy+|¯z|2λz
]}
λy Average wingspan of an aircraft flying in airspace
Antar Bandyopadhyay (ISI, Delhi) Collision Risk Assessment May 7, 2012 13 / 43

Lateral CRM Model
Reich’s Lateral Collision Risk Model
Lateral Collision Risk
Nay = Py (Sy)Pz (0)λxSx
{Ey (same)
[∣∣∆V ∣∣2λx
+|¯y (Sy)|
2λy+|¯z|2λz
]
+ Ey (opp)
[∣∣2V ∣∣2λx
+|¯y (Sy)|
2λy+|¯z|2λz
]}
λz Average height of an aircraft flying in airspace
Antar Bandyopadhyay (ISI, Delhi) Collision Risk Assessment May 7, 2012 13 / 43

Lateral CRM Model
Reich’s Lateral Collision Risk Model
Lateral Collision Risk
Nay = Py (Sy)Pz (0)λxSx
{Ey (same)
[∣∣∆V ∣∣2λx
+|¯y (Sy)|
2λy+|¯z|2λz
]
+ Ey (opp)
[∣∣2V ∣∣2λx
+|¯y (Sy)|
2λy+|¯z|2λz
]}
Py (Sy) Probability that two aircrafts assigned to two parallel routeswith Sy NM lateral separation will lose all planned lateralseparation
Antar Bandyopadhyay (ISI, Delhi) Collision Risk Assessment May 7, 2012 13 / 43
Lateral CRM Model
Reich’s Lateral Collision Risk Model
Lateral Collision Risk
Nay = Py (Sy)Pz (0)λxSx
{Ey (same)
[∣∣∆V ∣∣2λx
+|¯y (Sy)|
2λy+|¯z|2λz
]
+ Ey (opp)
[∣∣2V ∣∣2λx
+|¯y (Sy)|
2λy+|¯z|2λz
]}
Pz (0) Probability that two aircrafts assigned to same flight levelare at same geometric height
Antar Bandyopadhyay (ISI, Delhi) Collision Risk Assessment May 7, 2012 13 / 43

Lateral CRM Model
Reich’s Lateral Collision Risk Model
Lateral Collision Risk
Nay = Py (Sy)Pz (0)λxSx
{Ey (same)
[∣∣∆V ∣∣2λx
+|¯y (Sy)|
2λy+|¯z|2λz
]
+ Ey (opp)
[∣∣2V ∣∣2λx
+|¯y (Sy)|
2λy+|¯z|2λz
]}
Sx Length of half the interval in NM used to count proximateaircraft at adjacent routes
Antar Bandyopadhyay (ISI, Delhi) Collision Risk Assessment May 7, 2012 13 / 43

Lateral CRM Model
Reich’s Lateral Collision Risk Model
Lateral Collision Risk
Nay = Py (Sy)Pz (0)λxSx
{Ey (same)
[∣∣∆V ∣∣2λx
+|¯y (Sy)|
2λy+|¯z|2λz
]
+ Ey (opp)
[∣∣2V ∣∣2λx
+|¯y (Sy)|
2λy+|¯z|2λz
]}
Ey (same) Same direction lateral occupancy at same flight level
Antar Bandyopadhyay (ISI, Delhi) Collision Risk Assessment May 7, 2012 13 / 43
Lateral CRM Model
Reich’s Lateral Collision Risk Model
Lateral Collision Risk
Nay = Py (Sy)Pz (0)λxSx
{Ey (same)
[∣∣∆V ∣∣2λx
+|¯y (Sy)|
2λy+|¯z|2λz
]
+ Ey (opp)
[∣∣2V ∣∣2λx
+|¯y (Sy)|
2λy+|¯z|2λz
]}
Ey (opp) Opposite direction lateral occupancy at same flight level
Antar Bandyopadhyay (ISI, Delhi) Collision Risk Assessment May 7, 2012 13 / 43

Lateral CRM Model
Reich’s Lateral Collision Risk Model
Lateral Collision Risk
Nay = Py (Sy)Pz (0)λxSx
{Ey (same)
[∣∣∆V ∣∣2λx
+|¯y (Sy)|
2λy+|¯z|2λz
]
+ Ey (opp)
[∣∣2V ∣∣2λx
+|¯y (Sy)|
2λy+|¯z|2λz
]}
∣∣∆V ∣∣ Average relative speed of two aircraft flying on parallelroutes in same direction
Antar Bandyopadhyay (ISI, Delhi) Collision Risk Assessment May 7, 2012 13 / 43

Lateral CRM Model
Reich’s Lateral Collision Risk Model
Lateral Collision Risk
Nay = Py (Sy)Pz (0)λxSx
{Ey (same)
[∣∣∆V ∣∣2λx
+|¯y (Sy)|
2λy+|¯z|2λz
]
+ Ey (opp)
[∣∣2V ∣∣2λx
+|¯y (Sy)|
2λy+|¯z|2λz
]}
∣∣V ∣∣ Average ground speed on an aircraft
Antar Bandyopadhyay (ISI, Delhi) Collision Risk Assessment May 7, 2012 13 / 43

Lateral CRM Model
Reich’s Lateral Collision Risk Model
Lateral Collision Risk
Nay = Py (Sy)Pz (0)λxSx
{Ey (same)
[∣∣∆V ∣∣2λx
+|¯y (Sy)|
2λy+|¯z|2λz
]
+ Ey (opp)
[∣∣2V ∣∣2λx
+|¯y (Sy)|
2λy+|¯z|2λz
]}
|¯y (Sy)| Average relative lateral speed of aircraft pair at loss ofplanned lateral separation of Sy
Antar Bandyopadhyay (ISI, Delhi) Collision Risk Assessment May 7, 2012 13 / 43

Lateral CRM Model
Reich’s Lateral Collision Risk Model
Lateral Collision Risk
Nay = Py (Sy)Pz (0)λxSx
{Ey (same)
[∣∣∆V ∣∣2λx
+|¯y (Sy)|
2λy+|¯z|2λz
]
+ Ey (opp)
[∣∣2V ∣∣2λx
+|¯y (Sy)|
2λy+|¯z|2λz
]}
|¯z| Average relative vertical speed of a co-altitude aircraft pairassigned to the same route
Antar Bandyopadhyay (ISI, Delhi) Collision Risk Assessment May 7, 2012 13 / 43

Lateral CRM Estimates
Estimates of the Parameters
Parameter Estimate Source of the Estimate
Sy 50 NM Current minimum
λx 0.0326051 NM TSD
λy 0.02983705 NM TSD
λz 0.009069301 NM TSD
Py (50) 4.31577× 10⁻⁸ Mixture model
Pz (0) 0.538 Double Exponential model
Sx 80 NM ±10-mins longitudinal separation
Ey (same) 0.04880429 TSD
Ey (opp) 0 No opposite direction flightsat same flight level∣∣∆V ∣∣ 36 knots TSD
|¯y (50)| 75 knots Conservative (EMA Handbook)
|¯z| 1.5 knots Conservative (EMA Handbook)
Antar Bandyopadhyay (ISI, Delhi) Collision Risk Assessment May 7, 2012 14 / 43

Lateral CRM Estimates
Estimates of the Parameters
Parameter Estimate Source of the Estimate
Sy 50 NM Current minimumλx 0.0326051 NM TSDλy 0.02983705 NM TSDλz 0.009069301 NM TSD
Py (50) 4.31577 × 10⁻⁸ Mixture modelPz (0) 0.538 Double Exponential modelSx 80 NM ±10-mins longitudinal separationEy (same) 0.04880429 TSDEy (opp) 0 No opposite direction flights
at same flight level∣∣∆V ∣∣ 36 knots TSD∣∣ ¯y (50)∣∣ 75 knots Conservative (EMA Handbook)∣∣¯z∣∣ 1.5 knots Conservative (EMA Handbook)
Nay = 0.895265× 10⁻⁹
Antar Bandyopadhyay (ISI, Delhi) Collision Risk Assessment May 7, 2012 15 / 43

Lateral CRM Estimates
Average Aircraft Dimensions
Estimated using dimensions of each aircraft type weighted by theirproportions in TSD
Antar Bandyopadhyay (ISI, Delhi) Collision Risk Assessment May 7, 2012 16 / 43

Lateral CRM Estimates
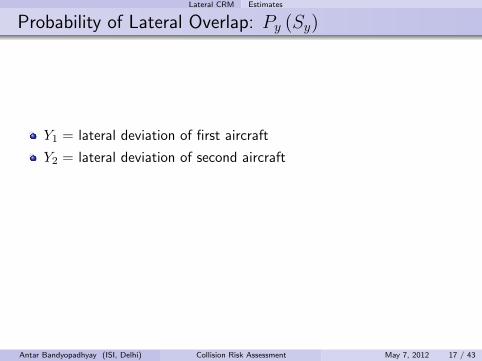
Probability of Lateral Overlap: Py (Sy)
Y1 = lateral deviation of first aircraft
Y2 = lateral deviation of second aircraft
Then, probability of lateral overlap (with planned separation Sy)
Py (Sy) = P (|Sy + Y1 − Y2| ≤ λy) ,
Antar Bandyopadhyay (ISI, Delhi) Collision Risk Assessment May 7, 2012 17 / 43
Lateral CRM Estimates
Probability of Lateral Overlap: Py (Sy)
Y1 = lateral deviation of first aircraft
Y2 = lateral deviation of second aircraft
Then, probability of lateral overlap (with planned separation Sy)
Py (Sy) = P (|Sy + Y1 − Y2| ≤ λy) ,
Antar Bandyopadhyay (ISI, Delhi) Collision Risk Assessment May 7, 2012 17 / 43

Lateral CRM Estimates
Probability of Lateral Overlap: Py (Sy)
Assumption:Y1 and Y2 identically distributed, independent, with distribution Fy
Fy is a mixture distribution having a core component Gy andnon-core component Hy.
The core distribution Gy represents errors that derive from standardnavigation system deviations. These errors are always present, asnavigation systems are not perfect and they have a certain precision.
The non-core distribution Hy, represents Gross Navigation Errors(GNE), that corresponds to what may be viewed as non-nominalperformance.
Antar Bandyopadhyay (ISI, Delhi) Collision Risk Assessment May 7, 2012 18 / 43

Lateral CRM Estimates
Probability of Lateral Overlap: Py (Sy)
Overall lateral deviation distribution is modeled as
Fy (y) = (1− α)Gy (y) + αHy (y)
The mixing parameter α is the probability of a gross navigational error
Antar Bandyopadhyay (ISI, Delhi) Collision Risk Assessment May 7, 2012 19 / 43

Lateral CRM Estimates
Probability of Lateral Overlap: Py (Sy)
Overall lateral deviation distribution is modeled as
Fy (y) = (1− α)Gy (y) + αHy (y)
Gy is modeled by a Double Exponential distribution with rate βy.That is, if Y1 ∼ Gy then
P (|Y1| > y) = e−βyy .
Antar Bandyopadhyay (ISI, Delhi) Collision Risk Assessment May 7, 2012 19 / 43

Lateral CRM Estimates
Probability of Lateral Overlap: Py (Sy)
Overall lateral deviation distribution is modeled as
Fy (y) = (1− α)Gy (y) + αHy (y)
Hy is modeled by “Separated Double Exponential” distribution with
separation parameter µy
rate parameter γy
That is, if Y2 ∼ Hy then
P (Y2 > µy + y) =1
2e−γyy and
P (Y2 < −µy − y) =1
2eγyy .
Antar Bandyopadhyay (ISI, Delhi) Collision Risk Assessment May 7, 2012 19 / 43

Lateral CRM Estimates
Probability of Lateral Overlap: Py (Sy)
Overall lateral deviation distribution is modeled as
Fy (y) = (1− α)Gy (y) + αHy (y)
Lateral distance (NM)
Den
sity
0.00
0.05
0.10
0.15
−50 0 50
Core
−50 0 50
Non−Core
−50 0 50
Mixture
Antar Bandyopadhyay (ISI, Delhi) Collision Risk Assessment May 7, 2012 19 / 43

Lateral CRM Estimates
Choice of parameters
Mixture parameter α:
Estimated by taking the 95% upper confidence limit from observedGNE data.The estimate is
α = 1− (0.05)1/N
= 5.526927× 10⁻⁵ ,
where N = 54201 is the number of flights observed and no grossnavigational errors were detected.Note: More GNE data with no detected gross navigational error willincrease the value of N and hence decrease the value of α which willlead to decrease in the risk.Note: This is very conservative estimate compare to the “natural”point estimate.
Antar Bandyopadhyay (ISI, Delhi) Collision Risk Assessment May 7, 2012 20 / 43

Lateral CRM Estimates
Choice of parameters
Core distribution:
The parameter βy is estimated under the RNP10 assumption of ±10NM deviation with 95% confidence, this leads to the estimate
βy = − log 0.05
10= 0.299573227 .
Antar Bandyopadhyay (ISI, Delhi) Collision Risk Assessment May 7, 2012 20 / 43

Lateral CRM Estimates
Choice of parameters
Non-core distribution:
Separation µy is taken to be 10 based on RNP10 considerationRate γy estimated by maximizing the wingspan overlap probability withSy = 50 NM initial separationThis is a conservative method similar to what has been used by FAAand also in EUR/SAM.The estimated value of γy is 0.05489709
Antar Bandyopadhyay (ISI, Delhi) Collision Risk Assessment May 7, 2012 20 / 43

Lateral CRM Estimates
Probability of Lateral Overlap: Py (Sy)
α = 1− (0.05)1/N = 5.526927× 10⁻⁵
βy = 0.299573227
µy = 10
γy = 0.05489709
Combining, estimated value of Py (50) is 4.31577× 10⁻⁸.
Antar Bandyopadhyay (ISI, Delhi) Collision Risk Assessment May 7, 2012 21 / 43

Lateral CRM Estimates
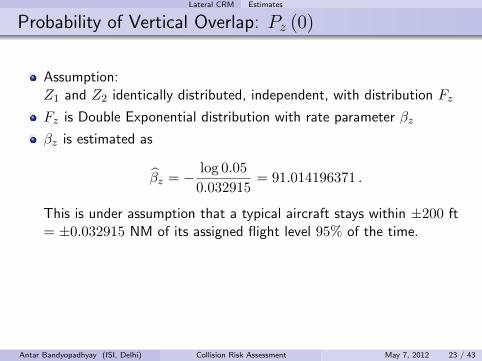
Probability of Vertical Overlap: Pz (0)
Z1 = height deviations of first aircraft
Z2 = height deviations of second aircraft
Aircrafts nominally flying at same flight level on adjacent routes
Then, probability of vertical overlap is
Pz (0) = P (|Z1 − Z2| ≤ λz) ,
Antar Bandyopadhyay (ISI, Delhi) Collision Risk Assessment May 7, 2012 22 / 43

Lateral CRM Estimates
Probability of Vertical Overlap: Pz (0)
Assumption:Z1 and Z2 identically distributed, independent, with distribution Fz
Fz is Double Exponential distribution with rate parameter βz
βz is estimated as
βz = − log 0.05
0.032915= 91.014196371 .
This is under assumption that a typical aircraft stays within ±200 ft= ±0.032915 NM of its assigned flight level 95% of the time.
Unfortunately this analysis ignores both the effect of large heightdeviations (LHDs) and aircraft altimetry system errors (ASE) whichare not estimable directly. So we use a conservative value of 0.538, asused by MAAR for vertical safety assessment in BOB region.
Antar Bandyopadhyay (ISI, Delhi) Collision Risk Assessment May 7, 2012 23 / 43

Lateral CRM Estimates
Lateral Occupancy parameters Ey (same) and Ey (opp)
Same direction occupancy : For a typical aircraft, average number ofaircrafts that are “proximate”; that is,
flying in the same direction as itnominally flying on tracks one lateral separation standard awaynominally at the same flight level as itwithin a longitudinal segment centered on it
The length of longitudinal segment (2Sx) usually taken to be distancetraveled in 20 minutes of flight, giving value of 160 NM.
Similar for opposite direction occupancy
Proximate aircrafts flying in opposite direction, same flight level.Currently flight levels are unidirectional, so taken to be 0.
Antar Bandyopadhyay (ISI, Delhi) Collision Risk Assessment May 7, 2012 24 / 43

Lateral CRM Estimates
Estimation of Ey (same) using TSD
Estimated by computing number of proximate pairs in TSD
Note time when aircraft on one route passes a waypointCount number of aircrafts passing homologous waypoint within ±10minutes
Estimate Ey =2nyn where
ny is the number of proximate pairsn is the the total number of aircrafts
Route pairs
N877 parallel to (unidirectional) routes L510 (EB) and P628 (WB)N571 parallel to P574P762 has no parallel route
Antar Bandyopadhyay (ISI, Delhi) Collision Risk Assessment May 7, 2012 25 / 43

Lateral CRM Estimates
Estimation of Ey (same) using TSD
Count By Routes Waypoints Total Proximate
Entry ( N877, L510 ) ( ORARA, BIDEX ) 316 2Entry ( N877, P628 ) ( IGOGU, IGREX ) 389 40Entry ( P574, N571 ) ( NOPEK, IGOGU ) 1188 80Entry ( P574, N571 ) ( GIRNA, IDASO ) 1254 38Exit ( N877, P628 ) ( ORARA, VATLA ) 389 20Exit ( N877, L510 ) ( IGOGU, EMRAN ) 81 0Exit ( P574, N571 ) ( NOPEK, IGOGU ) 1276 82Exit ( P574, N571 ) ( GIRNA, IDASO ) 1254 38
Ey(same) =300
6147= 0.04880429
Antar Bandyopadhyay (ISI, Delhi) Collision Risk Assessment May 7, 2012 26 / 43

Lateral CRM Estimates
Estimate of Average Ground Speed
Directly measured speed data were not available
Speeds have been estimated using waypoint report times
Speed =distance between entry and exit waypoints
traversal time
Antar Bandyopadhyay (ISI, Delhi) Collision Risk Assessment May 7, 2012 27 / 43
Lateral CRM Estimates
Estimate of average relative speed∣∣∆V
∣∣
∣∣∆V ∣∣ = average absolute relative speed of two aircrafts flying onparallel routes in same direction
Estimated from TSD by taking speed differences for laterallyproximate pairs in the same direction (same calculations as forEy (same) above).
Average absolute speed difference = 35.13632.
We use conservative value 36.
Antar Bandyopadhyay (ISI, Delhi) Collision Risk Assessment May 7, 2012 28 / 43

Lateral CRM Estimates
Estimate of Average Relative Lateral Speed: |¯y (Sy)|
Average relative lateral cross-track speed between aircraft, flying onadjacent routes separated by Sy NM at the same flight level, thathave lost their lateral separation.
The estimation of this parameter generally involves the extrapolationof radar data, speeds and lateral deviations, but such radar data werenot available for this study.
We use conservative value 75 knots as per EMA Handbook.
Antar Bandyopadhyay (ISI, Delhi) Collision Risk Assessment May 7, 2012 29 / 43
Lateral CRM Estimates
Estimate of Average Relative Vertical Speed: |¯z|
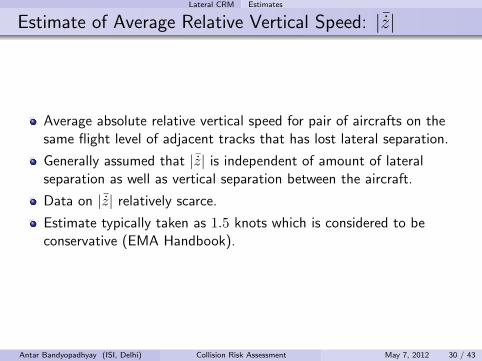
Average absolute relative vertical speed for pair of aircrafts on thesame flight level of adjacent tracks that has lost lateral separation.
Generally assumed that |¯z| is independent of amount of lateralseparation as well as vertical separation between the aircraft.
Data on |¯z| relatively scarce.
Estimate typically taken as 1.5 knots which is considered to beconservative (EMA Handbook).
Antar Bandyopadhyay (ISI, Delhi) Collision Risk Assessment May 7, 2012 30 / 43
Lateral CRM Estimates
Estimate of Average Relative Vertical Speed: |¯z|
Average absolute relative vertical speed for pair of aircrafts on thesame flight level of adjacent tracks that has lost lateral separation.
Generally assumed that |¯z| is independent of amount of lateralseparation as well as vertical separation between the aircraft.
Data on |¯z| relatively scarce.
Estimate typically taken as 1.5 knots which is considered to beconservative (EMA Handbook).
Antar Bandyopadhyay (ISI, Delhi) Collision Risk Assessment May 7, 2012 30 / 43

Longitudinal CRM Model
Reich’s Longitudinal Collision Risk Model
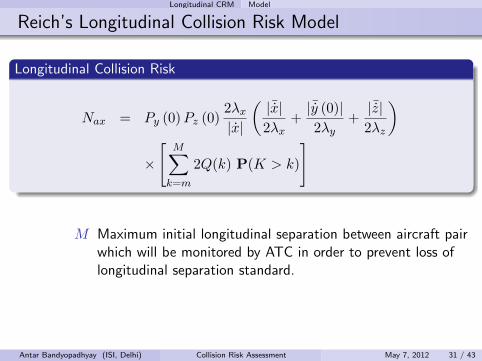
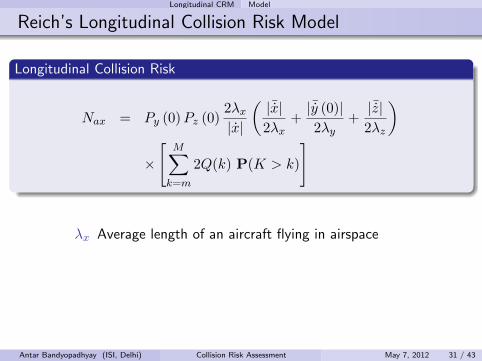
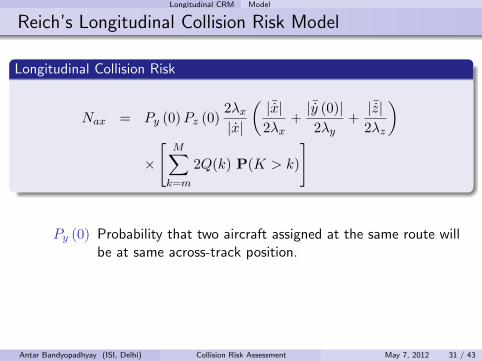
Longitudinal Collision Risk
Nax = Py (0)Pz (0)2λx|x|
(|¯x|2λx
+|¯y (0)|2λy
+|¯z|2λz
)×
[M∑k=m
2Q(k) P(K > k)
]
Nax Expected number of accidents (two for every collision) perflight hour due to collision between two co-altitude aircraftwith planned minimum m NM longitudinal separation.
Antar Bandyopadhyay (ISI, Delhi) Collision Risk Assessment May 7, 2012 31 / 43

Longitudinal CRM Model
Reich’s Longitudinal Collision Risk Model
Longitudinal Collision Risk
Nax = Py (0)Pz (0)2λx|x|
(|¯x|2λx
+|¯y (0)|2λy
+|¯z|2λz
)×
[M∑k=m
2Q(k) P(K > k)
]
m Minimum longitudinal separation in NM.
Antar Bandyopadhyay (ISI, Delhi) Collision Risk Assessment May 7, 2012 31 / 43
Longitudinal CRM Model
Reich’s Longitudinal Collision Risk Model
Longitudinal Collision Risk
Nax = Py (0)Pz (0)2λx|x|
(|¯x|2λx
+|¯y (0)|2λy
+|¯z|2λz
)×
[M∑k=m
2Q(k) P(K > k)
]
M Maximum initial longitudinal separation between aircraft pairwhich will be monitored by ATC in order to prevent loss oflongitudinal separation standard.
Antar Bandyopadhyay (ISI, Delhi) Collision Risk Assessment May 7, 2012 31 / 43
Longitudinal CRM Model
Reich’s Longitudinal Collision Risk Model
Longitudinal Collision Risk
Nax = Py (0)Pz (0)2λx|x|
(|¯x|2λx
+|¯y (0)|2λy
+|¯z|2λz
)×
[M∑k=m
2Q(k) P(K > k)
]
λx Average length of an aircraft flying in airspace
Antar Bandyopadhyay (ISI, Delhi) Collision Risk Assessment May 7, 2012 31 / 43

Longitudinal CRM Model
Reich’s Longitudinal Collision Risk Model
Longitudinal Collision Risk
Nax = Py (0)Pz (0)2λx|x|
(|¯x|2λx
+|¯y (0)|2λy
+|¯z|2λz
)×
[M∑k=m
2Q(k) P(K > k)
]
λy Average wingspan of an aircraft flying in airspace
Antar Bandyopadhyay (ISI, Delhi) Collision Risk Assessment May 7, 2012 31 / 43

Longitudinal CRM Model
Reich’s Longitudinal Collision Risk Model
Longitudinal Collision Risk
Nax = Py (0)Pz (0)2λx|x|
(|¯x|2λx
+|¯y (0)|2λy
+|¯z|2λz
)×
[M∑k=m
2Q(k) P(K > k)
]
λz Average height of an aircraft flying in airspace
Antar Bandyopadhyay (ISI, Delhi) Collision Risk Assessment May 7, 2012 31 / 43
Longitudinal CRM Model
Reich’s Longitudinal Collision Risk Model
Longitudinal Collision Risk
Nax = Py (0)Pz (0)2λx|x|
(|¯x|2λx
+|¯y (0)|2λy
+|¯z|2λz
)×
[M∑k=m
2Q(k) P(K > k)
]
Py (0) Probability that two aircraft assigned at the same route willbe at same across-track position.
Antar Bandyopadhyay (ISI, Delhi) Collision Risk Assessment May 7, 2012 31 / 43

Longitudinal CRM Model
Reich’s Longitudinal Collision Risk Model
Longitudinal Collision Risk
Nax = Py (0)Pz (0)2λx|x|
(|¯x|2λx
+|¯y (0)|2λy
+|¯z|2λz
)×
[M∑k=m
2Q(k) P(K > k)
]
Pz (0) Probability that two aircraft assigned to same flight level areat same geometric height.
Antar Bandyopadhyay (ISI, Delhi) Collision Risk Assessment May 7, 2012 31 / 43

Longitudinal CRM Model
Reich’s Longitudinal Collision Risk Model
Longitudinal Collision Risk
Nax = Py (0)Pz (0)2λx|x|
(|¯x|2λx
+|¯y (0)|2λy
+|¯z|2λz
)×
[M∑k=m
2Q(k) P(K > k)
]
|¯x| Minimum relative along-track speed necessary for followingaircraft in a pair separated by m NM at a reporting point toovertake lead aircraft at the next reporting point.
Antar Bandyopadhyay (ISI, Delhi) Collision Risk Assessment May 7, 2012 31 / 43

Longitudinal CRM Model
Reich’s Longitudinal Collision Risk Model
Longitudinal Collision Risk
Nax = Py (0)Pz (0)2λx|x|
(|¯x|2λx
+|¯y (0)|2λy
+|¯z|2λz
)×
[M∑k=m
2Q(k) P(K > k)
]
|¯y (0)| Relative across-track speed of same route aircraft pair.
Antar Bandyopadhyay (ISI, Delhi) Collision Risk Assessment May 7, 2012 31 / 43

Longitudinal CRM Model
Reich’s Longitudinal Collision Risk Model
Longitudinal Collision Risk
Nax = Py (0)Pz (0)2λx|x|
(|¯x|2λx
+|¯y (0)|2λy
+|¯z|2λz
)×
[M∑k=m
2Q(k) P(K > k)
]
|¯z| Average relative vertical speed of a co-altitude aircraft pairassigned to the same route.
Antar Bandyopadhyay (ISI, Delhi) Collision Risk Assessment May 7, 2012 31 / 43

Longitudinal CRM Model
Reich’s Longitudinal Collision Risk Model
Longitudinal Collision Risk
Nax = Py (0)Pz (0)2λx|x|
(|¯x|2λx
+|¯y (0)|2λy
+|¯z|2λz
)×
[M∑k=m
2Q(k) P(K > k)
]
Q (k) Proportion of aircraft pairs with initial longitudinalseparation k.
Antar Bandyopadhyay (ISI, Delhi) Collision Risk Assessment May 7, 2012 31 / 43

Longitudinal CRM Model
Reich’s Longitudinal Collision Risk Model
Longitudinal Collision Risk
Nax = Py (0)Pz (0)2λx|x|
(|¯x|2λx
+|¯y (0)|2λy
+|¯z|2λz
)×
[M∑k=m
2Q(k) P(K > k)
]
P (K > k) Probability that a pair of same route co-altitude aircraft withinitial longitudinal separation k will lose at least as much ask longitudinal separation before correction by ATC.
Antar Bandyopadhyay (ISI, Delhi) Collision Risk Assessment May 7, 2012 31 / 43

Longitudinal CRM Estimates
Estimates of the Parameters
Parameter Estimate Source of the Estimate
m 80 NM Current minimum
M 160 NM 20 minutes longitudinal separation
λx 0.0326051 NM TSD
λy 0.02983705 NM TSD
λz 0.009069301 NM TSD
Py (0) 0.2 Conservative estimate
Pz (0) 0.3617939 Double exponential model
|¯x| 90 knots Conservative estimate using speedand distance between way points
|¯y (0)| 1 knot RASMAG/9 safety assessment
|¯z| 1.5 Conservative (EMA Handbook)
Q (k) See Table TSD
P (K > k) See Table Mixture model for speeds from TSD
Antar Bandyopadhyay (ISI, Delhi) Collision Risk Assessment May 7, 2012 32 / 43

Longitudinal CRM Estimates
Estimates of the Parameters
Parameter Estimate Source of the Estimate
m 80 NM Current minimumM 160 NM 20 minutes longitudinal separationλx 0.0326051 NM TSDλy 0.02983705 NM TSDλz 0.009069301 NM TSDPy (0) 0.2 Conservative estimatePz (0) 0.3617939 Double exponential model∣∣¯x∣∣ 90 knots Conservative estimate using speed
and distance between way points∣∣ ¯y (0)∣∣ 1 knot RASMAG/9 safety assessment∣∣¯z∣∣ 1.5 Conservative (EMA Handbook)
Q (k) See Table TSDP (K > k) See Table Mixture model for speeds from TSD
Nax = 0.743608× 10⁻⁹
Antar Bandyopadhyay (ISI, Delhi) Collision Risk Assessment May 7, 2012 33 / 43

Longitudinal CRM Estimates
Probability of Lateral Overlap: Py (0)
Probability of lateral overlap of consecutive flights on same route andflight levels
Can use same mixture model used to estimate Py (50)
Leads to an estimate of Py (0) as 0.004527846
However, Py (0) has a significant effect on the risk estimate, andshould not be underestimated
Py (0) will increase as the lateral navigational performance improves,correspondingly increasing collision risk estimate
Based on data collected in Europe, RGCSP adopted value of 0.059(EUR/SAM report)
EMA Handbook suggests much more conservative value 0.2
We use 0.2 for our analysis as well
Antar Bandyopadhyay (ISI, Delhi) Collision Risk Assessment May 7, 2012 34 / 43

Longitudinal CRM Estimates
Probability of Lateral Overlap: Py (0)
Probability of lateral overlap of consecutive flights on same route andflight levels
Can use same mixture model used to estimate Py (50)Leads to an estimate of Py (0) as 0.004527846
However, Py (0) has a significant effect on the risk estimate, andshould not be underestimated
Py (0) will increase as the lateral navigational performance improves,correspondingly increasing collision risk estimate
Based on data collected in Europe, RGCSP adopted value of 0.059(EUR/SAM report)
EMA Handbook suggests much more conservative value 0.2
We use 0.2 for our analysis as well
Antar Bandyopadhyay (ISI, Delhi) Collision Risk Assessment May 7, 2012 34 / 43

Longitudinal CRM Estimates
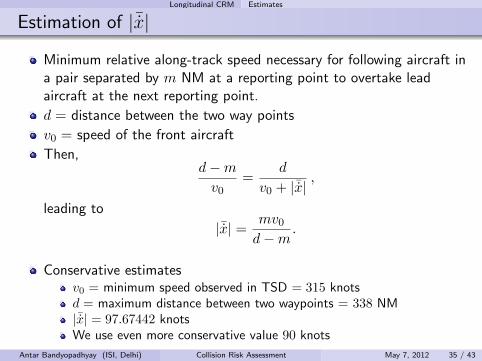
Estimation of |¯x|
Minimum relative along-track speed necessary for following aircraft ina pair separated by m NM at a reporting point to overtake leadaircraft at the next reporting point.
d = distance between the two way points
v0 = speed of the front aircraft
Then,d−mv0
=d
v0 + |¯x|,
leading to
|¯x| = mv0d−m
.
Conservative estimatesv0 = minimum speed observed in TSD = 315 knotsd = maximum distance between two waypoints = 338 NM|¯x| = 97.67442 knotsWe use even more conservative value 90 knots
Antar Bandyopadhyay (ISI, Delhi) Collision Risk Assessment May 7, 2012 35 / 43

Longitudinal CRM Estimates
Estimation of |¯x|
Minimum relative along-track speed necessary for following aircraft ina pair separated by m NM at a reporting point to overtake leadaircraft at the next reporting point.
d = distance between the two way points
v0 = speed of the front aircraft
Then,d−mv0
=d
v0 + |¯x|,
leading to
|¯x| = mv0d−m
.
Conservative estimatesv0 = minimum speed observed in TSD = 315 knotsd = maximum distance between two waypoints = 338 NM|¯x| = 97.67442 knotsWe use even more conservative value 90 knots
Antar Bandyopadhyay (ISI, Delhi) Collision Risk Assessment May 7, 2012 35 / 43

Longitudinal CRM Estimates
Estimation of |¯y (0)|
Relative cross-track speed of same route aircraft pair
No data is available for estimation of this parameter
We use conservative value of 1 knot (EMA Handbook)
Antar Bandyopadhyay (ISI, Delhi) Collision Risk Assessment May 7, 2012 36 / 43
Longitudinal CRM Estimates
Estimation of Q (k)
Q(k) = proportion of aircraft pairs with initial separation k
Values estimated from TSDFlights entering on different routes and flight levels consideredseparatelyWaiting times between successive arrivals tabulated in minutesAssuming average speed of 8 NM per minute, Q(k) computed as
Q(k) =number of flight pairs with inter-arrival distance 8k
total number of flight pairs with at least 80 NM separation.
Time difference at entry (minutes)
Pro
port
ion
of c
o−al
titud
e fli
ghts
o
n sa
me
rout
e af
ter
entr
y
0.000
0.002
0.004
0.006
0.008
10 11 12 13 14 15 16 17 18 19 20
Antar Bandyopadhyay (ISI, Delhi) Collision Risk Assessment May 7, 2012 37 / 43

Longitudinal CRM Estimates
Estimation of Q (k)
Q(k) = proportion of aircraft pairs with initial separation kValues estimated from TSD
Flights entering on different routes and flight levels consideredseparatelyWaiting times between successive arrivals tabulated in minutesAssuming average speed of 8 NM per minute, Q(k) computed as
Q(k) =number of flight pairs with inter-arrival distance 8k
total number of flight pairs with at least 80 NM separation.
Time difference at entry (minutes)
Pro
port
ion
of c
o−al
titud
e fli
ghts
o
n sa
me
rout
e af
ter
entr
y
0.000
0.002
0.004
0.006
0.008
10 11 12 13 14 15 16 17 18 19 20
Antar Bandyopadhyay (ISI, Delhi) Collision Risk Assessment May 7, 2012 37 / 43

Longitudinal CRM Estimates
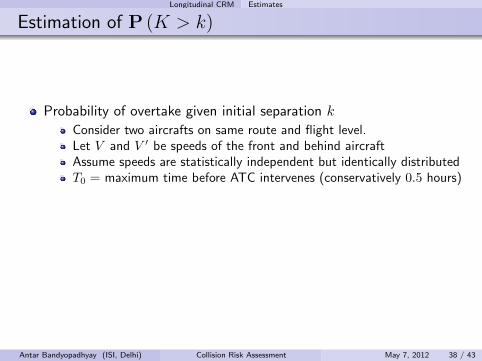
Estimation of P (K > k)
Probability of overtake given initial separation k
Consider two aircrafts on same route and flight level.Let V and V ′ be speeds of the front and behind aircraftAssume speeds are statistically independent but identically distributedT0 = maximum time before ATC intervenes (conservatively 0.5 hours)Then
P (K > k) = P
(0 <
k
V ′ − V< T0
)= P
(V ′ − V >
k
T0
).
Antar Bandyopadhyay (ISI, Delhi) Collision Risk Assessment May 7, 2012 38 / 43

Longitudinal CRM Estimates
Estimation of P (K > k)
Probability of overtake given initial separation k
Consider two aircrafts on same route and flight level.
Let V and V ′ be speeds of the front and behind aircraftAssume speeds are statistically independent but identically distributedT0 = maximum time before ATC intervenes (conservatively 0.5 hours)Then
P (K > k) = P
(0 <
k
V ′ − V< T0
)= P
(V ′ − V >
k
T0
).
Antar Bandyopadhyay (ISI, Delhi) Collision Risk Assessment May 7, 2012 38 / 43

Longitudinal CRM Estimates
Estimation of P (K > k)
Probability of overtake given initial separation k
Consider two aircrafts on same route and flight level.Let V and V ′ be speeds of the front and behind aircraft
Assume speeds are statistically independent but identically distributedT0 = maximum time before ATC intervenes (conservatively 0.5 hours)Then
P (K > k) = P
(0 <
k
V ′ − V< T0
)= P
(V ′ − V >
k
T0
).
Antar Bandyopadhyay (ISI, Delhi) Collision Risk Assessment May 7, 2012 38 / 43

Longitudinal CRM Estimates
Estimation of P (K > k)
Probability of overtake given initial separation k
Consider two aircrafts on same route and flight level.Let V and V ′ be speeds of the front and behind aircraftAssume speeds are statistically independent but identically distributed
T0 = maximum time before ATC intervenes (conservatively 0.5 hours)Then
P (K > k) = P
(0 <
k
V ′ − V< T0
)= P
(V ′ − V >
k
T0
).
Antar Bandyopadhyay (ISI, Delhi) Collision Risk Assessment May 7, 2012 38 / 43
Longitudinal CRM Estimates
Estimation of P (K > k)
Probability of overtake given initial separation k
Consider two aircrafts on same route and flight level.Let V and V ′ be speeds of the front and behind aircraftAssume speeds are statistically independent but identically distributedT0 = maximum time before ATC intervenes (conservatively 0.5 hours)
Then
P (K > k) = P
(0 <
k
V ′ − V< T0
)= P
(V ′ − V >
k
T0
).
Antar Bandyopadhyay (ISI, Delhi) Collision Risk Assessment May 7, 2012 38 / 43

Longitudinal CRM Estimates
Estimation of P (K > k)
Probability of overtake given initial separation k
Consider two aircrafts on same route and flight level.Let V and V ′ be speeds of the front and behind aircraftAssume speeds are statistically independent but identically distributedT0 = maximum time before ATC intervenes (conservatively 0.5 hours)Then
P (K > k) = P
(0 <
k
V ′ − V< T0
)= P
(V ′ − V >
k
T0
).
Antar Bandyopadhyay (ISI, Delhi) Collision Risk Assessment May 7, 2012 38 / 43

Longitudinal CRM Estimates
Estimation of P (K > k)
Estimation using TSD
Speed difference between successive flights on same route & flight levelConsider all flight pairs which are separated by 2 hours or less at entryNote: two hours is more than the maximum time taken by any aircraftto travel between its entry and exit points
Antar Bandyopadhyay (ISI, Delhi) Collision Risk Assessment May 7, 2012 39 / 43

Longitudinal CRM Estimates
Estimation of P (K > k)
Estimation using TSDSpeed difference between successive flights on same route & flight levelConsider all flight pairs which are separated by 2 hours or less at entryNote: two hours is more than the maximum time taken by any aircraftto travel between its entry and exit points
Relative velocities of longitudinally proximate pairs
Den
sity
0.000
0.005
0.010
0.015
−100 −50 0 50 100
Quantiles of Normal
Qua
ntile
s of
rel
ativ
e ve
loci
ties
of l
ongi
tudi
nally
pro
xim
ate
pairs
−100
−50
0
50
100
−2 0 2
●●
●●●●
●●●●●●
●●●●●●●●●●●●●●●
●●●●●●●●●●●●●●●●●●●●●●●●●●●●●●●●●●●●●●●●●●●●●
●●●●●●●●●●●●●●●●●●●●●●●●●●●●●●●●●●●●●●●●●●●●●●●●●●●●●●●●●●●●●●●●●●●●●●●●●●●●●●●●●●●●●●●●●●
●●●●●●●●●●●●●●●●●●●●●●●●●●●●●●●●●●●●●●●●●●●●●●●●●●●●●●●●●●●●●●●●●●●●●●●●●●●●●●●●●●●●●●●●●●●●●●●●●●
●●●●●●●●●●●●●●●●●●●●●●●●●●●●●●●●●●●●●●●●●●●●●●●●●●●●●●●●●●●●●●●●●●●●●●●●●●●●●●●●●●●●●●●●●●●●●●●●●●●●●●●●●●●●●●
●●●●●●●●●●●●●●●●●●●●●●●●●●●●●●●●●●●●●●●●●●●●●●●●●●●●●●●●●●●●●●●●●●●●●●●●●●●●●●●●●●●●●●●●●●●●●●●●●●●●●●●●●●●●●●●●●●●●●●●●●●●●●●●●●●●●●●●
●●●●●●●●●●●●●●●●●●●●●●●●●●●●●●●●●●●●●●●●●●●●●●●●●●●●●●●●●●●●●●●●●●●●●●●●●●●●●●●●●●●●●●●●●●●●●●●●●●●●●●●●●●●●●●●●●●●●●●●●●●●●●●●●●●●●●●●●●●●●●●●●●●●●●●●●●●●●●●●●●●●●●●●●●●●●●
●●●●●●●●●●●●●●●●●●●●●●●●●●●●●●●●●●●●●●●●●●●●●●●●●●●●●●●●●●●●●●●●●●●●●●●●●●●●●●●●●●●●●●●●●●●●●●●
●●●●●●●●●●●●●●●●●●●●●●●●●●●●●●●●●●●●●●●●●●●●●●●●●●●●●●●●●●●●●●●●●●●●●●●●●●●●●●●●●●●●●●●●●●●●●●●●●●●●●●●●●●●
●●●●●●●●●●●●●●●●●●●●●●●●●●●●●●●●●●●●●●●●●●●●●●●●●●●●●●●●●●
●●●●●●●●●●●●●●●●●●●●●●●●●●●●●●●●
●●●●●●●●●●●●●●●●●●●●●●●●●●●●●●●●●●●●●●●●●●●
●●●●●●●●●●●●
●●●●●●
●
●●
Antar Bandyopadhyay (ISI, Delhi) Collision Risk Assessment May 7, 2012 39 / 43

Longitudinal CRM Estimates
Estimation of P (K > k)
Estimation using TSD
Speed difference between successive flights on same route & flight levelConsider all flight pairs which are separated by 2 hours or less at entryNote: two hours is more than the maximum time taken by any aircraftto travel between its entry and exit points
Not necessarily Normally distributed
Conservatively take Normal and Double exponential mixture model
fv (v) = pβv2e−βv |v| + (1− p) 1√
2πσe−
v2
2σ2
Parameters (MLE) estimated using EM algorithm, roundedconservatively
Antar Bandyopadhyay (ISI, Delhi) Collision Risk Assessment May 7, 2012 39 / 43

Longitudinal CRM Estimates
Estimation of P (K > k)
Estimation using TSD
Speed difference between successive flights on same route & flight levelConsider all flight pairs which are separated by 2 hours or less at entryNote: two hours is more than the maximum time taken by any aircraftto travel between its entry and exit points
Relative velocities of longitudinally proximate pairs
Den
sity
0.000
0.005
0.010
0.015
−100 −50 0 50 100
Antar Bandyopadhyay (ISI, Delhi) Collision Risk Assessment May 7, 2012 39 / 43
Longitudinal CRM Estimates
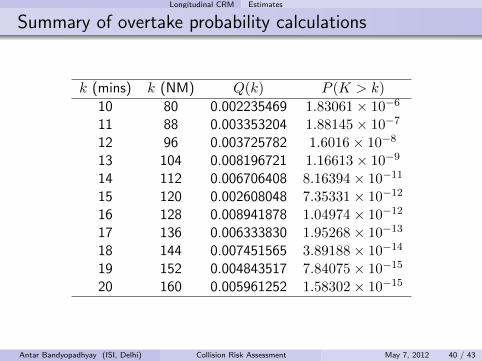
Summary of overtake probability calculations
k (mins) k (NM) Q(k) P (K > k)
10 80 0.002235469 1.83061× 10⁻⁶
11 88 0.003353204 1.88145× 10⁻⁷
12 96 0.003725782 1.6016× 10⁻⁸
13 104 0.008196721 1.16613× 10⁻⁹
14 112 0.006706408 8.16394× 10⁻¹¹
15 120 0.002608048 7.35331× 10⁻¹²
16 128 0.008941878 1.04974× 10⁻¹²
17 136 0.006333830 1.95268× 10⁻¹³
18 144 0.007451565 3.89188× 10⁻¹⁴
19 152 0.004843517 7.84075× 10⁻¹⁵
20 160 0.005961252 1.58302× 10⁻¹⁵
Antar Bandyopadhyay (ISI, Delhi) Collision Risk Assessment May 7, 2012 40 / 43
New things in the Subsequent Analysis
Routine Tasks
We incorporated TSD from other adjacent FIRs.
We also make risk analysis by assuming few GNEs.
We considered cross-routes which are typically not amenable tostandard CRM.
In our latest analysis we have also incorporated internal way-pointsand not just the entry and exit points. This gives better estimation ofthe parameters.
Antar Bandyopadhyay (ISI, Delhi) Collision Risk Assessment May 7, 2012 41 / 43

New things in the Subsequent Analysis
Statistical Challenges which are Yet to be Addressed
How to find any “standard error” or “confidence interval” for theestimated risk ?
Note: Some parameters are not “estimated” in any statistical sense,either they are taken as some fixed values or derived based onpostulated model. But some are estimated from data under certainstatistical model assumptions.
Answer to this is probably through re-sampling methods.
Antar Bandyopadhyay (ISI, Delhi) Collision Risk Assessment May 7, 2012 42 / 43

New things in the Subsequent Analysis
Thank You
Antar Bandyopadhyay (ISI, Delhi) Collision Risk Assessment May 7, 2012 43 / 43