latent topic analysis for predicting group purchasing ...ceur-ws.org/vol-1024/paper-09.pdf ·...
TRANSCRIPT

Latent Topic Analysis for Predicting Group Purchasing Behavior onthe Social Web
Feng-Tso Sun, Martin Griss, and Ole MengshoelElectrical and Computer Engineering Department
Carnegie Mellon University
Yi-Ting YehComputer Science Department
Stanford University
Abstract
Group-deal websites, where customers pur-chase products or services in groups, are aninteresting phenomenon on the Web. Eachpurchase is kicked off by a group initiator,and other customers can join in. Customersform communities with people with similarinterests and preferences (as in a social net-work), and this drives bulk purchasing (sim-ilar to online stores, but in larger quantitiesper order, thus customers get a better deal).In this work, we aim to better understandwhat factors influence customers’ purchasingbehavior for such social group-deal websites.We propose two probabilistic graphical mod-els, i.e., a product-centric inference model(PCIM) and a group-initiator-centric infer-ence model (GICIM), based on Latent Dirich-let Allocation (LDA). Instead of merely us-ing customers’ own purchase history to pre-dict purchasing decisions, these two modelsinclude other social factors. Using a lift curveanalysis, we show that by including social fac-tors in the inference models, PCIM achieves35% of the target customers within 5% of thetotal number of customers while GICIM isable to reach 85% of the target customers.Both PCIM and GICIM outperform randomguessing and models that do not take socialfactors into account.
1 Introduction
Group purchasing is a business model that offers var-ious deals-of-the-day and an extra discount depend-ing on the size of the purchasing group. After group-deal websites, such as Groupon and LivingSocial, havegained attention, similar websites, such as ihergo1
1http://www.ihergo.com
and Taobao,2 have introduced social networks as afeature for their users. These group-deal websites pro-vide an interesting hybrid of social networks (e.g.,Facebook.com and LinkedIn.com) and online stores(e.g., Amazon.com and Buy.com). Customers formcommunities with people with similar interests andpreferences (as in a social network), and this drivesbulk purchasing (similar to online stores, but in largerquantities per order, thus customers get a better deal).As we see more and more social interactions amongcustomers in group-deal websites, it is critical to un-derstand the interplay between social factors and pur-chasing preferences.
In this paper, we analyze a transactional datasetfrom the largest social group-deal website in Taiwan,ihergo.com. Figure 1 shows a screenshot from thegroup-deal page of ihergo.com. Each group-purchasingevent on ihergo.com consists of three major compo-nents: (1) a group initiator, (2) a number of groupmembers, and (3) a group-deal product. A group ini-tiator starts a group-purchasing event for a specificgroup-deal product. While this event will be postedpublicly, the group initiator’s friends will also be no-tified. A user can choose to join the purchasing eventto become a group member.
Group initiators play important roles on this kind ofgroup-deal websites. Usually, the merchants would of-fer incentives for the group initiators to initiate group-purchasing events by giving them products for free ifthe size of the group exceeds some threshold. In addi-tion, to save shipping costs, the group can choose tohave the whole group-deal order shipped to the initia-tor. In this case, the initiator would need to distributethe products to group members in person. Hence, thegroup members usually reside or work in the proximityof the group initiator. Sometimes, they are friends orco-workers of the initiator.
Understanding customers’ purchasing behavior in this
2http://www.taobao.com

kind of social group-purchasing scenario could helpgroup-deal websites strategically design their offerings.Traditionally, customers search for or browse productsof their interests on websites like Amazon.com. How-ever, on social group-deal websites, customers can per-form not only product search, but they can also browsegroup deals and search for initiators by ratings and lo-cations. Therefore, a good recommender system [1]for social group-deal websites should take this into ac-count. If the website can predict which customers aremore likely to join a group-purchasing event startedby a specific initiator, it can maximize group sizes andmerchants’ profits in a shorter period of time by de-livering targeted advertising. For example, instead ofspamming everyone, the website can send out notifi-cations or coupons to the users who are most likely tojoin the group-purchasing events.
In this work, we aim to predict potential customerswho are most likely to join a group-purchasing event.We apply Latent Dirichlet Allocation (LDA) [2] to cap-ture customers’ purchasing preferences, and evaluateour proposed predictive models based on a one-yeargroup-purchasing dataset from ihergo.com.
Our contributions in understanding the importance ofsocial factors for group-deal customers’ decisions arethe following:
• A new type of group-purchasing dataset.We introduce and analyze a new type of group-purchasing dataset, which consists of 5,602 users,26,619 products and 13,609 group-purchasingevents.
• Predictive models for group-deal cus-tomers. Based on topic models, we propose twopredictive models that include social factor. Theyachieve higher prediction accuracy compared tothe baseline models.
In the next section, we describe related work in thearea of group purchasing behavior, social recommen-dations, and topic models for customer preferences.Section 3 introduces and analyzes the characteristicsof our real-world group-purchasing dataset. In Sec-tion 4, we first review LDA, then present two proposedpredictive models for group-deal customer prediction.Experimental results are given in Section 5. Finally,conclusion and future research direction are presentedin Section 6.
2 Related Work
In this section, we review related work in three areas:(1) group purchasing behavior, (2) social recommen-dations, and (3) topic models for customer preferences.
to initiate a groupnumber of group members
initiator
group-deal productfilter by
initiator's ratingactive period of group deal
filter by meet-up location
Figure 1: Screenshot of the group-deal page fromihergo.com.
Group Purchasing Behavior. Since group-dealwebsites such as Groupon and LivingSocial gained at-tention, several studies have been conducted to under-stand factors influencing group purchasing behavior.Byers et al. analyzed purchase histories of Grouponand LivingSocial [3]. They showed that Groupon op-timizes deal offers strategically by giving “soft” incen-tives, such as deal scheduling and duration, to encour-age purchases. Byers et al. also compared Grouponand LivingSocial sales with additional datasets fromYelp’s reviews and Facebook’s like counts [4]. Theyshowed that group-deal sites benefit significantly fromword-of-mouth effects on users’ reviews during salesevents. Edelman et al. studied the benefits and draw-backs of using Groupon from the point of view of themerchants [6]. Their work modeled whether adver-tising and price discrimination effects can make dis-counts profitable. Ye et al. introduced a predictivedynamic model for group purchasing behavior. Thismodel incorporates social propagation effects to pre-dict the popularity of group deals as a function oftime [19]. In this work, we focus on potential cus-tomer prediction, as opposed to modeling the overalldeal purchasing sales over time.
Social Recommendations. In real life, a cus-tomer’s purchasing decision is influenced by his or hersocial ties. Guo et al. analyzed the dataset from thelargest Chinese e-commerce website, Taobao, to studythe relationship between information passed amongbuyers and purchasing decision [7]. Leskovec et al.used a stochastic model to explain the propagation ofrecommendations and cascade sizes [11]. They showed
that social factors have a different level of impact onuser purchasing decision for different products. More-over, previous work also tried to incorporate socialinformation into existing recommendation techniques,such as collaborative filtering [13, 14, 20, 12]. Re-cently, many recommendation systems have been im-plemented, taking advantage of social network infor-mation in addition to users’ preferences to improve rec-ommendation accuracy. For example, Yang et al. pro-posed a Bayesian-inference based movie recommenda-tion system for online social networks [18]. Our workconsiders the relationship between the group initiatorand the group members as a social tie to augment cus-tomer prediction for group-purchasing events.
Topic Models for Customer Preference. Topicmodels such as LDA have been widely and successfullyused in many applications including language model-ing [2], text mining [17], human behavior modeling [9],social network analysis [5], and collaborative filter-ing [8]. Researchers have also proposed new topic mod-els for purchasing behavior modeling. For example,topic models have been extended with price informa-tion to analyze purchase data [10]. By estimating themean and the variance of the price for each product,the proposed model can cluster related items by takingtheir price ranges into account. Iwata and Watanabeproposed a topic model for tracking time-varying con-sumer purchase behavior, in which consumer interestsand item trends change over time [9]. In this paper,we use LDA to learn topic proportions from purchasehistory to represent customers’ purchasing preferences.
3 Group-Purchasing Dataset
The dataset for our data analysis comes from users’transactional data of a group-deal website, ihergo. Itis the largest social group-deal website in Taiwan. Wecollected longitudinal data between October 1st 2011and October 1st 2012. From the users’ geographicalprofile, we are able to group them based on their livingarea. For this study, we include all 5,602 users livingin Taipei, the capital of Taiwan. In total, our datasetcontains 26,619 products and 13,609 group-purchasingevents.
On ihergo, users can purchase a product by joining agroup-purchasing event. There are two roles amongthe users: 1) the group initiator and 2) the groupmember. A group initiator initiates a purchase groupwhich other users can join to become group members.Once the group size exceeds some threshold, the groupmembers can get a discount on the product while theinitiator can get the product for free. Sometimes thegroup initiator and the group members already knoweach other before they join the same group-purchasing
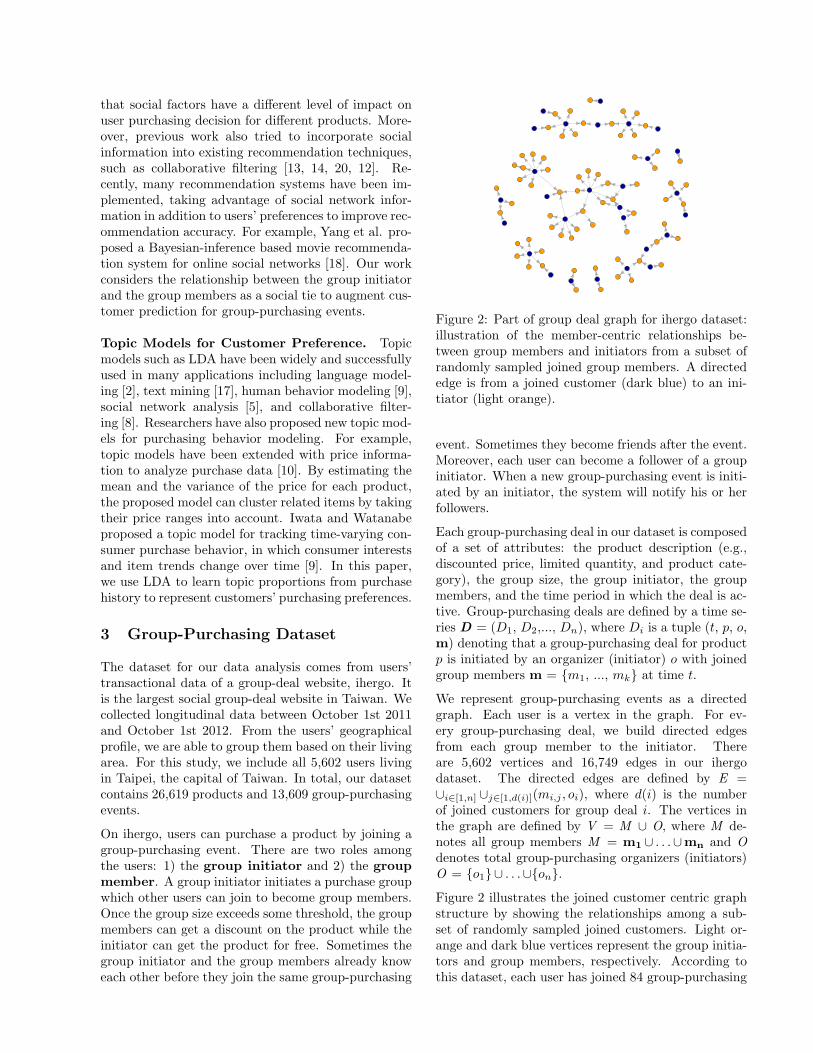
Figure 2: Part of group deal graph for ihergo dataset:illustration of the member-centric relationships be-tween group members and initiators from a subset ofrandomly sampled joined group members. A directededge is from a joined customer (dark blue) to an ini-tiator (light orange).
event. Sometimes they become friends after the event.Moreover, each user can become a follower of a groupinitiator. When a new group-purchasing event is initi-ated by an initiator, the system will notify his or herfollowers.
Each group-purchasing deal in our dataset is composedof a set of attributes: the product description (e.g.,discounted price, limited quantity, and product cate-gory), the group size, the group initiator, the groupmembers, and the time period in which the deal is ac-tive. Group-purchasing deals are defined by a time se-ries D = (D1, D2,..., Dn), where Di is a tuple (t, p, o,m) denoting that a group-purchasing deal for productp is initiated by an organizer (initiator) o with joinedgroup members m = m1, ..., mk at time t.
We represent group-purchasing events as a directedgraph. Each user is a vertex in the graph. For ev-ery group-purchasing deal, we build directed edgesfrom each group member to the initiator. Thereare 5,602 vertices and 16,749 edges in our ihergodataset. The directed edges are defined by E =∪i∈[1,n] ∪j∈[1,d(i)](mi,j , oi), where d(i) is the numberof joined customers for group deal i. The vertices inthe graph are defined by V = M ∪ O, where M de-notes all group members M = m1 ∪ . . .∪mn and Odenotes total group-purchasing organizers (initiators)O = o1∪ . . .∪on.
Figure 2 illustrates the joined customer centric graphstructure by showing the relationships among a sub-set of randomly sampled joined customers. Light or-ange and dark blue vertices represent the group initia-tors and group members, respectively. According tothis dataset, each user has joined 84 group-purchasing
node out degree10 20 30
0
0.3de
gree
dist
ribut
ion
0.2
0.1
0 5 10 15 20 25 30 35
0.00
0.10
0.20
0.30
node degree
degr
ee.d
istri
butio
n(g,
mod
e =
c("o
ut"))
0
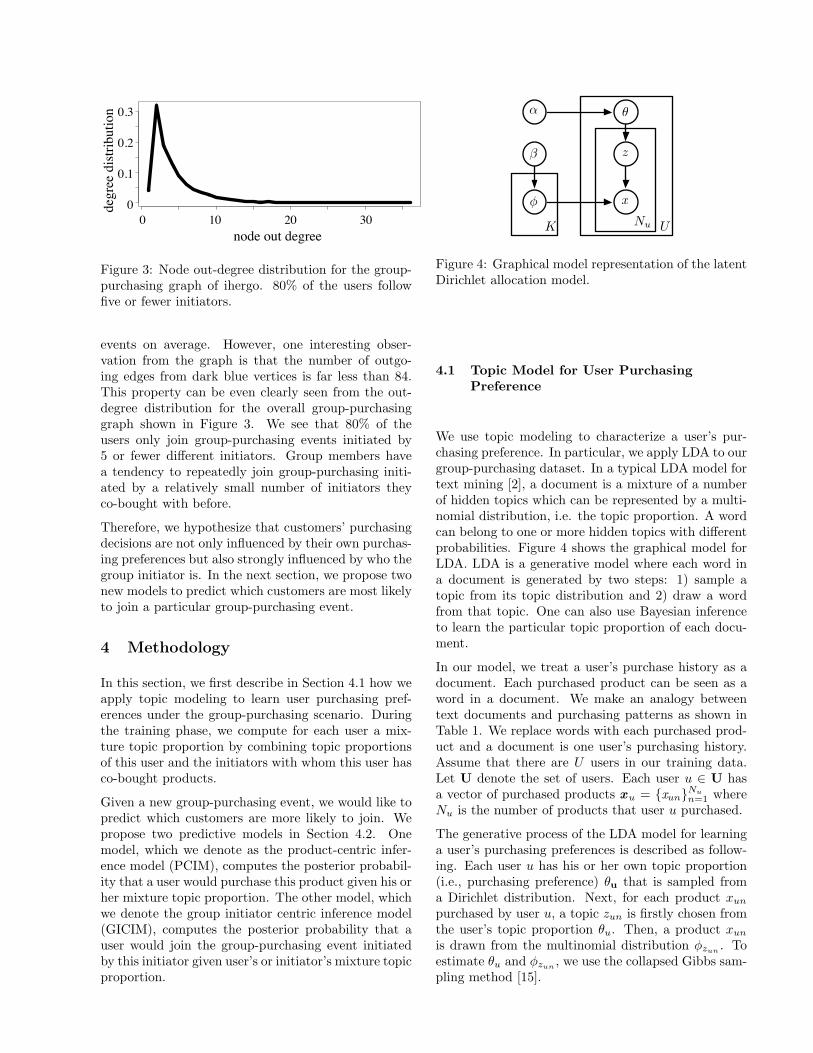
Figure 3: Node out-degree distribution for the group-purchasing graph of ihergo. 80% of the users followfive or fewer initiators.
events on average. However, one interesting obser-vation from the graph is that the number of outgo-ing edges from dark blue vertices is far less than 84.This property can be even clearly seen from the out-degree distribution for the overall group-purchasinggraph shown in Figure 3. We see that 80% of theusers only join group-purchasing events initiated by5 or fewer different initiators. Group members havea tendency to repeatedly join group-purchasing initi-ated by a relatively small number of initiators theyco-bought with before.
Therefore, we hypothesize that customers’ purchasingdecisions are not only influenced by their own purchas-ing preferences but also strongly influenced by who thegroup initiator is. In the next section, we propose twonew models to predict which customers are most likelyto join a particular group-purchasing event.
4 Methodology
In this section, we first describe in Section 4.1 how weapply topic modeling to learn user purchasing pref-erences under the group-purchasing scenario. Duringthe training phase, we compute for each user a mix-ture topic proportion by combining topic proportionsof this user and the initiators with whom this user hasco-bought products.
Given a new group-purchasing event, we would like topredict which customers are more likely to join. Wepropose two predictive models in Section 4.2. Onemodel, which we denote as the product-centric infer-ence model (PCIM), computes the posterior probabil-ity that a user would purchase this product given his orher mixture topic proportion. The other model, whichwe denote the group initiator centric inference model(GICIM), computes the posterior probability that auser would join the group-purchasing event initiatedby this initiator given user’s or initiator’s mixture topicproportion.
↵
z
x
K UNu
Figure 4: Graphical model representation of the latentDirichlet allocation model.
4.1 Topic Model for User PurchasingPreference
We use topic modeling to characterize a user’s pur-chasing preference. In particular, we apply LDA to ourgroup-purchasing dataset. In a typical LDA model fortext mining [2], a document is a mixture of a numberof hidden topics which can be represented by a multi-nomial distribution, i.e. the topic proportion. A wordcan belong to one or more hidden topics with differentprobabilities. Figure 4 shows the graphical model forLDA. LDA is a generative model where each word ina document is generated by two steps: 1) sample atopic from its topic distribution and 2) draw a wordfrom that topic. One can also use Bayesian inferenceto learn the particular topic proportion of each docu-ment.
In our model, we treat a user’s purchase history as adocument. Each purchased product can be seen as aword in a document. We make an analogy betweentext documents and purchasing patterns as shown inTable 1. We replace words with each purchased prod-uct and a document is one user’s purchasing history.Assume that there are U users in our training data.Let U denote the set of users. Each user u ∈ U hasa vector of purchased products xu = xunNu
n=1 whereNu is the number of products that user u purchased.
The generative process of the LDA model for learninga user’s purchasing preferences is described as follow-ing. Each user u has his or her own topic proportion(i.e., purchasing preference) θu that is sampled froma Dirichlet distribution. Next, for each product xun
purchased by user u, a topic zun is firstly chosen fromthe user’s topic proportion θu. Then, a product xun
is drawn from the multinomial distribution φzun . Toestimate θu and φzun
, we use the collapsed Gibbs sam-pling method [15].

Symbol Description for Group Purchase History Description for Text DocumentsU Number of users Number of documentsK Number of latent topics Number of latent topicsNu Number of purchased products of user u Number of words of document uzun Latent co-purchasing category of nth product Latent topic of nth word of document uxun nth purchased product of user u nth word of document uθu Latent co-purchasing category proportion for user u Topic proportin for document uφk Multinomial distribution over products for topic k Mult. distribution over words for topic kα Dirichlet prior parameters for all θu Dirichlet prior parameters for all θu
β Dirichlet prior parameters for all φk Dirichlet prior parameters for all φk
Table 1: Latent Dirichlet allocation plate model notation
4.2 Proposed Models for PredictingGroup-Deal Customers
A group-purchasing event contains two kinds of criticalinformation: who the group initiator is and what thegroup-deal product is. Our goal is to predict whichcustomers are more likely to join a specific group-purchasing event. Intuitively, one may think thatwhether a customer would join a group-purchasingevent solely depends on what the group-deal productis. However, from our observations in the dataset, wehypothesize a correlation between a customer’s pur-chasing decision and who the group initiator is. There-fore, we would like to study how these two kinds ofgroup-purchasing information affect the prediction ac-curacy by asking two questions:
1. What is the likelihood that a customer would jointhe event given what the group-deal product is?
2. What is the likelihood that a customer would jointhe event given who the group-initiator is?
This leads to our two proposed predictive models,the product centric inference model (PCIM ) and thegroup initiator centric inference model (GICIM ).
4.2.1 Product Centric Inference Model(PCIM)
Figure 5(a) shows the graphical structure of PCIM.For each user, we train a PCIM. PCIM computes theposterior probability that a user would purchase aproduct given his or her mixture topic proportion. LetC denote the user’s own topic proportion, which welearned from LDA. Suppose that this user has joinedgroup-purchasing events initiated by n group initia-tors, we use Iin
i=1 to denote the learned topic pro-portions of these initiators. Our model computes theweighted topic proportions of initiators W by linearlycombining Iin
i=1 with the frequency distribution thatthe user co-bought products with them.
Intuitively, if a user joins a group-purchasing eventinitiated by a group initiator, they might share sim-ilar interests. Therefore, our model characterizes theuser’s purchasing preferences by a weighting schemethat combines C and W with a weighting parameterw. We use M to denote such a mixture topic propor-tion which encodes the overall purchasing preferencesof the user.
Let P denote the product random variable. Ω(P) =p1, ..., pm, where pi is the product. From each datarecord Di ∈D , we have a tuple (ti, pi, oi, mi) andknow what group-deal product pi corresponds to a par-ticular group-purchasing event ei. Our goal is to com-pute Pr(P = pi), the probability that the user wouldjoin a group-purchasing event ei to buy a product pi.
Given the topic proportion C and Iini=1 correspond-
ing to the user and the weighting parameter w, we areable to compute
Pr(P ) =∑
Y=Xp\P
Pr(P,Y) (1)
where Xp = P,M,C,W, I1, ..., In; P a is productrandom variable; M is a mixture topic proportion.
To predict which users are more likely to join a group-purchasing event, we rank P(u1)
pi , . . . ,P(uU )pi in de-
scending order where u1, . . . , uU denotes the set ofusers in our dataset and P(uj)
pi denotes Pr(P = pi) ofuser uj .
4.2.2 Group Initiator Centric InferenceModel (GICIM)
The graphical illustration of GICIM is shown in Figure5(b). GICIM computes the posterior probability thata user would join a group-purchasing event initiatedby a particular initiator given user’s or initiator’s mix-ture topic proportion. GICIM and PCIM only differin their leaf nodes. While PCIM considers only whatthe group-deal product is, GICIM models our observa-tion that the decision of whether or not a user joins a

Figure 5: Our proposed models for predicting poten-tial customers given a group-purchasing event. (a)Product centric inference model (PCIM). (b) Groupinitiator centric inference model (GICIM).
group-purchasing event is strongly influenced by whothe group initiator of that event is.
Let I denote the initiator random variable and ii de-note the initiator of the group-purchasing event ei.Again, from each data record Di ∈D , we know who thegroup initiator is. Instead of evaluating Pr(P = pi) asin PCIM, we use GICIM to compute
Pr(I) =∑
Y=Xp\I
Pr(I,Y) (2)
where Xp = I, M, C, W, I1, ..., In; I is an initiatorrandom variable; M is a mixture topic proportion.
To predict which users are more likely to join a group-purchasing event ei, we rank P(u1)
oi , . . . ,P(uU )oi in de-
scending order where u1, . . . , uU denotes the set ofusers in our dataset and P(uj)
oi denotes Pr(I = oi) ofuser uj .
5 Experimental Evaluation
5.1 Data Pre-processing
We evaluate the proposed PCIM and GICIM mod-els with the ihergo group-purchasing dataset. In or-der to capture meaningful user purchasing preferences,we remove users who purchased fewer than 10 prod-ucts during the pre-processing step. We use ten-foldcross-validation to generate our training and testingdatasets.
5.2 LDA Topic Modeling on GroupPurchasing Dataset
To measure the performance of LDA for different num-ber of topics (20, 40, 60, 80, 100) in our group-
4000
6000
8000
100 200 300 400 500#iterations
perplexity
model_type
20
40
60
80
100
Number of Iterations
Perp
lexi
ty
100 2000 400
6000
4000
8000
300
Number of Topics
500
4000
6000
8000
100 200 300 400 500#iterations
perplexity
model_type
20
40
60
80
100
20406080100
Figure 6: Perplexity as function of collapsed Gibbssampling iterations for different number of topics usedin LDA.
purchasing dataset, we compute the perplexity. Itmeasures how well the model generalizes and predictsnew documents [2]. Figure 6 shows that the per-plexity decreases as the number of iteration increasesand converges within 200 iterations. In addition, aswe increase the number of topics, the perplexity de-creases. Unless mentioned specifically, all topic pro-portions used in our experiments are learned with LDAusing 100 topics.
Figure 7 shows three example product topics learnedby LDA using 100 topics. Each table shows the tenproducts that are most likely to be bought in thattopic. Columns in the table represent the productname, the probability of the product being purchasedin that topic, and the ground-truth category of theproduct, respectively. We see that Topic 1 is about“pasta.” It contains a variety of cooked pasta andpasta sauce. Topic 18 and 53 are respectively about“bread and cakes” and “women accessories.”
Figure 8 shows the topic proportions of four randomlyselected users learned by LDA using 60 topics. We seethat different users have distinguishable topic propor-tions, representing their purchasing preferences. Forexample, user #3617 purchased many products thatare about “beauty” and “clothing” so her or his topicproportion has higher probabilities at topic 4 and topic17. Similarly, user #39 tends to buy products in the“dim sum” category which can be represented in heror his topic proportion.

(a) User #3617 (b) User #5 (c) User #2618 (d) User #39
prob
abili
ty
topic0 20 40 60
0
0.1
0.2
0.00
0.05
0.10
0.15
0.20
0 20 40 60topic
prob
types_tp
buyer_tp
clothingbeauty
topic0 20 40 60
0
0.1
0.2
0.00
0.05
0.10
0.15
0.20
0 20 40 60topic
prob
types_tp
buyer_tp
microwavable food
topic0 20 40 60
0
0.1
0.2
0.00
0.05
0.10
0.15
0.20
0 20 40 60topic
prob
types_tp
buyer_tp
dim sum
topic0 20 40 60
0
0.1
0.2
0.00
0.05
0.10
0.15
0.20
0 20 40 60topic
prob
types_tp
buyer_tp
juicecookies
Figure 8: Examples illustrating learned topic proportions of four randomly selected users. For user #3617, thetwo most probable topics are “beauty” and “clothing”.
(a) Topic 1, "pasta"
(b) Topic 18, "bread and cakes"
(c) Topic 53, "women accessories"
Symbol DescriptionU Number of usersI Number of productsK Number of latent topicsNu Number of purchased products of user u
zun Latent topic of nth purchased product of user u
xun nth purchased product of user u
u Topic proportion for user u, u=ukKk=1, uk 0,
KPk=1
uk = 1
k Multinomial distribution over products for topic k, k=kiIi=1, ki 0,
IPi=1
ki = 1
↵ Dirichlet prior parameters for all u
Dirichlet prior parameters for all k
Table 1: LDA plate model notation
their purchase preference. For example, user2 purchasedmany products that are most likely in ”Seafood” category,hence, his topic proportion has higher probability at topic 4,”Seafood” category. Similarly, user10 tends to buy productsin ”Pasta” category which can be represented in his topicproportion.
5.3 Performance of PCIM and GICIMTo evaluate the performance of PCIM and GICIM, we use
lift chart to measure the e↵ectiveness of prediction result forgroup-buying buyers. In a lift chart, the x-axis represents isthe percentage of users sorted by our prediction score andthe y-axis is the cumulative percentage of the ground-truthbuyers we would predict.
For the evaluation of PCIM and GICIM, we use users’topic proportions and product’s topic proportion as input.Figure 7 shows the performance of PCIM model with dif-ferent weighting of co-occurrence initiator influence. As wecan observe, PCIM with user’s topic proportion only (w=1)has better prediction with 25% of predicted buyers. How-ever, the performance degrades and is worse than randomsample (baseline) after including 65% of predicted users.This e↵ect can be explained that users who have no strongpurchase preference have low prediction score and PCIMmodel cannot correctly predict. On the other hand, us-ing co-occurrence initiator topic proportions (w<1), PCIMachieves better prediction after including 40% of predictedusers. Overall performance is better than random samplewith co-occurrence initiator topic proportions only (w=0),though the positive response rate is slightly lower than user’stopic proportion only setting (w=1) before including 40%predicted users.
Figure 8 demonstrates the performance of GICIM modelwith di↵erent weighting of co-occurrence initiator influence.GICIM model significantly outperforms PCIM and it achieves90% positive response by only including 10% predicted buy-ers. The performance change due to the di↵erent weightingof co-occurrence initiator influence is not as significant asin PCIM. The high prediction rate of GICIM explains thatmost of users choose join the purchase group or not basedon who the group initiator is.
In Figure 10, we found PCIM and GICIM models havethe consistent performance over di↵erent product categories(e.g., food, bodycare, apparel, toys, and living). Moreover,GICIM outperforms PICIM over all product categories.
product prob. categoryChicken pasta (cream sauce) 0.0197 PastaChicken pasta (pesto sauce) 0.0193 PastaPork pasta (tomato sauce) 0.0167 PastaPork steak 0.0155 MeatBacon pasta (cream sauce) 0.0153 PastaSpicy pasta (tomato sauce) 0.0149 PastaClam garlic linguine 0.0146 PastaTomato sauce pasta 0.0142 PastaGerman sausage sauce 0.0132 PastaItalian pasta (cooked) 0.0129 Pasta
Table 2: Illustration of product topics created byLDA. Category is from ground truth.
product prob. categoryHam sandwich 0.0101 BreadCheese sandwich 0.0089 BreadMilk bar cookie 0.0080 CookieCherry chocolate tart 0.0078 CakeCheese roll 0.0077 CakeCheese almond tart 0.0074 CakeTaro toast 0.0073 BreadCreme Brulee 0.0073 CakeRaisin toast 0.0071 BreadWheat ham sandwich 0.0070 Bread
Table 3: Topic 18.
product prob. categoryKnit Hat 0.0169 AccessoryKnit Scarf 0.0165 AccessoryLegging 0.0133 ClothingWool scarf 0.0120 AccessoryLong Pant 0.0111 ClothingCotton Socks 0.0099 AccessoryWool Gloves 0.0097 AccessoryFacial Masks 0.0090 BodyCareWool socks 0.0088 AccessoryBrown knit scarf 0.0081 Accessory
Table 4: Topic 53.
Product
Product
Product
Prob. Category
Prob. Category
Prob. Category
PastaPastaPasta
PastaPastaPastaPastaPastaPastaMeat
BreadBreadCookie
BreadBreadCakeBreadCakeCakeCake
AccessoryAccessoryClothing
AccessoryAccessoryBody CareAccessoryAccessoryClothingAccessory
Figure 7: Illustration of product topics learned byLDA using 100 topics. Category is from ground truth.
5.3 Performance of PCIM and GICIM
We use lift charts to measure the effectiveness ofPCIM and GICIM for predicting group-purchasingcustomers. In a lift chart, the x-axis represents thepercentage of users sorted by our prediction score andthe y-axis represents the cumulative percentage of theground-truth customers we would predict. For all liftcharts shown in this section, we also include two base-line models for comparison. One baseline model isto predict potential customers by randomly samplingfrom the set of users. Therefore, it is a straight linewith slope 1.0 on the lift chart. Another baselinemodel, which we call category frequency, is to predictcustomers with the most frequent purchase history ina given product category. Specifically, to predict po-tential customers given a group-deal product category,we rank each customer in descending order of theirnormalized purchase frequency for the given productcategory.
Effect of w. We first measure the effect of the weight-ing parameter w in PCIM, which is shown in Figure 9.The particular w controls how much the user’s owntopic proportion is used in the mixture topic propor-tion. For example, w = 1 means that only the user’sown topic proportion is used as the mixture topic pro-portion. We see that for all w values, PCIM performsmuch better than the baseline models between 0% and25% of the customers predicted. For instance, PCIMis able to reach 50% of the targeted customers whilethe two baseline models only reach respectively 25%and 40% of the customers.
We also see that with w = 1, the curve first rises veryfast, then flattens between 25% and 50%. It evenperforms worse than the baseline models starting ataround 60% of the customers predicted; however thisis the least interesting part of the curve. The intuitionbehind this behavior is that with w = 1, PCIM is goodat predicting customers who have strong purchasingpreferences that match the targeted group-deal prod-uct. On the other hand, for users without such strongpurchasing preferences, the model is not able to per-

Customers Predicted (%)
Posit
ive
Resp
onse
(%)
25 50
0
0 100
50
25
75
75
100
0
25
50
75
100
0 25 50 75 100Buyers Predicted (%)
Posit
ive R
espo
nses
(%)
model_type
PCIM−w=0
PCIM−w=0.2
PCIM−w=0.4
PCIM−w=0.6
PCIM−w=0.8
PCIM−w=1.0
random_sample
category_frequency
0
25
50
75
100
0 25 50 75 100Buyers Predicted (%)
Posi
tive
Res
pons
es(%
)
model_type
GICIM−w=0
GICIM−w=0.2
GICIM−w=0.4
GICIM−w=0.6
GICIM−w=0.8
GICIM−w=1.0
random_sample
category_frequency
Model Type
Figure 9: Lift chart of PCIM with different weight-ing parameter values. With w = 1, the model onlyincludes the user’s own topic proportion.
Customers Predicted (%)
Posit
ive
Resp
onse
(%)
25 50
0
0 100
50
25
75
75
100
0
25
50
75
100
0 25 50 75 100Buyers Predicted (%)
Posi
tive
Res
pons
es(%
)
model_type
GICIM−w=0
GICIM−w=0.2
GICIM−w=0.4
GICIM−w=0.6
GICIM−w=0.8
GICIM−w=1.0
random_sample
category_frequency
Model Type
Figure 10: Lift chart of GICIM with different weight-ing parameter values. With w = 1, the model onlyincludes the user’s own topic proportion.
0
25
50
75
100
0 25 50 75 100Buyers Predicted (%)
Posi
tive
Res
pons
es(%
)
model_type
PCIM−Food
PCIM−BodyCare
PCIM−Apparel
PCIM−Toys,Kids&Baby
PCIM−Living
random_sample
(a) PCIM
(b) GICIM
Customers Predicted (%)
Posit
ive
Resp
onse
(%)
25 50 0
0 100
50
25
75
75
100
0
25
50
75
100
0 25 50 75 100Buyers Predicted (%)
Posi
tive
Res
pons
es(%
)
model_type
GICIM−Food
GICIM−BodyCare
GICIM−Apparel
GICIM−Toys,Kids&Baby
GICIM−Living
PCIM−Food
PCIM−BodyCare
PCIM−Apparel
PCIM−Toys,Kids&Baby
PCIM−Living
random_sample
0
25
50
75
100
0 25 50 75 100Buyers Predicted (%)
Posi
tive
Res
pons
es(%
)model_type
GICIM−Food
GICIM−BodyCare
GICIM−Apparel
GICIM−Toys,Kids&Baby
GICIM−Living
PCIM−Food
PCIM−BodyCare
PCIM−Apparel
PCIM−Toys,Kids&Baby
PCIM−Living
random_sample
FoodBodyCareApparel
LivingToys
baseline
0
25
50
75
100
0 25 50 75 100Buyers Predicted (%)
Posi
tive
Res
pons
es(%
)
model_type
PCIM−Food
PCIM−BodyCare
PCIM−Apparel
PCIM−Toys,Kids&Baby
PCIM−Living
random_sample
FoodBodyCareApparel
LivingToys
baseline
0
25
50
75
100
0 25 50 75 100Buyers Predicted (%)
Posi
tive
Res
pons
es(%
)
model_type
GICIM−Food
GICIM−BodyCare
GICIM−Apparel
GICIM−Toys,Kids&Baby
GICIM−Living
PCIM−Food
PCIM−BodyCare
PCIM−Apparel
PCIM−Toys,Kids&Baby
PCIM−Living
random_sample
Food
BodyCare0
25
50
75
100
0 25 50 75 100Buyers Predicted (%)
Posi
tive
Res
pons
es(%
)
model_type
PCIM−Food
PCIM−BodyCare
PCIM−Apparel
PCIM−Toys,Kids&Baby
PCIM−Living
random_sample
Food
BodyCare
Zoomed-in Window
Zoomed-in Window
Customers Predicted (%)Po
sitiv
e Re
spon
se (%
)25 50
00 100
50
25
75
75
100
Figure 11: Lift charts of PCIM and GICIM over differ-ent product categories. The zoomed-in windows on theright show that performance is slightly better on fre-quently purchased items (Food) than on infrequentlypurchased items (Body Care).
form well. In general, by introducing the topic propor-tions of initiators with whom the user has co-boughtproducts (w < 1), PCIM is able to reduce the flatten-ing effect. With w = 1, we see that the lift curve isalways above the baseline.
Figure 10 shows the effect of w in GICIM. We seethat GICIM always performs better than PCIM andthe baseline model even for the case where w = 1.In particular, for the cases where w < 0.8, GICIMachieves 90% positive response with only 10% of thepredicted customers. The high prediction success ofGICIM can be explained by the fact that whether auser chooses to join a group-purchasing event or notdepends on who the group initiator is. We also notethat the performance change due to different w valuesis not as significant as for PCIM.
Performance on different product categories.We next investigate whether frequently purchaseditems (e.g., drinks and food items) make PCIM andGICIM perform differently. We test on five differentcategories of group-deal products: food, body care, ap-parel, toys, and living. The ground-truth categoriesare from the dataset.
0
25
50
75
100
0 25 50 75 100Buyers Predicted (%)
Posi
tive
Res
pons
es(%
)
model_type
GICIM−w=0−k=20
GICIM−w=0−k=40
GICIM−w=0−k=60
GICIM−w=0−k=80
GICIM−w=0−k=100
random_sample
0
25
50
75
100
0 25 50 75 100Buyers Predicted (%)
Posi
tive
Res
pons
es(%
)
model_type
GICIM−w=1−k=20
GICIM−w=1−k=40
GICIM−w=1−k=60
GICIM−w=1−k=80
GICIM−w=1−k=100
random_sample
0
25
50
75
100
0 25 50 75 100Buyers Predicted (%)
Posi
tive
Res
pons
es(%
)
model_type
PCIM−w=0−k=20
PCIM−w=0−k=40
PCIM−w=0−k=60
PCIM−w=0−k=80
PCIM−w=0−k=100
random_sample
0
25
50
75
100
0 25 50 75 100Buyers Predicted (%)
Posi
tive
Res
pons
es(%
)
model_type
PCIM−w=1−k=20
PCIM−w=1−k=40
PCIM−w=1−k=60
PCIM−w=1−k=80
PCIM−w=1−k=100
random_sample
(a) PCIM, w = 0 (b) PCIM, w = 1
(c) GICIM, w = 0 (d) GICIM, w = 1
k=20
0
25
50
75
100
0 25 50 75 100Buyers Predicted (%)
Posi
tive
Res
pons
es(%
)
model_type
GICIM−w=1−k=20
GICIM−w=1−k=40
GICIM−w=1−k=60
GICIM−w=1−k=80
GICIM−w=1−k=100
random_sample
k=40k=60k=80k=100baseline
k=20
0
25
50
75
100
0 25 50 75 100Buyers Predicted (%)
Posi
tive
Res
pons
es(%
)
model_type
GICIM−w=1−k=20
GICIM−w=1−k=40
GICIM−w=1−k=60
GICIM−w=1−k=80
GICIM−w=1−k=100
random_sample
k=40k=60k=80k=100baseline
k=20
0
25
50
75
100
0 25 50 75 100Buyers Predicted (%)
Posi
tive
Res
pons
es(%
)
model_type
GICIM−w=1−k=20
GICIM−w=1−k=40
GICIM−w=1−k=60
GICIM−w=1−k=80
GICIM−w=1−k=100
random_sample
k=40k=60k=80k=100baseline
k=20
0
25
50
75
100
0 25 50 75 100Buyers Predicted (%)
Posi
tive
Res
pons
es(%
)
model_type
GICIM−w=1−k=20
GICIM−w=1−k=40
GICIM−w=1−k=60
GICIM−w=1−k=80
GICIM−w=1−k=100
random_sample
k=40k=60k=80k=100baseline
Customers Predicted (%)
Posit
ive
Resp
onse
(%)
25 50 0
0 100
50
25
75
75
100
Customers Predicted (%)
Posit
ive
Resp
onse
(%)
25 50 0
0 100
50
25
75
75
100
Customers Predicted (%)
Posit
ive
Resp
onse
(%)
25 50 0
0 100
50
25
75
75
100
Customers Predicted (%)Po
sitiv
e Re
spon
se (%
)
25 50 0
0 100
50
25
75
75
100
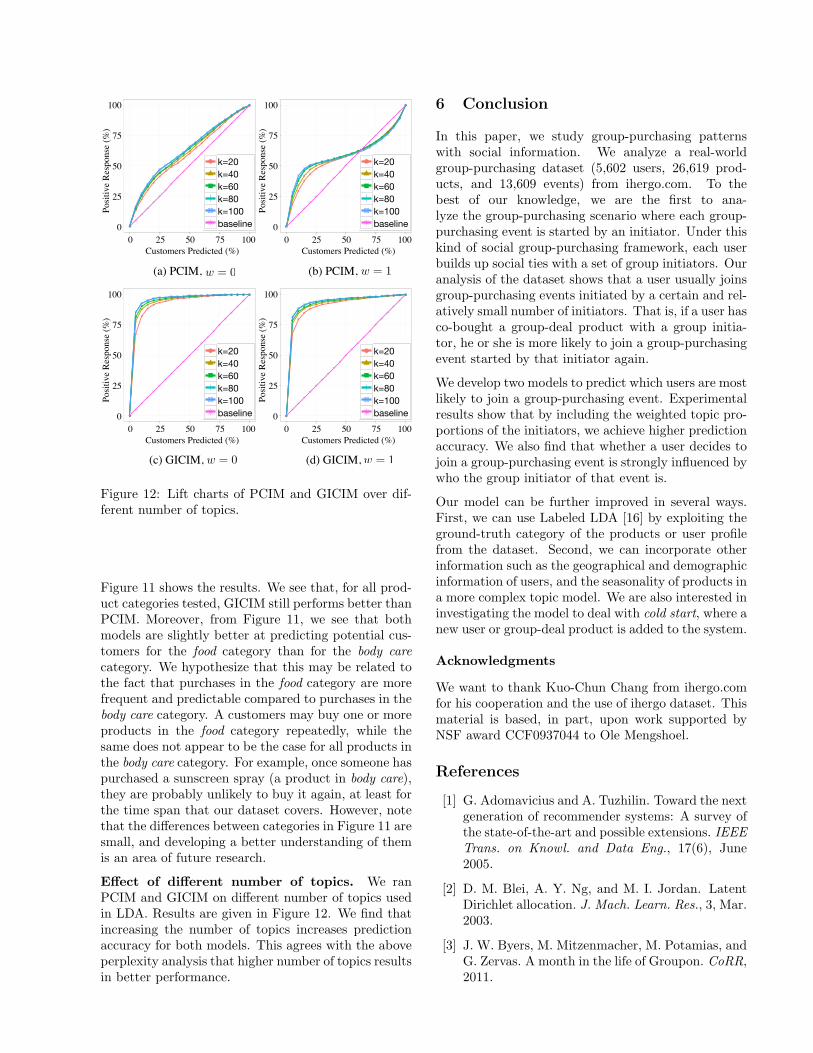
Figure 12: Lift charts of PCIM and GICIM over dif-ferent number of topics.
Figure 11 shows the results. We see that, for all prod-uct categories tested, GICIM still performs better thanPCIM. Moreover, from Figure 11, we see that bothmodels are slightly better at predicting potential cus-tomers for the food category than for the body carecategory. We hypothesize that this may be related tothe fact that purchases in the food category are morefrequent and predictable compared to purchases in thebody care category. A customers may buy one or moreproducts in the food category repeatedly, while thesame does not appear to be the case for all products inthe body care category. For example, once someone haspurchased a sunscreen spray (a product in body care),they are probably unlikely to buy it again, at least forthe time span that our dataset covers. However, notethat the differences between categories in Figure 11 aresmall, and developing a better understanding of themis an area of future research.
Effect of different number of topics. We ranPCIM and GICIM on different number of topics usedin LDA. Results are given in Figure 12. We find thatincreasing the number of topics increases predictionaccuracy for both models. This agrees with the aboveperplexity analysis that higher number of topics resultsin better performance.
6 Conclusion
In this paper, we study group-purchasing patternswith social information. We analyze a real-worldgroup-purchasing dataset (5,602 users, 26,619 prod-ucts, and 13,609 events) from ihergo.com. To thebest of our knowledge, we are the first to ana-lyze the group-purchasing scenario where each group-purchasing event is started by an initiator. Under thiskind of social group-purchasing framework, each userbuilds up social ties with a set of group initiators. Ouranalysis of the dataset shows that a user usually joinsgroup-purchasing events initiated by a certain and rel-atively small number of initiators. That is, if a user hasco-bought a group-deal product with a group initia-tor, he or she is more likely to join a group-purchasingevent started by that initiator again.
We develop two models to predict which users are mostlikely to join a group-purchasing event. Experimentalresults show that by including the weighted topic pro-portions of the initiators, we achieve higher predictionaccuracy. We also find that whether a user decides tojoin a group-purchasing event is strongly influenced bywho the group initiator of that event is.
Our model can be further improved in several ways.First, we can use Labeled LDA [16] by exploiting theground-truth category of the products or user profilefrom the dataset. Second, we can incorporate otherinformation such as the geographical and demographicinformation of users, and the seasonality of products ina more complex topic model. We are also interested ininvestigating the model to deal with cold start, where anew user or group-deal product is added to the system.
Acknowledgments
We want to thank Kuo-Chun Chang from ihergo.comfor his cooperation and the use of ihergo dataset. Thismaterial is based, in part, upon work supported byNSF award CCF0937044 to Ole Mengshoel.
References
[1] G. Adomavicius and A. Tuzhilin. Toward the nextgeneration of recommender systems: A survey ofthe state-of-the-art and possible extensions. IEEETrans. on Knowl. and Data Eng., 17(6), June2005.
[2] D. M. Blei, A. Y. Ng, and M. I. Jordan. LatentDirichlet allocation. J. Mach. Learn. Res., 3, Mar.2003.
[3] J. W. Byers, M. Mitzenmacher, M. Potamias, andG. Zervas. A month in the life of Groupon. CoRR,2011.

[4] J. W. Byers, M. Mitzenmacher, and G. Zervas.Daily deals: Prediction, social diffusion, and rep-utational ramifications. CoRR, abs/1109.1530,2011.
[5] Y. Cha and J. Cho. Social-network analysis usingtopic models. SIGIR ’12, 2012.
[6] B. Edelman, S. Jaffe, and S. D. Kominers. Togroupon or not to groupon: The profitability ofdeep discounts. Harvard business school workingpapers, Harvard Business School, Dec. 2010.
[7] S. Guo, M. Wang, and J. Leskovec. The roleof social networks in online shopping: Informa-tion passing, price of trust, and consumer choice.CoRR, abs/1104.0942, 2011.
[8] T. Hofmann. Collaborative filtering via gaussianprobabilistic latent semantic analysis. SIGIR ’03,2003.
[9] T. Iwata, S. Watanabe, T. Yamada, and N. Ueda.Topic tracking model for analyzing consumer pur-chase behavior. In IJCAI, 2009.
[10] T. Iwata, T. Yamada, and N. Ueda. Modeling so-cial annotation data with content relevance usinga topic model. In In NIPS, 2009.
[11] J. Leskovec, L. A. Adamic, and B. A. Huberman.The dynamics of viral marketing. ACM Transac-tions on the Web, 1(1), May 2007.
[12] T. Lu and C. E. Boutilier. Matching models forpreference-sensitive group purchasing. EC ’12.ACM, 2012.
[13] H. Ma, I. King, and M. R. Lyu. Learning to rec-ommend with social trust ensemble. SIGIR ’09.ACM, 2009.
[14] H. Ma, D. Zhou, C. Liu, M. R. Lyu, and I. King.Recommender systems with social regularization.WSDM ’11. ACM, 2011.
[15] I. Porteous, D. Newman, A. Ihler, A. Asuncion,P. Smyth, and M. Welling. Fast collapsed gibbssampling for latent dirichlet allocation. KDD ’08.ACM, 2008.
[16] D. Ramage, D. Hall, R. Nallapati, and C. D. Man-ning. Labeled LDA: a supervised topic modelfor credit attribution in multi-labeled corpora.EMNLP ’09. Association for Computational Lin-guistics, 2009.
[17] H. M. Wallach. Topic modeling: beyond bag-of-words. ICML ’06. ACM, 2006.
[18] X. Yang, Y. Guo, and Y. Liu. Bayesian-inferencebased recommendation in online social networks.IEEE Transactions on Parallel and DistributedSystems, 99(PrePrints), 2012.
[19] M. Ye, C. Wang, C. Aperjis, B. A. Huberman,and T. Sandholm. Collective attention and thedynamics of group deals. CoRR, abs/1107.4588,2011.
[20] L. Yu, R. Pan, and Z. Li. Adaptive social similar-ities for recommender systems. RecSys ’11. ACM,2011.