last time course logistics course goals what is transportation logistics and why is it important?...
Post on 20-Dec-2015
220 views
TRANSCRIPT

Last Time
• Course logistics
• Course goals
• What is Transportation Logistics and why is it important?
• Different approaches to Transportation Logistics

Supply Chain of an Individual Firm
VendorsPlantsports
warehouse Factory DestinationCustomers
Transportation (rail, marine, road)
Transportation(e.g. long haul truck)
Transportation(e.g. local delivery truck)
warehouse
Transportation(e.g. LTL truck)
Information flow(security, internal management, and control)
Supply Distribution
Conflict between consumer oriented and inventory managementOperators, owners, managersSpatial distribution

Supply chains
• In a pull chain finished products are manufactured when requested.
• In a push chain production and distribution are based on forecasts.
• This has integrated inventory management into business planning

Transportation Goals
• Reduce cost (5-10% of sales)
• Meet reliability goals
• Meet service quality goals
• Simplify operations

Integration of Logistics into Business Operations
• Operational, or daily decisions are made by comparing transportation and inventory costs
• Strategic, or long term decisions are made by comparing logistics costs (transportation and inventory) to manufacturing and production costs
• Lengthening of supply chains as transportation cost decreased and new opportunities to reduce manufacturing cost were found

Logistics Costs
Initial gains from deregulation (restructuring of networks) dropping off$1000 reduction to each household annually

How does REI get goods to market?
Asian Factories
West CoastPort
Distribution Center
Destination Store
Container on marine vessel
Drayage truck
Short orLong-haul
truck
Due to infrastructure government infrastructure investments and decreases in Transportation cost, transportation cost is typically much less significant than theReductions in manufacturing. Inventory management has been the area of attention.
• In-transit inventory or pipeline inventory: inventory that is in the process of movement from point of receipt or production and between points of storage and distribution.
• Inventory-at-rest: inventory that is NOT in the process of movement from point of receipt or production and between points of storage and distribution, rather it is stationary, typically at a production facility, warehouse, distribution center, or consumption facility.

How does REI get goods to market?
Asian Factories
West CoastPort
Distribution Center
Destination Store
Container on marine vessel
Drayage truck
Short orLong-haul
truck
In transit inventory

• Cycle Inventory: the average amount of inventory used to satisfy demand between receipt of supplier shipments. The size of the cycle inventory is a result of the production or purchase of material in large lots. Companies produce or purchase in large lots to exploit economies of scale in the production, transportation, or purchasing process. With the increase in lot size, however, also comes an increase in carrying costs. The basic trade-off supply managers face is the cost of holding larger lots of inventory (when cycle inventory is high) versus the cost of ordering product frequently (when cycle inventory is low). Some of this inventory may be in-transit, while some may be inventory-at-rest.
• Safety inventory: inventory held in case demand exceeds expectation; it is held to counter uncertainty. If they have too much safety inventory, goods go unsold and may have to be discounted. If the company has ordered too little safety inventory, however, the company will lose sales and the margin those sales would have brought. Therefore, choosing safety inventory involves making a trade-off between the costs of having too much inventory and the costs of losing sales due to not having enough inventory. Generally this inventory is inventory-at-rest, so that it is immediately available.

Infrastructure Consequences
• Global Flows
• North American Flows
• Regional Flows
• Local Flows

January trade balance (millions of dollars)
January exports (millions of dollars)
January imports (millions of dollars)
APEC -43,703.2 58,735.7 102,438.8Pacific Rim Countries -29,649.3 23,801.6 53,450.8OECD -23,997.1 65,351.1 89,348.2OPEC -15,530.6 4,575.2 20,105.8North America -11,006.6 32,287.4 43,293.9LAFTA -9,248.0 17,982.5 27,230.5NATO Allies -9,122.3 41,147.5 50,269.7Twenty Latin American Republics -8,305.3 20,366.5 28,671.7Africa -7,904.2 1,954.8 9,859.1European Union -6,053.4 21,278.5 27,331.9Asia Near East -4,283.5 4,315.0 8,598.5ASEAN -4,133.0 5,404.2 9,537.2South/Central America -3,211.6 9,871.8 13,083.4Asia - SOUTH -1,722.4 1,350.4 3,072.8NICS -716.6 8,711.2 9,427.8Central American Common Market 315.2 1,439.8 1,124.6
Global Trade Regions

US Trading PartnersMillions of dollars Trade
Balance Rank Exports Rank Imports Rank
TOTAL -67,111.8 (X) 99,355.5 (X) 166,467.3 (X)
China -20,312.8 1 5,854.9 3 26,167.7 2
Japan -6,592.0 2 5,161.3 4 11,753.3 4
Canada -5,865.3 3 20,409.0 1 26,274.4 1
Mexico -5,141.2 4 11,878.3 2 17,019.6 3
Venezuela -3,419.5 5 767.7 25 4,187.2 8
Nigeria -3,413.0 6 235.3 47 3,648.2 10
Saudi Arabia -3,390.6 7 828.5 24 4,219.1 7
Federal Republic of Germany -2,903.9 8 4,061.7 6 6,965.6 5
Italy -1,714.8 9 1,212.1 18 2,926.9 13
Malaysia -1,700.8 10 1,060.4 21 2,761.2 14
Algeria -1,687.6 11 75.5 74 1,763.1 20
Angola -1,413.5 12 93.8 68 1,507.3 23
Ireland -1,381.3 13 739.5 28 2,120.8 17
India -1,228.3 14 1,078.4 20 2,306.7 15
Korea, South -1,184.8 15 2,740.2 8 3,924.9 9
France -1,180.4 16 2,145.2 13 3,325.7 11
Russia -1,148.4 17 557.6 31 1,706.0 21
Iraq -1,124.7 18 243.5 46 1,368.2 25
Thailand -1,094.7 19 738.6 29 1,833.3 19
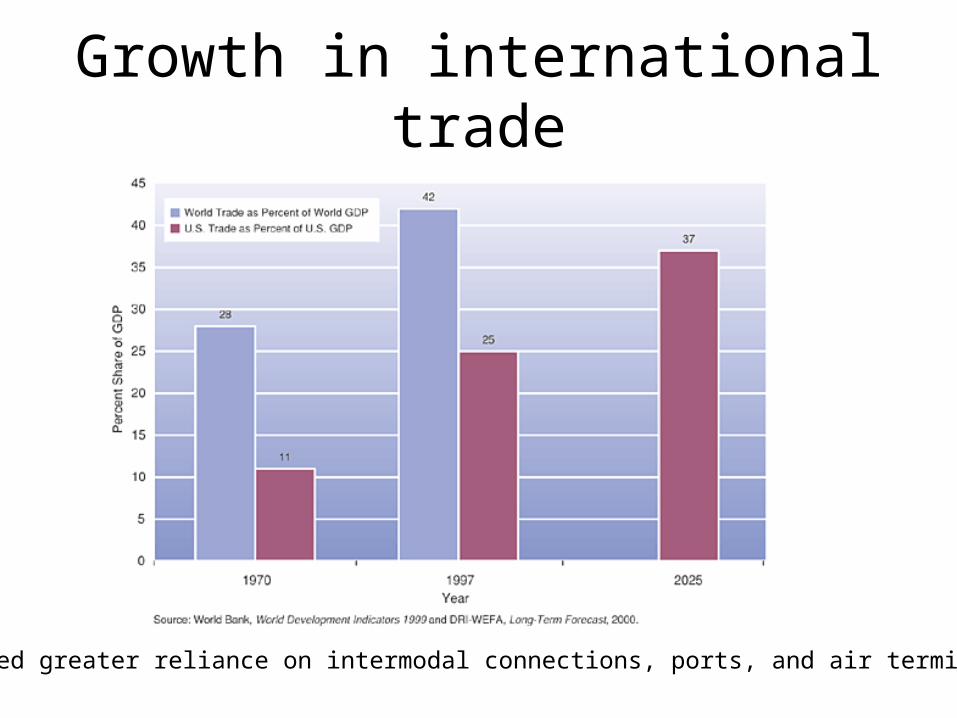
Growth in international trade
Caused greater reliance on intermodal connections, ports, and air terminals

Growth not from neighbors
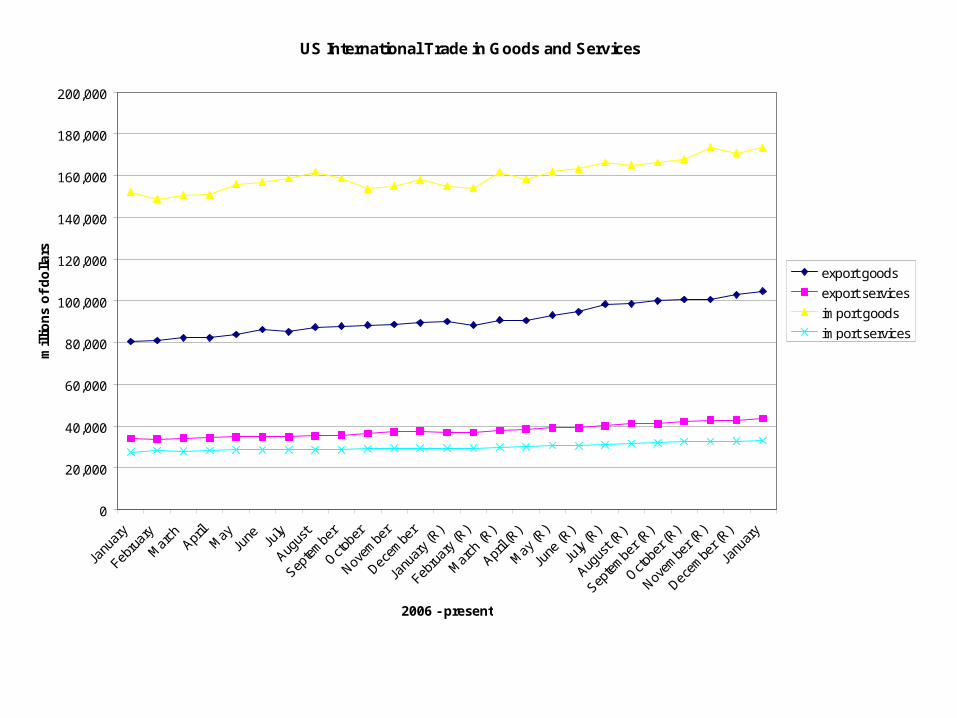
US International Trade in Goods and Services
0
20,000
40,000
60,000
80,000
100,000
120,000
140,000
160,000
180,000
200,000
Janu
ary
Febru
ary
Mar
chApr
ilM
ayJu
ne July
Augus
t
Septe
mbe
r
Octobe
r
Novem
ber
Decem
ber
Janu
ary (
R)
Febru
ary (
R)
Mar
ch (R
)
April (
R)
May
(R)
June
(R)
July
(R)
Augus
t (R)
Septe
mbe
r (R)
Octobe
r (R)
Novem
ber (
R)
Decem
ber (
R)
Janu
ary
2006 - present
mil
lio
ns
of
do
lla
rs
export goods
export services
import goods
import services

The West Coast?
• Trade Statistics (see additional pdf)

0
1,000,000
2,000,000
3,000,000
4,000,000
5,000,000
6,000,000
7,000,000
8,000,000
Long Beach
Los Angeles
Oakland
Seattle
Tacoma
Portland(OR)
Charleston
New York/New Jersey
Houston
Vancouver (BC)
US Port Throughput (TEU)

Major Gateways
Importance of east-west corridors

West Coast Terminal Area has increased
Terminal growth over the period 1985-2005
0.0
5000.0
10000.0
15000.0
20000.0
25000.0
30000.0
35000.0
1985
1988
1989
1994
1996
1997
1998
2000
2001
2002
2003
2004
2005
Years
Ter
min
al a
rea(
acre
s)
Terminal area
Berth Length
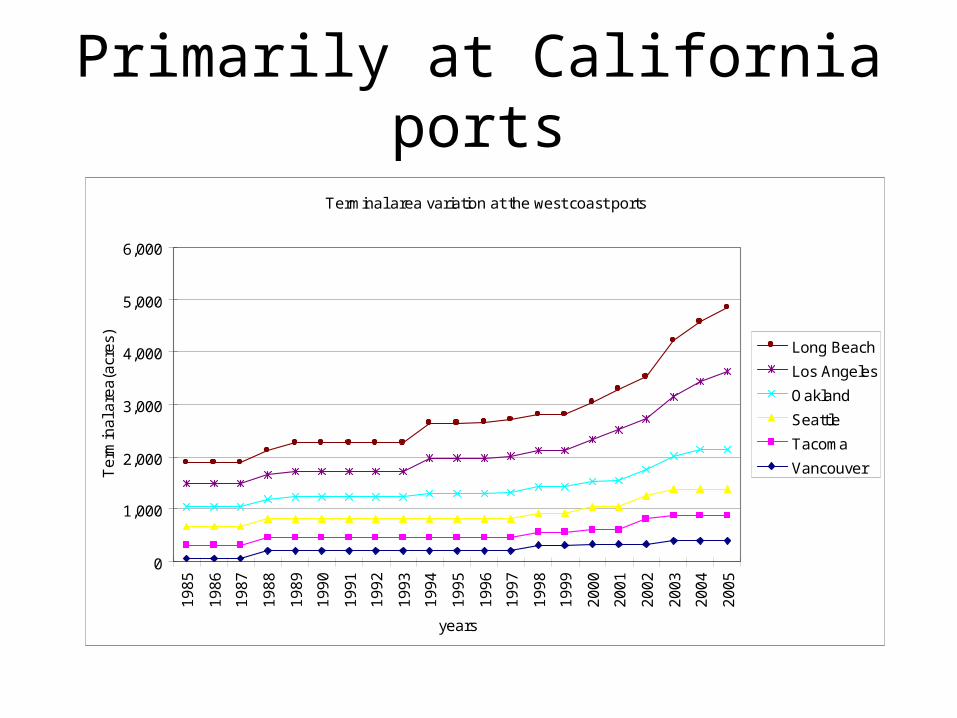
Primarily at California ports
Terminal area variation at the west coast ports
0
1,000
2,000
3,000
4,000
5,000
6,000
1985
1986
1987
1988
1989
1990
1991
1992
1993
1994
1995
1996
1997
1998
1999
2000
2001
2002
2003
2004
2005
years
Ter
min
al a
rea(
acre
s) Long Beach
Los Angeles
Oakland
Seattle
Tacoma
Vancouver

Throughput density (TEUs/acre) variation across west coast ports
Throughput densi ty var i at i on across west coast ports dur i ng 1985- 2005
0
1000
2000
3000
4000
5000
6000
7000
Year
Thro
ughp
ut d
ensi
ty(T
EUs/
acre
) Long BeachLos Angel esOakl andSeat t l eTacomaVancouver (BC)

Similarly with berth lengthBerth length variation at the west coast ports
0
20,000
40,000
60,000
80,000
100,000
120,000
1985
1987
1989
1991
1993
1995
1997
1999
2001
2003
2005
Years
Ber
th le
ngth
(feet
)
Long Beach
Los Angeles
Oakland
Seattle
Tacoma
Vancouver

Berth length (TEUs/ft) utilization at west coast ports
Berth l ength ut i l i sat i on across west coast ports dur i ng 1985- 2005
0
50
100
150
200
250
300
350
Year
Bert
h le
ngth
uti
lisa
tion
(TEU
s/ft
)
Long BeachLos Angel esOakl andSeat t l eTacomaVancouver (BC)
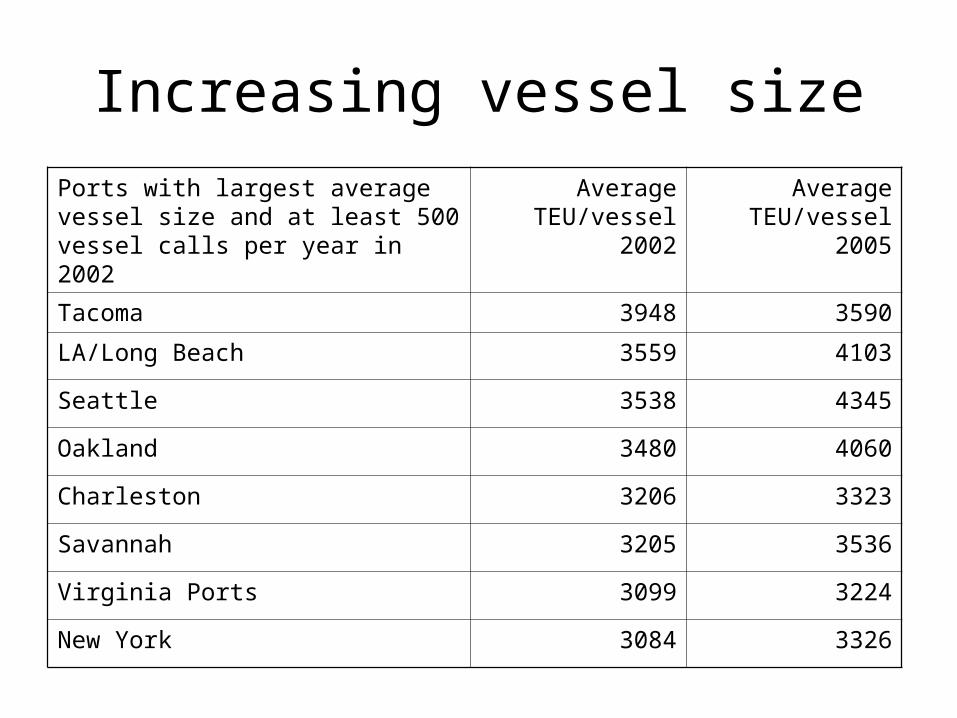
Increasing vessel size
Ports with largest average vessel size and at least 500 vessel calls per year in 2002
Average TEU/vessel 2002
Average TEU/vessel 2005
Tacoma 3948 3590
LA/Long Beach 3559 4103
Seattle 3538 4345
Oakland 3480 4060
Charleston 3206 3323
Savannah 3205 3536
Virginia Ports 3099 3224
New York 3084 3326

Shifting warehousing patterns
0
5,000
10,000
15,000
20,000
25,000
30,000
35,000
40,000
45,000
50,000
0 2 4 6 8 10 12 14 16 18
King Employment
King Avg Wage
Pierce Employment
Pierce Avg Wage