last study topics portfolio risk market risk is measured by beta beta as a portfolio risk...
TRANSCRIPT

Last Study Topics
• Portfolio Risk• Market Risk Is Measured by Beta• Beta as a Portfolio Risk Measurement

Today’s Study Topics
• Markowitz Portfolio Theory• Risk and Return Relationship• Efficient Portfolio

Explain• a. “Risk is not variability. If I know a stock is
going to fluctuate between $10 and $20, I can make myself a bundle.”– To the extent that the investor is interested in the
variation of possible future outcomes, risk is indeed variability. If returns are random, then the greater the period-by-period variability, the greater the variation of possible future outcomes. Also, the comment seems to imply that any rise to $20 or fall to $10 will inevitably be reversed; this is not true.

Continue• b. “There are all sorts of risk in addition to
beta risk. There’s the risk that we’ll have a down turn in demand, there’s the risk that my best plant manager will drop dead, there’s the risk of a hike in steel prices. You’ve got to take all these things into consideration.”

Continue
– Solution: A stock’s variability may be due to many uncertainties, such as unexpected changes in demand, plant manager mortality or changes in costs. However, the risks that are not measured by beta are the risks that can be diversified away by the investor so that they are not relevant for investment decisions.

Continue
• c. “Risk to me is the probability of loss.”
– Given the expected return, the probability of loss increases with the standard deviation. Therefore, portfolios that minimize the standard deviation for any level of expected return also minimize the probability of loss.

Continue• d. “Those guys who suggest beta is a
measure of risk make the big assumption that betas don’t change.”– Beta is the sensitivity of an investment’s returns
to market returns. In order to estimate beta, it is often helpful to analyze past returns. When we do this, we are indeed assuming betas do not change. If they are liable to change, we must allow for this in our estimation. But this does not affect the idea that some risks cannot be diversified away.

Explain• e. How many variance terms and how many
covariance terms do you need to calculate the risk of a 100-share portfolio?
• Refer to Figure on the next slide. With 100 securities, the box is 100 by 100. The variance terms are the diagonal terms, and thus there are 100 variance terms. The rest are the covariance terms.
• Because the box has (100 times 100) terms altogether, the number of covariance terms is:– (100)2 - 100 = 9,900– Half of these terms (i.e., 4,950) are different.

Portfolio RiskThe shaded boxes contain variance terms; the remainder contain covariance terms.
1
2
3
4
5
6
N
1 2 3 4 5 6 N
STOCK
STOCKTo calculate portfolio variance add up the boxes

Continue• f. Suppose all stocks had a standard deviation
of 30 percent and a correlation with each other of .4. What is the standard deviation of the returns on a portfolio that has equal holdings in 50 stocks?– Once again, it is easiest to think of this in terms of
Figure on the previous slide – With 50 stocks, all with the same standard deviation (0.30), the same weight in the portfolio (0.02), and all pairs having the same correlation coefficient (0.4);

Continue
• The portfolio variance is:
– Variance = 50(0.02)2(0.30)2 + [(50)2 - 50] (0.02)2
(0.4)(0.30)2 – =0.0371– Standard deviation = 0.193
= 19.3%

Continue
• g. What is the standard deviation of a fully diversified portfolio of such stocks?
• For a completely diversified portfolio, portfolio variance equals the average covariance:
– Variance = (0.30)(0.30)(0.40) = 0.036– Standard deviation = 0.190 = 19.0%

Principles of Corporate Finance
Sixth Edition
Richard A. Brealey
Stewart C. Myers
Lu Yurong
Chapter 8
McGraw Hill/Irwin
Risk and Return

Risk and Return
• The stock market is risky because there is a spread of possible outcomes.
• The usual measure of this spread is the standard deviation or variance.
• The risk of any stock can be broken down into two parts. – Unique Risk and Market Risk

Continue
• There is the unique risk that is peculiar to that stock, and there is the market risk that is associated with market wide variations.
• Investors can eliminate unique risk by holding a well diversified portfolio, but they cannot eliminate market risk.
• All the risk of a fully diversified portfolio is market risk.

Markowitz Portfolio Theory
• Combining stocks into portfolios can reduce standard deviation, below the level obtained from a simple weighted average calculation.
• Correlation coefficients make this possible.• The various weighted combinations of stocks
that create this standard deviations constitute the set of efficient portfoliosefficient portfolios.

Birth of Portfolio Theory
• But Markowitz did not stop there; he went on to work out the basic principles of portfolio construction.
• These principles are the foundation for much of what has been written about the relation-ship between risk and return.

Histogram-Normal Distribution
• We begin with 1st Figure on the nest slide, which shows a histogram of the daily returns on Microsoft stock from 1990 to 2001.
• On this histogram we have superimposed a bell shaped normal distribution. – The result is typical: When measured over some
fairly short interval, the past rates of return on any stock conform closely to a normal distribution.
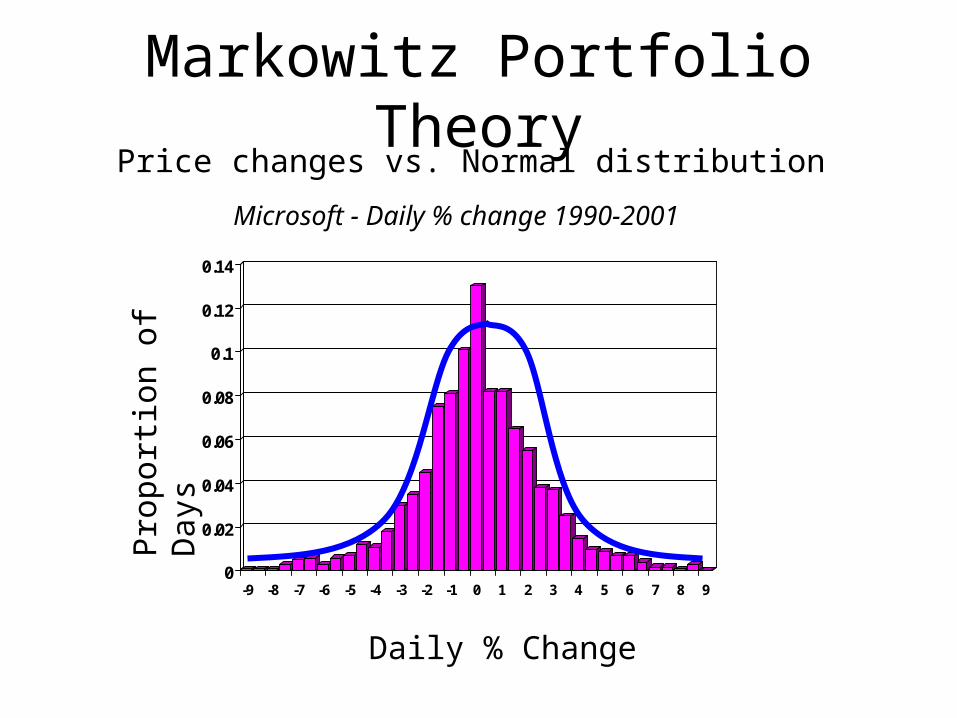
Markowitz Portfolio TheoryPrice changes vs. Normal distribution
Microsoft - Daily % change 1990-2001
0
0.02
0.04
0.06
0.08
0.1
0.12
0.14
-9 -8 -7 -6 -5 -4 -3 -2 -1 0 1 2 3 4 5 6 7 8 9
Pro
port
ion
of D
ays
Daily % Change

Continue
• Normal distributions can be completely defined by two numbers.
• One is the average or expected return; the other is the variance or standard deviation.
• They are not just arbitrary measures: If returns are normally distributed, they are the only two measures that an investor need consider.

Investments-A & B
• Figure 2&3 pictures the distribution of possible returns from two investments.
• Both offer an expected return of 10%, but A has much the wider spread of possible outcomes.
• Its standard deviation is 15%; the standard deviation of B is 7.5%. – Most investors dislike uncertainty and would
therefore prefer B to A.

Markowitz Portfolio TheoryStandard Deviation VS. Expected Return
Investment A
0
2
4
6
8
10
12
14
16
18
20
-50 0 50
%
prob
abili
ty
% return

Markowitz Portfolio TheoryStandard Deviation VS. Expected Return
Investment B
0
2
4
6
8
10
12
14
16
18
20
-50 0 50
%
prob
abili
ty
% return

Investments-C & D
• Figure 4&5 pictures the distribution of returns from two other investments.
• This time both have the same standard deviation, but the expected return is 20% from stock C and only 10% from stock D. – Most investors like high expected return and
would therefore prefer C to D.

Markowitz Portfolio TheoryStandard Deviation VS. Expected Return
Investment C
0
2
4
6
8
10
12
14
16
18
20
-50 0 50
%
prob
abili
ty
% return

Markowitz Portfolio TheoryStandard Deviation VS. Expected Return
Investment D
0
2
4
6
8
10
12
14
16
18
20
-50 0 50
%
prob
abili
ty
% return

Combining Stocks into Portfolio• Suppose that you are wondering whether to
invest in shares of Coca-Cola or Reebok.• You decide that Reebok offers an expected
return of 20% and Coca-Cola offers an expected return of 10%.
• You also decide that the standard deviation of returns is31.5% for Coca-Cola and 58.5% for Reebok. – Reebok offers the higher expected return, but it is
considerably more risky.

Continue
• In Figure 6 we have plotted the expected return and risk that you could achieve by different combinations of the two stocks. – Which of these combinations is best? That
depends on your stomach.
• If you want to stake all on getting rich quickly, you will do best to put all your money in Reebok.

Markowitz Portfolio Theory
Coca Cola
Reebok
Standard Deviation
Expected Return (%)
35% in Reebok
Expected Returns and Standard Deviations vary given different weighted combinations of the stocks

Continue
• If you want a more peaceful life, you should invest most of your money in Coca-Cola; to minimize risk you should keep a small investment in Reebok.– In practice, you are not limited to investing in only
two stocks.– How about portfolios of 10, 100, 1000 stocks?

Choose a Portfolio• Suppose that we can choose a portfolio from any
of the stocks listed in the first column of Table 1.
Continue
• Now Figure 7 tells that each diamond marks the combination of risk and return offered by a different individual security. – For example, Amazon.com has the highest
standard deviation; it also offers the highest expected return.
• It is represented by the diamond at the upper right of Figure 7 on the next slide.

Portfolios

Continue
• Portfolio A: Amazon.com• Entirely invested in one Stock with highest returns
• Portfolio B & C:• Intermediate levels of risk and return
• Portfolio D: Exxon Mobile• This Stock having the lowest Risk i.e. S.D

Selection of best portfolio
• By mixing investment in individual securities, you can obtain an even wider selection of risk and return.
• In fact, anywhere in the shaded area in Figure 7. – But where in the shaded area is best? Well, what
is your goal? Which direction do you want to go?

Efficient Portfolios
• The answer should be obvious: You want to go up (to increase expected return) and to the left (to reduce risk).
• Go as far as you can, and you will end up with one of the portfolios that lies along the heavy solid line.
• Markowitz called them efficient portfolios.– These portfolios are clearly better than any in the
interior of the shaded area.

Summary
• Markowitz Portfolio Theory• Risk and Return Relationship• Efficient Portfolio