laser induced photodissociation of … induced photodissociation of organometallic clusters . by ....
TRANSCRIPT
LASER INDUCED PHOTODISSOCIATION OF ORGANOMETALLIC CLUSTERS
by
ANGELA CARROLL SCOTT
(Under the Direction of Michael A. Duncan)
ABSTRACT
Gas phase clusters of lanthanide metal-cyclooctatetraene, iron-pyrene, iron-perylene,
calcium-pyrene and calcium-coronene are produced in a molecular beam using laser vaporization
in a pulsed nozzle cluster source. Cation and neutral clusters are studied with time-of-flight mass
spectrometry and mass-selected photodissociation. Clusters produced ranged from simple metal-
organic adducts to metal-hydrocarbon and metal-carbide fragments. The lanthanide metal-
cyclooctatetraene clusters prefer different stoichiometries depending upon their preferred
oxidation state, but all seem to form sandwich structures. Photodissociation spectra of the iron-
pyrene and iron-perylene systems show elimination of neutral iron atoms as well as some
destruction of and insertion into the polycyclic aromatic hydrocarbon ring system. The
photodissociation spectra in the calcium-coronene system seem to show a preference for the
calcium atoms binding individually to the coronene molecule. In the calcium-pyrene system, the
expected fragmentation pattern for sandwich structures is observed as well as some pyrene ring
destruction.
INDEX WORDS: PAHs; Coronene; Pyrene; Perylene; Cyclooctatetraene; Lanthanide;
Calcium; Transition metals; Gas-phase; Organometallic chemistry; Clusters; Sandwich structures; Photodissociation; Interstellar-medium

LASER INDUCED PHOTODISSOCIATION OF ORGANOMETALLIC CLUSTERS
by
ANGELA CARROLL SCOTT
B.S., Western Kentucky University, 1999
J.D., Chicago-Kent College of Law, 2005
A Thesis Submitted to the Graduate Faculty of The University of Georgia in Partial Fulfillment
of the Requirements for the Degree
MASTER OF SCIENCE
ATHENS, GEORGIA
2006

© 2006
Angela Carroll Scott
All Rights Reserved

LASER INDUCED PHOTODISSOCIATION OF ORGANOMETALLIC CLUSTERS
by
ANGELA CARROLL SCOTT
Major Professor: Michael A. Duncan
Committee: Charles Kutal Geoffrey D. Smith
Electronic Version Approved: Maureen Grasso Dean of the Graduate School The University of Georgia December 2006

iv
DEDICATION
This thesis is dedicated to my parents,
Sonny and Peggy Carroll
I would not be where I am or who I am today were it not for your love, discipline and sacrifice. I
could not have had better role models for how to live life. You taught me to work hard, spend
time with those I love, and not take anything for granted. You showed me how to treat others, to
check my oil, and most importantly, to pray daily and never worry, because God is in control. I
am forever grateful for you and I am truly blessed to have you as my parents. Thanks Mom and
Dad!!

v
ACKNOWLEDGEMENTS
I first and foremost have to thank God for being with me through every step of this
project. I could not have accomplished this feat were it not for His ever-abiding love and
wisdom. I know that He has always been with me, even when I have not been with Him, and
that He will always be with me and never forsake me. For all of that, I am eternally grateful.
This thesis would not have been created if it were not for Professor Michael A. Duncan.
Mike truly has a gift for making the science come to life and for making you want to be a part of
it any way you can. He is also an amazing person with a kind heart. Thank you for always
making the science interesting, for sticking by me through it all, and for believing in me –
sometimes I think you were the only one.
I have seen many people come and go from the lab over the past 7 years – including
myself! Areatha Ketch, John Reddic, Greg Grieves, Nichole Foster, Matt Nee, Joe Velasquez,
Tim Ayers, Nick Walker, Richard Walters, Todd Jaeger, and Jared Jaeger – It was a pleasure to
get to know each of you and to have had our lives intersect for a time. Special thanks to Areatha
Ketch for much advice and for opening your home to me so often. I hope life treats you kindly
and that God blesses you richly. Special thanks to Tim Ayers for always keeping it real and for
speaking your mind in such creative ways – you always kept it interesting. Joe Velasquez, you
have always been one of the nicest people I have ever met and so genuine. Thank you for our
talks and for just being the person that you are. Lastly, special thanks to Greg Grieves for many
laughs and good times.

vi
To Professor Lucia Babcock, thank you for our many talks and for your career
counseling. I credit you with sparking my decision to go to law school – one of the best
decisions I ever made. Thank you for seeing in me what I couldn’t and for encouraging me
when I needed it.
To Professor Donald W. Slocum, thank you for being such a wonderful professor and
friend. Thank you for teaching me how to do research, how to teach others, and how to speak
creatively. Joining your research group was one of the best things I ever did. Thank you for
always believing that I could achieve anything I wanted.
To Professor Robert Holman, you gave me my first taste of organic chemistry, and I must
say, I didn’t take to it well! However, you helped me to really grasp the subject matter and by
the time I took Organic 3, I was an ace (or so I like to think). You taught me so much about
chemistry and life and really cared about me as a person. Above all else, you wanted me to see
the value I had as a person. Thank you for your caring spirit and for all of our talks – it meant so
much.
To my friends – Paul Dietzel, Adam and Marti Watson, Sally Eilerman, and Dina
Nikitaides and Derek Sorensen – where would I be without all of you!! Thank you all for always
being there whenever I needed you to provide an ear, a shoulder, or some well needed laughs.
Dina, law school would not have been the same and I’m not sure I could have passed the bar
without you. Thank you for being such a good, honest friend and for being by side as I’ve
reached accomplishments and made commitments – there is no one I would have rather had
there. Sally, thank you for being the type of person I aspire to be – kind, caring, helpful, and all
around wonderful. I’m so proud of you for all of your accomplishments and I know that you are
and will always be a fabulous doctor. Adam and Marti, how awesome are you! Thank you for

vii
always having an open door and an open heart. Paul, thank you for always being such a
wonderful friend to me and thank you for making the personal sacrifices for all of our freedom –
you make me proud and keep me humble. May God keep you safe and may He bring you back
home to us all safe and sound. Hoo-rah!
To my family – my whole family – Mom, Dad, Michael, Pam, Pappaw, Marty, Carolyn,
Kenneth, Jo Lynn, Dennis, Andrea, Terry, and Grandmother. There are no words. I love each of
you dearly and could not have picked a better family if I had tried. Thank you all for always
supporting me, believing in me, praying for me, and simply being there if I ever needed you.
Pam, thank you for many dinners while we were both living in Georgia and for always being
there whenever I needed anything. You are fabulous! Pappaw, thank you for helping me to
reach my goals and for always loving and supporting me. Carolyn and Kenneth, thank you for
always taking care of me and for helping to raise me into the person I am today. To the Scott
family, thank you for including me from day one and making me feel welcome in your family.
Andrea, thank you for being the sweet person that you are – it was worth the wait for a sister like
you.
A special thank you to my brother Michael. Although we are 12 years apart in age, you
sure can’t tell it. You have been a rock to me through so many times in my life and I admire you
so much. I am so proud of you for the young man that you’ve become and I can’t wait to see
what life has in store for you. Thank you for always helping me move (smile) and for always
providing a laugh, an ear or a shoulder whenever I needed it. You are the BEST brother anyone
could ever have and I am immensely lucky to have you on my side. Much love.
Last, but most certainly not least, to my wonderful, fabulous, and perfect-for-me
husband, Dax Ryan Scott. I would not have made it through this thesis were it not for you. You

viii
have been there for me in every way possible and blessed me in so many ways. You make me so
very happy and I could not be more grateful for your presence in my life. I thank God daily, if
not hourly, for you. Please know that I love you with all my heart and I will always be thankful
for the family that we are and are yet to have. I love you! We made it!

ix
TABLE OF CONTENTS
Page
ACKNOWLEDGEMENTS.............................................................................................................v
CHAPTER
1 INTRODUCTION .........................................................................................................1
Metal-Benzene Complexes........................................................................................1
Metal-C60 Complexes ................................................................................................2
Metal-PAH Complexes .............................................................................................3
Metal-Cyclooctatetraene Complexes ........................................................................5
References .................................................................................................................6
2 EXPERIMENTAL.......................................................................................................11
Sample Preparation..................................................................................................11
The Molecular Beam Apparatus..............................................................................12
Cluster Separation and Detection ............................................................................13
References ...............................................................................................................15
3 LANTHANIDE METAL-CYCLOOCTATETRAENE CATION COMPLEXES .....19
Introduction .............................................................................................................19
Experimental ...........................................................................................................21
Results and Discussion............................................................................................22
Conclusions .............................................................................................................29
References ...............................................................................................................30

x
4 IRON-PYRENE AND IRON-PERYLENE CATION CLUSTERS............................40
Introduction .............................................................................................................40
Experimental ...........................................................................................................42
Results and Discussion............................................................................................43
Conclusions .............................................................................................................51
References ...............................................................................................................52
5 CALCIUM-CORONENE AND CALCIUM-PYRENE CATION CLUSTERS.........60
Introduction .............................................................................................................60
Experimental ...........................................................................................................62
Results and Discussion............................................................................................63
Conclusions .............................................................................................................71
References ...............................................................................................................72
6 CONCLUSION............................................................................................................81
References ...............................................................................................................84

1
CHAPTER 1
INTRODUCTION
A substantial increase in research involving organometallic clusters occurred in the
1950’s with the discoveries of ferrocene1 and dibenzene chromium.2 The stability of each of
these complexes is attributed to favorable orbital overlap between the metal d orbitals with those
of the ligand, as well as an electron count that satisfies both the eighteen electron rule on the
metal and the Hückel number of electrons on the cyclic ligand. The discovery of these
complexes helped form a bridge between the fields of inorganic and organic chemistry and
brought about an onslaught of evolving research in this field that continues to this day. This new
research focused on the structure and bonding of novel organometallic complexes and was aided
in the 1980s by the advent of gas-phase spectroscopic techniques such as laser vaporization, ion
beam mass spectrometry, collision induced dissociation, laser induced photodissociation, time
resolved IR spectroscopy, flowing afterglow, and photoelectron spectroscopy.
Metal-Benzene Complexes
Some of the first and most heavily studied gas-phase systems are metal-benzene
complexes. Freiser and co-workers were able to obtain bond energies and structural information
for V, Ta and Nb clusters with benzene by using FT-ICR mass spectrometry.3-5 However, these
studies were limited to complexes with one or two metal atoms and one or two benzene
molecules. Bauschlicher and co-workers performed theoretical studies on single atoms of the
first and second row transition metals with benzene and determined binding energies, structures,

2
and dissociation energies for these clusters.6 Our research group has performed studies on
several metal-benzene systems7-11, some of which showed charge transfer character upon
photodissociation.8-10 Additionally, we have studied single metal-multiple benzene complexes
for the metals Bi, Mg, Al, V, Co, Fe, and Cu.8,9 Armentrout and co-workers have used collision
induced dissociation (CID) to study benzene complexes with silver and transition metals from
titanium to copper.12,13 Recently, Kaya and co-workers used two-laser vaporization mass
spectrometry and photoelectron spectroscopy to study various metals (M = Sc, Ti, V, Cr, Mn, Fe,
Co, Ni) complexed with benzene.14 They reported magic numbers corresponding to multiple-
decker sandwich structures for the complexes with V, Ti, and Sc.14 However, they found that the
later transition metals, Fe, Co, and Ni, formed a benzene coated type structure.14 Moreover,
Bowers and co-workers have found supporting evidence for Kaya’s assertion that the vanadium-
benzene clusters do prefer to exist as multiple-decker sandwich structures.15
Metal-C60 Complexes
In the early 1990s, Smalley and co-workers made a discovery of a new and exciting
molecule that would invigorate organometallic gas-phase studies. That molecule is
buckminsterfullerene, or C60.16 Many interesting gas-phase studies have been performed by
attaching metal to C60. Kaya and co-workers studied various M-C60 complexes, where M = Sc,
Ti, V, Cr, Fe, Co, Ni, Eu and Ho, and found magic numbers for these systems corresponding to
stacked motifs.14,17-20 For the metals scandium, titanium, and vanadium, they proposed a
stacked, dumbbell type configuration for the structure corresponding to M(C60)2+.17
Additionally, they proposed a tricapped planar structure for the prominent M(C60)3+ complexes
for the metals chromium, iron, cobalt and nickel.20 Martin and co-workers have reported that

3
complexes of Mx(C60)+, where M = Ti, Zr, V and Y, and where x = up to 200 atoms, have metal
coated fullerene structures.21 Their studies of niobium and tantalum with C60 show metal atom
insertion and efficient destruction of the fullerene cage.22-25 The ion mobility studies of Jarrold
and co-workers on Nb(C59)+ show that the niobium atom is inserted into the fullerene wall.26,27
Our lab has published mass-selected photodissociation studies conducted on Mx(C60)+ for M =
Co, Fe, Ni, Nb, Ag and V28,29, as well as competitive binding studies using mixed ligand
sandwich complexes of iron with benzene, coronene, and C60.30 These competitive binding
studies showed that the relative binding strength of each of the three organic ligands to iron is
coronene > benzene > C60.30
Metal-PAH Complexes
Metal ion complexes with selected polycyclic aromatic hydrocarbons (“PAHs”) have
been described previously. Dunbar and co-workers were the first to make metal-PAH systems in
the gas phase.31 They used FT-ICR mass spectrometry to probe the association kinetics of
various metal ions with coronene. Marty and co-workers explored the possible astrophysical
implications of iron-naphthalene cations with Fourier transform mass spectroscopy.32 Theorists
have performed calculations to determine the binding energies of various metals to different
PAHs as well as the preferential binding sites of the metal on the PAH molecules.33-35 Our
research group has produced and studied a variety of metal-PAH systems with time-of-flight
mass spectrometry and mass-selected laser photodissociation such as chromium-coronene,36
iron-coronene,37 silver-coronene,38 and niobium with coronene and pyrene.39 In the iron-
coronene system, cluster masses of the form Fex(Cor)y+ are observed for x = 1-3 and y = 1, 2
with additional masses for the complexes Fe(Cor)y+, y = 1-7.37 Through photodissociation

4
experiments, it was found that the iron binds to intact coronene molecules and that this system
eliminates neutral metal atoms rather than molecular metal fragments as they decompose.
However, in the chromium-coronene system, one of the fragmentation channels showed the
elimination of molecular chromium clusters as opposed to the loss of individual atoms.
Additionally, in both systems, there was evidence that some of the clusters may exist as
sandwich structures. In Chapters 4 and 5 of this work, studies of iron-pyrene, iron-perylene,
calcium-coronene, and calcium-pyrene are discussed. In these studies, we examine the existence
of possible sandwich structures as well as probe how iron and calcium binds with these PAH
molecules. Figure 1.1 shows the structures of pyrene, perylene and coronene.
Metal-PAH clusters are interesting for a variety of reasons. PAHs are often used by
theorists to represent a finite section of graphite in order to study surface physisorption dynamics
and energetics. Moreover, these systems may be used to model metal attachment to the walls of
carbon nanotubes or metal intercalated graphite. Additionally, metal-PAH complexes are
thought to form interstellar gas clouds and contribute to the depletion of metal in them.40 PAHs
have been implicated as carriers of the unidentified infrared bands (“UIBs”) or diffuse
interstellar bands (“DIBs”), which are observed in all parts of the galaxy.41,42 Moreover, they are
estimated to account for 5-15% of the cosmic carbon, which make them an ample component of
the interstellar medium. However, recent studies have shown that the spectra of PAHs alone do
not match the astrophysical spectra. As a result, it is thought that various PAH complexes,
especially those with metal, may be used to explain these UIBs and DIBs.

5
Metal-Cyclooctatraene Complexes
Sandwich complexes with cyclooctatetraene (“COT”), whose structure is shown in
Figure 1.1, have been produced previously in the condensed phase43-46 and in the gas phase.14,47-
50 Streitwieser and Müller-Westerhoff discovered uranocene in 1968.46 Uranocene is
structurally analogous to ferrocene, but contains an actinide core of uranium sandwiched
between two COT ligands. Hückel’s rule says that a molecule must have 4n+2 electrons (n = 0,
1, 2, etc.) in order for it to be considered aromatic. An antiaromatic molecule fits the form 4n
according to the rule. COT is antiaromatic because it has eight π electrons. In uranocene,
uranium donates two electrons to each ligand creating aromatic COT dianions. This donation
stabilizes uranocene.43-45 On the basis of this same concept, Kaya and co-workers performed
gas-phase studies to investigate the possibility of an extended stacking motif of lanthanide metals
with COT.14,47-50 The mass spectra observed in their experiments showed a pattern of magic
numbers corresponding to Mn+(COT)n+1 (M = Ce, Nd, Eu, Ho, Yb) species, which they assigned
to multiple decker sandwiches. Photoelectron spectroscopy of these complexes gave further
evidence for these structures.47
In our lab, studies have been performed on transition metal—COT clusters.51 In those
systems, clusters of the form M+(COT)1,2 (M = V, Fe, Ni, Ag) were produced with the di-COT
clusters possibly forming sandwich structures.51 Additionally, photodissociation of the
vanadium and iron mono-COT complexes produced M+(C5H5),51 which we see in the
dysprosium and neodymium systems studied here and discussed in Chapter 3. In transition
metal—ligand bonding, the metal and ligand are able to share π electrons through orbital-orbital
overlap. Molecules gaining eighteen π electrons through this interaction show an increased
stability, such as in ferrocene and dibenzene chromium. However, while this concept is

6
applicable to complexes containing transition metals and actinide metals, previous
experimental43,45 and theoretical52-55 studies have shown that the chemistry of the lanthanide
metals is different. Therefore, in the present study discussed in Chapter 3, we want to investigate
whether the complexes formed with lanthanide metals are stable due to purely ionic effects or if
the eighteen electron rule is applicable.
References
(1) Kealy, T. J.; Paulson, P. L. Nature 1951, 168, 1039.
(2) Fischer, E. O.; Hafner, W. Z. Naturforsch. 1955, 10b, 665.
(3) Afzaal, S.; Freiser, B. S. Chem. Phys. Lett. 1994, 218, 254.
(4) Freiser, B. S. Chemtracts: Anal. Phys. Chem. 1989, 1, 65.
(5) Gord, J. R.; Freiser, B. S.; Buckner, S. W. J. Chem. Phys. 1991, 95, 8274.
(6) Bauschlicher, C. W., Jr.; Partridge, H.; Langhoff, S. R. J. Phys. Chem. 1992, 96, 3273.
(7) Jaeger, T. D.; Duncan, M. A. Int. J. Mass Spectrom. 2005, 241, 165.
(8) Willey, K. F.; Cheng, P. Y.; Bishop, M. B.; Duncan, M. A. J. Am. Chem. Soc. 1991, 113,
4721.
(9) Willey, K. F.; Yeh, C. S.; Robbins, D. L.; Duncan, M. A. J. Phys. Chem. 1992, 96, 9106.
(10) Willey, K. F.; Cheng, P. Y.; Pearce, K. D.; Duncan, M. A. J. Phys. Chem. 1990, 94,
4769.
(11) Pillai, E. D.; Molek, K. S.; Duncan, M. A. Chem. Phys. Lett. 2005, 405, 247.
(12) Chen, Y.-M.; Armentrout, P. B. Chem. Phys. Lett. 1993, 210, 123.
(13) Meyer, F.; Khan, F. A.; Armentrout, P. B. J. Am. Chem. Soc. 1995, 117, 9740.
(14) Nakajima, A.; Kaya, K. J. Phys. Chem. A 2000, 104, 176.

7
(15) Weis, P.; Kemper, P. R.; Bowers, M. T. J. Phys. Chem. A 1997, 101, 8207.
(16) Kroto, H. W.; Heath, J. R.; O'Brien, S. C.; Curl, R. F.; Smalley, R. E. Nature 1985, 318,
162.
(17) Nakajima, A.; Nagao, S.; Takeda, H.; Kurikawa, T.; Kaya, K. J. Chem. Phys. 1997, 107,
6491.
(18) Nagao, S.; Negishi, Y.; Kato, A.; Nakamura, Y.; Nakajima, A.; Kaya, K. J. Phys. Chem.
A 1999, 103, 8909.
(19) Nagao, S.; Kurikawa, T.; Miyajima, K.; Nakajima, A.; Kaya, K. J. Phys. Chem. A 1998,
102, 4495.
(20) Kurikawa, T.; Nagao, S.; Miyajima, K.; Nakajima, A.; Kaya, K. J. Phys. Chem. A 1998,
102, 1743.
(21) Tast, F.; Malinowski, N.; Frank, S.; Heinebrodt, M.; Billas, I. M. L.; Martin, T. P. Z.
Phys. D: At., Mol. Clusters 1997, 40, 351.
(22) Branz, W.; Billas, I. M. L.; Malinowski, N.; Tast, F.; Heinebrodt, M.; Martin, T. P. J.
Chem. Phys. 1998, 109, 3425.
(23) Martin, T. P.; Malinowski, N.; Zimmermann, U.; Naeher, U.; Schaber, H. J. Chem. Phys.
1993, 99, 4210.
(24) Tast, F.; Malinowski, N.; Frank, S.; Heinebrodt, M.; Billas, I. M. L.; Martin, T. P. Phys.
Rev. Lett. 1996, 77, 3529.
(25) Zimmermann, U.; Malinowski, N.; Naeher, U.; Frank, S.; Martin, T. P. Phys. Rev. Lett.
1994, 72, 3542.
(26) Clemmer, D. E.; Hunter, J. M.; Shelimov, K. B.; Jarrold, M. F. Nature 1994, 372, 248.
(27) Fye, J. L.; Jarrold, M. F. Int. J. Mass Spectrom. 1999, 187, 507.

8
(28) Grieves, G. A.; Buchanan, J. W.; Reddic, J. E.; Duncan, M. A. Int. J. Mass Spectrom.
2001, 204, 223.
(29) Reddic, J. E.; Robinson, J. C.; Duncan, M. A. Chem. Phys. Lett. 1997, 279, 203.
(30) Buchanan, J. W.; Grieves, G. A.; Reddic, J. E.; Duncan, M. A. Int. J. Mass Spectrom.
1999, 182/183, 323.
(31) Pozniak, B. P.; Dunbar, R. C. J. Am. Chem. Soc. 1997, 119, 10439.
(32) Marty, P.; de Parseval, P.; Klotz, A.; Chaudret, b.; Serra, G.; Boissel, P. Chem. Phys.
Lett. 1996, 256, 669.
(33) Dunbar, R. C. J. Phys. Chem. A 2002, 106, 9809.
(34) Klippenstein, S. J.; Yang, C.-N. Int. J. Mass Spectrom. 2000, 201, 253.
(35) Senapati, L.; Nayak, S. K.; Rao, B. K.; Jena, P. J. Chem. Phys. 2003, 118, 8671.
(36) Foster, N. R.; Grieves, G. A.; Buchanan, J. W.; Flynn, N. D.; Duncan, M. A. J. Phys.
Chem. A 2000, 104, 11055.
(37) Buchanan, J. W.; Reddic, J. E.; Grieves, G. A.; Duncan, M. A. J. Phys. Chem. A 1998,
102, 6390.
(38) Buchanan, J. W.; Grieves, G. A.; Flynn, N. D.; Duncan, M. A. Int. J. Mass Spectrom.
1999, 185-187, 617.
(39) Foster, N. R.; Buchanan, J. W.; Flynn, N. D.; Duncan, M. A. Chem. Phys. Lett. 2001,
341, 476.
(40) Klotz, A.; Marty, P.; Boissel, P.; Serra, G.; Chaudret, B.; Daudey, J. P. Astron. Astrophys.
1995, 304, 520.
(41) Bohme, D. K. Chem. Rev. 1992, 92, 1487.
(42) Henning, T.; Salama, F. Science 1998, 282, 2204.

9
(43) Hodgson, K. O.; Raymond, K. N. Inorg. Chem. 1972, 11, 3030.
(44) Long, N. J. Metallocenes, Blackwell Sciences, Ltd., Oxford, 1998.
(45) Streitwieser, A.; Muller-Westerhoff, U.; Sonnichsen, G.; Mares, F.; Morell, D. G.;
Hodgson, K. O.; Harmon, C. A. J. Am. Chem. Soc. 1973, 95, 8644.
(46) Streitwieser, A.; Muller-Westerhoff, U. J. Am. Chem. Soc. 1968, 90, 7364.
(47) Kurikawa, T.; Negishi, Y.; Hayakawa, F.; Nagao, S.; Miyajima, K.; Nakajima, A.; Kaya,
K. J. Am. Chem. Soc. 1998, 120, 11766.
(48) Kurikawa, T.; Negishi, Y.; Hayakawa, F.; Nagao, S.; Miyajima, K.; Nakajima, A.; Kaya,
K. Z. Phys. D: At., Mol. Clusters 1999, 9, 283.
(49) Miyajima, K.; Knickelbein, M. B.; Nakajima, A. Polyhedron 2005, 24, 2341.
(50) Miyajima, K.; Kurikawa, T.; Hashimoto, M.; Nakajima, A.; Kaya, K. Chem. Phys. Lett.
1999, 306, 256.
(51) Jaeger, T. D.; Duncan, M. A. J. Phys. Chem. A 2004, 108, 11296.
(52) Anderson, R. A.; Bonsella, C. J.; Burns, C. J.; Green, J. C.; Hohl, D.; Rosch, J. J. Chem.
Soc., Chem. Commun. 1986, 405.
(53) Hodgson, K. O.; Mares, F.; Starks, D. F.; Streitwieser, A. J. Am. Chem. Soc. 1973, 95,
8650.
(54) Nugent, L. J.; Laubereau, P. G.; Werner, G. K.; Vander Sluis, K. L. J. Organomet. Chem.
1971, 27, 365.
(55) Raymond, K. N.; Eigenbrot, C. W. Acc. Chem. Res. 1980, 13, 276.

10
Coronene Perylene
Cyclooctatetraene Pyrene
Coronene Perylene
Cyclooctatetraene Pyrene
Figure 1.1. These are the structures for the organic molecules used throughout the experiments
described in this work.

11
CHAPTER 2
EXPERIMENTAL
Sample Preparation
The iron and calcium experiments described herein require that the polycyclic aromatic
hydrocarbon (“PAH”) of interest be “coated” onto the metal sample rod. These PAH-coated
metal rods are prepared external to the molecular beam apparatus and then transferred there upon
preparation. Coated rods are produced by vapor deposition in a separate vacuum deposition
chamber, shown in Figure 2.1.1 A very small amount of the PAH of interest is placed in a ¼ inch
diameter tantalum oven, which is attached to a variable resistance heater. The metal rod is
placed upright on a rotating stage approximately 3-4 cm from the orifice of the tantalum oven.
In order to control the uniformity of the applied film, the rotating stage is adjusted to allow the
rod to turn at a rate of roughly 12-18 revolutions per minute. The chamber is sealed and
evacuated to approximately 5x10⁻⁶ torr using a diffusion pump (Varian VHS-4) backed by a
Welch Duo-Seal model 1376 mechanical pump. Once the system reaches the desired pressure,
the voltage applied to the tantalum oven is fixed at 40 V and the PAH is heated at a current
setting of five amps. It takes approximately 10-20 minutes to apply the PAH thin film to the rod.
After preparation, the PAH-coated metal rod sample can be moved to the cluster instrument for
study. These highly stable ligands can survive the laser plasma and desorb along with the metal
into the gas phase.
For the lanthanide metal—cyclooctatetraene (“COT”) experiments described herein, a
clean metal rod is used as the sample and the COT is seeded into the carrier gas. The COT is

12
added to a holding cell in the helium carrier gas manifold. The helium flows through the holding
cell across the top of the COT and becomes seeded with COT molecules. Detection and study of
the resulting clusters are carried out in the same manner as the coated metal rods.
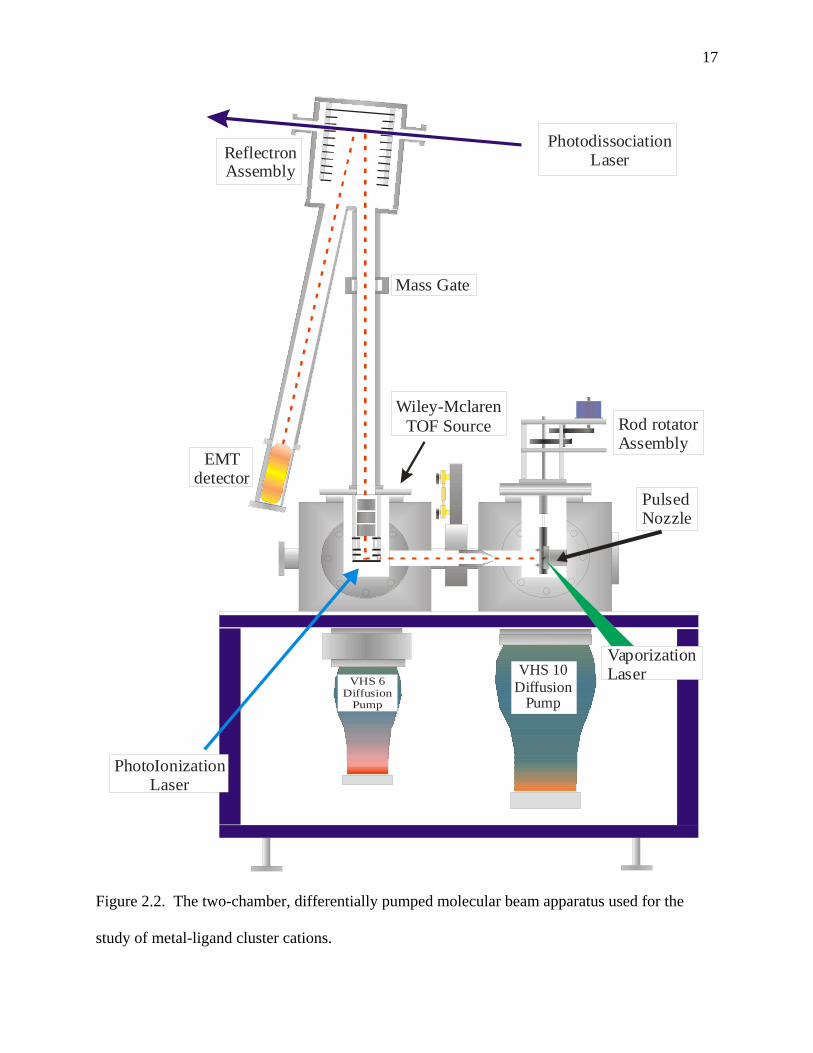
The Molecular Beam Apparatus
The cluster source is housed in the first of two differentially pumped vacuum chambers
of the molecular beam instrument,2 Figure 2.2. This initial chamber, also referred to as the
source chamber, is kept in the range of 10-6 to 10-7 torr by a diffusion pump (Varian VHS-10)
backed by a Welch Duo-Seal 1375 mechanical pump. The cluster source is composed of a
Newport pulsed molecular beam nozzle, a rod holder, and nozzle extension(s), shown in Figure
2.3.3,4 A metal rod, PAH-coated or clean, is threaded onto a nylon screw driven by a stepper
motor, which provides flexible translation and rotation of the rod within the holder. The
translation and rotation of the rod allows laser ablation to occur on a continuously fresh sample
surface. The helium carrier gas flows through the pulsed nozzle and over the rod as the ablation
laser, a focused and power adjusted Nd:YAG laser operated at the second or third harmonic (532
or 355 nm, respectively), fires. The ensuing plasma is pulsed into the nozzle extension where
multiple collisions occur and clusters grow. These clusters, along with the carrier gas, spray out
the end of the nozzle extension into the vacuum. This expansion causes cooling and provides a
near collision free path into the second chamber, referred to as the mass spectrometer chamber.
Before entering this second chamber, the center of the nozzle spray passes through a skimmer
cone, thus creating a molecular beam with about a 3 mm diameter.

13
Cluster Separation and Detection
The mass spectromerter chamber is kept in the range of 10-7 to 10-8 torr by a diffusion
pump (Varian VHS-6) backed by a Welch Duo-Seal 1397 mechanical pump. This chamber
contains the dual field, Wiley-McLaren type time-of-flight mass spectrometer coupled with a
reflectron (RTOF)5, and a Hamamatsu R-595 electron multiplier tube (“EMT”) detector.
The two-stage Wiley-McLaren type time-of-flight mass spectrometer consists of a
repeller plate, a draw-out-grid (“DOG”), and a ground plate. The operation of these acceleration
plates occurs in two distinct ways depending on whether the experiment is studying neutrals or
ions from the source. When neutral clusters are studied, the repeller is held at a potential of 1200
V and the DOG is held at 1100 V. The DOG is a plate with a one inch diameter hole in the
center that is covered with a molybdenum wire mesh. The ground plate, having a similar hole
and grid to the DOG, defines the beginning of the grounded flight tube. As the molecular beam
enters the region between the center of the plates, the ionization laser, a Lambda PhysikCompex
ArF+ excimer (193 nm), fires, causing photoionization of the neutral species. These ions are
immediately accelerated by the potential difference away from the repeller through the wire
mesh of the DOG into the first flight tube. These ions continue to accelerate due to the much
greater field created between the DOG and ground plate. The second mode of operation is used
when ionic species from the source are the subject of study. In this mode, the repeller and DOG
plates must be held at ground to allow the ions to enter the extraction region. Once the cationic
clusters have entered the region between the plates, a pulsed potential accelerates them in the
same manner as the photoionized clusters discussed above.
14
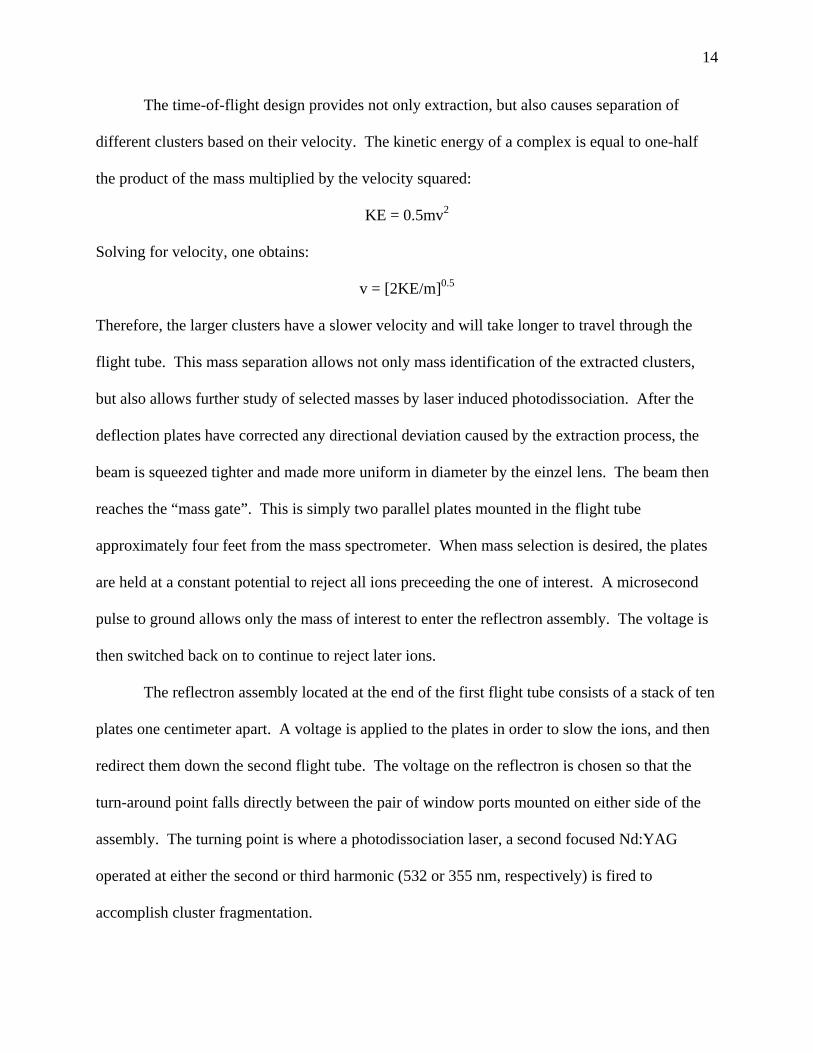
The time-of-flight design provides not only extraction, but also causes separation of
different clusters based on their velocity. The kinetic energy of a complex is equal to one-half
the product of the mass multiplied by the velocity squared:
KE = 0.5mv2
Solving for velocity, one obtains:
v = [2KE/m]0.5
Therefore, the larger clusters have a slower velocity and will take longer to travel through the
flight tube. This mass separation allows not only mass identification of the extracted clusters,
but also allows further study of selected masses by laser induced photodissociation. After the
deflection plates have corrected any directional deviation caused by the extraction process, the
beam is squeezed tighter and made more uniform in diameter by the einzel lens. The beam then
reaches the “mass gate”. This is simply two parallel plates mounted in the flight tube
approximately four feet from the mass spectrometer. When mass selection is desired, the plates
are held at a constant potential to reject all ions preceeding the one of interest. A microsecond
pulse to ground allows only the mass of interest to enter the reflectron assembly. The voltage is
then switched back on to continue to reject later ions.
The reflectron assembly located at the end of the first flight tube consists of a stack of ten
plates one centimeter apart. A voltage is applied to the plates in order to slow the ions, and then
redirect them down the second flight tube. The voltage on the reflectron is chosen so that the
turn-around point falls directly between the pair of window ports mounted on either side of the
assembly. The turning point is where a photodissociation laser, a second focused Nd:YAG
operated at either the second or third harmonic (532 or 355 nm, respectively) is fired to
accomplish cluster fragmentation.
15
The photofragment and parent ion signals are collected at the end of the second flight
tube by an EMT detector operated at 2.6-3.0 kV. The signal is amplified and sent to a LeCroy
digital oscilloscope where spectra are accumulated and then sent to a PC via an IEEE-488
interface for analysis. The spectra shown in this work are presented in a computer difference
mode in which the parent ion appears as a negative mass peak while its photofragments are
plotted as positive peaks.
References
(1) Buchanan, J. W.; Reddic, J. E.; Grieves, G. A.; Duncan, M. A. J. Phys. Chem. A 1998,
102, 6390.
(2) Yeh, C. S.; Pilgrim, J. S.; Willey, K. F.; Robbins, D. L.; Duncan, M. A. Int. Rev. Phys.
Chem. 1994, 13, 231.
(3) Dietz, T. G.; Duncan, M. A.; Powers, D. E.; Smalley, R. E. J. Chem. Phys. 1981, 74,
6511.
(4) Duncan, M. A. Annu. Rev. Phys. Chem. 1997, 48, 69.
(5) Wiley, W. C.; McLaren, I. H. Rev. Sci. Instr. 1955, 26, 1150.

16
Figure 2.1. Oven apparatus used for making PAH-coated metal sample rods.
17
PhotodissociationLaser
Rod rotatorAssembly
PulsedNozzle
Mass Gate
EMTdetector
VHS 10Diffusion
Pump
Wiley-MclarenTOF Source
ReflectronAssembly
VaporizationLaserVHS 6
DiffusionPump
PhotoIonizationLaser
Figure 2.2. The two-chamber, differentially pumped molecular beam apparatus used for the
study of metal-ligand cluster cations.

18
Figure 2.3. The pulsed nozzle cluster source.
Vaporization with Second or Third
Harmonic of Nd:YAG Laser
Newport pulsed beam valve backed with either inert gas
or inert gas with COT
Metal Sample Rod
Supersonic Expansion
Growth Channel
Extension
High Power Laser Vaporizes Metal Into
Gas Pulse

19
CHAPTER 3
LANTHANIDE METAL—CYCLOOCTATETRAENE CATION COMPLEXES
Introduction
A remarkable array of innovative organometallic complexes have been produced in
recent years, including many novel sandwich complexes.1-39 Some of the best known condensed
phase examples of these sandwich complexes, ferrocene40 and dibenzene chromium,41 have
motivated the exploration of these complexes in the gas phase where problems with interfering
solvent effects can be avoided. Experimental and theoretical work has explored sandwich
complexes consisting of benzene,1-5 fullerenes,3,8-22 and polycyclic aromatic hydrocarbons
(PAHs).3,25-31 Some systems such as transition metal—benzene complexes,1-3 metal—PAH
complexes,3,25-28 metal—fullerene complexes3,8-20 and metal—cyclooctatetraene (COT)
complexes7,36-39 have exhibited multiple decker sandwich forms. Photodissociation has been
used to shed light on the structures of some of these complexes.3,13-19,25-27,39 In the present work,
we use photodissociation measurements to investigate the possibility of the existence of multiple
decker sandwich or other structural motifs in lanthanide metal—COT complexes.
Sandwich complexes with COT have been produced previously in the condensed phase42-
45 and in the gas phase.7,22,23,36,37 Streitwieser and Müller-Westerhoff discovered uranocene in
1968.45 Uranocene is structurally analogous to ferrocene, but contains an actinide core of
uranium sandwiched between two COT ligands. Huckel’s rule says that a molecule must have
4n+2 electrons (n = 0, 1, 2, etc.) in order for it to be considered aromatic. An antiaromatic
molecule fits the form 4n according to the rule. COT is antiaromatic because it has eight π

20
electrons. In uranocene, uranium donates two electrons to each ligand creating aromatic COT
dianions. This donation stabilizes uranocene.42-44 On the basis of this same concept, Kaya and
co-workers performed gas-phase studies to investigate the possibility of an extended stacking
motif of lanthanide metals with COT.7,22,23,36,37 The mass spectra observed in their experiments
showed a pattern of magic numbers corresponding to Mn+-(COT)n+1 (M = Ce, Nd, Eu, Ho, Yb)
species, which they assigned to multiple decker sandwiches. Photoelectron spectroscopy of
these complexes gave further evidence for these structures.7
Molecular beam photodissociation studies have been performed previously by our group
for a variety of metal cation—ligand systems such as M+(benzene)n,3-5 M+(C60)n,3,13,14 and
M+(coronene)n.3,25-27 Most recently, studies have been performed on transition metal—COT
clusters.39 In the transition metal systems, clusters of the form M+(COT)1,2 (M = V, Fe, Ni, Ag)
were produced with the di-COT clusters possibly forming sandwich structures.39 Additionally,
photodissociation of the vanadium and iron mono-COT complexes produced M+(C5H5),39 which
we see in the dysprosium and neodymium systems studied here. In transition metal—ligand
bonding, the metal and ligand are able to share π electrons through orbital-orbital interactions.
Molecules gaining eighteen π electrons through this interaction show an increased stability, such
as in ferrocene and dibenzene chromium. However, while this concept is applicable to
complexes containing transition metals and actinide metals, previous experimental42,44 and
theoretical46-49 studies have shown that the chemistry of the lanthanide metals is different.
Therefore, in the present study, we want to investigate whether the complexes formed here are
stable due to purely ionic effects or if the eighteen electron rule is applicable.

21
Experimental
Clusters for these experiments are produced by laser vaporization in a pulsed nozzle
source. The experimental apparatus has been described previously.50 The sample for these
experiments is a solid rod of samarium, dysprosium, or neodymium. Because COT is a liquid at
room temperature, it is added to the system through a reservoir installed on the line feeding the
expansion/backing gas to the nozzle. Argon is used as a backing gas with a pressure of 40-60
psi. Laser vaporization of the metal is accomplished using the second or third harmonic (532 nm
and 355 nm, respectively) of a pulsed Nd:YAG laser (Spectra Physics GCR-11). The laser is
focused onto the sample rod with a 30 cm focal length lens. The metal-COT complexes grow by
recombination in a gas channel extension to the rod holder that is 1-2 cm in length. This
expansion is skimmed into a differentially pumped chamber containing a reflectron time-of-
flight mass spectrometer. In this chamber, the neutral clusters are photoionized with 193 nm
photons from an ArF excimer laser (Lambda Physik Compex).
Mass-selected photodissociation experiments take place in the same reflectron time-of-
flight mass spectrometer with the addition of a pulsed deflection plate (hereinafter the “mass-
gate”) which allows size selection of certain cluster masses. The operation of the instrument for
these experiments has been described previously.50 The time-of-flight through an initial drift
tube section is used to size select the desired cluster, which is then excited with a pulsed laser
(Nd:YAG; 532 or 355 nm) in the turning region of the reflectron field. The time-of-flight
through the second drift tube section provides a mass spectrum of the selected parent ion and its
photofragments, if any. The data are presented in a computer difference mode in which the
dissociated fraction of the parent ion is plotted as a negative mass peak while its photofragments
22
are plotted as positive peaks. Mass spectra are recorded with a digital oscilloscope (LeCroy) and
transferred to a laboratory PC via an IEEE-488 interface.
Laser power and wavelength studies are employed to investigate the possibility of multi-
photon processes and sequential fragmentation processes. The laser power required to
photodissociate these molecules varies considerably with their size and stability. The highest
laser power employed for any cluster represents the full intensity of the unfocused Nd:YAG
laser, which would be our limit of “extremely high power.” “High power,” as used below,
indicates 50-100 mJ/cm2, while “low power” refers to 1-10 mJ/cm2. For the clusters discussed
below, all were photodissociated at “high power.”
Results and Discussion
Figure 3.1 shows mass spectra for each of the samarium, dysprosium, and neodymium—
COT systems, respectively. Due to photoionizing neutrals from the source for these
experiments, the intensity of the peaks in the mass spectra may be misleading. The peaks may
exist and be intense because of a large production of neutrals in the source. However, they may
also be intense because the clusters are fragmented during the photoionization process. If this is
the case, then we may see fragments in the mass spectra which are abundant on their own,
causing the abundance of the neutrals to be skewed. In the samarium-COT mass spectra, the top
frame of Figure 3.1, there is a strong peak for Sm+(COT) followed by a less intense peak for
Sm+(COT)2. After the Sm+(COT)2 peak, a new series of clusters begins, with each cluster
containing two samarium atoms. This series consists of a weak Sm2+(COT) peak, an enhanced
Sm2+(COT)2 peak, and ends with a weak Sm2
+(COT)3 peak. Finally, there are two weak signals
corresponding to Sm3+(COT)3 and Sm3
+(COT)4, with the Sm3+(COT)3 peak being slightly more

23
intense. Noticeably absent from this spectrum are any peaks corresponding to pure samarium
clusters. Additionally, the absence of Sm+(COT)3 or any larger cluster with only one metal atom
suggests that one samarium atom prefers to bind to a maximum of two COT ligands.
Overall, the samarium-COT mass spectrum suggests that samarium prefers a (n,n) type
stoichiometry over the (n, n+1) stoichiometry usually observed for sandwiches. A reasonable
explanation for this behavior is found in its two possible oxidation states, +2 and +3. The
organic ligand COT is most stable as a dianion. This causes the molecule to become planar and
obey the 4n+2 Hückel Rule of aromaticity. Knowing this fact, it is then easy to understand why
the (1,1) is the most stable arrangement for the neutral complexes created in the source, as one
samarium in its +2 oxidation state would donate two electrons to COT creating a stable, neutral,
ionicly bonded complex. This is consistent with the fact that samarium has been reported to
prefer the +2 oxidation state in its synthetically prepared half-sandwich complex and also that
samarium-COT complexes are reported to be polymeric.51
In the dysprosium mass spectrum, found in the middle frame of Figure 3.1, there is a
Dy+(COT) peak and a Dy+(COT)2 peak. However, the Dy+(COT)2 peak is slightly larger in
intensity than the Dy+(COT) peak, which is in contrast to the intensities of the same Mx+(COT)y
peaks found in the samarium mass spectrum. Additionally, as the spectrum continues, there
exists a Dy2+(COT)2 peak and a Dy2
+(COT)3 peak, but the intensity of the Dy2+(COT)3 peak is
much larger than that of the Dy2+(COT)2 peak. This is also in contrast to the samarium spectrum
above. Similar to the dysprosium-COT spectrum, the neodymium-COT mass spectrum, the
bottom frame of Figure 3.1, shows a large Nd+(COT) peak followed by a less intense Nd+(COT)2
peak. After these, the intensities dip sharply with an almost non-existent Nd2+(COT) peak,
followed by almost equal intensity peaks of Nd2+(COT)2 and Nd2
+(COT)3. Additionally, we see

24
a small peak in each of the dysprosium and neodymium spectra corresponding to Dy+(C5H5) and
Nd+(C5H5).
Conversely to the samarium mass spectrum, the clusters in the dysprosium-COT mass
spectrum seem to illustrate that an (n, n+1) type stoichiometry is preferred for this system.
Again, this can be explained through the use of oxidation states. Dysprosium strongly prefers
the +3 oxidation state. Remembering that COT prefers to assume a dianion state and that the
ions photodissociated were initially neutral species in the source, the most natural neutral
molecule created by the interaction of Dy (+3) with COT (-2) would be the Dy2(COT)3 complex.
These presence of these clusters, as well as those in the samarium and neodymium systems, raise
questions about their structures and possible binding motifs. Therefore, in order to probe the
structures of these clusters, we have employed mass-selected photodissociation experiments to
provide more information.
The top frame of Figure 3.2 shows the photodissociation of the Sm+(COT) complex. The
parent ion is shown as a negative peak indicating depletion due to fragmentation, while the
fragments appear positive. The most prominent fragment is the metal ion itself. Usually, when
clusters dissociate, the fragment with the lower ionization potential (“IP”) is observed as an ion,
while the fragment with the higher IP is lost as a neutral and is not detected. The IP of samarium
is 5.6437 eV,52 whereas COT’s IP is 8.0 eV.52 Therefore, in this instance, one would expect to
see simple cleavage of the metal-ligand bond resulting in the Sm+ fragment being detected.
Indeed, this is exactly what is produced.
The lower frame of Figure 3.2 shows the photodissociation of the Sm+(COT)2 cluster.
The primary product is Sm+(COT), formed by cleanly eliminating a neutral COT molecule.
There is also a small amount of the Sm+ ion fragment. This is more than likely produced by

25
further fragmentation of the Sm+(COT) fragment. Because the Sm+(COT) cluster appears as an
ionic fragment, it almost certainly has an IP that is lower than that of COT. Additionally, since
the COT ligands would be expected to experience a greater attraction for the metal ion than for
each other, we would expect that this complex exists as a sandwich structure. The fragmentation
pattern is consistent with the “peeling off” of layers if it is assumed that this is a stacked cluster.
In the top frame of Figure 3.3, the fragmentation of Sm2+(COT) is shown. Sm2(COT) has
been observed in solution phase chemistry to be an inverted sandwich with samarium atoms on
either side of the COT molecule.51 However, the fragments observed in this spectrum suggest
that the metal is inserting itself into the carbon-carbon framework of the ligand, but that the
metals are probably not bound to each other. This observation is due to the markedly different
fragmentation pattern shown here indicating dissociation of the COT ring system. The
dissociation of the Sm2+(COT) cluster shows an initial loss of consecutive C2H2 units. This loss
results in a prominent Sm2+(C4H4) peak along with less intense Sm2
+(C6H6) and Sm2+(C2H2)
peaks. A standard mass spectrum of COT alone, not shown here, shows that COT will fragment
into CxHx units with the most prominent fragment being C6H6.53 The presence of the two
samarium atoms seems to cause COT to fragment into these CxHx units through the loss of one
C2H2 unit at a time.
Another new feature is the presence of the Sm+(C2H2) cluster, which must result from
further fragmentation of the Sm2+(C4H4) or directly from the parent ion since it was not
previously observed as a fragment of Sm+(COT). If the Sm2+(C4H4) cluster exists as an open
ring fragment with samarium atoms attached to vicinal double bonds, it would make sense for
the Sm+(C2H2) cluster to come from breaking the single C—C bond in the larger cluster.
HC
HC CHHC
SmSm
26
However, the Sm2+(C4H4) cluster could also exist as a cyclobutadiene ring sandwiched by the
two samarium atoms. Even though cyclobutadiene exhibits high ring strain, there are many
known cases of transition metal cyclobutadiene complexes where the presence of the metal helps
to stabilize the ring structure.54,55 Also in the spectrum are the previously observed Sm+(COT)
and Sm+ fragments. The presence of Sm+(COT) indicates that it not only has a lower IP than that
of COT, but also of samarium, as Sm2+(COT) would have to lose a neutral samarium atom in
order for this to be produced.
The photodissociation mass spectrum for the Sm2+(COT)2 cluster is shown in the bottom
frame Figure 3.3. Lower signal intensity, decreased resolution at this higher mass, and the
multitude of isotopes with two samarium atoms make the peaks look broad and noisy. The
heaviest photofragment observed is loss of an entire COT ligand yielding the Sm2+(COT) cluster.
From here, one might expect a similar fragmentation pattern as seen above for the Sm2+(COT)
cluster. Instead, there are prominent Sm+(COT) and Sm+ peaks. This pattern of fragmentation is
consistent with the idea of alternating layers in sandwich-type structures and has been observed
in previous studies of multi-decker sandwich clusters.7 One last feature of this spectrum is a
peak corresponding to Sm2+(C2H2) which was also seen in the photodissociation spectrum for
Sm2+(COT). This peak probably results from further fragmentation of the Sm2
+(COT) cluster
where the samarium atoms disrupted the COT ring and benzene was lost as a neutral molecule.
The top frame of Figure 3.4 shows the photodissociation spectrum of Dy+(COT). The
main fragment peak is the one for Dy+. As discussed above, one would expect the species with
the lower IP to appear in the spectrum. The IP of dysprosium is 5.93 eV,52 which is lower than
the IP of COT at 8.0 eV.52 Therefore, as expected, an intact COT is lost as a neutral molecule
leaving Dy+. Additionally, there are peaks corresponding to Dy+(CxHx) (x = 2, 4, 5, 6) in this

27
spectrum with Dy+(C5H5) being by far the most prominent. It is well known that C5H5 is not
aromatic; however, when it receives charge donation from a metal complexed with it, it can
become aromatic as the cyclopentadienyl anion.40 If we are to assume that C5H5 exists as the
cyclopentadienyl anion here, it would need to combine with a +2 oxidation state metal to
produce a positively charged species as is shown in these spectra. As mentioned above,
dysprosium strongly prefers the +3 oxidation state, although it does form some compounds while
in the +2 oxidation state such as DyI2 and DyCl2. For this complex to make sense, dysprosium
would have to assume the +2 oxidation state while C5H5 would have to exist as the
cyclopentadienyl anion with the presence of each stabilizing the other.
In the transition metal—COT study performed previously by our group, the
photodissociation of V+(COT) produced V+(C5H5) and Fe+(COT) produced a small amount of
Fe+(C5H5). The stability of the vanadium and iron fragments was explained by ionic interaction
as well as by the eighteen electron rule. However, the eighteen electron rule does not seem to
apply to the lanthanide metal complexes produced here. The 4f orbitals of lanthanide metals
have no radial nodes and are deeply buried in the atomic core, leaving negligible overlap with
ligand orbitals. Therefore, the interactions between lanthanide metals and ligands are
predominately ionic. Previous experimental42,44 and theoretical46-49 studies have shown that
lanthanide complexes bond very differently than the corresponding actinide complexes.
Actinides commonly are able to adopt a +4 oxidation state, which makes them well suited to
form the sandwich structure with COT by donating two electrons to each COT ligand as
discussed above with uranocene. Additionally, they are able to form covalent interactions
through their 5f orbitals, much like the transition metals with their 3d orbitals.

28
The middle and lower frames of Figure 3.4 show the photodissociation of Dy+(COT)2 and
Dy2+(COT)3, respectively. The fragmentation of Dy+(COT)2 shows first the elimination of an
intact COT molecule and then the elimination of the second intact COT molecule leaving only
Dy+. This pattern is what would be expected if Dy+(COT)2 existed in a sandwich formation.
There is also a small amount of Dy+(C5H5) and Dy+(C6H6) present in this spectrum as in the
spectra for Dy+COT. The lower frame of Figure 3.4 shows the fragmentation of Dy2+(COT)3,
the largest cluster that was photodissociated and one of the more prominent clusters in the mass
spectrum. The highest mass fragment is that of Dy2+(COT)2 which is the result of elimination of
an intact COT molecule. The next peak is the Dy+(COT)2 cluster which results from the loss of a
dysprosium atom. So far, this is the expected fragmentation pattern for a sandwich structure.
This pattern is continued through the loss of another intact COT molecule producing Dy+(COT).
The fragmentation is complete through the loss of the last intact COT molecule leaving only
Dy+. Again, there is a small peak corresponding to Dy+(C5H5).
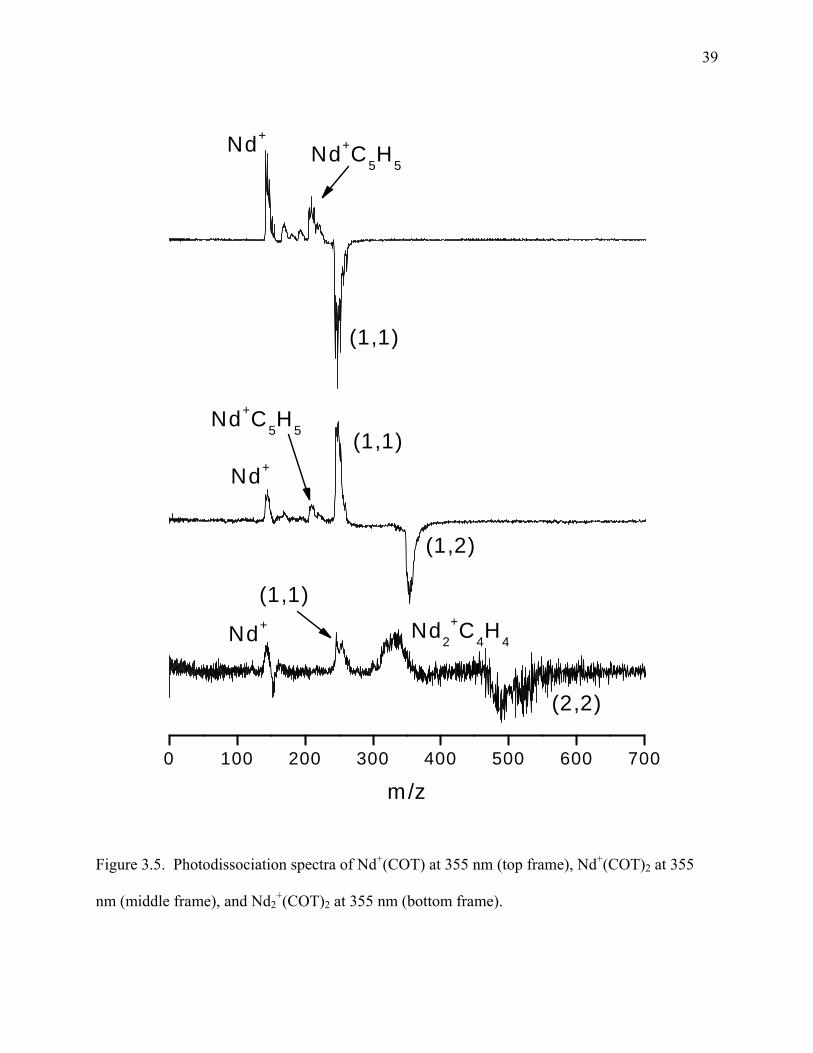
The top frame of Figure 3.5 shows the photodissociation spectra of Nd+(COT). The main
fragmentation peak is Nd+, which results from a loss of neutral COT. Again, one would expect
to see the fragment of the species with the lowest IP. The IP of neodymium is 5.525 eV52 and
COT’s IP is 8.0 eV.52 Therefore, as expected, COT is lost as a neutral molecule and Nd+ is seen
as a fragment peak. Additionally, as with dysprosium, there are peaks corresponding to
Nd+(CxHx) (x = 2-6) with Nd+(C5H5) again being the most prominent. The bonding theory for
this fragment is the same as what is discussed above for dysprosium.
The middle frame of Figure 3.5 shows the photodissociation of Nd+(COT)2. This
fragmentation is exactly the same as that of the Dy+(COT)2 cluster. The two COT ligands are
sequentially lost leaving the Nd+ fragment. This pattern is what would be expected if

29
Nd+(COT)2 existed in a sandwich formation. Also present in this spectrum is a peak
corresponding to Nd+(C5H5) with smaller peaks corresponding to Nd+(C6H6) and Nd+(C2H2) as
in the spectra for Nd+(COT).
In the bottom frame of Figure 3.5 is the photodissociation spectrum of Nd2+(COT)2. In
this spectrum, one of the most prominent peaks corresponds to Nd2+(C4H4). To obtain this
cluster, there was loss of an intact COT molecule as well as a loss of C4H4 from the second COT
molecule. This photodissociation spectra shows the presence of two metal atoms disturbing the
COT backbone as was the case in the double metal samarium system. The C4H4 group in this
case could represent a cyclobutadiene ligand interacting with a pair of neodymium atoms.
Cyclobutadiene exhibits a high ring strain; however, there are many known cases of transition
metal cyclobutadiene complexes where the presence of the metal stabilizes the ring.54,55
Lanthanide metals often exhibit similar chemistry to the transition metals due to the contracted
nature of the f orbitals, which prevents their participation in valence bonding.54 After this peak,
the fragmentation pattern also shows a strong Nd+(COT) fragment as well as a Nd+ fragment.
Conclusions
Lanthanide metal complexes of samarium, dysprosium, and neodymium with COT were
produced by laser vaporization and studied by fixed frequency photodissociation. Mass spectral
data shows that the complexes are more than likely formed by metal atoms, not clusters of atoms,
attaching to COT molecules. Samarium-COT clusters were not observed to exhibit the (n, n+1)
alternating pattern observed previously. Photodissociation of samarium-COT clusters exhibited
much less ring disruption except in clusters with more than one samarium atom. Clusters with
two or more samarium atoms exhibited a large degree of COT fragmentation, which may be

30
present in the parent cluster, or may be photoinduced upon fragmentation. However, the
fragmentation patterns observed still indicate at least the presence of an isomer that may exist in
a multi-decker sandwich form.
For neodymium and dysprosium, some degree of metal insertion into the COT ring takes
place to produce M+(C5H5). This result is intriguing because if the ligand is a cyclopentadienyl
group, these metals must adopt a net +2 oxidation state, which they generally do not prefer.
Photodissociation of the COT clusters with dysprosium and neodymium also indicates that ring
insertion into one COT ligand may be taking place, followed by the weak attachment of
additional COT ligands. This suggests that neodymium and dysprosium bind strongly to the
COT ligand, whereas samarium is not so strongly bound.
These systems exhibit some very interesting chemistry. Further study by infrared
spectroscopy would be able to distinguish between COT that is weakly attached to a metal versus
COT that has become aromatic by way of the distinct C-H stretch vibrations. By measuring this,
the question of whether the metals are donating electrons to the COT ligands could be addressed
and in doing so provide insights about the oxidation state of the metals. Also, IR spectroscopy
would be able to shed valuable insight on the nature of the lanthanide-hydrocarbon clusters to
determine if they are open structures or rings in their attachment to the metals.
References
(1) Hoshino, K.; Kurikawa, T.; Takeda, H.; Nakajima, A.; Kaya, K. J. Phys. Chem. 1995, 99,
3053.
(2) Judai, K.; Hirano, M.; Kawamata, H.; Yabushita, S.; Nakajima, A.; Kaya, K. Chem. Phys.
Lett. 1997, 270, 23.

31
(3) Buchanan, J. W.; Grieves, G. A.; Reddic, J. E.; Duncan, M. A. Int. J. Mass Spectrom.
1999, 182/183, 323.
(4) Pillai, E. D.; Molek, K. S.; Duncan, M. A. Chem. Phys. Lett. 2005, 405, 247.
(5) Willey, K. F.; Yeh, C. S.; Robbins, D. L.; Duncan, M. A. J. Phys. Chem. 1992, 96, 9106.
(6) Hosoya, N.; Takegami, R.; Suzumura, J.; Yada, K.; Koyasu, K.; Miyajima, K.; Mitsui,
M.; Knickelbein, M. B.; Yabushita, S.; Nakajima, A. J. Phys. Chem. A 2005, 109, 9.
(7) Kurikawa, T.; Negishi, Y.; Hayakawa, F.; Nagao, S.; Miyajima, K.; Nakajima, A.; Kaya,
K. J. Am. Chem. Soc. 1998, 120, 11766.
(8) Kurikawa, T.; Nagao, S.; Miyajima, K.; Nakajima, A.; Kaya, K. J. Phys. Chem. A 1998,
102, 1743.
(9) Nakajima, A.; Nagao, S.; Takeda, H.; Kurikawa, T.; Kaya, K. J. Chem. Phys. 1997, 107,
6491.
(10) Nagao, S.; Kurikawa, T.; Miyajima, K.; Nakajima, A.; Kaya, K. J. Phys. Chem. A 1998,
102, 4495.
(11) Nagao, S.; Negishi, Y.; Kato, A.; Nakamura, Y.; Nakajima, A.; Kaya, K. J. Phys. Chem.
A 1999, 103, 8909.
(12) Suzumura, J.; Hosoya, S.; Nagao, S.; Mitsui, M.; Nakajima, A. J. Chem. Phys. 2004, 121,
2649.
(13) Reddic, J. E.; Robinson, J. C.; Duncan, M. A. Chem. Phys. Lett. 1997, 279, 203.
(14) Grieves, G. A.; Buchanan, J. W.; Reddic, J. E.; Duncan, M. A. Int. J. Mass Spectrom.
2001, 204, 223.
(15) Branz, W.; Billas, I. M. L.; Malinowski, N.; Tast, F.; Heinebrodt, M.; Martin, T. P. J.
Chem. Phys. 1998, 109, 3425.

32
(16) Martin, T. P.; Malinowski, N.; Zimmermann, U.; Naeher, U.; Schaber, H. J. Chem. Phys.
1993, 99, 4210.
(17) Tast, F.; Malinowski, N.; Frank, S.; Heinebrodt, M.; Billas, I. M. L.; Martin, T. P. Phys.
Rev. Lett. 1996, 77, 3529.
(18) Tast, F.; Malinowski, N.; Frank, S.; Heinebrodt, M.; Billas, I. M. L.; Martin, T. P. Z.
Phys. D: At., Mol. Clusters 1997, 40, 351.
(19) Zimmermann, U.; Malinowski, N.; Naeher, U.; Frank, S.; Martin, T. P. Phys. Rev. Lett.
1994, 72, 3542.
(20) Basir, Y.; Anderson, S. L. Chem. Phys. Lett. 1995, 243, 45.
(21) Welling, M.; Thompson, R. I.; Walther, H. Chem. Phys. Lett. 1996, 253, 37.
(22) Nakajima, A.; Kaya, K. J. Phys. Chem. A 2000, 104, 176.
(23) Miyajima, K.; Knickelbein, M. B.; Nakajima, A. Polyhedron 2005, 24, 2341.
(24) Nagao, S.; Kato, A.; Nakajima, A.; Kaya, K. J. Am. Chem. Soc. 2000, 122, 4221.
(25) Buchanan, J. W.; Reddic, J. E.; Grieves, G. A.; Duncan, M. A. J. Phys. Chem. A 1998,
102, 6390.
(26) Buchanan, J. W.; Grieves, G. A.; Flynn, N. D.; Duncan, M. A. Int. J. Mass Spectrom.
1999, 185-187, 617.
(27) Foster, N. R.; Grieves, G. A.; Buchanan, J. W.; Flynn, N. D.; Duncan, M. A. J. Phys.
Chem. A 2000, 104, 11055.
(28) Duncan, M. A.; Knight, A. M.; Negishi, Y.; Nagao, S.; Judai, K.; Nakajima, A.; Kaya, K.
J. Phys. Chem. A 2001, 105, 10093.
(29) Duncan, M. A.; Knight, A. M.; Negishi, Y.; Nagao, S.; Nakamura, Y.; Kato, A.;
Nakajima, A.; Kaya, K. Chem. Phys. Lett. 1999, 309, 49.

33
(30) Pozniak, B. P.; Dunbar, R. C. J. Am. Chem. Soc. 1997, 119, 10439.
(31) Willey, K. F.; Cheng, P. Y.; Bishop, M. B.; Duncan, M. A. J. Am. Chem. Soc. 1991, 113,
4721.
(32) Duncan, M. A. Annu. Rev. Phys. Chem. 1997, 48, 69.
(33) Klotz, A.; Marty, P.; Boissel, P.; de Caro, D.; Serra, G.; Mascetti, J.; de Parseval, P.;
Derouault, J.; Daudey, J. P.; Chaudret, B. Planet. Space Sci. 1996, 44, 957.
(34) Marty, P.; de Parseval, P.; Klotz, A.; Chaudret, b.; Serra, G.; Boissel, P. Chem. Phys.
Lett. 1996, 256, 669.
(35) Marty, P.; de Parseval, P.; Klotz, A.; Serra, G.; Boissel, P. Astron. Astrophys. 1996, 316,
270.
(36) Kurikawa, T.; Negishi, Y.; Hayakawa, F.; Nagao, S.; Miyajima, K.; Nakajima, A.; Kaya,
K. Z. Phys. D: At., Mol. Clusters 1999, 9, 283.
(37) Miyajima, K.; Kurikawa, T.; Hashimoto, M.; Nakajima, A.; Kaya, K. Chem. Phys. Lett.
1999, 306, 256.
(38) Poremba, P.; Edelmann, F. T. J. Organomet. Chem. 1998, 553, 393.
(39) Jaeger, T. D.; Duncan, M. A. J. Phys. Chem. A 2004, 108, 11296.
(40) Kealy, T. J.; Paulson, P. L. Nature 1951, 168, 1039.
(41) Fischer, E. O.; Hafner, W. Z. Naturforsch. 1955, 10b, 665.
(42) Hodgson, K. O.; Raymond, K. N. Inorg. Chem. 1972, 11, 3030.
(43) Long, N. J. Metallocenes, Blackwell Sciences, Ltd., Oxford, 1998.
(44) Streitwieser, A.; Muller-Westerhoff, U.; Sonnichsen, G.; Mares, F.; Morell, D. G.;
Hodgson, K. O.; Harmon, C. A. J. Am. Chem. Soc. 1973, 95, 8644.
(45) Streitwieser, A.; Muller-Westerhoff, U. J. Am. Chem. Soc. 1968, 90, 7364.

34
(46) Anderson, R. A.; Bonsella, C. J.; Burns, C. J.; Green, J. C.; Hohl, D.; Rosch, J. J. Chem.
Soc., Chem. Commun. 1986, 405.
(47) Hodgson, K. O.; Mares, F.; Starks, D. F.; Streitwieser, A. J. Am. Chem. Soc. 1973, 95,
8650.
(48) Nugent, L. J.; Laubereau, P. G.; Werner, G. K.; Vander Sluis, K. L. J. Organomet. Chem.
1971, 27, 365.
(49) Raymond, K. N.; Eigenbrot, C. W. Acc. Chem. Res. 1980, 13, 276.
(50) Yeh, C. S.; Pilgrim, J. S.; Willey, K. F.; Robbins, D. L.; Duncan, M. A. Int. Rev. Phys.
Chem. 1994, 13, 231.
(51) Edelmann, F. T. New J. Chem. 1995, 19, 535.
(52) Lias, S. G., in Linstrom, P. J. and Mallard, W. G. (Eds.), Nist Chemistry Webbook, Nist
Standard Reference Database Number 69, National Institute of Standards and
Technology, Gaithersburg MD, 20899, June 2005.
(53) Stein, S. E., in Linstrom, P. J. and Mallard, W. G. (Eds.), "Mass Spectra" In Nist
Chemistry Webbook, Nist Standard Reference Database Number 69. National Institute of
Standards and Technology, Gaithersburg, MD 20899, June 2005.
(54) Cotton, F. A.; Wilkinson, G. Advanced Inorganic Chemistry, Wiley-Interscience, New
York, 1972.
(55) Efraty, A. Chem. Rev. 1977, 77, 691.

35
100 200 300 400 500 600 700 800 900 1000
m/z
(1,1)
Sm+ (1,2)(2,2)
(2,1)
Smx+-COTy
(2,3)(3,3) (3,4)
Dy+
Dy+-C5H5(1,1) (1,2)
(2,3)(2,2)
Dyx+-COTy
Nd+
(1,1)
(1,2)(2,1)
(2,2)(2,3)
Ndx+-COTy
Nd+-C5H5
Figure 3.1. These are the mass spectra of the complexes produced with the lanthanide metals
samarium, dysprosium, and neodymium, respectively, with cyclooctatetraene.

36
0 100 200 300 400 500
m /z
(1,1)
Sm +
(1,2)
(1,1)
Sm +
Figure 3.2. The top frame shows the photodissociation spectrum of Sm+(COT) fragmented at
355 nm. The lower frame shows the photodissociation spectrum of Sm+(COT)2 at 355 nm.

37
0 100 200 300 400 500 600
m/z
(2,1)
Sm +Sm +C2H 2
24
6
Sm 2CxH x+
(1,1)
(2,2)
(2,1)(1,1)Sm +
Sm 2C2H 2+
Figure 3.3. The top frame shows the photodissociation spectra of Sm2+(COT) at 355 nm. The
lower frame shows the photodissociation of Sm2+(COT)2 at 355 nm.

38
0 100 200 300 400 500 600 700 800
m/z
Dy+ Dy+C5H5
(1,2)
(1,1)Dy+
(2,3)
(2,2)(1,1)Dy+
Dy+C5H5
Dy+C5H5
(1,2)
(1,1)
Figure 3.4. Photodissociation spectra of Dy+(COT) at 355 nm (top frame), Dy+(COT)2 at 355nm
(middle frame) and Dy2+(COT)3 at 355 nm (bottom frame).
39
0 100 200 300 400 500 600 700
m/z
(1,1)
Nd+
Nd+C5H5
(1,2)
(1,1)Nd+
Nd+C5H5
(2,2)
Nd2+C4H4Nd+
(1,1)
Figure 3.5. Photodissociation spectra of Nd+(COT) at 355 nm (top frame), Nd+(COT)2 at 355
nm (middle frame), and Nd2+(COT)2 at 355 nm (bottom frame).

40
CHAPTER 4
IRON—PYRENE AND IRON—PERYLENE CATION CLUSTERS
Introduction
In recent years, much experimentation has been focused on interesting organometallic
sandwich clusters.1 While these clusters may be difficult to study through conventional wet
chemistry, the advent of new gas-phase techniques has made the study of these clusters possible.
Through the use of gas-phase experiments, these organometallic systems have demonstrated
fascinating spectroscopy and photochemistry. Martin and co-workers were able to produce
metal-coated C60 in their studies of transition metals with C60.2-8 Kaya and co-workers have
reported interesting multi-decker sandwiches for transition metals complexed with benzene,9,10
C60,11-13 and ferrocene,14 as well as lanthanide metals complexed with C6015 and
cyclooctatetraene.16,17 Additionally, our research group has produced metal clusters with
benzene,18-20 C60,20-22 and cyclooctatetraene.23 Moreover, an array of metal clusters with
polycyclic aromatic hydrocarbons (“PAHs”) has been produced by our research group,20,24-29
along with other complexes produced by Dunbar and co-workers,30 Marty and co-workers,31 and
Szczepanski and co-workers.32 In the present work, we discuss the production and
photodissociation of gas-phase iron-pyrene and iron-perylene cation clusters.
Metal-PAH clusters are interesting for a variety of reasons. PAHs are often used by
theorists to represent a finite section of graphite in order to study surface physisorption dynamics
and energetics. Moreover, these systems may be used to model metal attachment to the walls of
carbon nanotubes or metal intercalated graphite. Additionally, metal-PAH complexes are

41
thought to form interstellar gas clouds and contribute to the depletion of metal in them.33 PAHs
have been implicated as carriers of the unidentified infrared bands (“UIBs”) or diffuse
interstellar bands (“DIBs”), which are observed in all parts of the galaxy.34,35 Moreover, they are
estimated to account for 5-15% of the cosmic carbon, which make them an ample component of
the interstellar medium. However, recent studies have shown that the spectra of PAHs alone do
not match the astrophysical spectra. As a result, it is thought that various PAH complexes,
especially those with metal, may be used to explain these UIBs and DIBs.
Metal ion clusters with selected PAHs have been described previously. Dunbar and co-
workers were the first to make metal-PAH systems in the gas phase.30 They used FT-ICR mass
spectrometry to probe the association kinetics of various metal ions with coronene. Marty and
co-workers used Fourier transform mass spectroscopy to study iron-naphthalene cations and their
possible astrophysical implications.31 Recently, Szczepanski and co-workers measured
vibrational spectra of cationic iron-PAH complexes with benzene, naphthalene and fluorene.32
Theorists have performed calculations to determine the binding energies of various metals to
different PAHs, as well as the preferential binding sites of the metal on the PAH molecules.36-38
Our research group has produced and studied numerous metal-PAH systems with time-of-flight
mass spectrometry and mass-selected laser photodissociation such as chromium-coronene,28
iron-coronene,25 silver-coronene,24 and niobium with coronene and pyrene.27 In the iron-
coronene system, cluster masses of the form Fex(Cor)y+ are observed for x = 1-3 and y = 1, 2
with additional masses for the complexes Fe(Cor)y+, y = 1-7.25 Through photodissociation
experiments, it was found that the iron binds to intact coronene molecules and that this system
eliminates neutral metal atoms rather than molecular metal fragments as they decompose .
However, in the chromium-coronene system, one of the fragmentation channels showed the

42
elimination of molecular chromium clusters as opposed to the loss of individual atoms. One or
both of these pathways could take place in the iron systems of this study. Additionally, in both
systems, there was evidence that some of the clusters may exist as sandwich structures. In the
present study of iron with pyrene and perylene, we want to examine the existence of possible
sandwich structures as well as probe how iron may bind with these smaller PAH molecules.
Experimental
Clusters for these experiments are produced by laser vaporization in a pulsed nozzle
source. The experimental apparatus has been described previously.39 The specially prepared
samples for these experiments are pure iron rods coated with a thin film of either pyrene or
perylene. Since pyrene and perylene are solids at room temperature, they must be sublimed onto
the iron rod. Films are deposited in a small vacuum chamber dedicated for sample preparation,
which has been described previously.25
Once the sample is prepared, it is transferred to the molecular beam machine. Laser
vaporization of the film coated metal sample is accomplished using the third harmonic (355 nm)
of a pulsed Nd:YAG laser. The conditions are similar to those described for metal—coronene
complex formation where signals are sensitive to both film thickness and the vaporization laser
power.25 Under optimized conditions, the vaporization laser desorbs the ligand and penetrates to
ablate the underlying metal, thus producing both species in the gas phase. Clusters grow by
recombination in the gas channel, which extends beyond the vaporization point. The cation
clusters produced directly in the source pass through a skimmer and are extracted from the
molecular beam into the mass spectrometer with pulsed acceleration voltages.

43
Mass-selected photodissociation experiments take place in the same reflectron time-of-
flight mass spectrometer with the addition of a pulsed deflection plate (hereinafter “mass-gate”)
which allows size selection of certain cluster masses. The operation of the instrument for these
experiments has been described previously.39 The time-of-flight through an initial drift tube
section is used to size select the desired cluster, which is then excited with a pulsed laser
(Nd:YAG; 355 nm) in the turning region of the reflectron field. The time-of-flight through the
second drift tube section provides a mass spectrum of the selected parent ion and its
photofragments, if any. The data is presented in a computer difference mode in which the
dissociated fraction of the parent ion is plotted as a negative mass peak while its photofragments
are plotted as positive peaks. Mass spectra are recorded with a digital oscilloscope (LeCroy) and
transferred to a laboratory PC via an IEEE-488 interface.
Results and Discussion
Figure 4.1 shows the mass spectra for the iron-pyrene system and the iron-perylene
systems. In the iron-pyrene system, the top frame of Figure 4.1, we see clusters form with either
one or two pyrene ligands with up to four iron atoms. With the iron-perylene system, the bottom
frame of Figure 4.1, there are peaks corresponding to clusters containing one and two perylene
molecules with one and two iron atoms, as well as a small Fe(Per)3+ peak. The most prominent
clusters for each system are Fe(PAH)+ and the Fe(PAH)2+. In the iron-pyrene system, the
intensities of the signals for clusters with multiple metal atoms fall off gradually with size. It is
interesting to note that with the pyrene clusters, the most metal atoms seen in a cluster is four,
while the most metal in any perylene cluster is only two atoms. If four metal atoms could attach
to pyrene, it seems that similar results should exist for perylene. It is not clear why this disparity

44
exists, but it may be simply an issue of each system having a different iron concentration, which
is more than likely the case here. With these experiments, it is not always possible to control the
concentration of metal in the systems. The mass spectrum of iron with perylene was taken
several times and there were not usually peaks with multiple metal atoms, but it is not absolutely
clear why. None the less, these results are still interesting. Another intriguing aspect of the iron
–pyrene mass spectrum is that there is not a peak corresponding to a pyrene molecule without an
iron atom. However, with the iron-perylene system, there are two small peaks corresponding to
perylene cation and di-perylene cation.
Absent from both mass spectra are clusters which contain multiple iron atoms without
either pyrene or perylene. This result may indicate that in the clusters containing more than one
iron atom, that the metal atoms are not clustered together on the surface of the ligand, but
instead, individually attached. Additionally, there is no evidence for destruction of pyrene or
perylene in the laser generated plasma, which is consistent with observations made in our
group’s previous study of iron-coronene complexes.25 There is also no evidence for reactive
destruction of pyrene or perylene by iron, which could conceivably produce smaller metal-
hydrocarbons or metal-carbide masses.
The very strong peak in each system for the Fe(PAH)2+ cluster immediately raises the
question of whether these clusters exist as sandwiches. Additionally, for the clusters which have
more than one metal atom, it would be interesting to study how those iron atoms are attached to
the ligand. In order to probe the structure of these various clusters, we employ mass-selected
photodissociation studies. In the photodissociation studies that follow, it should be noted that the
parent ion is shown as a negative peak indicating depletion due to fragmentation, while the
fragments appear positive. Additionally, the energetics of metal-PAH systems are largely

45
unknown and are difficult to determine with any accuracy due to a large kinetic shift. Therefore,
in order to initiate photodissociation, a large amount of energy must be put into the clusters,
which leads us to conclude that these processes are multiphoton in nature.
The top frame of Figure 4.2 shows the photodissociation of Fe(Pyr)+. In this spectrum,
the most prominent fragment corresponds to the ligand itself. We know from previous studies in
our lab that when a parent cluster photodissociates, the fragment with the lower ionization
potential (“IP”) is observed as an ion, while the fragment with the higher IP is lost as a neutral
and is not detected. This pattern is usually true; although, sometimes charge transfer can occur,
causing the higher IP species (metal or ligand) to become charged and detected as well. In this
system, the IP of pyrene is 7.43 eV40 and that of iron is 7.870 eV.40 Therefore, in this instance,
we would expect to see simple cleavage of the metal-ligand bond resulting in the pyrene ion
being detected. Indeed, this is exactly what is produced. Additionally, there is a small peak
corresponding to C14H10+ (mass 178 amu), which could be a number of molecules, the simplest
being anthracene. This fragment results from pyrene losing two carbon atoms and is probably
due to fragmentation of the pyrene fragment.
The bottom frame of Figure 4.2 shows the photodissociation of the Fe(Pyr)2+ cluster. The
highest-mass product is Fe(Pyr)+, formed by eliminating a neutral pyrene molecule. The most
intense fragment is that of the pyrene cation. This is more than likely produced by further
fragmentation of the Fe(Pyr)+ fragment. Due to the appearance of Fe(Pyr)+ as an ionic fragment,
we learn that it almost certainly has an IP that is lower than that of pyrene. Additionally, since
the pyrene ligands would be expected to experience a greater attraction for the metal ion than for
each other, we would expect that this cluster exists as a sandwich structure. The fragmentation
pattern is consistent with the “peeling off” of layers if it is assumed that this is a stacked cluster.

46
One last feature in this spectrum is a small peak corresponding to Fe(C15H9)+. This fragment is
formed by a loss of a CH unit from a pyrene molecule. Because it would be highly unlikely for
the iron atom to attach at another binding position on the pyrene while there is a vacancy in one
of the aromatic rings created from the loss of the CH, it is likely that the iron atom has inserted
itself into the pyrene ring system in place of the CH that was lost. This same type of insertion
was seen in our group’s chromium-coronene study,28 as well as in studies of niobium41 and iron
with C60.2,22 Therefore, it is completely possible for this type of interaction to occur with pyrene.
An interesting aspect of these iron-pyrene clusters is the production of clusters with
multiple iron atoms bound to a single pyrene molecule, as well as multi-iron—multi-pyrene
clusters. These types of clusters have been produced in our lab previously in the iron-coronene
and chromium-coronene systems.25,28 As with those systems, there are two general schools of
thought for multi-metal attachment to the flat surface of a pyrene molecule. The metals may
disperse over the pyrene surface and bind to various ring sites via individual π or bridging
interactions as was seen in the iron-coronene system.25 Additionally, this type of interaction
could occur on both sides of the pyrene molecule and not simply be limited to interaction on only
one side. The other possible bonding scheme is that the multiple metal atoms may cluster
together and bind to the pyrene surface, as was seen in the chromium-coronene system.28 The
structures of the clusters produced cannot be determined unequivocally through the use of mass
spectrometry. However, we can gather insight and probe these possible structures through mass-
selected, multi-photon photodissociation of these clusters.
The top frame of Figure 4.3 shows the photodissociation spectrum of Fe2(Pyr)2+. The
photodissociation spectrum for Fe2(Pyr)+, not shown, shows the same photofragments as does
this spectrum. Therefore, we will discuss them together. The most prominent peak in both

47
spectra is again that of the pyrene cation. Additionally, there are also less intense peaks
corresponding to Fe(Pyr)+, Fe2+ and Fe+. The presence of Fe+ is interesting as it should be lost as
a neutral and not seen as a fragment. Its presence could come from further fragmentation of the
iron dimer fragment. Alternatively, its presence could also be due to reionization of the neutral
photofragment. Reionization is a common problem in systems that require high laser power for
fragmentation. More intriguing is the simultaneous observation of the iron dimer cation and the
pyrene ion. These fragments must result from simultaneous fragmentation channels of two
different isomers because the IP of iron dimer is much lower than that of pyrene. Any cluster
that contains both iron dimer and pyrene will fragment to produce Fe2+ due to its lower IP.
Therefore, the pyrene ion must come from clusters that have separated iron atoms, while Fe2+
must come from clusters containing molecular iron. For the Fe2(Pyr)+ parent cluster, the isomer
containing separated iron atoms may have them either occupying separate binding sites on the
same side of the pyrene molecule, or have them on opposite sides of the pyrene molecule
forming a type of “inverse sandwich” of iron-pyrene-iron, shown below.
Either way, these clusters can eliminate neutral iron atoms, which have a higher IP than that of
pyrene, leaving the pyrene ion as a fragment, which is observed in the spectrum. With regard to
the isomer of Fe2(Pyr)+ containing molecular iron, shown below, the pyrene molecule is
eliminated as a neutral, leaving the lower IP iron dimer cation, which is observed in the
spectrum.

48
Regarding the Fe2(Pyr)2+ parent cluster, the isomer containing separated iron may either be a
sandwich structure with the separated iron atoms between the two pyrene molecules, or it may be
a stacked motif of iron-pyrene-iron-pyrene, shown below.
The stacked motif seems more likely as fragmentation of this cluster would proceed by splitting
into two Fe(Pyr) fragments, one carrying the charge and the other being lost as a neutral
fragment. The other isomer for the Fe2(Pyr)2+ cluster is more than likely a sandwich structure
with the two iron atoms bound together and “sandwiched” on the outside by the two pyrene
molecules, shown below.
This isomer fragments by first eliminating a neutral pyrene molecule, and then the second pyrene
molecule must be eliminated immediately because there is no Fe2(Pyr)+ fragment in the
spectrum. Having two isomers exist for each of the Fe2(Pyr)+ and Fe2(Pyr)2+ clusters provides
one way to explain the appearance of both the Fe2+ and Pyr+ fragments in these spectra, which is
difficult to achieve unless separate isomers exist.
Additionally, the appearance of both the Fe2+ fragment and the Fe(Pyr)+ fragment
suggests that these species have similar bond energies. Armentrout and co-workers calculated
the bond energy of iron dimer as 62.7 kcal/mol.42 In competitive binding studies on iron with
benzene, coronene, and C60, our group determined that the bond energy of iron-coronene is
greater than that of iron-benzene, which is 49 kcal/mol.20 Therefore, one could estimate that the
bond energy of iron with pyrene would also be greater than 49 kcal/mol, although we do not

49
know how much greater. If Fe2+ and Fe(Pyr)+ do have similar bond energies, then the Fe(Pyr)+
bond energy may be close to the 62.7 kcal/mol bond energy determined by Armentrout for the
iron dimer.
The lower frame of Figure 4.3 shows the photodissociation spectrum for Fe3(Pyr)+.
Again, the most prominent fragment is that of the pyrene cation, but there is also a small peak
corresponding to Fe(Pyr)+. This photodissociation spectrum raises an interesting question of
whether the iron is lost as molecular iron or atomic iron. The iron atom has a higher IP (7.87
eV)40 than the pyrene molecule (7.43 eV),40 while Fe2+ (6.30 eV)43 and Fe3
+ (6.4 eV)43 have
lower IPs than pyrene. Therefore, if iron molecules are ejected from the clusters, these
molecular iron species should be charged and the corresponding pyrene should be neutral.
However, this is not the case. Therefore, we must conclude that the iron is lost as atomic iron
fragments. This same result of eliminating iron atoms was seen in the iron-coronene system
studied by our group.25 However, these results are in contrast to the chromium-coronene system
we studied which eliminated molecular metal.28
The photodissociation of the iron-perylene system begins with Figure 4.4. The top frame
of Figure 4.4 shows the photodissociation spectrum of the Fe(Per)+ cluster. The most prominent
fragment seen is that of the perylene cation. The IP of perylene is 6.96 eV40, which is lower than
that of iron at 7.870 eV.40 Therefore, we would expect to see the loss of iron as a neutral atom
while the perylene molecule takes the charge and is seen as a fragment. Indeed, this is what is
seen here. Also present in this spectrum is a small peak corresponding to Fe(C12H8)+ and a peak
representing a loss of five or six hydrogen atoms from the parent cluster. This is the only
spectrum which shows any breakdown in the perylene ring structure.

50
The photodissociation spectrum for the Fe2(Per)+ cluster is shown in the middle frame of
Figure 4.4. This cluster’s main fragment peak is again the perylene cation. Also, there is a very
weak signal for Fe(Per)+. To produce the most prominent peak of the perylene cation, the cluster
must lose two iron atoms. With the Fe(Per)+ peak being so small, it makes sense to wonder, as
above for the Fe3(Pyr)+ cluster, if the iron atoms are lost as molecular iron or atomic iron. As
above, the reasoning is the same here as to why atomic iron is lost from this cluster. The iron
atom has a higher IP (7.87 eV)40 than the perylene molecule (6.96 eV),40 while Fe2+ has a lower
IP (6.30 eV)43 than perylene. Therefore, if iron dimer molecules are ejected from the perylene
clusters, these molecular iron species should be charged and the corresponding perylene should
be neutral. This is not the case. As a result, we must conclude that the iron is lost as atoms.
This deduction makes sense in light of seeing no Fe2+ in the mass spectrum. Additionally, with
the loss of iron atoms, it makes sense as to why there would be a small Fe(Per)+ peak. By losing
one iron atom and then another, its possible that some of the Fe(Per)+ intermediate fragment
would appear in the spectrum.
Finally, the bottom frame of Figure 4.4 shows the photodissociation of Fe(Per)2+. The
main fragment is that of the perylene cation with a weak signal corresponding to Fe(Per)+. The
Fe(Per)+ fragment is formed by cleanly eliminating a neutral perylene molecule from the cluster.
The perylene cation is more than likely produced by further fragmentation of the Fe(Per)+
fragment. Again, as with Fe(Pyr)+, the presence of Fe(Per)+ cluster as an cationic fragment
suggests that it has a lower IP than the IP of perylene. Moreover, since the perylene ligands
would be expected to experience a greater attraction for the metal ion than for each other, we
would expect that this cluster exists as a sandwich structure, as with the Fe(Pyr)2+ cluster above.

51
Conclusions
Iron clusters with pyrene and perylene were produced by laser vaporization and studied
by fixed frequency photodissociation. Mass spectral data show a prominence for the Fe(PAH)2+
cluster in each system. In the iron-pyrene system, clusters were formed with a maximum of four
iron atoms with either one or two pyrene molecules. In the photodissociation studies of this
system, the main fragment for all clusters studied was the pyrene cation. The photodissociation
data for Fe(Pyr)+ showed a small peak corresponding to C14H10+, which represents a breakdown
of the pyrene ring structure. This breakdown is probably due to further fragmentation of the
pyrene cation fragment. The photodissociation data for Fe(Pyr)2+ suggests that it may exist as a
sandwich structure. Additionally, this spectrum shows that an iron atom may be able to insert
itself into the pyrene ring system, as was shown in previous studies of iron-C602,22 and
chromium-coronene.28 The Fe2(Pyr)2+ cluster fragments more extensively than the other clusters
as well as producing a Fe2+ fragment. This spectrum also gives evidence of different isomers,
each possessing its own fragmentation channel. The appearance of the Fe2+ fragment is similar
to some of the clusters studied in our group’s chromium-coronene experiments which fragment
by loss of clustered metal.28 Fe3(Pyr)+ fragments by elimination of individual iron atoms, which
is similar to the results we saw for the iron-coronene system.25 In the iron-perylene system,
clusters are formed with one or two iron atoms and either one, two or three perylene molecules.
In the mass spectrum of this system, there were also small peaks corresponding to Per+ and
(Per)2+. The main fragment in all of the photodissociation spectra for this system was the
perylene cation. Each species fragments directly to the perylene cation with only a small amount
of the Fe(Per)+ fragment where applicable. In the photodissociation spectrum of Fe(Per)+, there
was a sizeable peak corresponding to a loss of five or six hydrogen atoms from the parent cluster

52
as well as a very small peak for Fe(C12H8)+. This is the only spectrum in this system that showed
any breakdown of the perylene ring system. Additionally, the Fe2(Per)+ cluster fragments by loss
of iron atoms, as is true for the Fe3(Pyr)+ cluster above. The overall character of these clusters
mirrors the iron-coronene system, which is to be expected. However, the one piece of data that
does not fit into that mold is found in the Fe2(Pyr)2+ photodissociation spectra. The proposed
sandwich isomer of this cluster fragments to iron dimer, which more closely resembles the
fragmentation seen in the chromium-coronene system. Future theoretical and spectroscopic
studies should focus on the bonding, structures, and energetics of these metal-PAH systems.
References
(1) Abel, E. W.; Stone, F. G. A.; Wilkinson, G. Comprehensive Organometallic Chemistry Ii,
Pergamon Press, Oxford, 1994.
(2) Branz, W.; Billas, I. M. L.; Malinowski, N.; Tast, F.; Heinebrodt, M.; Martin, T. P. J.
Chem. Phys. 1998, 109, 3425.
(3) Frank, S.; Malinowski, N.; Tast, F.; Heinebrodt, M.; Billas, I. M. L.; Martin, T. P. Z.
Phys. D: At., Mol. Clusters 1997, 40, 250.
(4) Martin, T. P.; Malinowski, N.; Zimmermann, U.; Naeher, U.; Schaber, H. J. Chem. Phys.
1993, 99, 4210.
(5) Springborg, M.; Satpathy, S.; Malinowski, N.; Zimmermann, U.; Martin, T. P. Phys. Rev.
Lett. 1996, 77, 1127.
(6) Tast, F.; Malinowski, N.; Frank, S.; Heinebrodt, M.; Billas, I. M. L.; Martin, T. P. Phys.
Rev. Lett. 1996, 77, 3529.

53
(7) Tast, F.; Malinowski, N.; Frank, S.; Heinebrodt, M.; Billas, I. M. L.; Martin, T. P. Z.
Phys. D: At., Mol. Clusters 1997, 40, 351.
(8) Zimmermann, U.; Malinowski, N.; Naeher, U.; Frank, S.; Martin, T. P. Phys. Rev. Lett.
1994, 72, 3542.
(9) Kurikawa, T.; Takeda, H.; Hirano, M.; Judai, K.; Arita, T.; Nagao, S.; Nakajima, A.;
Kaya, K. Organometallics 1999, 18, 1430.
(10) Nakajima, A.; Kaya, K. J. Phys. Chem. A 2000, 104, 176.
(11) Kurikawa, T.; Nagao, S.; Miyajima, K.; Nakajima, A.; Kaya, K. J. Phys. Chem. A 1998,
102, 1743.
(12) Nagao, S.; Kurikawa, T.; Miyajima, K.; Nakajima, A.; Kaya, K. J. Phys. Chem. A 1998,
102, 4495.
(13) Nakajima, A.; Nagao, S.; Takeda, H.; Kurikawa, T.; Kaya, K. J. Chem. Phys. 1997, 107,
6491.
(14) Nagao, S.; Kato, A.; Nakajima, A.; Kaya, K. J. Am. Chem. Soc. 2000, 122, 4221.
(15) Nagao, S.; Negishi, Y.; Kato, A.; Nakamura, Y.; Nakajima, A.; Kaya, K. J. Phys. Chem.
A 1999, 103, 8909.
(16) Kurikawa, T.; Negishi, Y.; Hayakawa, F.; Nagao, S.; Miyajima, K.; Nakajima, A.; Kaya,
K. J. Am. Chem. Soc. 1998, 120, 11766.
(17) Kurikawa, T.; Negishi, Y.; Hayakawa, F.; Nagao, S.; Miyajima, K.; Nakajima, A.; Kaya,
K. Z. Phys. D: At., Mol. Clusters 1999, 9, 283.
(18) Pillai, E. D.; Molek, K. S.; Duncan, M. A. Chem. Phys. Lett. 2005, 405, 247.
(19) Willey, K. F.; Yeh, C. S.; Robbins, D. L.; Duncan, M. A. J. Phys. Chem. 1992, 96, 9106.

54
(20) Buchanan, J. W.; Grieves, G. A.; Reddic, J. E.; Duncan, M. A. Int. J. Mass Spectrom.
1999, 182/183, 323.
(21) Reddic, J. E.; Robinson, J. C.; Duncan, M. A. Chem. Phys. Lett. 1997, 279, 203.
(22) Grieves, G. A.; Buchanan, J. W.; Reddic, J. E.; Duncan, M. A. Int. J. Mass Spectrom.
2001, 204, 223.
(23) Jaeger, T. D.; Duncan, M. A. J. Phys. Chem. A 2004, 108, 11296.
(24) Buchanan, J. W.; Grieves, G. A.; Flynn, N. D.; Duncan, M. A. Int. J. Mass Spectrom.
1999, 185-187, 617.
(25) Buchanan, J. W.; Reddic, J. E.; Grieves, G. A.; Duncan, M. A. J. Phys. Chem. A 1998,
102, 6390.
(26) Duncan, M. A.; Knight, A. M.; Negishi, Y.; Nagao, S.; Nakamura, Y.; Kato, A.;
Nakajima, A.; Kaya, K. Chem. Phys. Lett. 1999, 309, 49.
(27) Foster, N. R.; Buchanan, J. W.; Flynn, N. D.; Duncan, M. A. Chem. Phys. Lett. 2001,
341, 476.
(28) Foster, N. R.; Grieves, G. A.; Buchanan, J. W.; Flynn, N. D.; Duncan, M. A. J. Phys.
Chem. A 2000, 104, 11055.
(29) Duncan, M. A.; Knight, A. M.; Negishi, Y.; Nagao, S.; Judai, K.; Nakajima, A.; Kaya, K.
J. Phys. Chem. A 2001, 105, 10093.
(30) Pozniak, B. P.; Dunbar, R. C. J. Am. Chem. Soc. 1997, 119, 10439.
(31) Marty, P.; de Parseval, P.; Klotz, A.; Chaudret, b.; Serra, G.; Boissel, P. Chem. Phys.
Lett. 1996, 256, 669.
(32) Szczepanski, J.; Wang, H.; Martin, V.; Tielens, A. G. G. M.; Eyler, J. R.; Oomens, J.
Astrophys. J. 2006, 646, 666.

55
(33) Klotz, A.; Marty, P.; Boissel, P.; Serra, G.; Chaudret, B.; Daudey, J. P. Astron. Astrophys.
1995, 304, 520.
(34) Bohme, D. K. Chem. Rev. 1992, 92, 1487.
(35) Henning, T.; Salama, F. Science 1998, 282, 2204.
(36) Dunbar, R. C. J. Phys. Chem. A 2002, 106, 9809.
(37) Klippenstein, S. J.; Yang, C.-N. Int. J. Mass Spectrom. 2000, 201, 253.
(38) Senapati, L.; Nayak, S. K.; Rao, B. K.; Jena, P. J. Chem. Phys. 2003, 118, 8671.
(39) Yeh, C. S.; Pilgrim, J. S.; Willey, K. F.; Robbins, D. L.; Duncan, M. A. Int. Rev. Phys.
Chem. 1994, 13, 231.
(40) Lias, S. G., in Linstrom, P. J. and Mallard, W. G. (Eds.), Nist Chemistry Webbook, Nist
Standard Reference Database Number 69, National Institute of Standards and
Technology, Gaithersburg MD, 20899, June 2005.
(41) Clemmer, D. E.; Hunter, J. M.; Shelimov, K. B.; Jarrold, M. F. Nature 1994, 372, 248.
(42) Loh, S. K.; Hales, D. A.; Li, L.; Armentrout, P. B. J. Chem. Phys. 1989, 90, 5466.
(43) Rohlfing, E. A.; Cox, D. M.; Kaldor, A.; Johnson, K. H. J. Chem. Phys. 1984, 81, 3846.

56
0 200 400 600 800 1000
)yFex(
m/z
Fe+
(1,1)
(2,1)
(1,2)
(2,2)(3,2)
(4,2)
(3,1)(4,1)
Fe+ Per+
(1,1) (1,2)
(1,3)(2,2)
(2,1)
(Per)2+
Fex( )y
Figure 4.1. The top frame shows the mass spectrum for the iron-pyrene system. The solid line at
the top of this mass spectrum indicates that it has been cropped to highlight the clusters of
interest. The bottom frame shows the mass spectrum for the iron-perylene system. In each
spectra, the peaks labeled (x,y) indicate the Fex(PAH)y stoichiometries for the clusters.

57
0 100 200 300 400 500 600
m/z
(1,1)
Pyr+
(1,2)
(1,1)Pyr+
FeC15H9+
C14H10+
Figure 4.2. The top frame shows the photodissociation spectrum of Fe(Pyr)+ at 355 nm. The
bottom frame shows the photodissociation spectrum of Fe(Pyr)2+ at 355 nm.
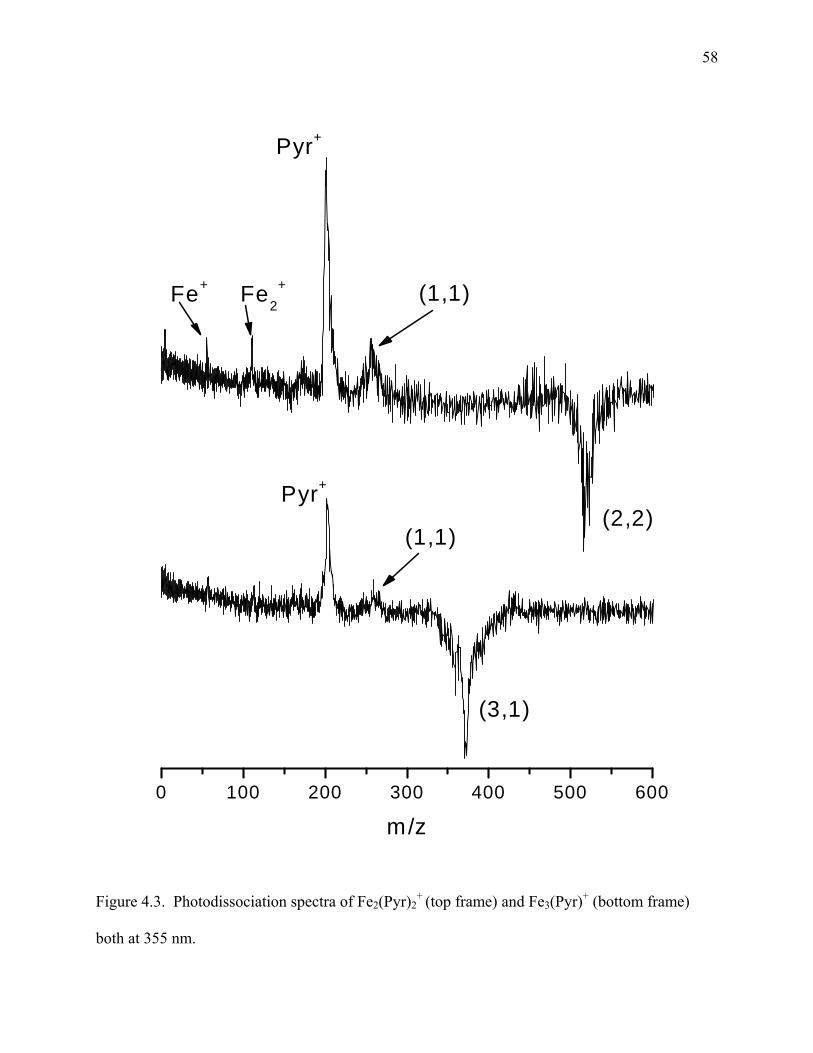
58
0 100 200 300 400 500 600
(1,1)
m/z
(2,2)
(3,1)
Pyr+
Pyr+
(1,1)Fe+ Fe2+
Figure 4.3. Photodissociation spectra of Fe2(Pyr)2+ (top frame) and Fe3(Pyr)+ (bottom frame)
both at 355 nm.

59
0 100 200 300 400 500 600 700
m/z
Per+
(2,1)
(1,2)
Per+
Per+
(1,1)
Loss of H5 or H6FeC12H8
+
(1,1)
Figure 4.4. These are the photodissociation spectra of Fe(Per)+ (top frame), Fe2(Per)+ (middle
frame), and Fe(Per)2+ (bottom frame) all at 355 nm.

60
CHAPTER 5
CALCIUM—CORONENE AND CALCIUM—PYRENE CLUSTERS
Introduction
Interesting organometallic sandwich clusters have been the focus of much
experimentation in recent years.1 While the study of these clusters through the use of
conventional wet chemistry may be difficult, the advent of new gas-phase techniques has made
the study of these clusters possible. These organometallic systems have demonstrated
fascinating spectroscopy and photochemistry when studied in the gas-phase. In their
experiments on transition metals complexed with C60, Martin and co-workers were able to
produce metal-coated C60.2-8 Interesting multi-decker sandwiches of transition metals and
benzene,9,10 C60,11-13 and ferrocene14 have been reported by Kaya and co-workers. They have
also studied lanthanide metals with C6015 and cyclooctatetraene.16,17 Additionally, our research
group has produced numerous metal clusters with benzene,18-20 C60,20-22 and
cyclooctatetraene.23,24 Furthermore, metal-polycyclic aromatic hydrocarbon (“PAH”) clusters
have been produced by Dunbar and co-workers,25 Marty and co-workers,26 and by our research
group as well.20,27-32 In the present study, we discuss the production and photodissociation of
gas-phase calcium-coronene and calcium-pyrene cation clusters.
Metal-PAH clusters are fascinating for a variety of reasons. Theorists often use PAHs to
represent a finite section of graphite in order to study surface physisorption energetics and
dynamics. Moreover, these systems can be used to model metal attachment in metal intercalated
graphite as well as to the walls of carbon nanotubes. Additionally, complexes comprised of

61
metals and PAHs are thought to form interstellar gas clouds and contribute to the depletion of
metal in them.33 PAHs have been implicated as carriers of the unidentified infrared bands
(“UIBs”) or diffuse interstellar bands (“DIBs”), which are observed in all parts of the galaxy.34,35
Moreover, they are an ample component of the instellar medium as they are estimated to account
for 5-15% of the cosmic carbon. However, recent studies have shown that the spectra of PAHs
alone do not match the astrophysical spectra. As a result, it is thought that these UIBs and DIBs
may be explained as being various PAH complexes, especially those with metal.
Metal ion clusters with selected PAHs have been described previously. The first to make
metal-PAH systems in the gas-phase was Dunbar and co-workers using FT-ICR mass
spectrometry to probe the association kinetics of various metal ions with coronene.25 Marty and
co-workers explored the possible astrophysical implications of iron-naphthalene cations with
Fourier transform mass spectroscopy.26 Theorists have performed calculations to determine the
binding energies of various metals to different PAHs as well as the preferential binding sites of
the metal on the PAH molecules.36-38 Our research group has produced and studied a variety of
metal-PAH systems with time-of-flight mass spectrometry and mass-selected laser
photodissociation such as chromium-coronene,32 iron-coronene,28 silver-coronene,27 and niobium
with coronene and pyrene.31 Within each of these previous systems, varying results have been
discovered. In the iron-coronene system, the photodissociation of the clusters that are comprised
of multiple metal atoms eliminate individual metal atoms as opposed to molecular metal.28 In
contrast, the multiple metal clusters in the chromium-coronene system photodissociate by
elimination of molecular metal clusters.32 Differing still are the photodissociation results in the
niobium-PAH system, where the niobium inserts itself into the ring structure of the PAH
producing various metal carbide and metal-(C2H2)n adducts.31 In the present study of calcium

62
with coronene and pyrene, we want to probe how calcium binds with these PAH molecules as
well as examine possible structure motifs.
Experimental
Production of the clusters for these experiments occurs by laser vaporization in a pulsed
nozzle cluster source. The experimental apparatus has been described previously.39 For the
present experiments, calcium rods coated with a thin film of either coronene or pyrene are used
as samples. Coronene and pyrene must be sublimed onto the calcium rod since they are solids at
room temperature. PAH films are deposited in a small vacuum chamber dedicated for sample
preparation, which has been described previously.28
Once the sample is prepared, it is transferred to the molecular beam machine where laser
vaporization of the film coated metal sample occurs by using the third harmonic (355 nm) of a
pulsed Nd:YAG laser. The conditions used here are similar to those described for other metal—
coronene complex formation where signals are sensitive to both film thickness and the
vaporization laser power.28 Under optimized conditions, the metal and the PAH are produced in
the gas phase as the vaporization laser desorbs the organic and penetrates to ablate the
underlying metal. Cluster growth takes place through recombination in the gas channel, which
extends beyond the vaporization point. After the cation clusters are produced in the source
chamber, they pass through a skimmer into the second experimental chamber. In this second
chamber, the clusters are extracted from the molecular beam into the mass spectrometer with
pulsed acceleration voltages.
Mass-selected photodissociation experiments take place in the same reflectron time-of-
flight mass spectrometer, with the addition of a pulsed deflection plate (hereinafter “mass-gate”).

63
The mass-gate allows size selection of the particular cluster of interest. The operation of the
instrument for these experiments has been described previously.39 The time-of-flight through the
first drift tube section is used to size select the desired cluster. After selection, this cluster is then
excited with a pulsed laser (Nd:YAG; 355 nm) in the turning region of the reflectron field. The
time-of-flight through the second drift tube section provides a mass spectrum of the selected
parent ion and its photofragments, if any. After photodissociation, the data are presented in a
computer difference mode in which the dissociated fraction of the parent ion is plotted as a
negative mass peak while its photofragments are plotted as positive peaks. Mass spectra are
recorded with a digital oscilloscope (LeCroy) and transferred to a laboratory PC via an IEEE-488
interface.
Results and Discussion
Figure 5.1 shows the mass spectra measured when cation clusters of calcium-coronene
and calcium-pyrene are created by laser vaporization of either a coronene or pyrene coated
calcium rod. Both of the spectra are offset in order to show only the higher mass region of
interest. In the calcium-coronene mass spectrum (top frame), a variety of Cax(coronene)y+
clusters are observed. Clusters are formed that contain up to four calcium atoms with one
coronene molecule, up to four calcium atoms with two coronene molecules, and up to three
calcium atoms with three coronene molecules. The less intense peaks between the cluster
masses can be assigned to metal oxide, which are produced from surface impurities on the metal
rod. In the clusters that have one coronene molecule, the Ca2(Cor)+ cluster is slightly more
intense than the Ca(Cor)+ cluster. The intensity of the clusters containing three and four metal
atoms with one coronene molecule gradually fall off with size. Similarly, in the clusters

64
containing two coronene molecules, the Ca(Cor)2+ cluster is the most prominent with the multi-
metal clusters gradually decreasing in intensity with increased mass. Finally, the clusters
containing three coronene molecules are small with Ca(Cor)3+ being the most intense. In the
lower mass region (not shown), there are essentially no pure metal clusters, which suggests that
the clusters grow primarily as metal atoms are added individually to the coronene surface, as
opposed to a cluster of metal atoms adding to coronene.
In the calcium-pyrene system, shown in the bottom frame of Figure 5.1, we see a
different situation. We again see up to three ligand molecules in a cluster, but only a maximum
of two calcium atoms in any cluster. Additionally, there is an intense peak for (Pyr)+ and a less
intense peak for (Pyr)2+. There was no bare PAH peak in the coronene spectrum. The most
intense peak in this spectrum is Ca(Pyr)+, with Ca2(Pyr)+ dropping off sharply. Two atoms must
be the maximum that can be added to one pyrene molecule. This is in contrast with data taken in
our lab for iron-pyrene systems where up to four iron atoms are seen in clusters with one pyrene
molecule.40 Apparently, calcium atoms and/or clusters do not bind as strongly as iron atoms do
to pyrene. As with the coronene system above, the lower mass region (not shown) has no pure
metal clusters. This suggests, as previously stated, that the clusters grow primarily as metal
atoms are individually added to the pyrene molecule. It should be noted that this disparity
between the two mass spectra could be caused by a concentration effect in the experiment. It is
not always possible to control the concentration of metal in these experiments. If there were a
large concentration of metal atoms, a result like the one for the calcium-coronene system may be
produced. On the other hand, if there was a low concentration of metal atoms in the experiment,
a result like this one for calcium-pyrene may be observed. These mass spectra were taken

65
several times without differing results. However, it is not clear as to why the results are as they
are. Nonetheless, these results are still interesting.
These mass spectra immediately raise questions about the structures of these clusters. In
the coronene system, the interesting question lies in how the metal is attached to the coronene
molecule. It is possible for the metal to be clustered together in the form of an “island” on the
surface of the coronene. However, it is also possible for the metal to attach individually at
separate binding sites on the coronene molecule. Binding at π sites is common in organometallic
chemistry with the metal in intercalated graphite occupying ring-centered sites.41 Additionally, it
is also possible for the metal to be attached to one or both sides of the coronene surface. In the
pyrene system, it is interesting that the pyrene molecules seem to cluster together themselves, as
well as only accepting a maximum of two calcium atoms. In order to probe these systems, we
perform mass-selected photodissociation experiments.
Figures 5.2-5.4 show the photodissociation spectra for the calcium-coronene and
calcium-pyrene systems. In the photodissociation studies of these systems, the parent ion is
shown as a negative peak indicating depletion due to fragmentation, while the fragments appear
positive. Additionally, as the energetics of these metal-PAH systems are largely unknown, we
varied the laser intensity to investigate the power dependence of the photodissociation processes.
In all cases, high power was required to cause dissociation and we conclude that these processes
are multiphoton. It is expected for these processes to be multiphoton because coronene is a large
molecule, allowing for efficient internal conversion of energy to the ground electronic state. To
dissociate this molecule or a metal attached to it, an amount of energy well above threshold is
required. Therefore, these fragmentation processes are multiphoton and sequential fragmentation
of primary photofragments as well as reionization of neutral photofragments often occurs.

66
The top frame of Figure 5.2 shows the photodissociation of the Ca(Pyr)+ cation. In this
spectrum, the most prominent fragment peak corresponds to Ca+ with a very small peak
corresponding to Pyr+. We know from previous studies in our lab that when a parent cluster
photodissociates, the fragment with the lower ionization potential (“IP”) is observed as an ion,
while the fragment with the higher IP is usually lost as a neutral and is not detected. In this
system, the IP of pyrene is 7.43 eV42 and that of calcium is 6.11 eV.42 Therefore, in this
instance, one would expect to see simple cleavage of the metal-ligand bond resulting in the
calcium fragment being detected as a cation. Indeed, this is exactly what is produced. However,
we do also see a very small amount of pyrene cation in the spectrum. More than likely, this
fragment appears due to it becoming reionized. As pyrene is produced in the photodissociation
region as a neutral photofragment, it may absorb light in the intense laser field and become
ionized through multiphoton absorption. As mentioned above, due to the high laser powers
needed to photodissociate some of the clusters in these systems, this is a common problem.
The bottom frame of Figure 5.2 shows the photodissociation of the Ca(Pyr)2+ cluster. In
this spectrum, the highest-mass cluster observed is Ca(Pyr)+. Additionally, fragments of Pyr+,
C5H5+, and Ca+ are also observed. The Ca+ fragment produces by far the most intense peak
while the fragment peaks for Ca(Pyr)+, Pyr+, and C5H5+ are very weak comparatively. The
Ca(Pyr)+ peak is due to elimination of a neutral pyrene molecule from the parent cluster. Due to
the appearance of the Ca(Pyr)+ cluster as an ionic fragment, it almost certainly has an IP that is
lower than that of pyrene. One of the surprising features in this photodissociation spectrum is
again the presence of the pyrene cation. However, as explained above, the pyrene cation is more
than likely produced by becoming reionized through multiphoton absorption. The other

67
surprising feature is the appearance of the C5H5+ fragment, which must occur from destruction of
the pyrene ring system.
The photodissociation spectrum of Ca2(Pyr)+ is shown in the top frame of Figure 5.3.
The solid line at the top of the Ca+ peak indicates that this spectrum has been cropped in order to
show the peaks of interest more clearly. The highest mass peak in this spectrum is again the
Ca(Pyr)+ fragment. The fragment results this time from elimination of a calcium atom as a
neutral species instead of a pyrene molecule. Therefore, not only must Ca(Pyr)+ have an IP
lower than that of pyrene, it must also have one lower than that of calcium. Also in this
spectrum are peaks corresponding to Ca2+ and CaC5
+. The presence of the Ca2+ fragment and
the Ca(Pyr)+ fragment together in this spectrum gives evidence that these species must occur
from parallel fragmentation channels of the parent cluster because they cannot exist from
sequential fragmentation. Therefore, if Ca2+ and Ca(Pyr)+ occur from the parent cluster
fragmenting in two separate ways, these species may have similar IPs. Additionally, there may
be a possible isomer of the parent cluster which gives rise to this fragmentation pattern as
opposed to parallel fragmentation channels. If two isomers of the parent cluster were to exist,
one must have molecular metal on the surface of the pyrene molecule, and the other must have
separated metal atoms, which can either be on the same side or opposite sides of the pyrene
molecule. The CaC5+ fragment is very weak but quite interesting. In studies done on niobium
with pyrene and coronene, carbide formation was seen to be one of the main fragmentation
pathways.31 With the present study, it seems to take two calcium atoms to cause ring
fragmentation of the pyrene structure as no carbides were seen in the photodissociation spectra of
the single-metal pyrene clusters.

68
The bottom frame of Figure 5.3 shows the photodissociation spectrum of Ca2(Pyr)2+.
This is the largest cluster with pyrene that was photodissociated. The most intense fragment is
once again the calcium cation. However, there are many weaker fragments also observed. The
highest mass fragment is Ca2(Pyr)+, which results from the loss of a neutral pyrene molecule,
although there is a very, small amount of this fragment. After this small peak, we again see the
Ca(Pyr)+ fragment and the Ca2+ fragment. Again, as above, the presence of the Ca2
+ fragment
and the Ca(Pyr)+ fragment gives evidence that these species must occur from parallel
fragmentation channels of the parent cluster and possibly have similar IPs. Moreover, there may
also be a possible isomer of the parent cluster, like there may be in the Ca2(Pyr)+ spectrum,
which gives rise to this fragmentation pattern as opposed to parallel fragmentation channels. If
isomers exist for this cluster, one must have molecular metal while the other has separated,
individually attached metal atoms. Additionally, as with the above spectrum, we again see the
formation of a carbide fragment, CaC4+. This fragment contains one less carbon than the one
above and is a little more intense. In the niobium-PAH system studied by our group, the NbC4+
fragment was one of the most intense carbides observed.31 Another feature of this spectrum is
again the presence of pyrene cation. As discussed earlier, this peak is probably due to
reionization of the neutral pyrene molecules. One last characteristic is the presence of the C5H5+
fragment, which was also seen above in the photodissociation spectrum of Ca(Pyr)2+. As above,
this fragment is produced through the fragmentation of a pyrene molecule and is not completely
unexpected as similar peaks are seen in the mass spectrum of pyrene. It should be noted that this
fragment only appears in the spectra where the parent cluster contains two pyrene molecules.
Some sort of rearrangement may be taking place to yield this fragment which requires the
presence of both pyrene molecules.

69
In the calcium-coronene system, many photodissociation spectra were taken, but only the
two most interesting, Ca2(Cor)+ and Ca3(Cor)+, are shown in Figure 5.4. Table 5.1 shows the
other calcium-coronene clusters that were photodissociated in this study. The only
photofragment observed in their spectra was Ca+, which would be expected due to it having a
lower IP (6.113 eV)42 than coronene (7.29 eV).42 Due to the simplicity of the fragmentation for
these clusters, there is not much information we can gather about their structure. However, we
can make some conclusions about how the calcium is added to the coronene molecule. As
mentioned above, Ca+ has a lower IP than does coronene and is therefore expected to be
observed as a charged photofragment, which it is. The IP of Ca2+ has not been measured, but
theory calculates it to be very close to 5 eV.43 Since this IP is even lower than that of Ca+, if the
calcium atoms were expelled as molecular units, we would expect to see a photofragment for
Ca2+ or Ca3
+. Since we do not, the metal must be ejected as atoms and not as molecules.
Moreover, even though we do not know the IP of Ca3+, the metal could not have been eliminated
in the form of Ca3+ because we see a peak corresponding to Ca+.
The photodissociation spectrum of Ca2(Cor)+ is shown in the top frame of Figure 5.4.
The line at the top of the Ca+ fragment indicates that this spectrum has been cropped in order to
show the peaks of interest more clearly. The most prominent fragment is Ca+, as expected.
There is also a peak corresponding to Ca(Cor)+ which results from the loss of a neutral calcium
atom from the parent cluster. Normally, the presence of Ca(Cor)+ would indicate that it has a
lower IP than the calcium atom. However, that is not the case here. In order for Ca(Cor)+ to
have a lower IP than calcium, it would have to be present in the other spectra listed in Table 5.1.
Since Ca(Cor)+ is not observed in those spectra, it must be present here because it was lost as a
neutral cluster and then ionized through absorption of laser light. Also in this spectrum, there is

70
a very small peak corresponding to Ca2+. Having both Ca(Cor)+ and Ca2
+ as fragments in the
spectrum indicates that parallel fragmentation channels exist. Additionally, unlike the clusters
where the only fragment was Ca+, in at least a few of the clusters here, the calcium atoms must
be bound to each other, which means they must be on the same side of the coronene. None of
the clusters that show elimination to only Ca+ are composed of multiple metal without also
possessing multiple ligands. This could mean that, in those clusters, the metal atoms are bound
individually to different sites on the coronene molecules.
The bottom frame of Figure 5.4 shows the photodissociation spectrum of Ca3(Cor)+.
There are many photofragments occurring from this parent cluster. The most prominent
fragment is again Ca+. We also see the presence of Ca(Cor)+ and Ca2+ as in the Ca2(Cor)+
spectrum. These fragments are present here for the same reasons as discussed above.
Additionally, this spectrum possesses a fair number of peaks corresponding to various calcium
carbides. The largest of the carbide peaks corresponds to CaC5+ with less intense peaks
corresponding to CaC6+ and Ca2C5
+. The CaC5+ could result from further fragmentation of the
Ca2C5+ fragment. There are three small, interesting peaks in the middle of this spectrum that
correspond to CaxC11+ where x = 1-3, with Ca3C11
+ being the largest peak. This extensive
fragmentation is only seen in this spectrum, which must mean that three calcium atoms begin to
disrupt the coronene ring structure. However, this disruption only occurs when one coronene
molecule is present. In the Ca3(Cor)2+ cluster photodissociation, the only fragment present was
Ca+. One possible explanation for this disparity is metals being bound individually on separate
sites on the coronene molecules. With two coronene molecules present, the three calcium atoms
can each individually occupy a binding site on the molecules or even each have its own side of a
coronene molecule by alternating calcium-coronene-calcium-coronene-calcium. With only one

71
coronene molecule present, if two of the calcium atoms occupy opposite sides of the molecule,
the third calcium atom must pair with one of them. It could be this multi-metal addition on one
side of the coronene molecule that causes such extensive fragmentation of it. Additionally,
interestingly enough, this stacking motif for the Ca3(Cor)2+ cluster could produce a multiple
decker sandwich structure, although we have no definite data for this arrangement.
Conclusions
Calcium clusters with pyrene and coronene were produced by laser vaporization and
studied by fixed frequency photodissociation. The mass spectrum for calcium-coronene showed
the production of clusters containing up to four calcium atoms and up to three coronene
molecules. The most prominent peak was Ca2(Cor)+. There were no peaks in this spectrum for
coronene or for any pure calcium clusters. The calcium-pyrene mass spectrum showed a
maximum of two calcium atoms bound to a maximum of two coronene molecules. This mass
spectrum differed greatly from the calcium-coronene mass spectrum in that the clusters formed
were not as large and there were peaks corresponding to the PAH alone. The photodissociation
spectra for these clusters showed Ca+ to be the most prominent fragment peak in all spectra. In
the calcium-pyrene system, there was evidence for sandwich structures, especially in the
Ca2(Pyr)2+ spectrum. Most of the photodissociation occurred by sequential loss of either a
calcium atom or a pyrene molecule. However, in the spectra where the parent cluster contained
two calcium atoms, there was some evidence of carbide formation, similar to the niobium-PAH
systems.31 Additionally, in the spectra where the parent cluster contained two pyrene molecules,
there was evidence of the formation of a very small amount of C5H5+. In the calcium-coronene
system, the only spectra that showed any type of fragmentation other than Ca+ were the

72
Ca2(Cor)+ and the Ca3(Cor)+ spectra. The Ca2(Cor)+ spectrum showed some fragmentation
through parallel fragmentation channels to Ca2+ and Ca(Cor)+. The Ca3(Cor)+ showed the same
fragments as above, but it also showed the formation of various calcium carbides. It is
speculated that this extensive fragmentation occurs because there are multiple metal atoms on
one side of the coronene molecule which causes the coronene system to break down. It was
shown in the chromium-coronene system that the binding of an initial chromium atom to
coronene predisposed the complex to adsorption of additional metal atoms on this same side of
the organic.32 The evidence here seems to point to the contrary for the calcium-coronene system.
Overall, these systems could possibly exist as sandwich structures. The evidence in the pyrene
system points to this with some other fragmentation also occurring. In the calcium-coronene
system, it is interesting to speculate about how the calcium bind to the coronene. It makes sense
that if the calcium atoms are bound to different sides of the coronene molecules, that these
clusters would exist as sandwich structures. Future theoretical and spectroscopic studies should
focus on the bonding, structures, and energetics of these systems, which are largely unknown.
References
(1) Abel, E. W.; Stone, F. G. A.; Wilkinson, G. Comprehensive Organometallic Chemistry Ii,
Pergamon Press, Oxford, 1994.
(2) Branz, W.; Billas, I. M. L.; Malinowski, N.; Tast, F.; Heinebrodt, M.; Martin, T. P. J.
Chem. Phys. 1998, 109, 3425.
(3) Frank, S.; Malinowski, N.; Tast, F.; Heinebrodt, M.; Billas, I. M. L.; Martin, T. P. Z.
Phys. D: At., Mol. Clusters 1997, 40, 250.

73
(4) Martin, T. P.; Malinowski, N.; Zimmermann, U.; Naeher, U.; Schaber, H. J. Chem. Phys.
1993, 99, 4210.
(5) Springborg, M.; Satpathy, S.; Malinowski, N.; Zimmermann, U.; Martin, T. P. Phys. Rev.
Lett. 1996, 77, 1127.
(6) Tast, F.; Malinowski, N.; Frank, S.; Heinebrodt, M.; Billas, I. M. L.; Martin, T. P. Phys.
Rev. Lett. 1996, 77, 3529.
(7) Tast, F.; Malinowski, N.; Frank, S.; Heinebrodt, M.; Billas, I. M. L.; Martin, T. P. Z.
Phys. D: At., Mol. Clusters 1997, 40, 351.
(8) Zimmermann, U.; Malinowski, N.; Naeher, U.; Frank, S.; Martin, T. P. Phys. Rev. Lett.
1994, 72, 3542.
(9) Kurikawa, T.; Takeda, H.; Hirano, M.; Judai, K.; Arita, T.; Nagao, S.; Nakajima, A.;
Kaya, K. Organometallics 1999, 18, 1430.
(10) Nakajima, A.; Kaya, K. J. Phys. Chem. A 2000, 104, 176.
(11) Kurikawa, T.; Nagao, S.; Miyajima, K.; Nakajima, A.; Kaya, K. J. Phys. Chem. A 1998,
102, 1743.
(12) Nagao, S.; Kurikawa, T.; Miyajima, K.; Nakajima, A.; Kaya, K. J. Phys. Chem. A 1998,
102, 4495.
(13) Nakajima, A.; Nagao, S.; Takeda, H.; Kurikawa, T.; Kaya, K. J. Chem. Phys. 1997, 107,
6491.
(14) Nagao, S.; Kato, A.; Nakajima, A.; Kaya, K. J. Am. Chem. Soc. 2000, 122, 4221.
(15) Nagao, S.; Negishi, Y.; Kato, A.; Nakamura, Y.; Nakajima, A.; Kaya, K. J. Phys. Chem.
A 1999, 103, 8909.

74
(16) Kurikawa, T.; Negishi, Y.; Hayakawa, F.; Nagao, S.; Miyajima, K.; Nakajima, A.; Kaya,
K. J. Am. Chem. Soc. 1998, 120, 11766.
(17) Kurikawa, T.; Negishi, Y.; Hayakawa, F.; Nagao, S.; Miyajima, K.; Nakajima, A.; Kaya,
K. Z. Phys. D: At., Mol. Clusters 1999, 9, 283.
(18) Pillai, E. D.; Molek, K. S.; Duncan, M. A. Chem. Phys. Lett. 2005, 405, 247.
(19) Willey, K. F.; Yeh, C. S.; Robbins, D. L.; Duncan, M. A. J. Phys. Chem. 1992, 96, 9106.
(20) Buchanan, J. W.; Grieves, G. A.; Reddic, J. E.; Duncan, M. A. Int. J. Mass Spectrom.
1999, 182/183, 323.
(21) Grieves, G. A.; Buchanan, J. W.; Reddic, J. E.; Duncan, M. A. Int. J. Mass Spectrom.
2001, 204, 223.
(22) Reddic, J. E.; Robinson, J. C.; Duncan, M. A. Chem. Phys. Lett. 1997, 279, 203.
(23) Jaeger, T. D.; Duncan, M. A. J. Phys. Chem. A 2004, 108, 11296.
(24) Scott, A. C.; Foster, N. R.; Grieves, G. A.; Duncan, M. A. unpublished results.
(25) Pozniak, B. P.; Dunbar, R. C. J. Am. Chem. Soc. 1997, 119, 10439.
(26) Marty, P.; de Parseval, P.; Klotz, A.; Chaudret, b.; Serra, G.; Boissel, P. Chem. Phys.
Lett. 1996, 256, 669.
(27) Buchanan, J. W.; Grieves, G. A.; Flynn, N. D.; Duncan, M. A. Int. J. Mass Spectrom.
1999, 185-187, 617.
(28) Buchanan, J. W.; Reddic, J. E.; Grieves, G. A.; Duncan, M. A. J. Phys. Chem. A 1998,
102, 6390.
(29) Duncan, M. A.; Knight, A. M.; Negishi, Y.; Nagao, S.; Judai, K.; Nakajima, A.; Kaya, K.
J. Phys. Chem. A 2001, 105, 10093.

75
(30) Duncan, M. A.; Knight, A. M.; Negishi, Y.; Nagao, S.; Nakamura, Y.; Kato, A.;
Nakajima, A.; Kaya, K. Chem. Phys. Lett. 1999, 309, 49.
(31) Foster, N. R.; Buchanan, J. W.; Flynn, N. D.; Duncan, M. A. Chem. Phys. Lett. 2001,
341, 476.
(32) Foster, N. R.; Grieves, G. A.; Buchanan, J. W.; Flynn, N. D.; Duncan, M. A. J. Phys.
Chem. A 2000, 104, 11055.
(33) Klotz, A.; Marty, P.; Boissel, P.; Serra, G.; Chaudret, B.; Daudey, J. P. Astron. Astrophys.
1995, 304, 520.
(34) Bohme, D. K. Chem. Rev. 1992, 92, 1487.
(35) Henning, T.; Salama, F. Science 1998, 282, 2204.
(36) Dunbar, R. C. J. Phys. Chem. A 2002, 106, 9809.
(37) Klippenstein, S. J.; Yang, C.-N. Int. J. Mass Spectrom. 2000, 201, 253.
(38) Senapati, L.; Nayak, S. K.; Rao, B. K.; Jena, P. J. Chem. Phys. 2003, 118, 8671.
(39) Yeh, C. S.; Pilgrim, J. S.; Willey, K. F.; Robbins, D. L.; Duncan, M. A. Int. Rev. Phys.
Chem. 1994, 13, 231.
(40) Scott, A. C.; Buchanan, J. W.; Flynn, N. D.; Duncan, M. A. unpublished results.
(41) Muller-Westerhoff, U. Inorganic Structural Chemistry, John Wiley, Chichester, 1993.
(42) Lias, S. G., in Linstrom, P. J. and Mallard, W. G. (Eds.), Nist Chemistry Webbook, Nist
Standard Reference Database Number 69, National Institute of Standards and
Technology, Gaithersburg MD, 20899, June 2005.
(43) Mirick, J. W. A Study of Molecular Processes in Calcium Clusters, Sarin, and Calcium
Carbonate Clusters 2002, George Mason University, Fairfax, Virginia.

76
Table 5.1. The parent clusters listed were photodissociated at 355 nm. Their spectra are not
shown due to the simplicity of the photodissociation. However, even though the spectra are
simple, we are still able to deduce that the calcium is added to the coronene molecule as
individual atoms, not molecular units.
Parent Cluster Fragments
Ca(Cor)+ Ca+
Ca(Cor)2+ Ca+
Ca2(Cor)2+ Ca+
Ca3(Cor)2+ Ca+

77
200 400 600 800 1000 1200
m /z
Cax
Cax
(1,1) (2,1)
(3,1)
(4,1)
(1,2)
(2,2)
(3,2)
(4,2)
(1,3)
(2,3)
(3,3)
Pyr+
(1,1)
(2,1)
Pyr2+
(1,2)
(2,2) (1,3)
( )y
( )y
Figure 5.1. Mass spectra of calcium-coronene (top frame) and calcium-pyrene (bottom frame)
clusters. The peaks labeled (x,y) indicate the Cax-PAHy stoichiometries for the clusters.

78
0 200 400 600
(1,1)Ca+
m /z
Ca+
(1,2)
Pyr+
C 5H 5+
Pyr+
Figure 5.2. The top frame shows the photodissociation spectrum of Ca(Pyr)+ at 355 nm. The
bottom frame shows the photodissociation spectrum of Ca(Pyr)2+ at 355 nm.

79
0 200 400 600
C a +
m /z
(2 ,1)
(2 ,2 )
C a +
C a 2+
(1 ,1)
C aC 5+
(1 ,1)Pyr+
C aC 4+
C a 2+
C 5H 5+
Figure 5.3. Photodissociation spectra of Ca2(Pyr)+ (top frame) and Ca2(Pyr)2+ (bottom frame)
both at 355 nm. The Ca2(Pyr)+ spectrum has been cropped in order to show the fragments of
interest.

80
0 100 200 300 400 500 600
m/z
Ca+
(2,1)
(3,1)
(1,1)
(1,1)
Ca+
CaC5+
CaC6+
Ca2C5+
Ca2+
x = 1 2 3CaxC11
+
Ca2+
Figure 5.4. Photodissociation spectra of Ca2(Cor)+ (top frame) and Ca3(Cor)+ (bottom frame)
both at 355 nm. The line at the top of the Ca2(Cor)+ spectrum indicates that the data has been
cropped in order to show the fragments of interest more clearly.

81
CHAPTER 6
CONCLUSION
These studies investigating metal ion-ligand complexes in the gas-phase through the use
of mass spectrometry and fixed frequency photodissociation have provided us the opportunity to
observe a number of interesting properties of these organometallic clusters. These properties
include the relative energetics of binding and ionization as well as new and interesting structural
motifs in small and extended organometallic systems. Additionally, the ability to mimic the
interstellar environment provides an opportunity to study clusters which may have some
significance in the effort to assign the UIRs and DIBs that currently have no known cause.
In the lanthanide metal-cyclooctatetraene (“COT”) system, the samarium-COT clusters
seemed to prefer an (n, n) type stoichiometry as opposed to the (n, n+1) stoichiometry usually
observed for sandwich structures. However, the fragmentation patterns observed for this system
still indicate at least the presence of an isomer that may exist in a sandwich form. Additonally,
in clusters with two or more samarium atoms, there was a large degree of COT fragmentation
which was not seen as readily in complexes containing only a single samarium atom. In the
systems containing dysprosium and neodymium, some degree of metal insertion into the COT
ring takes place to produce M+(C5H5), which is intriguing because if the ligand is a
cyclopentadienyl group, these metals must adopt a net non-preferred +2 oxidation state.
Additionally, photodissociation of the COT clusters with dysprosium and neodymium indicates
that ring insertion into one COT ligand may be taking place, followed by the weak attachment of
82
additional COT ligands. This observation suggests that neodymium and dysprosium bind
strongly to the COT ligand, whereas samarium is not so strongly bound.
In the iron systems with pyrene and perylene, mass spectral data show a prominence for
the Fe(PAH)2+ cluster in each system. In the iron-pyrene system, the photodissociation spectra
show the main fragment for all clusters studied was the pyrene cation. The photodissociation
data for Fe(Pyr)+ showed a small peak corresponding to C14H10+, which represents a breakdown
of the pyrene ring structure. This breakdown is probably due to further fragmentation of the
pyrene cation fragment. The photodissociation data for Fe(Pyr)2+ suggests that it may exist as a
sandwich structure. Additionally, this spectrum shows that an iron atom may be able to insert
itself into the pyrene ring system. The Fe2(Pyr)2+ cluster fragments more extensively than the
other clusters as well as producing a Fe2+ fragment. This spectrum also gives evidence of
different isomers, each possessing its own fragmentation channel. Fe3(Pyr)+ fragments by
elimination of individual iron atoms. For the iron-perylene system, the main fragment in all of
the photodissociation spectra for this system was the perylene cation. Each parent cluster
fragments directly to the perylene cation with only a small amount of the Fe(Per)+ fragment
where applicable. In the photodissociation spectrum of Fe(Per)+, there was a sizeable peak
corresponding to a loss of five or six hydrogen atoms from the parent cluster as well as a very
small peak for Fe(C12H8)+. This is the only spectrum in this system that showed any breakdown
of the perylene ring system. Additionally, the Fe2(Per)+ cluster fragments by loss of iron atoms,
as is true for the Fe3(Pyr)+ cluster above.
The photodissociation of the calcium with coronene and pyrene produced some
interesting chemistry. The main photofragment in all the spectra was the calcium atom cation.
In the pyrene system, there was evidence for sandwich structures, especially in the Ca2(Pyr)2+

83
spectrum. Most of the photodissociation occurred by sequential loss of either a calcium atom or
a pyrene molecule. However, in the spectra where the parent cluster contained two calcium
atoms, there was some evidence of carbide formation. In the calcium-coronene system, the only
spectra that showed dissociation to fragments other than the calcium ion were the Ca2(Cor)+ and
the Ca3(Cor)+ spectra. The Ca2(Cor)+ spectrum showed some fragmentation through parallel
fragmentation channels to Ca2+ and Ca(Cor)+. The Ca3(Cor)+ showed the same fragments as
above, but it also showed the formation of various calcium carbides. It is speculated that this
extensive fragmentation occurs because there are multiple metal atoms on one side of the
coronene molecule, which causes the coronene system to break down. In clusters where there
were ample sites of the coronene molecule to support each calcium atom individually, the only
fragment observed was Ca+ and no breakdown of the coronene ring system was observed.
These systems exhibit some very interesting chemistry. Although these types of systems
have been studies in depth in our laboratory, there is still much to learn. We have performed
photodissociation studies of these types of clusters because very few other experimental
techniques exist to allow insight into these clusters. A small amount of photoelectron
spectroscopy has been performed1 as well as some infrared studies.2 However, there is no
spectroscopy on these clusters nor is there any information on their energetics. Therefore, more
studies of mixed ligand complexes would provide further information on the relative binding
strengths of many metal-arene and metal-PAH systems. Additionally, further study of these
clusters by infrared spectroscopy would provide us with structural information. For example,
with further study of the lanthanide-COT complexes by infrared spectroscopy, we could observe
the distinct C-H stretch vibrations and be able to distinguish between COT that is weakly
attached to a metal versus COT that has become aromatic. Additional study of the intriguing

84
M+(C5H5) fragment produced in the lanthanide-COT study would also be very interesting. Also,
infrared spectroscopy would be able to shed valuable insight on the nature of the lanthanide-
hydrocarbon clusters to determine if the organic ligands are open structures or rings in their
attachment to the metals.
References
(1) Duncan, M. A.; Knight, A. M.; Negishi, Y.; Nagao, S.; Judai, K.; Nakajima, A.; Kaya, K.
J. Phys. Chem. A 2001, 105, 10093.
(2) Szczepanski, J.; Wang, H.; Martin, V.; Tielens, A. G. G. M.; Eyler, J. R.; Oomens, J.
Astrophys. J. 2006, 646, 666.