laser for open channel flow metering - mi-wea.org presentation.pdfnon-contact radar •very...
TRANSCRIPT

Laser for Open Channel Flow Metering
Pump Station Flow Monitoring
Presented by:
Glenn Hummel

Presentation Objective
Keep your Toolbox equipped with Flow Metering Solutions
• Introduce a New Technology for Open Channel Flow Measurement
• Review a Time Tested Approach for Pump Station Flow Monitoring

Outline
• Overview of Open Channel Flow Measurement (OCM) Technologies
• Intro Latest Technology for OCM
• Review Pump Station Flow Monitoring

Open Channel Flow Measurement (OCM)
• Empirical Formula – Manning Equation
• Primary Device – Flumes & Weirs and Eq’s
– Both used Level Sensors: Floats, Bubblers, Pressure Transducers - all Contacting Ultrasonic (Non-Contacting)
• Area Velocity
– Velocity & Depth Sensors
• Better Accuracy
• Portable, Easy to Deploy

Continuous Wave Doppler (CWD) [the economical workhorse]

Pulsed Doppler (PD) [higher accuracy, perf, & reliability at higher cost]

Contact Sensors The drawbacks of Contacting Sensor technologies are: • Reliability
– Blinding (loss of reading) – Silting (accuracy uncertainty) – Failure (damage / exposure)
• Maintenance / Cleaning – (cost)
• Small pipes (feasibility) – Sensor caused obstruction in flow – Debris, hydraulic issues

These drawbacks associated with contacting sensors have driven
technology to provide
“Non-Contacting” measurement solutions

Non-Contact vs Contact…Why? • Maintenance
– Blinding, Silting, Debris – Far fewer visits required by non-contacting solutions – Frequency & Costs (~$500 per site visit)
• Safety – Cannot get flushed down a sewer pipe if you are not in
the sewer.
• Large Pipe – Difficult Installations
• Flow Depths greater than 3 ft (tough for CWD) • Velocity over 3ft/second (equip wash-out)
• Small pipes – <24” Low level flow measurement – Shallow water depths with high velocities
• Confined Space Entry for Maintenance – Permits / Traffic Control / Manpower

Non-Contact Radar • Very Intelligent approach. Sensor above the sewage. • Non-contact Level Measurement (Ultrasonic) • Non-contact Surface Velocity Measurement (Radar) • Advantages
• Minimal maintenance • Above water installation • Low level flow measurement
• Limitations – Single Point, Surface Velocity Measurement does not yield
velocity measurement representative of cross section – Dead band in ultrasonic level measurement – Required velocity profiling
–Only read velocity at the surface!

Area Velocity
• “Contacting” Meters – Continuous Wave Doppler (CWD)
– Pulsed Doppler (PD)
• “Non-Contact” Meters – Radar
– Laser • Latest Advancement in Velocity Measurement
Technology

LaserFlowTM

Introducing Isco’s Non-Contact Solution
LaserFlow
• Non Contact Laser Velocity measurement
• Non Contact Ultrasonic Level Measurement
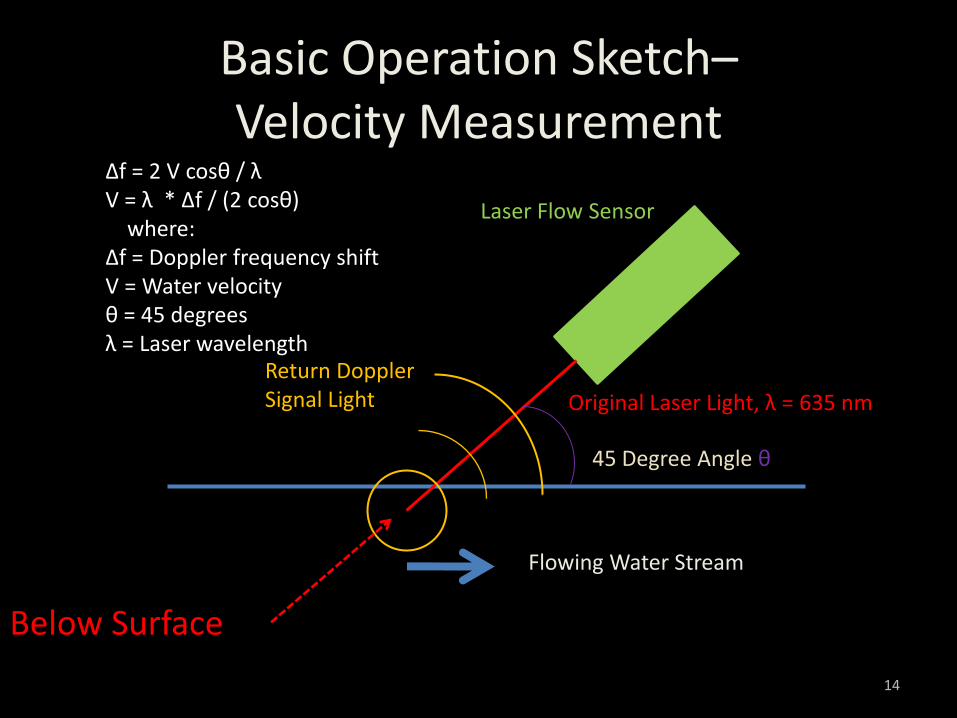
Basic Operation Sketch– Velocity Measurement
Laser Flow Sensor
Original Laser Light, λ = 635 nm
Return Doppler Signal Light
Flowing Water Stream
45 Degree Angle θ
∆f = 2 V cosθ / λ V = λ * ∆f / (2 cosθ) where: ∆f = Doppler frequency shift V = Water velocity θ = 45 degrees λ = Laser wavelength
V
14
Below Surface

Ultrasonic Level Measurement
Laser Velocity Measurement
Single Point Velocity Method

Theory of Operation
Below the surface
5000 Spectral Velocity Readings
Return Doppler Signal Light

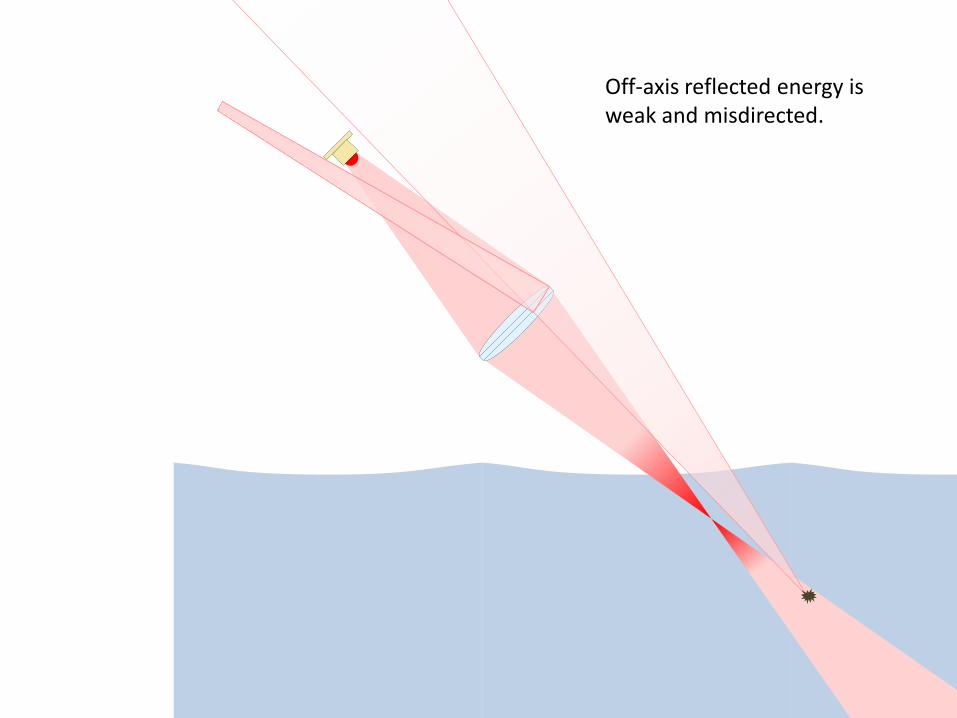
Off-axis reflected energy is weak and misdirected.

On-axis reflected energy is directed back to the sensor. However, the unfocused energy is very weak.
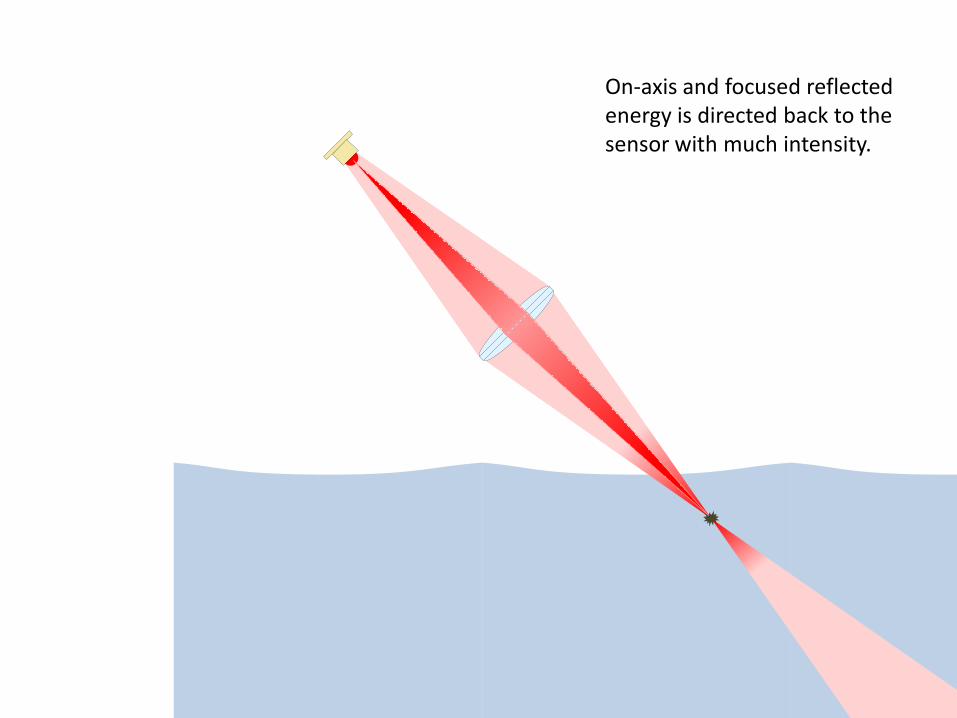
On-axis and focused reflected energy is directed back to the sensor with much intensity.

The frequency shift between the transmitted indicates the flow direction. The magnitude of the shift indicates the velocity.

Ultrasonic Level Sensor
• Range 0 – 10 feet
• 45˚ Deflector Plate
• 10˚ Beam Angle
0-10 ft
• Virtual Zero Dead band
• Ultrasonic dead band is exceeded by the time the signal reaches the bottom of the LaserFlow.
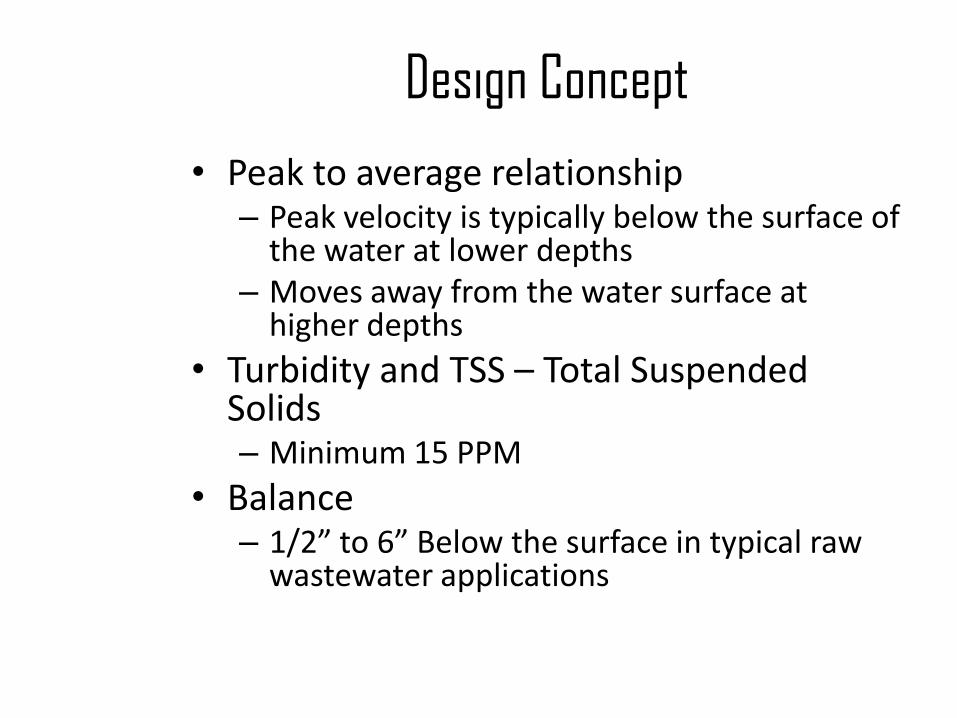
Design Concept
• Peak to average relationship – Peak velocity is typically below the surface of
the water at lower depths – Moves away from the water surface at
higher depths
• Turbidity and TSS – Total Suspended Solids – Minimum 15 PPM
• Balance – 1/2” to 6” Below the surface in typical raw
wastewater applications

Ultrasonic Level Measurement
Laser Velocity Measurement
Single Point Velocity Method
Single point Velocity Method

Ultrasonic Level Measurement
Laser Velocity Measurement
Multidepth Velocity Method
Multidepth Velocity Method
Ultrasonic Level Measurement
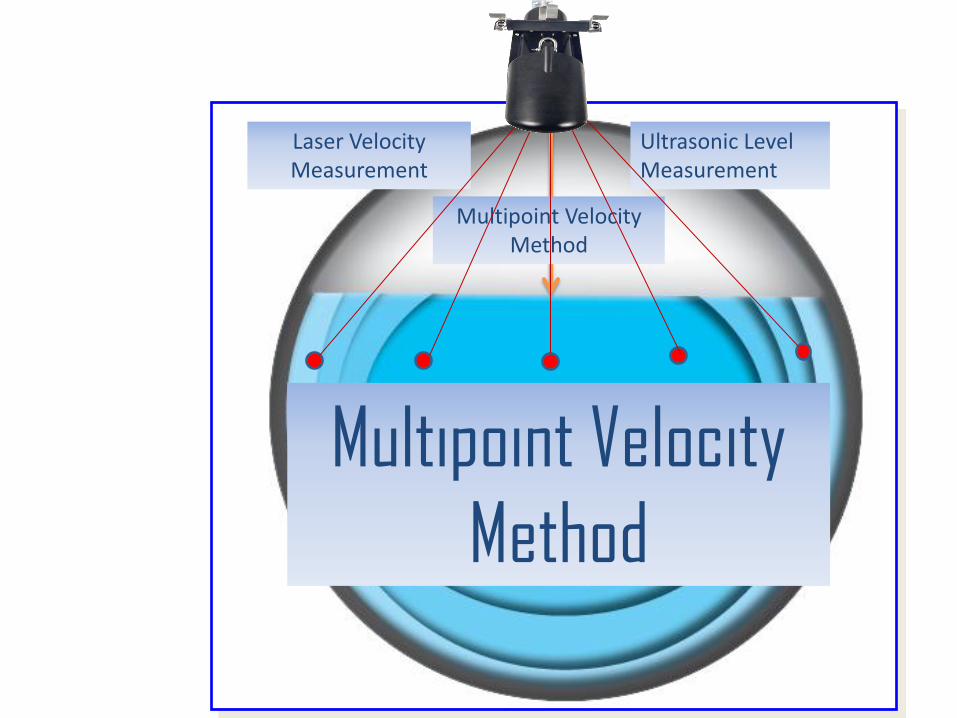
Laser Velocity Measurement
Multipoint Velocity Method
Multipoint Velocity
Method

Ultrasonic Level Measurement
Laser Velocity Measurement
Multipoint -Multidepth
Velocity Method
Multipoint – Multidepth Velocity Method

When do you use single point velocity
measurement? • Uniform and consistent flow • Battery Life is a concern • Rapid Data Rate – 1 minute
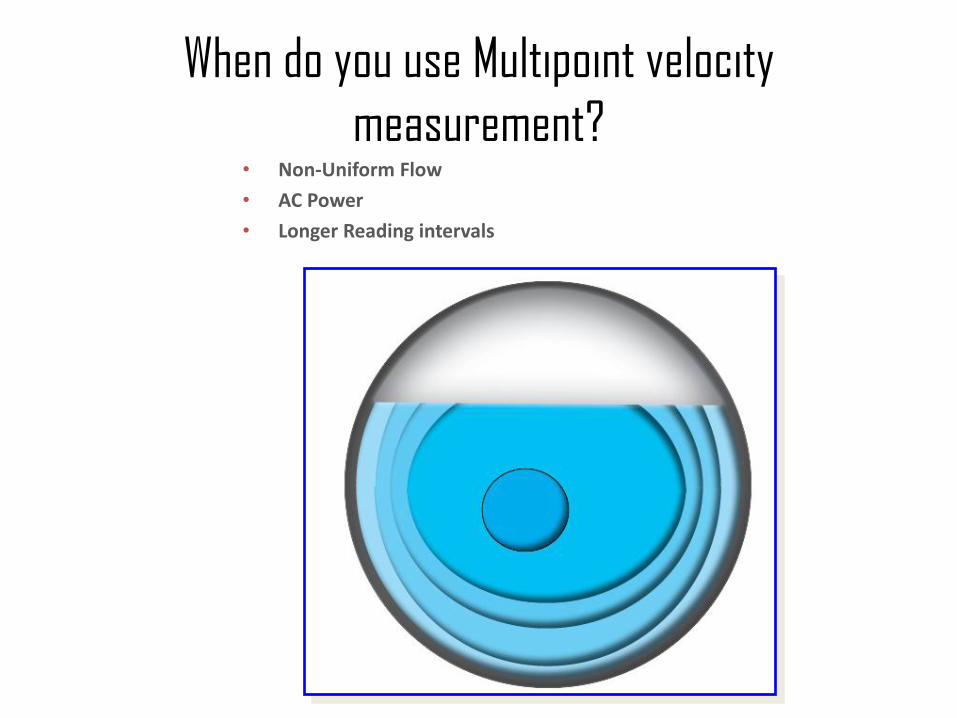
When do you use Multipoint velocity
measurement? • Non-Uniform Flow
• AC Power
• Longer Reading intervals

Submerged Condition • Measurement during Submerged condition
– TIENetTM CW area velocity sensor • Proven technology • Not a point velocity measurement • More accurate during surcharged conditions
• Measurement can start on different conditions – Variable Rate Data Storage
• Laser Level • Laser Velocity • Laser Temperature • CW Level • CW Velocity
• Laser cone design prevents water from reaching the laser window

Submerged Condition Measurement
TIENetTM Area velocity sensor connected to LaserFlow sensor Single cable from LaserFlow sensor
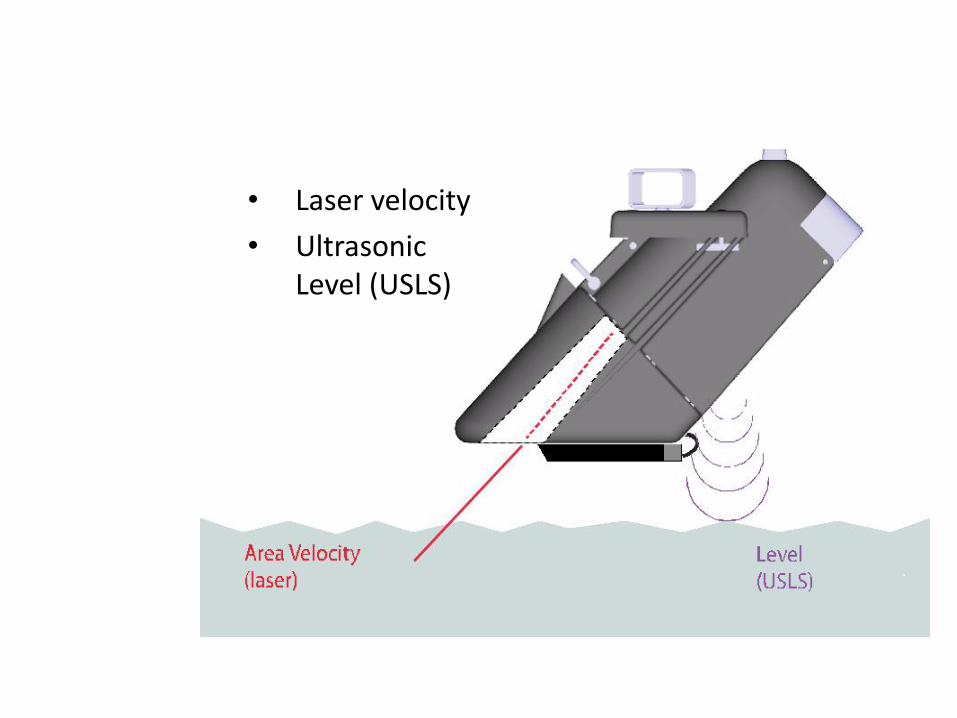
Normal Operation
• Laser velocity
• Ultrasonic Level (USLS)

Submerged Condition Begins

LaserFlow Fully Submerged
CWD sensor reading velocity
Pressure Sensor reading depth

Redundant Measurement
A r ea V eloci t y
(laser)
L e v el
(USLS)
L e v el
(p r essu r e t r ansdu c er)
A r ea V eloci t y
( s o u n d w a v e)
TIENet Area Velocity sensor with a longer Cable 1,10, 23M
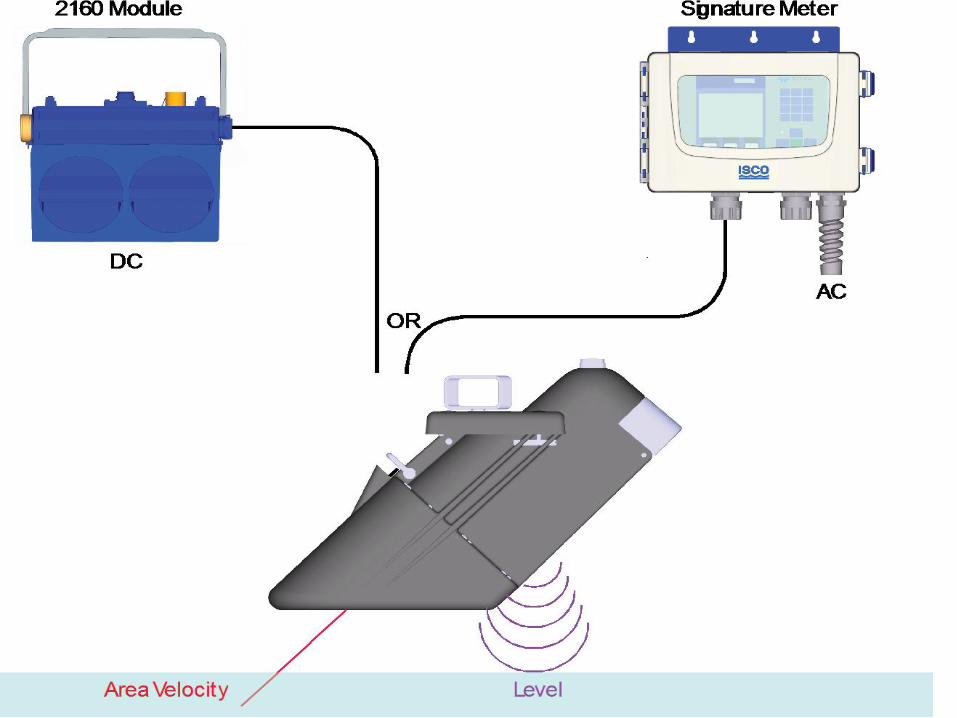
Teledyne Proposed Solution Electronics

Product Specifications • Level range accuracy
– 0.02 ft at 1 ft level change or less
• Velocity range
– +/-15 ft/sec
• Minimum depth for velocity
– 0.5”
• Focus range of Laser
– 0.5” - 6” below the surface at 15 NTU /PPM
• Turbidity / TSS range
– 15 - 1,000 NTU/PPM
• Operating temperature
– Up to 140˚F
• Battery Life @ 15 minute readings with single point, unidirectional setup
– 12 Weeks

Product Specifications
Housing Materials
• Corrosion resistant ABS plastic
• IP 68
• Anodized aluminum
• Stainless steel hardware
• Ultrasonic Sensor
– Kynar (corrosion resistant)

Installation Requirements • Laser can be installed facing in the upstream or
downstream pipe. • Center the bracket over the flow stream.

Installation Requirements • Install the LaserFlow sensor in the middle of the pipe,
parallel to the water surface. • Use the “Laser On” function to see where the beam hits.
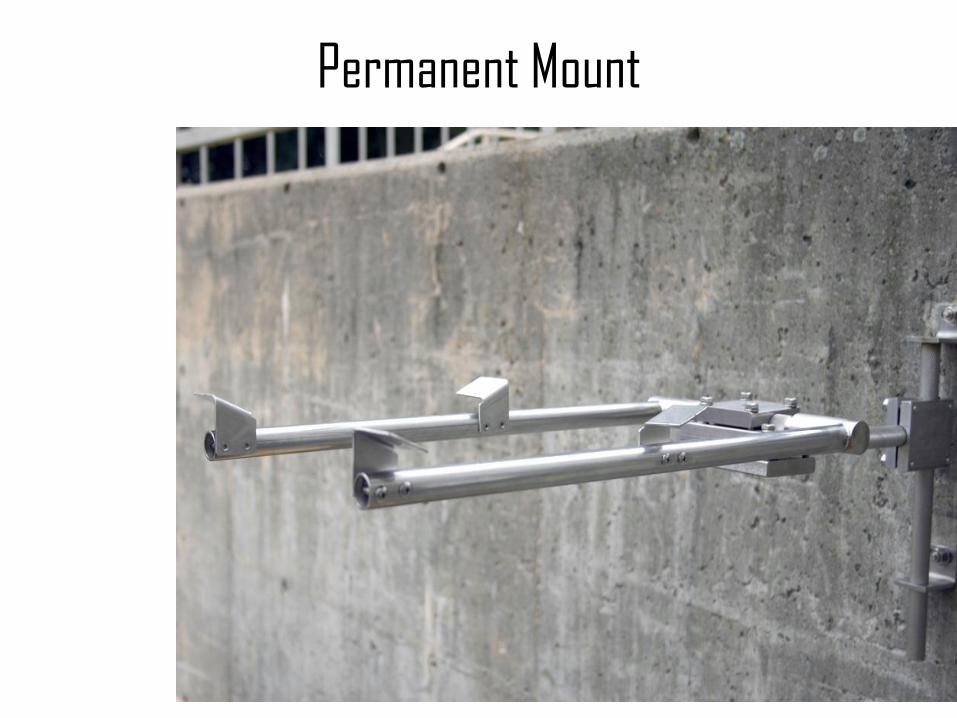
Permanent Mount

Permanent Mount
• Wall mount bracket
– Vertical adjustment
• X – axis adjustment
• or roll
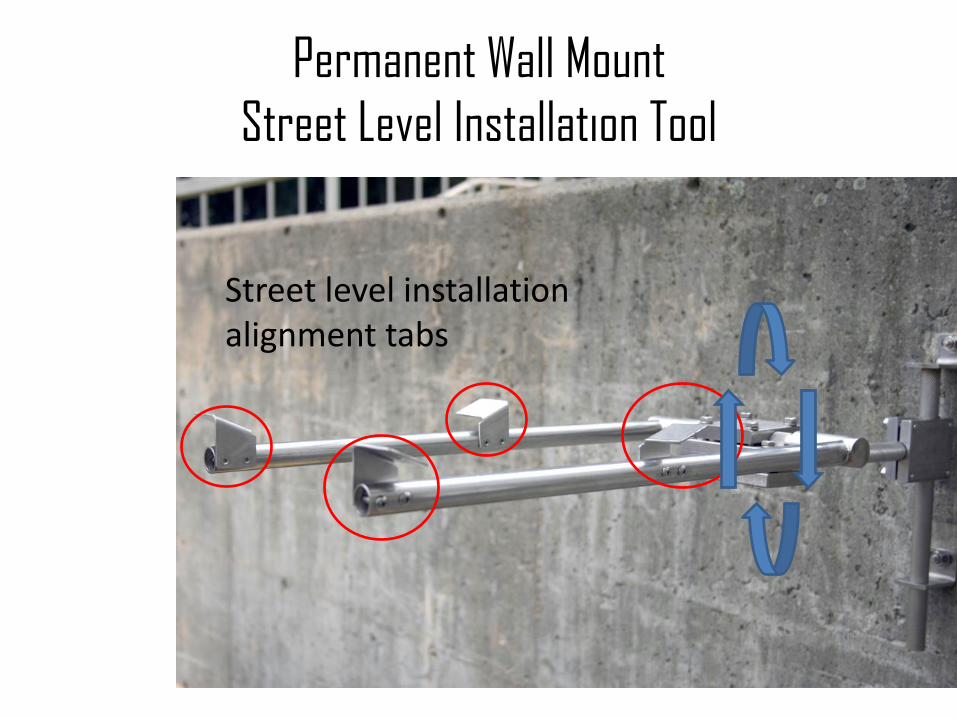
Permanent Wall Mount
Street Level Installation Tool
Street level installation alignment tabs

Level installation

Locking handle

Street Level Tool Max length 23 ft

Facing into the flow

Facing away from the flow

Temporary application
• Spreader bar
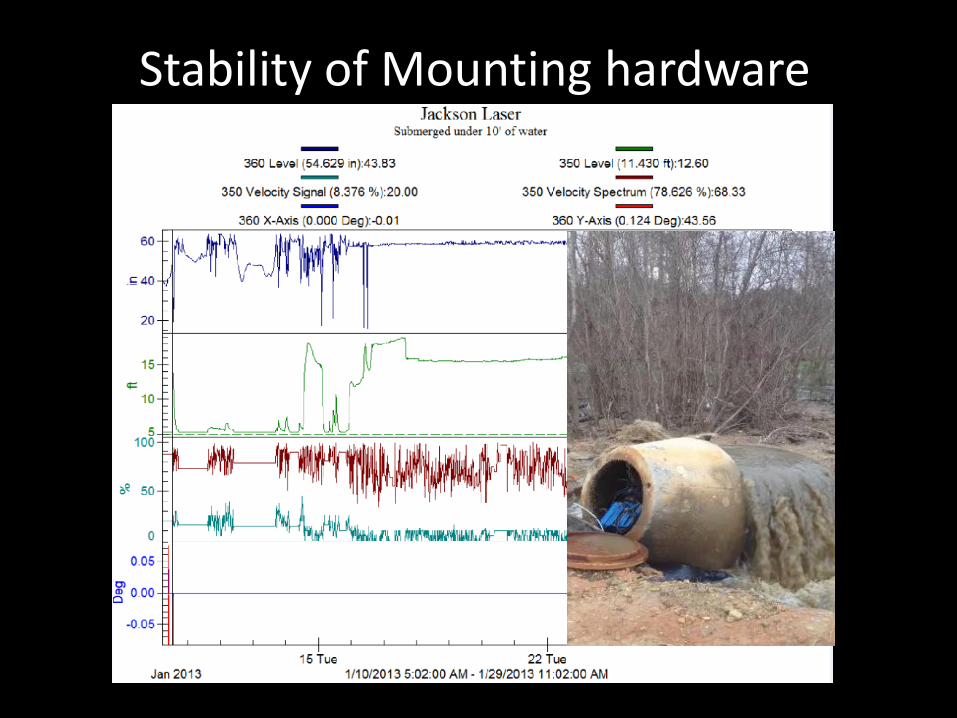
Stability of Mounting hardware
How well does LaserFlow Technology Perform?
Examples of Actual Performance
• Accuracy
• Repeatability

Single Point Velocity Method
Within 0.5%

Omaha LaserFlow vs ADFM
Difference = 0.36%

SAWPA comparison vs. OCSD reference Magmeter

LaserFlow Applications
• Collection System Monitoring – Billing – Inflow and Infiltration
• WWTP – Permit Reporting:
• Raw Influent • Final Effluent
– In plant pipes and channels
• Hydraulic Modeling – Highly Accurate & Reliable Data Sets
• Industrial Discharge monitoring – Harsh Chemicals and/or Environments
• Storm water – Large debris

Summary
• LaserFlow – Advanced Laser Velocity Measurement
– Multipoint Subsurface Velocity Measurement
– The only non-contact flow measurement system that reads below the surface
– Both precise and accurate
– Easy to install and maintain
– Excellent Submerged flow measurement option
– Flexible Platforms • 2100 (Portable Battery Operated)
• Signature (Permanent – Process Meter)

Oh, by the way… …did you know?
• CWD, PD, and LaserFlow sensors can be used to measure and log Water Temperature?
– Help indicate source or distinguish between inflow or infiltration
• Some sensors can provide continuous logging of velocity reading quality indicators.

Lift Station Monitoring 4501

Application
Any application where “fixed” speed pumps are moving fluid from point A to point B.
&
Where the pumps are activated when specific volume thresholds are met in the source!

Purpose and Applications for Lift Station Monitoring
• Wastewater collection system studies • Dry and wet weather flow conditions
• Inflow and infiltration studies (I&I)
• Capacity monitoring
• Future planning
• Billing measurement
• Lift station performance studies
• Proactive maintenance programs

Lift Station Monitor Operation
• Benefits: • Accurately measure within 1%
• Influent flow
• Pumping rates for each pump
• Volume processed by the station
• Diagnose • Abnormal pump station performance
• Maintenance issues
• Power issues
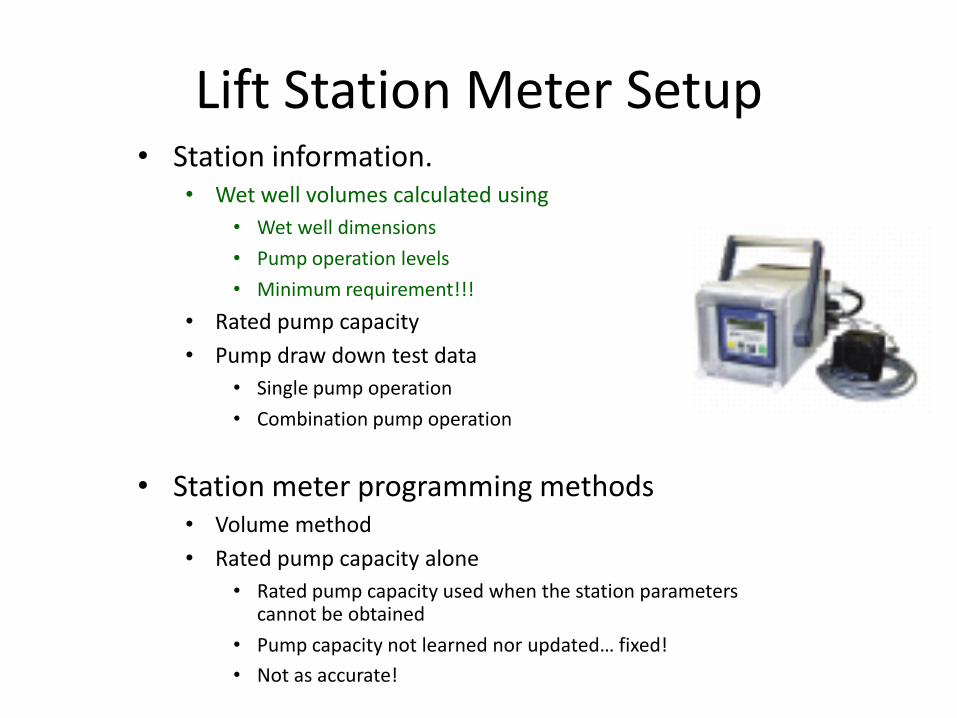
Lift Station Meter Setup • Station information.
• Wet well volumes calculated using
• Wet well dimensions
• Pump operation levels
• Minimum requirement!!!
• Rated pump capacity
• Pump draw down test data
• Single pump operation
• Combination pump operation
• Station meter programming methods • Volume method
• Rated pump capacity alone
• Rated pump capacity used when the station parameters cannot be obtained
• Pump capacity not learned nor updated… fixed!
• Not as accurate!

Principle of Operation • Wet well fills and empties
• Monitors pump ON / OFF intervals • OFF = FILL
• ON = EMPTY
• The volume and time intervals are used
• Algorithms applied to calculate • Flow into and out of lift
station
• Pumping rate of each pump

3 methods of calculation 1 - Extrapolation Method
Calculation method in the 4501.

3 methods of calculation 2 - Averaging Method

3 methods of calculation 3 - Trending Method
Method used by the PC software
Pumplink uses the 5 preceding events and the 5 following events to calculate and determine “trend”

Summary Report

Monthly Report

Daily Report

Event Report

Lift Station Monitoring Recap
• Collection system studies • Dry weather analysis • Wet weather analysis • System planning/modeling
• Station monitoring • Maintenance needs • Pump performance • Diagnostics – station performance

QUESTIONS
• For More Information Contact:
– Kip Koszewski [email protected] 586.978.7200
– Glenn Hummel [email protected] 586.353.2242