large variations in holocene solar activity: constraints
TRANSCRIPT

Large variations in Holocene solar activity: Constraints from 10Be in
the Greenland Ice Core Project ice core
Maura Vonmoos,1 Jurg Beer,1 and Raimund Muscheler2
Received 26 October 2005; revised 1 June 2006; accepted 17 July 2006; published 12 October 2006.
[1] Cosmogenic radionuclides extracted from ice cores hold a unique potential forreconstructing past solar activity changes beyond the direct instrumental period.Taking the geomagnetic modulation into account, the solar activity in terms of theheliospheric modulation function can quantitatively be reconstructed in high resolutionthroughout the Holocene. For this period our results reveal changes in heliosphericmodulation of galactic cosmic rays significantly larger than the variations reconstructed onthe basis of neutron monitor measurements of galactic cosmic rays for the last 50 years.Moreover, the 10Be data from the Greenland Ice Core Project ice core as well as 14Csupport a high current solar activity. However, although the reconstruction of solar activityon long timescales is difficult, our result suggests that the modern activity state of theSun is not that exceptional regarding the entire Holocene. This extended solar activityrecord provides the basis for further detailed investigations on solar and cosmic rayphysics, as well as on solar forcing of the Earth’s climate whose importance is suggestedby increasing paleoclimatic evidences.
Citation: Vonmoos, M., J. Beer, and R. Muscheler (2006), Large variations in Holocene solar activity: Constraints from 10Be in the
Greenland Ice Core Project ice core, J. Geophys. Res., 111, A10105, doi:10.1029/2005JA011500.
1. Introduction
[2] Various observations of solar parameters over thelast decades to centuries have revealed that the Sun is avariable star. Since 1951, neutron monitors have beenrecording variations in galactic cosmic rays (GCR) enter-ing the Earth’s atmosphere which are attributable tochanges in heliospheric modulation [Beer, 2000b; Masarikand Beer, 1999; Simpson, 1978; Usoskin et al., 2002]. Forabout the past 30 years, satellite-based radiometers haveshown variations of the total solar irradiance, which is stillmisleadingly named ‘‘solar constant.’’ However, the mea-sured variability in the total solar irradiance is small. Theamplitude over a typical 11-year solar cycle is only about0.1% [Frohlich, 2006; Frohlich and Lean, 1998; Willson,1997]. Monitoring of other stars over the past approxi-mately 20 years, on the other hand, has partly revealedsignificantly larger variations in their brightness [Baliunasand Jastrow, 1990; Lockwood, 1994; Radick et al., 1990].Though their primarily assumed similarity to the Sun isquestioned in recent studies [Hall and Lockwood, 2004],larger variations on longer timescales than observed so farcannot be excluded either for the Sun. This is indeed indicatedby historical solar observations covering up to 4 centuries.They clearly point to a solar magnetic variability larger thanobserved during the satellite-based radiometry and the neu-
tron monitoring period. The longest direct record of solarmagnetic activity starts at 1610 AD and has been obtainedfrom observations of the Sun’s surface, in particular theoccurrence of sunspots (first continuous reconstruction byRudolf Wolf) or sunspot groups [Hoyt and Schatten, 1998].Superimposed on the well-expressed 11-year solar cycle, theso-called Schwabe cycle, are larger long-term variations (i.e.,grand solar minima [Eddy, 1976]). Since the MaunderMinimum (1645–1715 AD), when hardly any sunspotswere observed, the average solar activity as manifested bysunspots has generally increased, interrupted by tempo-rarily drops around 1800 AD (Dalton Minimum) and atthe end of the 19th century. Further evidence of a largermagnetic solar variability on decadal to centennial time-scale than observed over the last 50 years are obtainedfrom measurements of other magnetic activity proxiessuch as the geomagnetic aa index [Lockwood, 2004;Mayaud, 1973], the occurrence of aurora [Legrand andSimon, 1987] as well as from the solar radius [Ribes etal., 1991] although the latter is still debated. Theirconsistent 11-year cycle confirms these different proxiesin being physical manifestations of the magnetic activityof the Sun, even though differently related both to thesolar magnetic field and among them. However, theinstrumental measurement period is limited to the lastfew decades to centuries, depending on the particularobserved solar index and their reliability generallydecreases with age.[3] Knowledge of the total bandwidth of our Sun’s
variability is widely required, especially in the field of solarand cosmic ray (CR) physics and (paleo)climatology. Onthe part of solar physics, this knowledge can improve theunderstanding of solar magnetic activity, i.e., the solar
JOURNAL OF GEOPHYSICAL RESEARCH, VOL. 111, A10105, doi:10.1029/2005JA011500, 2006ClickHere
for
FullArticle
1Swiss Federal Institute of Environmental Science and Technology,Dubendorf, Switzerland.
2Climate and Radiation Branch, NASA Goddard Space Flight Center,Greenbelt, Maryland, USA.
Copyright 2006 by the American Geophysical Union.0148-0227/06/2005JA011500$09.00
A10105 1 of 14

dynamo generating the solar magnetic field in the Sun’sconvective zone and the physical processes inducing thetemporal and spatial variations in its magnetic strength. Aprolonged solar record spanning several thousands of yearsprovides important insights into the solar activity’s cyclicnature and recurrent temporary persistence in modes ofconstantly reduced magnetic activity, the so-called grandsolar minima. In CR physics, a classical task is the propa-gation of GCR through the heliosphere and its variabilityrelated to solar magnetic activity. The heliosphere extendsto about 120 astronomical units (AU) into space and is filledby the open solar magnetic flux, the solar magnetic fieldfrozen in the solar wind streaming out of the Sun’s surface.Knowledge of long-term solar modulation of the GCR fluxcan indirectly extend the existing 50 years long neutronmonitor records of GCR significantly [Beer, 2000b;McCracken, 2001, 2004; McCracken and McDonald,2001]. This allows studying GCR and processes associatedwith the heliospheric modulation of GCR on longer time-scales than what has been possible on the basis of neutronmonitor data.[4] Furthermore, the Sun is by far the most important
energy source for the Earth’s climate system. With thediscovery of the Sun’s variability increasing interest hasbeen directed toward its significance as a variable naturalclimate forcing factor [Eddy, 1976; Lean et al., 1995; Leanand Rind, 1999; Reid, 1991; Rind, 2002]. There is agrowing number of paleoclimatic studies pointing towarda strong solar forcing on past climate [Bond et al., 2001;Denton and Karlen, 1973; Fleitmann et al., 2003; Hodell etal., 2001; Magny, 1993; Neff et al., 2001; Van Geel et al.,1996; Verschuren et al., 2000]. Therefore a long andquantitative record of past solar activity is of special interestfor paleoclimatologists and climate modelers to determinethe Sun’s potential of variability and to assess possiblefuture activity ranges. The relevant form of solar impact onthe climate is its total and spectral irradiance, especially theUV [Haigh, 1994, 1996, 1999; Shindell et al., 2001]. Sincetotal solar irradiance changes correlate well with weak solarmagnetic field changes during the instrumental period, along-time record of solar activity as manifested by the openfields holds a large potential for reconstructing long-termsolar irradiance variability.[5] Owing to the lack of complete direct observations of
the Sun for the period before AD 1600, one has to rely onindirect sources of information to acquire knowledge aboutthe Sun’s long-term behavior and total extent of variability.One of the most reliable indirect proxies of solar variabilityare represented by cosmogenic radionuclides, such as 14Cand 10Be or 36Cl, that can be determined with high resolu-tion from tree ring and ice core archives reaching back intime ten and hundreds of thousands of years, respectively[Baumgartner et al., 1997a; Finkel and Nishiizumi, 1997;Muscheler et al., 2004; Stuiver et al., 1998; Wagner et al.,2001; Yiou et al., 1997]. However, the extraction of thesolar signal from cosmogenic radionuclide records is notstraightforward, since they are influenced by differentcomponents (see section 3). Yet, cosmogenic radionu-clides turned out to be particularly suitable for extendingthe record of past solar variability [Beer, 2000a]. Variousreconstructions of solar activity for the last millennium orthe entire Holocene are based on them, so in terms of
total solar irradiance [Bard et al., 2000] and sunspots[Solanki et al., 2004; Usoskin et al., 2003]. In this paperwe present a different method to Usoskin et al. [2003] toreconstruct solar variability quantitatively in terms of thesolar modulation function using the cosmogenic radionu-clide 10Be. Spanning around 9000 years, this recordprovides an unprecedented basis for the detailed discus-sion of relevant questions regarding solar and CR phys-ics, as well as the solar forcing of the Earth’s climatesystem.
2. Solar Modulation Function FFF[6] The production rate of cosmogenic radionuclides
depends on the intensity of GCR penetrating the Earth’satmosphere. Before reaching the Earth, GCR have to crossthe heliosphere where they are subject to solar inducedmodulation effects. The propagation of GCR through theheliosphere is described by the cosmic ray transport equa-tion formulated by Parker [1965]. In this formula thefollowing processes are taken into account [Caballero-Lopez and Moraal, 2004]: (1) pitch angle scattering of theparticles along the magnetic field lines; (2) diffusion per-pendicular to the field lines; (3) gradient curvature, neutralsheet, and shock drift effects; (4) convection in the solarwind; (5) adiabatic energy gains; and (6) adiabatic energylosses in the expanding solar wind.[7] The Parker transport equation can only be numerically
solved and requires a detailed knowledge of the cosmic rayintensity as a function of the three spatial coordinates, time,and energy. To reduce the complexity, several simplifyingassumptions have been introduced such as [McCracken etal., 2004]: (1) the heliosphere is spherically symmetric andin a quasi-steady state; (2) the net streaming of GCR isnegligible compared to diffusion; (3) the diffusion coeffi-cients can be separated into a function of distance from theSun and a function of the rigidity (momentum to chargeratio) of the cosmic rays. On the basis of these assumptions,Gleeson and Axford [1968] derived the so-called force-fieldequation:
J EPð Þ ¼ JLIS EP þ Fð ÞEP EP þ 2mpc
2� �
Ep þ F� �
Ep þ 2mpc2 þ F� � ð1Þ
where JLIS is the local interstellar cosmic ray flux, that is,the flux of GCR particles outside the heliosphere, EP is theproton’s kinetic energy [MeV], F is the solar modulationfunction [MeV], c is the velocity of light, and mPc
2 is theproton’s rest energy = 938 MeV.[8] This equation relates the GCR intensity with energy
EP at the distance 1 AU (Astronomical Unit = 149.6 �106 km) from the Sun, J(EP), to the GCR intensity withenergy EP + F in the local interstellar region, JLIS(EP + F).The modulation function F quantifying formally an energyloss, changes the shape of the differential energy spectrumof GCR particles. The degree of this change diminisheswith increasing energy EP (Figure 1). F can be expressedby the modulation potential �(r,t):
F ¼ Ze� r; tð Þ ð2Þ
A10105 VONMOOS ET AL.: HOLOCENE SOLAR VARIABILITY
2 of 14
A10105

where Ze is the electrical charge of the particle. Here �(r,t)is related to the solar wind speed V(r,t) and the diffusioncoefficient �(r,t) of the GCR in the heliomagnetic field:
� r; tð Þ ¼Z rb
r
V r; tð Þ3� r; tð Þ dr ð3Þ
where r is the distance from the Sun and rb is the outerboundary of the heliosphere. The modulation function Fthat describes the adiabatic energy loss of the GCR ismeasured in MeV, whereas the energy loss per unit charge �is quoted in MV.[9] Caballero-Lopez and Moraal [2004] have investigat-
ed different approximations by comparing them with thefull numerical solution of the Parker transport equation.They have found that at the distance of 1 AU and forenergies EP > 500 MeV the force-field approximation workswell and leads to good empirical fits with observed cosmicray spectra [Webber and Lockwood, 2001].
[10] From equation (1) it is obvious that the GCR spectraand correspondingly the production rate of cosmogenicradionuclides depends on the local interstellar cosmic rayflux JLIS and its modulation by F. The differential energyspectra used in our work and shown in Figure 1 as afunction of the solar modulation function F are based onthe local interstellar spectrum of Cini Castagnoli and Lal[1980]:
JLIS ¼ CP Ep þ x� ��2:65 ð4Þ
where x = 780 exp(�2.5 � 10�4EP) and CP = 1.244 �106 cm�2 s�1 MeV�1 is the normalization factor.[11] While most authors use the same force-field approx-
imation as we do [McCracken et al., 2004; Webber andHigbie, 2003], the JLIS has been modified recently based onnew instrumental data acquired by spacecrafts in the outerheliosphere where solar modulation is weak [Webber andLockwood, 2001]. However, Figure 1 shows that the differ-ence to our work [Cini Castagnoli and Lal, 1980; Masarikand Beer, 1999] is smaller than 10% in the energy rangewhere the 10Be response to GCR is largest (gray bar inFigure 1) [McCracken, 2001, 2004; Webber and Higbie,2003].[12] Figure 1 illustrates the enhanced shielding effect
during periods of high solar activity, that is, the enhancedenergy loss of the GCR protons due to the increasedintensity of the magnetic field carried in the solar wind.For a given change in F the effect on the GCR proton fluxintensity is largest for periods of small solar activity.[13] The effect of the solar modulation increases strongly
toward lower energies, and this coincides with the mostefficient energy range for the subsequent production of thecosmogenic radionuclide 10Be from GCR in the Earth’satmosphere, which is around 1–2 GeV [McCracken, 2001,2004; Webber and Higbie, 2003]. This shows that 10Be timeseries can be used as sensitive recorders of past solarmodulation and thus of the temporal variability of the opensolarmagnetic field, especially in periods of low solar activity.[14] The modulation function F provides, like the differ-
ent manifestations of solar activity, only one specific aspectof solar magnetic activity with not yet fully understoodrelation to the ongoing magnetic processes in and on thesurface of the Sun. The comparison of the two widely usedsolar magnetic activity proxies, the 10Be production rate(depending on heliomagnetic modulation of GCR by theopen magnetic field from the Sun and related to coronalmass ejections) and the sunspot group number (reflectingstrong magnetic flux tubes crossing the photosphere),reveals distinct differences in their sensitivity to recordchanges in the solar activity. In the 11-year solar cycleminima the number of sunspots is close to zero and cannotdifferentiate between the different strengths of the minima,whereas the 10Be production rate does. This importantdifference is obvious during the Maunder Minimum whenthe 10Be record from the Dye3 ice core continuously showsan 11-year solar cycle, whereas almost no sunspots wereobserved [Beer et al., 1998]. This may indicate a thresholdlevel of solar activity for the appearance of sunspots andthus that a sunspot number of zero does not manifest a solaractivity as low as a F value of 0 MeV does.
Figure 1. Energy spectra of the primary galactic cosmicray (GCR) proton flux at 1 AU for different values of thesolar modulation function F. The spectra are calculatedusing the force-field approximation [Gleeson and Axford,1968] of the transport equation and the local interstellarspectrum of GCR protons published by Cini Castagnoli andLal [1980], equations (1) and (4). The curves are labeledwith the value of the corresponding solar modulationfunction F. While the spectra for F values above 300 MeVare supported by measurements [Cini Castagnoli and Lal,1980], the others cannot be verified by experimental data sofar. The curve labeled with F = 0 MeV corresponds to thelocal interstellar flux, that is, the estimated flux of GCRparticles outside the heliosphere. A new approximation ofthe local interstellar spectrum of Webber and Lockwood[2001] (dashed curve, F = 0 MeVWL) shows only smalldifferences to the spectrum of Cini Castagnoli and Lal[1980], especially in the energy range which is important forthe radionuclide production (gray bar) [Webber and Higbie,2003].
A10105 VONMOOS ET AL.: HOLOCENE SOLAR VARIABILITY
3 of 14
A10105
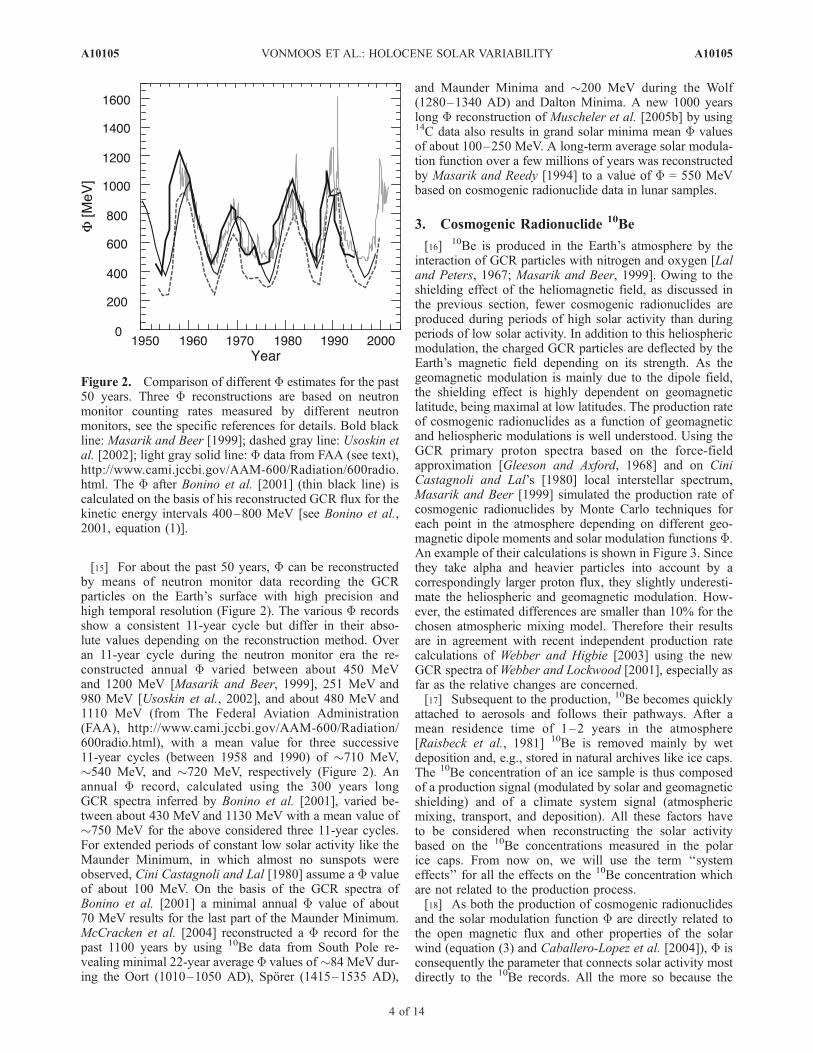
[15] For about the past 50 years, F can be reconstructedby means of neutron monitor data recording the GCRparticles on the Earth’s surface with high precision andhigh temporal resolution (Figure 2). The various F recordsshow a consistent 11-year cycle but differ in their abso-lute values depending on the reconstruction method. Overan 11-year cycle during the neutron monitor era the re-constructed annual F varied between about 450 MeVand 1200 MeV [Masarik and Beer, 1999], 251 MeV and980 MeV [Usoskin et al., 2002], and about 480 MeV and1110 MeV (from The Federal Aviation Administration(FAA), http://www.cami.jccbi.gov/AAM-600/Radiation/600radio.html), with a mean value for three successive11-year cycles (between 1958 and 1990) of �710 MeV,�540 MeV, and �720 MeV, respectively (Figure 2). Anannual F record, calculated using the 300 years longGCR spectra inferred by Bonino et al. [2001], varied be-tween about 430 MeV and 1130 MeV with a mean value of�750 MeV for the above considered three 11-year cycles.For extended periods of constant low solar activity like theMaunder Minimum, in which almost no sunspots wereobserved, Cini Castagnoli and Lal [1980] assume a F valueof about 100 MeV. On the basis of the GCR spectra ofBonino et al. [2001] a minimal annual F value of about70 MeV results for the last part of the Maunder Minimum.McCracken et al. [2004] reconstructed a F record for thepast 1100 years by using 10Be data from South Pole re-vealing minimal 22-year average F values of �84 MeV dur-ing the Oort (1010–1050 AD), Sporer (1415–1535 AD),
and Maunder Minima and �200 MeV during the Wolf(1280–1340 AD) and Dalton Minima. A new 1000 yearslong F reconstruction of Muscheler et al. [2005b] by using14C data also results in grand solar minima mean F valuesof about 100–250 MeV. A long-term average solar modula-tion function over a few millions of years was reconstructedby Masarik and Reedy [1994] to a value of F = 550 MeVbased on cosmogenic radionuclide data in lunar samples.
3. Cosmogenic Radionuclide 10Be
[16] 10Be is produced in the Earth’s atmosphere by theinteraction of GCR particles with nitrogen and oxygen [Laland Peters, 1967; Masarik and Beer, 1999]. Owing to theshielding effect of the heliomagnetic field, as discussed inthe previous section, fewer cosmogenic radionuclides areproduced during periods of high solar activity than duringperiods of low solar activity. In addition to this heliosphericmodulation, the charged GCR particles are deflected by theEarth’s magnetic field depending on its strength. As thegeomagnetic modulation is mainly due to the dipole field,the shielding effect is highly dependent on geomagneticlatitude, being maximal at low latitudes. The production rateof cosmogenic radionuclides as a function of geomagneticand heliospheric modulations is well understood. Using theGCR primary proton spectra based on the force-fieldapproximation [Gleeson and Axford, 1968] and on CiniCastagnoli and Lal’s [1980] local interstellar spectrum,Masarik and Beer [1999] simulated the production rate ofcosmogenic radionuclides by Monte Carlo techniques foreach point in the atmosphere depending on different geo-magnetic dipole moments and solar modulation functions F.An example of their calculations is shown in Figure 3. Sincethey take alpha and heavier particles into account by acorrespondingly larger proton flux, they slightly underesti-mate the heliospheric and geomagnetic modulation. How-ever, the estimated differences are smaller than 10% for thechosen atmospheric mixing model. Therefore their resultsare in agreement with recent independent production ratecalculations of Webber and Higbie [2003] using the newGCR spectra of Webber and Lockwood [2001], especially asfar as the relative changes are concerned.[17] Subsequent to the production, 10Be becomes quickly
attached to aerosols and follows their pathways. After amean residence time of 1–2 years in the atmosphere[Raisbeck et al., 1981] 10Be is removed mainly by wetdeposition and, e.g., stored in natural archives like ice caps.The 10Be concentration of an ice sample is thus composedof a production signal (modulated by solar and geomagneticshielding) and of a climate system signal (atmosphericmixing, transport, and deposition). All these factors haveto be considered when reconstructing the solar activitybased on the 10Be concentrations measured in the polarice caps. From now on, we will use the term ‘‘systemeffects’’ for all the effects on the 10Be concentration whichare not related to the production process.[18] As both the production of cosmogenic radionuclides
and the solar modulation function F are directly related tothe open magnetic flux and other properties of the solarwind (equation (3) and Caballero-Lopez et al. [2004]), F isconsequently the parameter that connects solar activity mostdirectly to the 10Be records. All the more so because the
Figure 2. Comparison of different F estimates for the past50 years. Three F reconstructions are based on neutronmonitor counting rates measured by different neutronmonitors, see the specific references for details. Bold blackline: Masarik and Beer [1999]; dashed gray line: Usoskin etal. [2002]; light gray solid line: F data from FAA (see text),http://www.cami.jccbi.gov/AAM-600/Radiation/600radio.html. The F after Bonino et al. [2001] (thin black line) iscalculated on the basis of his reconstructed GCR flux for thekinetic energy intervals 400–800 MeV [see Bonino et al.,2001, equation (1)].
A10105 VONMOOS ET AL.: HOLOCENE SOLAR VARIABILITY
4 of 14
A10105

physical link between 10Be and F is well understood. Forthe reconstruction of the other parameters of solar activityfrom cosmogenic radionuclides additional sophisticatedphysical models are required, which do not exist in mostcases yet.
4. 10Be Record From the Greenland Ice CoreProject (GRIP) Ice Core
[19] The 10Be record was measured in the 3029 m longGreenland Ice Core Project (GRIP) ice core (Summit,Central Greenland) covering several hundred thousandyears [Baumgartner et al., 1997b; Muscheler et al., 2004;Wagner et al., 2001; Yiou et al., 1997]. We use the timescalepublished by Johnsen et al. [1997] (ss09 timescale). 10Beconcentration measurements corresponding to the Holoceneare available from 304 to 9315 years BP. As for all deepdrilling ice cores, the top part of the GRIP ice core islacking for technical reasons. Being dependent on the depth,the mean temporal resolution of the 10Be record is about5 years for this time interval.[20] For the climatically relatively stable Holocene there
are good reasons to assume that the climate system effectson the 10Be concentration measured in the GRIP ice core aresmall enough to be neglected in a first-order approximation.Probably the strongest argument comes from the compari-son with the cosmogenic radionuclide 14C whose produc-tion is influenced by the same modulation processes butwhich, once produced, shows a completely differentgeochemical behavior as it participates in the global carboncycle. Despite these fundamentally different geochemicalsystems, both records show a high degree of similaritythroughout the Holocene. This strongly points to productionas the dominant cause of variability [Muscheler et al.,
2004]. Further investigation is needed to analyze the causefor a slight discrepancy in the long-term trend (in the orderof 10%), which can be due to system effects on bothradionuclide records, like local changes in the atmosphericmixing, transport, or deposition and/or changes in thecarbon cycle, respectively. However, within the relativelybig uncertainties, the long-term changes of the GRIP 10Bedata can be completely explained by changes in the geo-magnetic field intensity indicating neither solar activity nortransport changes on timescales longer than 3000 years[Muscheler et al., 2005a]. The differences between 14Cand independent geomagnetic field reconstructions couldbe explained by changes in the carbon cycle affecting theatmospheric 14C record [Muscheler et al., 2005a] and, inthis case, making it problematic to use radiocarbon recordsto reconstruct long-term changes in solar activity.[21] In Greenland, 10Be is mainly removed from the
atmosphere by wet deposition. Changes in the precipitationrate as observed during glacial times can cause considerablechanges in the 10Be concentration that are not related to theproduction rate [Wagner et al., 2000]. Calculating the 10Beflux as the product of 10Be concentration, accumulation rate,and density takes the variable accumulation conditions intoaccount. However, during the Holocene the accumulationrate is relatively constant compared to the production ratevariations leading to a 10Be flux that agrees well with the10Be concentration. Stable climatic conditions can further bededuced from the fact that there are no indications for strongchanges in the precipitation source for central Greenlandduring the Holocene [Johnsen et al., 1989; Mayewski et al.,1997]. This finding also holds information about the atmo-spheric pathway of 10Be, which, attached to aerosols, is alsotransported by the air masses. On the basis of the relativelystable transport and depositional processes at the coring site,we assume that in a first approximation, the 10Be flux, aswell as the 10Be concentration, can be considered as a goodestimate of the production signal free of climatic effectsduring the Holocene.
5. Reconstruction of Solar Variability
5.1. Method
[22] Our method to reconstruct the past solar activityrelies on the well-established relationship between thegeomagnetic field intensity, the 10Be production rate andthe solar modulation function F [Masarik and Beer, 1999],as illustrated in Figure 3. Using this relationship, the pastsolar activity expressed by F can be derived from the 10Beproduction rate, provided that the past geomagnetic fieldintensity is known.[23] Information on the past geomagnetic field intensity is
obtained from archaeomagnetic investigations throughoutthe Holocene by Yang et al. [2000] (Figure 4a). Theyaveraged measurements of the geomagnetic field strengthfrom different regions of the Earth (mainly Europe andAsia) to assess the global geomagnetic dipole field. In orderto level out short-term variations, which were assumed to bechanges of the nondipole field [Yang et al., 2000], these datawere averaged over 500 years (from 0 to 2000 years BC)and 1000 years (from 2000 years to 10,000 years BC) [Yanget al., 2000]. We did a spline interpolation of the originallystepwise paleomagnetic field record through the average
Figure 3. Dependence of the 10Be production rate on thesolar activity F and on the intensity of the geomagnetic field[Masarik and Beer, 1999] considering a production areacovering the entire hemisphere in the stratosphere but onlygeographic latitudes higher than 40� in the troposphere. A Fvalue of 0 MeV corresponds to a quiet Sun, a F value of1000 MeV to a very active Sun. The geomagnetic field isgiven in relative units where the present field intensity has avalue of 1. Note the highly nonlinear relationship betweenthe 10Be production rate and both, the heliospheric and thegeomagnetic modulation.
A10105 VONMOOS ET AL.: HOLOCENE SOLAR VARIABILITY
5 of 14
A10105

Figure 4. Reconstruction of the solar activity F based on 10Be. (a) The geomagnetic dipole momentVADM (virtual axial dipole moment) with the standard deviation after Yang et al. [2000]. The right scaleis in units relative to today. (b) 10Be flux extracted from the GRIP ice core, 61-point (data at identical2-year intervals) binomial filtered (black curve). To visualize changes on longer periods a low pass filter(cutoff frequency = 1/500 years�1) (light gray curve) is applied to the original F record. The data areplotted on an inverse scale. (c) Solar modulation function F as derived from the binomial filtered 10Be(black curve) and after additionally low pass filtered (cutoff frequency = 1/500 years�1) (gray curve). Thegray band shows the 1� errors. The isolated point close to the left y-axis and the black line, respectively,represent the mean F value (�680 MeV) of the four different F reconstructions shown in Figure 2 (seecaption there and text for detail) over the time interval 1958–1990 with an indication of the range ofdifferences in the mean value of these reconstructions. Note that the point is not at the right position on thetimescale. (d) A close-up view of Figure 4c with two additional F reconstructions considering alternativeassumptions of the 10Be flux showing a rather local or global signal: the gray curve (which is almostidentical to the black curve over much of the record) represents a more local signal than the black curve andthe dashed black curve represents a global production signal (see text for detail). The dotted black curveshows the F record ofMcCracken et al. [2004] covering the past 1100 years for comparison. This close-upview further displays the recent grand solar minima in more detail, with S = Sporer Minimum (1415–1535 AD), W = Wolf Minimum (1280–1340 AD), and O = Oort Minimum (1010–1050 AD).
A10105 VONMOOS ET AL.: HOLOCENE SOLAR VARIABILITY
6 of 14
A10105

geomagnetic field values (Figure 4a) and numericallyresampled it to get the same time resolution as in the caseof 10Be, see below.[24] Past 10Be production rates are derived from the
measured 10Be concentrations in the GRIP ice core. In afirst step, the 10Be concentration was converted into fluxesusing the accumulation rate of Johnsen et al. [1995]. Thedata set was numerically resampled by linear interpolationto a constant time interval of 2 years. The short-term scatterin the 10Be record, probably caused by short-term changesin meteorological conditions, was removed by applying a61-point binomial filter. Its effect is similar to a 25-yearrunning mean (Figure 4b). Thereby, both the poorlyresolved 11-year solar cycle and the weak 22-year magneticHale cycle are suppressed, but leaving changes on longertimescales, like the 88-year Gleissberg cycle [Gleissberg,1965] or decades-long grand solar minima in the 10Be fluxrecord (Figure 4b).[25] The remaining changes in the 10Be flux are assumed
to be related to variations in the atmospheric productionrate. However, until now, no physical model is available tosimulate accurately the atmospheric pathway of 10Be pro-duced in the atmosphere to its deposition site.[26] In previous publications, we assumed that the 10Be
flux to Summit in Greenland reflects the globally averaged10Be production rate. This rather simple assumption led to avery good agreement between the 10Be-based reconstruc-tions of the geomagnetic field with independent geomag-netic field records on timescales longer than 3000 years[Muscheler et al., 2005a; Wagner et al., 2000]. However,owing to the rather short residence time of weeks in thetroposphere [Raisbeck et al., 1981], an incomplete mixingof 10Be in the troposphere cannot be excluded and has to beconsidered for investigations of second-order effects. Thepolar 10Be production signal is distinctly solar modulatedbecause of the weak or missing shielding effect of thegeomagnetic field at high latitudes. Incomplete atmosphericmixing is expected to result in a larger contribution of polarproduced 10Be in the polar 10Be deposition with an in-creased imprint of solar variations compared to a 10Be fluxelsewhere on the globe. Consequently, without consider-ation of the prevailing mixing state of 10Be in the atmo-sphere, the variations in F deduced from 10Be from GRIPice core could possibly turn out to be too large. Differentdegrees of mixing of 10Be in the atmosphere and the effecton the reconstructed solar modulation will be discussed insection 6. Including a modification toward a slightly more‘‘polar biased’’ 10Be signal improves the agreement with therecord of the solar modulation function published byMcCracken et al. [2004]. However, the relative contributionof the 10Be production in the stratosphere is higher than thatof the troposphere [Masarik and Beer, 1999]. Thereforeearlier paleogeomagnetic field records obtained from the10Be data [Muscheler et al., 2005a; Wagner et al., 2000] arenot compromised by this modification because the consid-ered deviation of total mixing has a small impact on thegeomagnetic field reconstruction.[27] Because of the rather long residence time of about
1 year in the stratosphere compared to weeks in thetroposphere [Raisbeck et al., 1981], we assume that the10Be flux to Summit reflects the globally averaged 10Beproduction rate of the stratosphere but only the averaged
10Be production rate between 40� and 90� geographiclatitudes of the troposphere. This assumption of notropospheric contribution of produced 10Be from lowerlatitudes than 40� in the 10Be flux to Greenland is basedon the pattern of the general circulation of the atmo-sphere. The effective descending air current from theHadley Cell located at around 30� is assumed to removethe produced 10Be prior to its transport toward highergeographic latitudes. These assumptions are corroboratedby the finding that the source of water vapor for centralGreenland is situated in midlatitudes and did not changeover the past 10,000 years [Johnsen et al., 1989; Mayewskiet al., 1997]. However, as long as the exact atmosphericprocesses are not known, the mixing degree of 10Be in theatmosphere cannot be identified with certainty.[28] Assuming this pattern of atmospheric mixing of
10Be, we need an additional free parameter in our modelto link the 10Be flux into the Greenland ice shield to the10Be production rate. Unfortunately, for reasons relatedto the drilling technique, there is no temporal overlap ofthe GRIP 10Be record with present F values recon-structed from neutron monitor data. Therefore we selectedthe 795 year long period for which our 10Be record overlapswith the F record derived from an Antarctic ice core[McCracken et al., 2004]. Given the geomagnetic fieldintensity data, we applied iteratively the relationship ofMasarik and Beer [1999] (Figure 3) with the 10Be fluxtuned to fit best the resultant F record on this overlap partwith the corresponding mean F value in the F record ofMcCracken et al. [2004]. This mean F value is �310 MeV.However, this value was derived based on the local inter-stellar spectrum of Webber and Lockwood [2001] (dashedcurve in Figure 1). To correct for the difference betweenthis spectrum and the one we use, 90 MeV (determinedempirically) have to be added leading to a mean value forthe overlap time of �400 MeV.[29] This normalization procedure provides an indica-
tion of the relationship between the 10Be flux to the GRIPice core location and the 10Be production rate during this795 years long period and, consequently, of the thenatmospheric processes influencing the produced 10Be.Both the atmospheric mixing condition and the relation-ship between 10Be flux and 10Be production rate wereassumed to be constant throughout the entire Holocene,although changing system processes cannot totally beruled out. However, there are reasonable arguments thatsupport the assumption of stable mixing, transport, anddeposition processes during the Holocene (discussed insection 4). Implications of these system uncertainties onthe F record are discussed in sections 7 and 8.
5.2. Determination of the Error
[30] To calculate the error of the F reconstruction, weran 1000 Monte Carlo simulations taking into accountthe uncertainties both in the involved 10Be data and thegeomagnetic field intensity data. The uncertainty of thefiltered 10Be data is estimated to be 5%, which is the meanerror of the accelerator mass spectrometry (AMS) analyses,rounded up to include potential sample preparation errors.The error of the paleomagnetic field strengths is thestandard deviation specified by Yang et al. [2000]. EachMonte Carlo simulation involves 10Be and geomagnetic
A10105 VONMOOS ET AL.: HOLOCENE SOLAR VARIABILITY
7 of 14
A10105

field values randomly selected within their uncertainties,assuming Gaussian uncertainty distributions. It is importantto note that this procedure leads to an upper limit of theabsolute errors. The reason is that by selecting for eachindividual 10Be data point an independent geomagneticfield intensity based on the mean error of intervals of500–1000 years (Figure 4a), we neglect the fact that thegeomagnetic dipole field can only change on centennial tomillennial timescales. Therefore the F errors obtained inthis way are maximal absolute 1� errors. They range from�60 MeV to �290 MeV with a mean of �140 MeV forthe analyzed period. Taking into account the inertia of thegeomagnetic field, the uncertainty of the relative short-term F changes is reduced to a range from �40 MeV to�150 MeV with a mean of �80 MeV. This uncertaintyresulting from the error of the 10Be data is thus compa-rable with the different neutron monitor-based reconstruc-tions of F for the past 50 years using different models (seeFigure 2). Owing to the nonlinearity of the relationshipbetween production rate, geomagnetic dipole moment, andF, the error transformation is also nonlinear. As the 10Beproduction rate is inversely proportional to F, high Fvalues are highly sensitive to errors in low 10Be values.Low prevailing geomagnetic field intensity further ampli-fies this transformation effect of the 10Be uncertainty onthe calculated F. The error of the geomagnetic dipolemoment itself has a stronger influence on the F calculationin the low field range than in the high field range.
6. Results
[31] The record of solar activity in terms of the solarmodulation function F for about the last 9300 years, recon-structed from the geomagnetic field intensity of Yang et al.[2000] (Figure 4a) and the GRIP 10Be flux (Figure 4b),is displayed in Figure 4c. The gray error band compre-hends uncertainties resulting from errors of the 10Be dataand of the geomagnetic field intensities. Since thegeomagnetic dipole field varies only very slowly (on cen-tennial to millennium timescales) the error of the relativechanges of F on short timescales (decadal to centennial)is not affected by the absolute uncertainty of the geomag-netic field intensities and therefore much smaller thanshown by this error band. Although the F record iscalculated based on the filtered 10Be flux in which periodsshorter than about 50 years are increasingly suppressed(with periods shorter than about 22 years being almostcompletely suppressed) (black curve), the F record ischaracterized by a high and persistent variability through-out the Holocene. It clearly reproduces the well-knowngrand solar minima Sporer (1415–1535 AD), Wolf(1280–1340 AD), and Oort (1010–1050 AD), as it ishighlighted in a close-up view of the F record coveringthe past 3000 years (Figure 4d).[32] Owing to the difference in the long-term trend
between the 10Be and 14C record, statements on absoluteF values and on long-term changes have to be made withcaution (see sections 7 and 8). In addition, the absolutevalues depend on the normalization, for which we rely onthe mean F value in McCracken et al.’s [2004] F record forthe overlap time with our F record. Nevertheless, thisnormalization looks reasonable in the sense that it does
not reveal systematically negative F values nor extremelyhigh F values exceeding significantly the recent rather highF estimates (see Figure 2).[33] The timing and the relative amplitude of short-term
fluctuations of F, however, are much more certain since theproduction rate dependency on the geomagnetic field inten-sity and the solar modulation are well known [Masarik andBeer, 1999]. The relative amplitude only depends slightlyon the normalization due to the nonlinearity of thosedependencies. The uncertainty of the relative amplitudedue to the unknown mixing degree of 10Be in the atmo-sphere is considerably reduced as in this case the latter canbe constricted quite well (see below). Therefore the strengthof the records is the relative amplitude of solar modulationchanges during the Holocene.[34] To visualize the amplitude dependency of the F
record on the mixing assumption for the 10Be flux toSummit, two additional records were calculated consideringalternative degrees of mixing (Figure 4d). One record isbased on the assumption that the 10Be flux reflects theglobally averaged production rate and the other one that the10Be flux reflects the globally averaged stratospheric pro-duction rate but only the averaged tropospheric productionrate within 60� and 90� geographic latitudes. We considerthe latter as rather unlikely because of the midlatitudesource of water vapor for Greenland [Johnsen et al.,1989; Mayewski et al., 1997]. The smaller the degree ofatmospheric mixing of 10Be, the smaller the amplitude ofthe resulting F record. However, as the relative 10Beproduction in the globally mixed stratosphere is muchhigher than in the restricted troposphere, the effect of thesedifferent assumptions is small. To evaluate our mixingapproaches, we compare our reconstruction with the solarmodulation record for the past 1100 years (22-year aver-ages) estimated by McCracken et al. [2004] (Figure 4d).The assumption that 10Be does not reflect a globally mixedtroposphere improves the agreement with McCracken et al.[2004]. However, even the assumption of a rather local 10Besignal at Summit (tropospheric component restricted to 60�to 90� geographic latitudes) results in a F record with alarger amplitude than that of McCracken et al.’s [2004] Frecord. It is important to note that the amplitude ofMcCracken et al.’s [2004] F record itself depends on theassumption of an incomplete mixing of the used 10Be fromthe South Pole record, which they corrected for by involvingan atmospheric mixing model (M3) [McCracken, 2004].An above-average contribution of the high latitudes to the10Be signal is concordant with results obtained by Steig et al.[1996] and Bard et al. [1997], who compared the amplitudeof solar modulation of 10Be with that of cosmic rays and 14C,respectively. However, these investigations are restricted toAntarctica and probably not transferable to other regions.Because Greenland’s precipitation source lies in midlati-tudes we consider the mixing model (M3) used byMcCracken et al. [2004] to be too restrictive for the GRIP10Be data. New calculations of the 14C production rate andthe resulting solar modulation changes for the last millenni-um also indicate a higher variability in solar activity than theone given by McCracken et al. [2004; Muscheler et al.,2006]. Owing to the nonlinear relationship between F and10Be production rate (see Figure 3), high F values are moresensitive to the considered mixing degree of 10Be in the
A10105 VONMOOS ET AL.: HOLOCENE SOLAR VARIABILITY
8 of 14
A10105

atmosphere than low F values. Therefore the larger ampli-tude in our curve compared to the amplitude in the curve ofMcCracken et al. [2004] is mainly expressed in higher solarmaxima than those of McCracken et al.’s [2004] record.[35] TheF record shows various periods of highly variable
solar activity, especially pronounced around 700, 1850, 2650,and 5950 years BP when the filtered F values shifted up to470 MeV within �20 years. The most stable periods arecentered around 1500, 4850, 5250, and 8350 years BP,showing a smaller variability in comparison to the 50 yearslong present neutron monitor era. Spectral analysis distinctlyreveals the known solar cycles at periodicities of 88 years(Gleissberg cycle) and 208 years (De Vries cycle).[36] The values of our F record varied generally in the
range of 0 MeV to 1070 MeV. Our record shows somevalues which lie below 0 MeV which cannot represent a realstate of the Sun (0 MeV is defined as no solar modulation).However, within the 1� error (see section 5.2) all negative
values of F are in agreement with F � 0 MeV, except forthe negative peaks around 5670 and 7210 years BP. Thedistribution of the filtered F values in this solar activityrecord shows that F values around 300 MeV are mostfrequent. The arithmetic mean of the record is �370 MeV(see gray histogram in Figure 5), which is lower than themean F value of 550 MeV over a few millions of yearsproposed by Masarik and Reedy [1994].[37] Obvious are several modes of temporary reduced
solar activity throughout the Holocene analogous to thehistorical grand solar minima confirming clearly the largervariability potential of the Sun on longer timescales thanobserved during the �50 years long period of neutronmonitors. The weakest historical grand solar minimumreproduced in our F record is the Oort Minimum. Overall,the Sun’s activity was for about 35% of the investigatedtime in a status comparable to a grand solar minimum as theOort Minimum with a mean of �280 MeV. Between 7100and 7650 years BP the Sun’s activity was constantly thatlow, interrupted only once by 20 years. Grand solar minimacomparable to the most pronounced Sporer Minimum in ourF record (mean (�150 MeV), minimum (�0 MeV), andmaximum (�340 MeV)), however, occurred for about 8%of the investigated time (e.g., extending over 300 yearsaround 7250 years BP). On the other hand, there wereseveral time periods as long or longer than the neutronmonitor era with similar or higher solar modulation com-pared to the last 50 years (around 1650 and 2400 years BP,with the highest mean F value over 50 years of �860 MeVaround 1650 years BP). These periods of high solar activityextended over about 1% of the investigated time. Takinginto consideration the maximal uncertainty of our F recon-struction, that is, the lower and upper limit of the error band,we estimate that such periods of high solar activity covered0% (lower limit of the error band) and 11% (upper limit ofthe error band), respectively, of the investigated 9000 years.In all, irrespective of the duration, the filtered F values werefor about 7% (1% and 18% considering the lower and upperlimit of the 1� error band, respectively) of the investigatedtime higher than during the neutron monitor era. Thepresent neutron monitor era with a mean F value of about680 MeV is among the periods with the highest level ofsolar activity for the past 9300 years. However, our F recordclearly indicates that the present Sun’s high activity periodis not so unusual regarding the entire Holocene.
7. Assessment of the Record’s UncertaintiesConcerning its Long-Term Trend
[38] The reconstructed F record displays a long-termtrend (Figure 4c). Inferring a varying solar activity on suchlong timescales is not possible as long as the mentioneduncertainties considering possible system effects of the 10Berecord exist and geomagnetic field reconstructions duringthe Holocene exhibit such large errors. Within the uncer-tainties, the long-term changes in 10Be can be completelyexplained by the changes in the geomagnetic dipole field[Muscheler et al., 2005a; Wagner et al., 2000]. Taking intoaccount the calculated errors of the F reconstruction, thelong-term trend in F in fact turns out not to be significant,indicating that possible system effects on the 10Be fluxwould be small. Therefore the observed long-term trend in
Figure 5. The distribution of F values during theHolocene in a histogram with a class width of 50 MeV.Note that the absolute F values are dependent on therequired normalization and on the long-term trend of the Frecord, which is still uncertain. The histogram in gray showsthe counts of F values of the presented record based onthe 61-point (at identical 2-year intervals) binomial filtered10Be flux. F varied in the range of 0 MeV to 1070 MeV,with most values around 300 MeV. The mean F value ofthe record is �370 MeV, the median �360 MeV, and thestandard deviation �190 MeV. The hatched histogramresults from the reconstruction of F14C using the 61-point(at identical 2-year intervals) binomial filtered 14Cproduction rate of Stuiver and Braziunas [1988] insteadof 10Be. This F14C record ranged between 50 MeV and1340 MeV during the 9000 years correspondent to the10Be-based F record. Most values are around 550 MeV.The mean value of the F14C record is �550 MeV, themedian �540 MeV, and the standard deviation �200 MeV.The arrow indicates the position of the average modulationfunction of the past 50 years (710 MeV) as derived byMasarik and Beer [1999].
A10105 VONMOOS ET AL.: HOLOCENE SOLAR VARIABILITY
9 of 14
A10105

the presented F record is most likely caused by an incom-plete elimination of the geomagnetic field influence on the10Be flux and/or a slight long-term change in the climatesystem. However, long-term changes in solar activity cannotbe excluded either.[39] The analysis of additional 10Be records from other
ice cores (e.g., Dronning Maud Land, Antarctica) as well asthe modeling of the atmospheric pathway of 10Be after itsproduction until its deposition, both works in progress, willcontribute to clarify the source of the long-term trend byidentifying local climatic influences on the 10Be records inmore detail. Furthermore, improved geomagnetic fieldrecords are required to eliminate the geomagnetic fieldeffect on the 10Be production rate with more certainty,especially as the geomagnetic field record of Yang et al.[2000] is possibly biased by the globally nonuniformdistribution of the measured samples (located mostly inEurope and Asia). New reconstructions of the geomagneticdipole field [Korte and Constable, 2005] generally showlower values and a different long-term trend than Yang et al.[2000] which is in better agreement with the long-term trendof the GRIP 10Be flux. Accordingly, a F reconstructionusing this geomagnetic field record will result in a different,smaller, long-term trend.[40] The uncertainty of the long-term trend of the radio-
nuclide record is not included in the assessed 1� error, asthe latter considers the error of the 10Be data regarding itsmeasurement but not possible system effects. However, thisuncertainty has no impact on the determination of the short-term changes in F apart from the effect due to the nonlin-earity of the relationship between F and 10Be. However, ithas to be considered when comparing absolute values ofthis F record throughout the Holocene.
8. Evaluation and Discussion of the Long-TermTrend in the FFF Record
[41] For a critical evaluation of the observed long-termtrend of F, we alternatively calculated F using the 14Cproduction rate from Stuiver and Braziunas [1988] with theproduction rate calculations for 14C from Masarik and Beer[1999]. The two radionuclide records are in good agreementconsidering their short-term variations but show discrep-ancies in their long-term trend presumably related tochanged long-term system effects in either cosmogenicradionuclide record. Thus a comparison between the re-spective F records allows a first quantitative assessment ofthe impact of these system uncertainties on the long-termtrend of the presented F record.[42] The 14C production rate is corrected for the carbon
cycle effect on the atmospheric 14C concentration by acarbon cycle model [Stuiver and Braziunas, 1988]. Therecord of the 14C production rate covers the entire Holocenebased on a D14C record with a time resolution of 10 years.To account for the 12C accumulation in the atmosphere dueto the combustion of fossil fuel since the industrialization(Suess [1953] effect), we did not use the last 150 years ofthe 12C production rate record of Stuiver and Braziunas[1988]. We filtered the data in the same way as the 10Be flux(61-point binomial filter, with data previously linearlyinterpolated at identical 2-year intervals). Owing to theatmospheric residence time of 4–5 years, 14C is assumed
to be well mixed within the atmosphere. Using the knowndependency of the global 14C production rate on F and thegeomagnetic field intensity [Masarik and Beer, 1999] alongwith the geomagnetic field intensity record of Yang et al.[2000], the corresponding solar modulation function F canbe calculated. According to the 10Be-based F record, the14C-based F record was normalized in order to obtain anaverage F value consistent with McCracken et al.’s [2004]F record (see section 5.1).[43] Figure 6 shows the record of the solar modulation
function F resultant from the filtered global 14C productionrate for the past 11,450 years. This F record is indicated inthe following as F14C, whereas F without index refers to the10Be-based F record. Like the F record, this F14C recordreveals periods with a highly variable solar activity alter-nating with much more stable periods. High variabilitycharacterizes especially the times at 6000, 8100, 8850,and 9150 years BP with a shift of the filtered F14C valuesof up to 490 MeV within �20 years. The most stableperiods were around 3000, 3900, 5900, and 7000 yearsBP, showing a smaller variability in comparison with thepresent neutron monitor era.[44] As expected from the involved radionuclide data, the
comparison of the F14C record with the F record revealssomewhat different long-term trends of the two records.Apart from a potential incomplete elimination of the geo-magnetic field effect as a result of the large geomagneticfield record uncertainty, the long-term trend of the F14C
record can be most probably attributed to changing systemeffects in the 14C record, possibly due to carbon cycle modeluncertainties [Muscheler et al., 2005a]. However, changesin the 10Be record or both records cannot be excluded.Owing to the same normalization of both F records withMcCracken et al.’s [2004] F record in their overlap timeperiod, the F14C record displays systematically highervalues (on average �250 MeV) in the early and middleHolocene than the F record (Figure 6).[45] As a result of the uncertainty of the long-term trend
and the normalization, the absolute F14C values are not asreliable as the relative amplitude of short-term changes ofF14C. The presented filtered F14C record extended over therange 50–1810 MeV with a mean value of �610 MeV. Forthe following discussion we consider only the 9000 yearscorresponding to the 10Be-based F record in which theF14C values varied between 50 and 1340 MeV with amean value of �550 MeV (and where carbon cycle modelerrors due to uncertain starting condition are of minorimportance [Muscheler et al., 2005a]). Figure 5 shows thedistribution of the filtered F14C (hatched histogram) withmost values being around 550 MeV and only a few valuesover 1100 MeV. The filtered F14C values of our reconstruc-tion indicate for about 4% of the 9000 years a solar activitystatus at least as low as the Oort Minimum with a mean of�190 MeV. These periods were all centered in the lateHolocene. For the Sporer Minimum (mean (�150 MeV),minimum (�80 MeV), and maximum (�240 MeV)) nocounterpart was found in our F14C record, and therefore itcould be considered as unique in the Holocene if the long-term trend indicated by 14C indeed would be correct. Forabout 27% of the investigated time the F14C values werehigher than during the 50 years long neutron monitorperiod. Especially in the early and middle Holocene were
A10105 VONMOOS ET AL.: HOLOCENE SOLAR VARIABILITY
10 of 14
A10105

many periods lasting as long or longer than the neutronmonitor era with similar or higher solar modulation, thatis 21% of the 9000 years. There was one period around8800 years BP displaying even a 320-year average F14C
value of �870 MeV. These calculations yield the sameresult as the 10Be-based reconstruction, i.e., that today’ssolar activity is not that exceptional.[46] The comparison of the two F records gives a good
impression of the uncertainty range in the F record due tothe uncertain long-term trend in the radionuclide records, as,most probably, the true F values lie somewhere in betweenthe two F records. It shows that, e.g., changes in the 10Beflux in the order of only 10% in the early and middleHolocene due to possible long-term changes in the atmo-spheric transport processes or in the precipitation rate wouldbe sufficient to remove the discrepancy between the two F14
records. Since the uncertainties of the available data are inthis order of magnitude, we cannot pinpoint where thecauses for these differences between the two radionucliderecords lie. A long-term difference of only 10% justifies ourprevious general assumption of a constant 10Be transportand deposition at Summit during the Holocene and that thechanges in the 10Be flux are dominated by variations in the10Be production rate.[47] Concerning their short-term structures, the two F
records agree generally very well what provides highconfidence in the short-term F reconstruction. To illustratethis similarity, both F records were high pass filtered(cutoff frequency 1/2000 years�1) and displayed togetherin Figure 7. On closer examination, however, small differ-ences in the amplitude between the two reconstructionsreveal temporal changes in the 10Be transport and deposi-
tion at Summit during the Holocene and/or a temporaryincorrect 14C production rate calculation due to changes inthe carbon cycle. Except in the early Holocene, theamplitude of the F record is generally slightly larger thanthat of the F14C record. Leads and lags in the F recordrelative to the F14C record are most probably the result ofuncertainties in the ss09 timescale of the GRIP ice core.[48] Using two different radionuclide records thus enables
a more precise assessment of the uncertainties of the Freconstruction. Apart from the known uncertainty of theinvolved geomagnetic field record, the reconstruction withthe two cosmogenic radionuclide records uncovers disre-garded system effects on long timescales of at least oneradionuclide record. Up to now, it is not possible toconclude if either of the radionuclide records is correctand thus the long-term trend of the respective F recordcaused only by an imperfect elimination of the geomagneticfield influence. With an improved geomagnetic field record,the possible uncertainty of the used radionuclide record willbe a deciding factor for the interpretation of the long-termchanges in F. Therefore detailed system investigations arerequired regarding both the atmospheric mixing, transport,and deposition processes of 10Be and possible carbon cyclechanges concerning the atmospheric concentration of 14C.[49] Solanki et al. [2004] reconstructed sunspot numbers
for the past 11,450 years based on basically the same 14Crecord but concluded a current high solar activity levelunprecedented in intensity as well as in duration for thelast 8000 years. Unlike our F reconstruction, they recon-structed a solar activity parameter (sunspots) related to themagnetic flux at the photosphere. This implicates anadditional uncertainty because the used proxy data (14C)
Figure 6. Reconstructed solar activity record in terms of the solar modulation function F based on the14C production rate of Stuiver and Braziunas [1988] and the geomagnetic field record of Yang et al.[2000] for the past 11,450 years. The black curve shows F14C resultant from the 61-point (at identical2-year intervals) binomial filtered 14C production rate. A low pass filter (cutoff frequency = 1/500 years�1)(gray curve) is applied to visualize changes on longer time scales. The isolated point on the left hand sideand the black line, respectively, mark the mean F value during the neutron monitor era (�680 MeV)including the range of the differences of these reconstructions (see Figure 2 and text for detail). The lightgray curve displays the low pass filtered 10Be-based F record from Figure 4c for comparison.
A10105 VONMOOS ET AL.: HOLOCENE SOLAR VARIABILITY
11 of 14
A10105

are related to the open magnetic flux whose connection tothe closed magnetic flux is only poorly understood.However, most important is that our F reconstructionindicates that Solanki et al.’s [2004] main statement basedon the long-term trend needs to be reconsidered since ouranalysis indicates that neither the 10Be nor the 14C recordsupports their conclusions.
9. Conclusions and Outlook
[50] Cosmogenic radionuclides like 10Be and 14C have alarge potential to reconstruct past solar activity. Taking thepast changes in geomagnetic dipole field intensity intoaccount, a quantitative record of solar activity in terms ofthe solar modulation function F has been calculated for thepast 9300 years.[51] The F record is characterized by a high short-term
variability of solar activity throughout the entire Holocene.The reconstructed solar activity record is a robust recordregarding the relative amplitude and the occurrence of short-term (decadal to centennial) variations in F, that is, thedetection of periods of a high or low variability, or ofperiods of generally high or low solar activity levels andthus of grand solar minima. As far as the long-term trend isconcerned there is a slight discrepancy between the recon-structions based on 10Be and 14C. Whether this discrepancyis mainly due to changes in the 14C or the 10Be systemcannot yet be decided without further information.[52] The F record provides a quantitative parameter of
solar activity with a long-term perspective in the field ofsolar and cosmic ray physics compared to the decadal andcentennial long direct solar activity proxies and neutronmonitor records of the past 50 years. Furthermore, thisdetailed record of F has a large impact on the investigationof past solar forcing on Earth’s climate as it provides a verypromising basis for solar irradiance reconstructions.
[53] Comparing the solar activity of the last 50 years withthe presented F record, it is obvious that the recent neutronmonitor records reflect a solar activity not representativeregarding the average state of the Sun during the Holocenefor two reasons. (1) The variability of F during the neutronmonitor period is much smaller than the average variabilityduring the Holocene. (2) The level of solar activity over thepast 50 years is indeed high. However, looking at the solaractivity record for the entire Holocene, this high level ofsolar activity and its duration is rare but not outstanding.Both 10Be and 14C indicate that there were various periodsof a similar length as the neutron monitor era where similaror higher F conditions occurred. This is in contrast to thestudies of Usoskin et al. [2003] and Solanki et al. [2004]who did not find comparable high solar activity periods forthe past 1150 and 8000 years, respectively, and thereforeclaim that there has been an exceptionally active Sun sincethe 1940s.[54] The accuracy of the absolute values of the presented
F record will significantly be enhanced by an improvedgeomagnetic field record. Further research is needed on10Be records from other ice cores concerning variablesystem effects and on the 14C production rate calculationto better constrain the long-term trend of the reconstructedsolar activity records.
[55] Acknowledgments. We would like to thank Irene Brunner fromthe EAWAG and Peter W. Kubik from the AMS facility at ETH in Zurichfor sample preparation and taking care of the 10Be measurements,respectively. This work was supported by the Swiss National ScienceFoundation.[56] Shadia Rifai Habbal would like to thank Claus Frohlich and two
other referees for their help in evaluating this paper.
ReferencesBaliunas, S., and R. Jastrow (1990), Evidence for long-term brightnesschanges of solar-type stars, Nature, 348, 520–523.
Figure 7. Comparison of F reconstructed from 10Be (black curve) with F reconstructed from the 14Cproduction rate (F14C, gray curve). Both F records are high pass filtered (cutoff frequency 1/2000 years�1)to remove their different long-term trends.
A10105 VONMOOS ET AL.: HOLOCENE SOLAR VARIABILITY
12 of 14
A10105

Bard, E., G. M. Raisbeck, F. Yiou, and J. Jouzel (1997), Solar modulationof cosmogenic nuclide production over the last millennium: comparisonbetween 14C and 10Be records, Earth. Planet. Sci. Lett., 150, 453–462.
Bard, E., G. M. Raisbeck, F. Yiou, and J. Jouzel (2000), Solar irradianceduring the last 1200 years based on cosmogenic nuclides, Tellus, Ser. B,52, 985–992.
Baumgartner, S., J. Beer, M. Suter, B. Dittrich-Hannen, H.-A. Synal, P. W.Kubik, C. Hammer, and S. Johnsen (1997a), Chlorine 36 fallout in theSummit Greenland Ice Core Project ice core, J. Geophys. Res., 102,26,659–26,662.
Baumgartner, S., J. Beer, G. Wagner, P. W. Kubik, M. Suter, G. M.Raisbeck, and F. Yiou (1997b), 10Be and dust, Nucl. Instrum. MethodsPhys. Res., Sect. B, 123, 296–301.
Beer, J. (2000a), Long-term indirect indices of solar variability, Space Sci.Rev., 11, 53–66.
Beer, J. (2000b), Neutron monitor records in broader historical context,Space Sci. Rev., 93, 107–119.
Beer, J., S. M. Tobias, and N. O. Weiss (1998), An active Sun throughoutthe Maunder minimum, Solar Phys., 181, 237–249.
Bond, G., B. Kromer, J. Beer, R. Muscheler, M. N. Evans, W. Showers,S. Hoffmann, R. Lotti-Bond, I. Hajdas, and G. Bonani (2001), Persis-tent solar influence on North Atlantic climate during the Holocene,Science, 294, 2130–2136.
Bonino, G., G. Cini Castagnoli, D. Cane, C. Taricco, and N. Bhandari(2001), Solar modulation of the galactic cosmic ray spectra sincethe Maunder minimum, paper presented at ICRC 2001, CopernicusGesellschaft 2001, Hamburg, Germany.
Caballero-Lopez, R. A., and H. Moraal (2004), Limitations of the forcefield equation to describe cosmic ray modulation, J. Geophys. Res., 109,A01101, doi:10.1029/2003JA010098.
Caballero-Lopez, R. A., H. Moraal, K. G. McCracken, and F. B. McDonald(2004), The heliospheric magnetic field from 850 to 2000 AD inferredfrom 10Be records, J. Geophys. Res., 109, A12102, doi:10.1029/2004JA010633.
Cini Castagnoli, G., and D. Lal (1980), Solar modulation effects in terres-trial production of carbon-14, Radiocarbon, 22, 133–158.
Denton, G. H., and W. Karlen (1973), Holocene climatic variations - theirpattern and possible cause, Quat. Res., 3, 155–205.
Eddy, J. A. (1976), The Maunder Minimum, Science, 192, 1189–1201.Finkel, R. C., and K. Nishiizumi (1997), Beryllium-10 concentrations in theGreenland ice sheet project 2 ice core from 3–40 ka, J. Geophys. Res.,102, 26,699–26,706.
Fleitmann, D., S. J. Burns, M. Mudelsee, U. Neff, J. Kramers, A. Mangini,and A. Matter (2003), Holocene forcing of the Indian Monsoon recordedin a stalagmite from Southern Oman, Science, 300, 1737–1739.
Frohlich, C., and J. Lean (1998), The Sun’s total irradiance: Cycles, trendsand related climate change uncertainties since 1976, Geophys. Res. Lett.,25, 4377–4380.
Frohlich, C. (2006), Solar irradiance variability since 1978: Revision of thePMOD composite during solar cycle 21, Space Sci. Rev, in press.
Gleeson, L. J., and W. I. Axford (1968), Solar modulation of galacticcosmic rays, Astrophys. J., 154, 1011–1018.
Gleissberg, W. (1965), The eighty-year solar cycle in auroral frequencynumbers, J. Br. Astron. Assoc., 75, 227.
Haigh, J. D. (1994), The role of stratospheric ozone in modulating the solarradiative forcing of climate, Nature, 370, 544–546.
Haigh, J. D. (1996), The Impact of solar variability on climate, Science,272, 981–984.
Haigh, J. D. (1999), Modelling the impact of solar variability on climate,J. Atmos. Sol. Terr. Phys., 61, 63–72.
Hall, J. C., and G. W. Lockwood (2004), The chromospheric activity andvariability of cycling and flat activity solar-analog stars, Astrophys.J., 614, 942–946.
Hodell, D. A., M. Brenner, J. H. Curtis, and T. Guilderson (2001), Solarforcing of drought frequency in the Maya lowlands, Science, 292, 1367–1370.
Hoyt, D. V., and K. H. Schatten (1998), Group sunspot numbers: a newsolar activity reconstruction, Solar Phys., 179, 189–219.
Johnsen, S. J., W. Dansgaard, and J. W. C. White (1989), The origin ofArctic precipitation under present and glacial conditions, Tellus, Ser. B,41, 452–468.
Johnsen, S. J., D. Dahl-Jensen, W. Dansgaard, and N. Gundestrup (1995),Greenland palaeotemperatures derived from GRIP bore hole temperatureand ice core isotope profiles, Tellus, Ser. B, 47, 624–629.
Johnsen, S. J., et al. (1997), The �18O record along the Greenland Ice CoreProject deep ice core and the problem of possible Eemian climaticinstability, J. Geophys. Res., 102, 26,397–26,410.
Korte, M., and C. Constable (2005), Continuous geomagnetic field modelsfor the past 7 millennia: 2. CALS7K, Geochem. Geophys. Geosyst., 6,Q02H16, doi:10.1029/2004GC000801.
Lal, D., and B. Peters (1967), Cosmic ray produced radioactivity on theEarth, in Handbuch fur Physik, edited by S. Flugge, pp. 551–612,Springer, New York.
Lean, J., and D. Rind (1999), Evaluating sun-climate relationships since theLittle Ice Age, J. Atmos. Sol. Terr. Phys., 61, 25–36.
Lean, J., J. Beer, and R. Bradley (1995), Reconstruction of solar irradiancesince 1610: implications for climate change, Geophys. Res. Lett., 22,3195–3198.
Legrand, J. P., and P. A. Simon (1987), Two hundred years of auroralactivity (1780–1979), Ann. Geophys., 5a, 161–168.
Lockwood, G. W. (1994), Irradiance variations of stars, in The Sun as aVariable Star: Solar and Stellar Irradiance Variations, edited by J. M.Pap et al., pp. 20–27, Cambridge Univ. Press, New York.
Lockwood, M. (2004), Solar outputs, their variations and their effects onEarth, in Saas-Fee Advanced Course 34: The Sun, Solar Analogs and theClimate, edited by I. Ruedi, M. Gudel, and W. Schmutz, pp. 109–289,Springer, New York.
Magny, M. (1993), Solar influences on Holocene climatic changes illu-strated by correlations between past lake-level fluctuations and the atmo-spheric 14C record, Quat. Res., 40, 1–9.
Masarik, J., and J. Beer (1999), Simulation of particle fluxes and cosmo-genic nuclide production in the Earth’s atmosphere, J. Geophys. Res.,104, 12,099–13,012.
Masarik, J., and R. C. Reedy (1994), Effects of bulk chemical compositionon nuclide production processes in meteorites, Geochim. Cosmochim.Acta, 58, 5307–5317.
Mayaud, S. N. (1973), A hundred year series of geomagnetic data 1868–1967, Indices aa, Storm sudden commencements, Bull. Int. Assoc. Geo-magn. Aeron., 33, 1–251.
Mayewski, P. A., L. D. Meeker, M. S. Twickler, S. Whitlow, Q. Yang,W. B. Lyons, and M. Prentice (1997), Major features and forcing ofhigh-latitude northern hemisphere atmospheric circulation using a110,000 year-long glaciochemical series, J. Geophys. Res., 102,26,345–326,366.
McCracken, K. G. (2001), Variations in the production of 10Be due tothe 11 year modulation of the cosmic radiation, and variations in thevector geomagnetic dipole, paper presented at ICRC 2001, CopernicusGesellschaft 2001, Hamburg, Germany.
McCracken, K. G. (2004), Geomagnetic and atmospheric effects upon thecosmogeic 10Be observed in polar ice, J. Geophys. Res., 109, A04101,doi:10.1029/2003JA010060.
McCracken, K. G., and F. B. McDonald (2001), The long term modulationof the galactic cosmic radiation, 1500–2000, paper presented at ICRC2001, Copernicus Gesellschaft 2001, Hamburg, Germany.
McCracken, K. G., F. B. McDonald, J. Beer, G. M. Raisbeck, and F. Yiou(2004), A phenomenological study of the long-term cosmic ray modula-tion, 850 –1958 AD, J. Geophys. Res., 109, A12103, doi:10.1029/2004JA010685.
Muscheler, R., J. Beer, G. Wagner, C. Laj, C. Kissel, G. M. Raisbeck,F. Yiou, and P. W. Kubik (2004), Changes in the carbon cycle duringthe last deglaciation as indicated by the comparison of 10Be and 14Crecords, Earth. Planet. Sci. Lett., 219, 325–340.
Muscheler, R., J. Beer, P. W. Kubik, and H.-A. Synal (2005a), Geomagneticfield intensity during the last 60,000 years based on 10Be & 36Cl fromthe Summit ice cores and 14C, Quat. Sci. Rev., doi:10.1016/j.quascirev.2005.1001.1012.
Muscheler, R., F. Joos, S. A. Muller, and I. Snowball (2005b), Not sounusual-today’s solar activity, Nature, 436, doi:10.1038/nature04045.
Muscheler, R. F. Joos, J. Beer, S. A. Muller, M. Vonmoos, and I. Snowball(2006), Solar activity during the last 1000 yr inferred from radionucliderecords, Quat. Sci. Rev, doi:10.1016/j.quascirev.2006.07.012.
Neff, U., S. J. Burns, A. Mangini, M. Mudelsee, D. Fleitmann, and A. Matter(2001), Strong coherence between solar variability and the monsoon inOman between 9 and 6 kyr ago, Nature, 411, 290–293.
Parker, E. N. (1965), The passage of energetic charged particles throughinterplanetary space, Planet. Space Sci., 13, 9–49.
Radick, R. R., G. W. Lockwood, and S. L. Baliunas (1990), Stellar activityand brightness variations: a glimpse at the Sun’s history, Science, 247,39–247.
Raisbeck, G. M., F. Yiou, M. Fruneau, J. M. Loiseaux, M. Lieuvin, andJ. C. Ravel (1981), Cosmogenic 10Be/7Be as a probe of atmospherictransport processes, Geophys. Res. Lett., 8, 1015–1018.
Reid, G. C. (1991), Solar total irradiance variations and the global seasurface temperature record, J. Geophys. Res., 96, 2835–2844.
Ribes, E., B. Beardsley, T.-M. Brown, P. Delache, F. Laclare, J.-R. Kuhn,and N.-V. Leister (1991), The variability of the solar diameter, in Sunin Time, edited by C. Sonnet, M. S. Giampapa, and M. S. Matthews,pp. 59–97, Univ. of Ariz. Press, Tucson.
Rind, D. (2002), The Sun’s role in climate variations, Science, 296,673–677.
A10105 VONMOOS ET AL.: HOLOCENE SOLAR VARIABILITY
13 of 14
A10105

Shindell, D., G. A. Schmidt, M. E. Mann, D. Rind, and A. Waple (2001),Solar forcing of regional climate change during the Maunder Minimum,Science, 294, 2149–2152.
Simpson, J. A. (1978), Charged-particle astronomy in the outer solar sys-tem, Astronaut. Aeronaut., 16, 96–105.
Solanki, S. K., I. G. Usoskin, B. Kromer, M. Schussler, and J. Beer (2004),Unusual activity of the Sun during recent decades compared to the pre-vious 11,000 years, Nature, 431, 1084–1087.
Steig, E. J., P. J. Polissar, M. Stuiver, P. M. Grootes, and R. C. Finkel(1996), Large amplitude solar modulation cycles of 10Be in Antarctica:implications for atmospheric mixing processes and interpretation of theice core record, Geophys. Res. Lett., 23, 523–526.
Stuiver, M., and T. F. Braziunas (1988), The solar component of the atmo-spheric 14C record, in Secular Solar and Geomagnetic Variations in theLast 10,000 Years, edited by F. R. Stephenson and A. W. Wolfendale,pp. 245–266, Springer, New York.
Stuiver, M., P. J. Reimer, E. Bard, J. W. Beck, G. S. Burr, K. A. Hughen,B. Kromer, G. McCormac, J. Van der Plicht, and M. Spurk (1998),INTCAL98 Radiocarbon age calibration, 24,000-0 cal BP, Radiocarbon,40, 1041–1083.
Suess, H. E. (1953), Natural radiocarbon and the rate of exchange of carbondioxide between the atmosphere and the sea, in Natural Radiocarbon andthe Rate of Exchange of Carbon Dioxide Between the Atmosphere andthe Sea, edited by National Research Council Committee on NuclearScience, pp. 52–56, Univ. of Chicago Press, Chicago.
Usoskin, I. G., K. Alanko, K. Mursula, and G. A. Kovaltsov (2002), Helio-spheric modulation strength during the neutron monitor era, Solar Phys.,207, 389–399.
Usoskin, I. G., S. K. Solanki, M. Schussler, K. Mursula, and K. Alanko(2003), A millennium scale sunspot number reconstruction: Evidence foran unusually active Sun since the 1940’s, Phys. Rev. Lett., 92, 211101.
Van Geel, B., J. Buurman, and H. T. Waterbolk (1996), Archaeologicaland palaeoecological indications of an abrupt climate change in TheNetherlands, and evidence for climatological teleconnections around2650 BP, J. Quat. Sci., 11, 451–460.
Verschuren, D., K. R. Laird, and B. F. Cumming (2000), Rainfall anddrought in equatorial east Africa during the past 11,000 years, Nature,403, 410–414.
Wagner, G., J. Masarik, J. Beer, S. Baumgartner, D. Imboden, P. W. Kubik,H.-A. Synal, and M. Suter (2000), Reconstruction of the geomagneticfield between 20 and 60 kyr BP from cosmogenic radionuclides in theGRIP ice core, Nucl. Instrum. Methods Phys. Res., Sect. B, 172, 597–604.
Wagner, G., J. Beer, J. Masarik, R. Muscheler, P. Kubik, W. Mende, C. Laj,G. M. Raisbeck, and F. Yiou (2001), Presence of the solar de Vries cycle(�205 years) during the last ice age, Geophys. Res. Lett., 28, 303–306.
Webber, W. R., and P. R. Higbie (2003), Production of cosmogenic Benuclei in the Earth’s atmosphere by cosmic rays: Its dependence on solarmodulation and the interstellar cosmic ray spectrum, J. Geophys. Res.,108(A9), 1355, doi:10.1029/2003JA009863.
Webber, W. R., and J. A. Lockwood (2001), Voyager and Pioneer spacecraftmeasurements of cosmic ray intensities in the outer heliosphere: Toward anew paradigm for understanding the global solar modulation process:1. Minimum solar modulation (1987 and 1997), J. Geophys. Res.,106, 29,323–29,331.
Willson, R. C. (1997), Total solar irradiance trend during solar cycles 21and 22, Science, 277, 1963–1965.
Yang, S., H. Odah, and J. Shaw (2000), Variations in the geomagneticdipole moment over the last 12000 years, Geophys. J. Int., 140, 158–162.
Yiou, F., et al. (1997), Beryllium 10 in the Greenland Ice Core Project icecore at Summit, Greenland, J. Geophys.Res., 102, 26,783–26,794.
�����������������������J. Beer and M. Vonmoos, Swiss Federal Institute of Environmental
Science and Technology, Ueberlandstrasse 133, CH-8600 Dubendorf,Switzerland. ([email protected]; [email protected])R. Muscheler, Goddard Earth Sciences and Technology Center,
University of Maryland Baltimore County, Climate and Radiation Branch,NASA Goddard Space Flight Center, Mail Code 613.2, Greenbelt, MD20771, USA. (raimund@ climate.gsfc.nasa.gov)
A10105 VONMOOS ET AL.: HOLOCENE SOLAR VARIABILITY
14 of 14
A10105