large submarine groundwater discharge and benthic eutrophication in bangdu bay on volcanic jeju...
TRANSCRIPT
Large Submarine Groundwater Discharge and Benthic Eutrophication in Bangdu Bay onVolcanic Jeju Island, KoreaAuthor(s): Dong-Woon Hwang, Yong-Woo Lee and Guebuem KimSource: Limnology and Oceanography, Vol. 50, No. 5 (Sep., 2005), pp. 1393-1403Published by: American Society of Limnology and OceanographyStable URL: http://www.jstor.org/stable/3597684 .
Accessed: 15/06/2014 15:06
Your use of the JSTOR archive indicates your acceptance of the Terms & Conditions of Use, available at .http://www.jstor.org/page/info/about/policies/terms.jsp
.JSTOR is a not-for-profit service that helps scholars, researchers, and students discover, use, and build upon a wide range ofcontent in a trusted digital archive. We use information technology and tools to increase productivity and facilitate new formsof scholarship. For more information about JSTOR, please contact [email protected].
.
American Society of Limnology and Oceanography is collaborating with JSTOR to digitize, preserve andextend access to Limnology and Oceanography.
http://www.jstor.org
This content downloaded from 193.104.110.48 on Sun, 15 Jun 2014 15:06:06 PMAll use subject to JSTOR Terms and Conditions

Limnol. Oceanogr., 50(5), 2005, 1393-1403 ? 2005, by the American Society of Limnology and Oceanography, Inc.
Large submarine groundwater discharge and benthic eutrophication in Bangdu Bay on volcanic Jeju Island, Korea
Dong-Woon Hwang, Yong-Woo Lee, and Guebuem Kim2 School of Earth & Environmental Sciences, Seoul National University, Seoul 151-742, Korea
Abstract
We estimated the submarine discharge of groundwater (SGD) and associated nutrients into the semienclosed Bangdu Bay on a volcanic island, Jeju, Korea, by analyzing 222Rn, Ra isotopes (224Ra and 226Ra), and nutrients in seawater, pore water, and coastal groundwater. The submarine inputs of groundwater into Bangdu Bay of 120-180 m3 m-2 yr-' (on the basis of 222Rn, 224Ra, 226Ra, and Si mass balances) were much higher than those reported from typical continental margins. The nutrient fluxes from SGD were about 90%, 20%, and 80% of the total input (except from open ocean waters) for dissolved inorganic nitrogen (DIN), dissolved inorganic phosphorus (DIP), and dis- solved inorganic silicate (DSi), respectively. These excess nutrient inputs from SGD are the major sources of "new nutrients" in this bay. On the basis of photosynthetic pigments and benthic algal distributions, we suggest that the large fluxes of excess nutrients from SGD can cause benthic eutrophication in a semienclosed bay on this highly permeable volcanic island.
Submarine groundwater discharge (SGD) has been rec- ognized as an important pathway for chemical constituents, such as Ra, Rn, CH4, and nutrients, from continents to the ocean (Moore 1996; Burnett et al. 2003; Hwang et al. 2005). Although only fresh groundwater input is quantified as sub- marine discharge for water balance purposes, brackish groundwater, including recirculating seawater, is an equally or often more important route for transporting continental materials into the ocean (Church 1996; Moore 1997; Kim et al. 2003a). Using a 226Ra tracer, it was estimated that the volume of groundwater could be as great as 40% of the total river flow for the South Atlantic Bight (Moore 1996). How- ever, Younger (1996) argued that the volume of groundwater recharge was only 1.7% of the freshwater discharge from rivers in the same region. On the basis of a theoretical cal- culation, Li et al. (1999) showed that groundwater circula- tion and oscillation flow, caused by wave setup and tidal actions, may constitute up to 96% of the SGD in the South Atlantic Bight. More recently, Kim and Hwang (2002) sug- gested that recirculation of seawater through the ground is even more largely controlled by spring and neap tide fluc- tuations.
The magnitudes and mechanisms of SGD are indeed poor- ly understood, since there is no accurate tool for measuring SGD because this source is invisible, slow, and spatially and temporally variable. To tackle this, recent studies have used various geochemical tracers such as 226Ra (t, = 1,620 yr), 222Rn (t,2 = 3.83 d), CH4, and Si, which are much more highly enriched in groundwater relative to seawater, for trac- ing SGD on a large space and time scale (Bugna et al. 1996;
Marine Environmental Management Team, NFRDI, Busan 619- 902, Korea.
2 Corresponding author ([email protected]).
Acknowledgments We are grateful to two anonymous reviewers for providing in-
sightful comments and suggestions that improved this manuscript. We also thank J. W. Ryu and K. S. Park, who helped with sampling and nutrient analyses. This research was supported by Korea Re- search Foundation Grant (KRF-2001-015-HS0002).
Corbett et al. 1997; Hwang et al. 2005). The fluxes of nu- trients from SGD were estimated in several coastal environments by correlating the average concentrations of nutrients in pore water or groundwater to the volume of SGD (Krest et al. 2000; Charette et al. 2001; Kelly and Moran 2002).
Thus, the objective of this study was to estimate the input of submarine groundwater and nutrients into a small coastal bay on a volcanic island, Jeju, using 222Rn, 224Ra, 226Ra, and Si mass balances. This bay of Jeju is known to have high seepage rates due to the high permeability of the rocks (Kim et al. 2003a). Pigment signatures were also measured to in- vestigate the community compositions of phytoplankton in the water column in response to the nutrient supply from SGD. In addition, benthic eutrophication was examined vi- sually at near-shore areas. Here, we chose Bangdu Bay since it serves as a unique natural SGD chamber on Jeju.
Study area and analytical methods
Study area-Jeju Island is located in the South Sea of Korea, with an area of -1,830 km2 (Fig. 1). Jeju is a shield volcano that is composed mainly of basaltic lava flows and a subordinate amount of pyroclastic and sedimentary rocks. In the central part of the island Mt. Hanla (height, -1,950 m) is located with a gentle slope from the peak to the east and the west. There is a large difference in geological struc- tures between the western and eastern parts of Jeju. A low- permeability sedimentary formation, the Seogwipo forma- tion, underlies high-permeability volcanic rocks in western Jeju, while an unconsolidated fine-sand layer underlies the thick high-permeability basaltic layer in eastern Jeju (Koh 1997; Kim et al. 2003b). Therefore, there are a number of artesian springs and wells on the western coast, while the groundwater below a few meters is composed almost entirely of recirculated seawater on the eastern coast of Jeju (Kim et al. 2003b).
Since most of the precipitation infiltrates the geologic structures rapidly, there is little sustained stream flow on the
1393
This content downloaded from 193.104.110.48 on Sun, 15 Jun 2014 15:06:06 PMAll use subject to JSTOR Terms and Conditions
Hwang et al.
126?0 5'E 126?56'
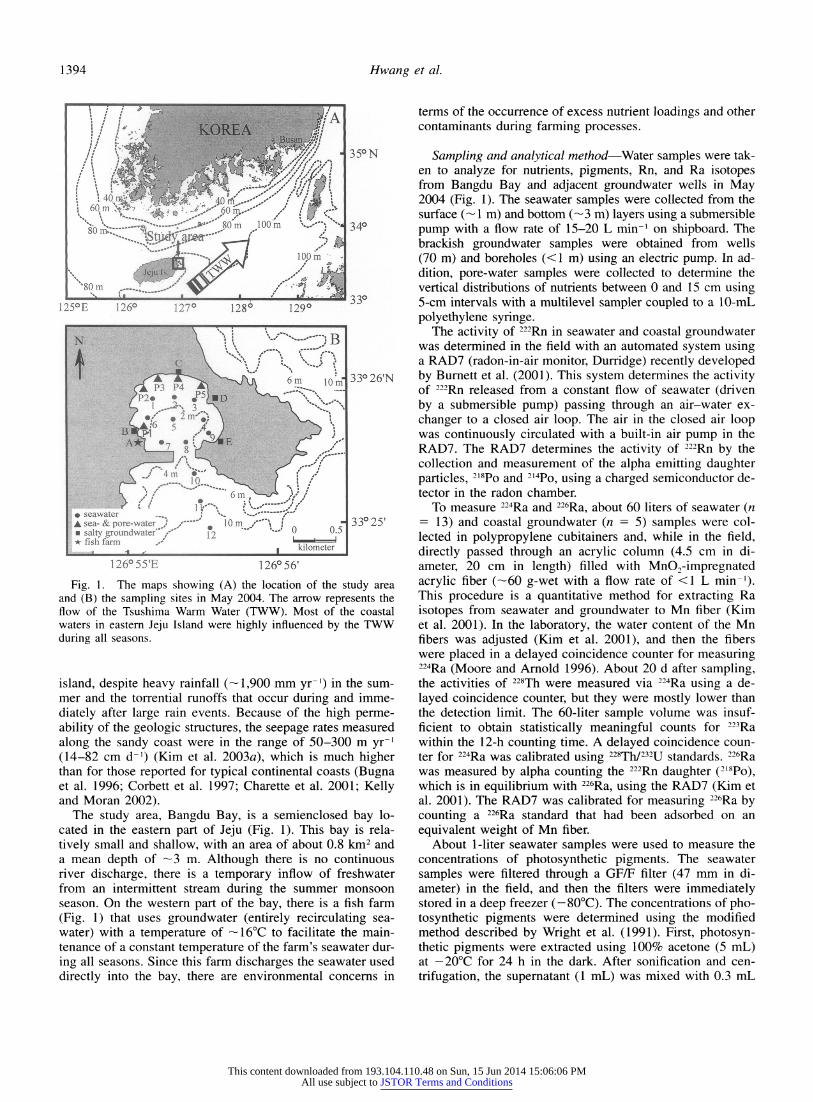
Fig. 1. The maps showing (A) the location of the study area and (B) the sampling sites in May 2004. The arrow represents the flow of the Tsushima Warm Water (TWW). Most of the coastal waters in eastern Jeju Island were highly influenced by the TWW during all seasons.
island, despite heavy rainfall (-1,900 mm yr-') in the sum- mer and the torrential runoffs that occur during and imme- diately after large rain events. Because of the high perme- ability of the geologic structures, the seepage rates measured along the sandy coast were in the range of 50-300 m yr-l (14-82 cm d-') (Kim et al. 2003a), which is much higher than for those reported for typical continental coasts (Bugna et al. 1996; Corbett et al. 1997; Charette et al. 2001; Kelly and Moran 2002).
The study area, Bangdu Bay, is a semienclosed bay lo- cated in the eastern part of Jeju (Fig. 1). This bay is rela- tively small and shallow, with an area of about 0.8 km2 and a mean depth of -3 m. Although there is no continuous river discharge, there is a temporary inflow of freshwater from an intermittent stream during the summer monsoon season. On the western part of the bay, there is a fish farm (Fig. 1) that uses groundwater (entirely recirculating sea- water) with a temperature of -16?C to facilitate the main- tenance of a constant temperature of the farm's seawater dur- ing all seasons. Since this farm discharges the seawater used directly into the bay, there are environmental concerns in
terms of the occurrence of excess nutrient loadings and other contaminants during farming processes.
Sampling and analytical method-Water samples were tak- en to analyze for nutrients, pigments, Rn, and Ra isotopes from Bangdu Bay and adjacent groundwater wells in May 2004 (Fig. 1). The seawater samples were collected from the surface (- 1 m) and bottom (-3 m) layers using a submersible pump with a flow rate of 15-20 L min-l on shipboard. The brackish groundwater samples were obtained from wells (70 m) and boreholes (<1 m) using an electric pump. In ad- dition, pore-water samples were collected to determine the vertical distributions of nutrients between 0 and 15 cm using 5-cm intervals with a multilevel sampler coupled to a 10-mL polyethylene syringe.
The activity of 222Rn in seawater and coastal groundwater was determined in the field with an automated system using a RAD7 (radon-in-air monitor, Durridge) recently developed by Burnett et al. (2001). This system determines the activity of 222Rn released from a constant flow of seawater (driven by a submersible pump) passing through an air-water ex- changer to a closed air loop. The air in the closed air loop was continuously circulated with a built-in air pump in the RAD7. The RAD7 determines the activity of 222Rn by the collection and measurement of the alpha emitting daughter particles, 28po and 214Po, using a charged semiconductor de- tector in the radon chamber.
To measure 224Ra and 226Ra, about 60 liters of seawater (n = 13) and coastal groundwater (n = 5) samples were col- lected in polypropylene cubitainers and, while in the field, directly passed through an acrylic column (4.5 cm in di- ameter, 20 cm in length) filled with MnO,-impregnated acrylic fiber (-60 g-wet with a flow rate of <1 L min-'). This procedure is a quantitative method for extracting Ra isotopes from seawater and groundwater to Mn fiber (Kim et al. 2001). In the laboratory, the water content of the Mn fibers was adjusted (Kim et al. 2001), and then the fibers were placed in a delayed coincidence counter for measuring 224Ra (Moore and Arnold 1996). About 20 d after sampling, the activities of 228Th were measured via 224Ra using a de- layed coincidence counter, but they were mostly lower than the detection limit. The 60-liter sample volume was insuf- ficient to obtain statistically meaningful counts for 223Ra within the 12-h counting time. A delayed coincidence coun- ter for 224Ra was calibrated using 228Th/232U standards. 226Ra was measured by alpha counting the 222Rn daughter (218po), which is in equilibrium with 226Ra, using the RAD7 (Kim et al. 2001). The RAD7 was calibrated for measuring 226Ra by counting a 226Ra standard that had been adsorbed on an equivalent weight of Mn fiber.
About 1-liter seawater samples were used to measure the concentrations of photosynthetic pigments. The seawater samples were filtered through a GF/F filter (47 mm in di- ameter) in the field, and then the filters were immediately stored in a deep freezer (-80?C). The concentrations of pho- tosynthetic pigments were determined using the modified method described by Wright et al. (1991). First, photosyn- thetic pigments were extracted using 100% acetone (5 mL) at -20?C for 24 h in the dark. After sonification and cen- trifugation, the supernatant (1 mL) was mixed with 0.3 mL
125?E 126? 170 1280 129?
, .. .. ," "'-o ......'o' seawater .. '.. sea- & pore-water -
' , 10 m . , -
salty groundwater"'/" " 0 0.5 fish farim '
,i -Iawa I* kilometer
1394
This content downloaded from 193.104.110.48 on Sun, 15 Jun 2014 15:06:06 PMAll use subject to JSTOR Terms and Conditions
Submarine groundwater discharge
of deionized water. The mixed solution (0.1 mL) was mea- sured by reverse-phase high-performance liquid chromatog- raphy (Waters system). The pigments were identified and quantified with authentic standards obtained from Sigma Chemical and DHI.
Temperature and salinity were measured in the field using a portable salinometer (model LF340, WTW). Nutrient (NO3, NO-, NH+, PO4-, and Si(OH)4) samples were col- lected in polyethylene bottles (-100 mL) and frozen until analysis; they were then determined using an Auto-Analyzer (TRAACS 2000, Bran+Lubbe K.K) in the laboratory. In this study, we define DIN as the sum of NO3, NO2, and NH+, DIP as PO3-, and DSi as Si(OH)4.
Results and discussion
Distribution of salinity, nutrients, 222Rn, and Ra iso- topes-The measured results for salinity, nutrients, and ra- dionuclide tracers in pore water, coastal groundwater, and seawater are shown in Tables 1, 2. Salinity in pore water and coastal groundwater ranged from 29.6 to 33.7 (mean = 31.4, n = 5) and from 30.5 to 35.9 (mean = 33.2, n = 5), respectively, which was lower than the salinity of the sea- water in the bay. The concentrations of nutrients, 222Rn, and Ra isotopes in pore water and coastal groundwater were a factor of two to three times higher than those in seawater.
The shallow coastal waters in the northwestern part of this bay showed particularly low salinity but high concentrations of nutrients, 222Rn, and Ra isotopes (Fig. 2). Such a trend could have resulted from a relatively large discharge of coastal groundwater, since there were no visible streams dur- ing the sampling period. Salinity and DSi concentrations showed a good negative correlation (r2 = 0.80), indicating a conservative behavior of Si in the bay (Fig. 3). We used Si as an SGD tracer (Hwang et al. 2005), together with 226Ra, 224Ra, and 222Rn, since the concentrations of Si were a factor of two to three times higher in coastal groundwater than in seawater. Therefore, we evaluated the magnitude of SGD and the associated nutrient fluxes in the next section using various mass balance models for chemical tracers.
0 0
CO)
013 cO
CO
C)
cO
C) I-
"C
CO CO
C)
CO
"o Co
CO Co I-1
00
CO CO
CO U~ C) COr CO
C) cO rcO
Co
"CO
CO CO CO
CO
Estimating seepage rates and water residence times using mass balances for 226Ra, 224Ra, and DSi-To establish mass balance models for 226Ra, 224Ra, and DSi, we must consider all source and sink terms for each chemical species. A sim- ple schematic for this model is shown in Fig. 4A. The input sources of DSi and Ra isotopes in Bangdu Bay include (1) discharge of the fish farm water, (2) diffusion from bottom sediments, and (3) SGD and pore water, while output sources include (1) decay of short-lived Ra isotopes and (2) tidal exchange between bay seawater and open ocean water. The changes in the concentrations of 226Ra, 224Ra, and DSi in the water column of the bay may be expressed as follows (Eqs. 1-3):
> CO "CO
CO
ct
C) I-I
CO
z
E
.,.. 1-
?
o
I
+l +1 +1 + 1 + I c ,0 o oo I I I I
C- C-- Co m
+l +l + + I I
oo in O' t-- cq
+c >+l+++ I I I I I
6 -- N
4 -4
e0000iI-3~000 0L t C) C) C) V) - t C6)
CD
C3 6 6 6 6 ; 6 6
0 cn 3 00z c Ctlo O n
E u
"CO,
CO
0
CO 7O z
bo
ON in~V 00 N N (-C N (-0 N
000 W It
cn kr CcN Cif Ct C C\l C'N Cl C )
0C N 0 N 0 C0 00 in 0t C0
- "- "- C1 Cl Cl '- Cl Cl
0 0 Cl 0 0 00 Cl c' in in in In in in in in in in in in in in in in in in in in
cl Cl C\l Cl1 Cl Cl1 Cl1 Cl1 C1 Cl
N~ Cl in 00 Cl3 Cc Cl ~t in ON c c') in ~t C t in in in ~t
in in in in in in in in in in C~l C1 Cl Cl Cl Cl Cl Cl Cl Cl3
Cc' N ) 'N l C' C c) C c C'N C CN C'N Cc
C. _0 cQ ..
1395
This content downloaded from 193.104.110.48 on Sun, 15 Jun 2014 15:06:06 PMAll use subject to JSTOR Terms and Conditions

Table 2. The concentrations of nutrients, Rn, and Ra isotopes in the seawater of Bangdu Bay in May 2004.
Location Nutrients (Jimol L-1) Ra activity
Temp. 222Rn (dpm 100 L-1) Station Latitude Longitude (?C) Salinity DIN DIP DSi (dpm L-') 224Ra 226Ra
Bay water PIS 33?25'43"N 126?55'06"E 18.1 28.3 36.9 0.10 144 P2S 33?25'52"N 126?55'06"E 18.8 31.6 27.8 0.10 117 P3S 33?25'54"N 126055'12"E 18.7 33.3 20.3 0.10 62 P4S 33?25'55"N 126?55'24"E 19.9 30.8 27.7 0.10 73 P5S 33?25'49"N 126?55'32"E 47.7 0.10 96
iS 33?25'73"N 126?55'24"E 16.5 32.7 19.7 0.68 74 9.5 2.7 24.7 -1.2 9.8+0.8 2S 33?25'74"N 126?55'30"E 16.7 33.4 13.9 0.55 58 11.6?2.6 13.4+0.9 10.3+0.8 3S 33?25'74"N 126?55'42"E 16.3 33.9 15.1 0.48 56 9.8+2.5 9.3 0.7 8.2 0.8 4S 33?25'63"N 126?55'44"E 16.8 34.4 8.4 0.59 20 6.1-2.1 12.4+0.9 9.9?0.9 5S 33?25'63"N 126?55'26"E 17.3 32.7 28.1 0.76 73 8.9?2.4 13.2?2.0 10.51+ .0 6S 33025'64"N 126?55'21"E 17.7 33.9 12.5 0.54 57 7.9+2.2 25.2+2.8 8.9+0.9 7S 33025'56"N 126?55'19"E 18.3 34.4 9.4 0.57 26 6.8+2.3 8.4+1.3 10.8?1.0 7B 16.2 34.5 7.2 0.13 18 4.2+1.9 12.3+ 1.7 24.9-0.9 8S 33?25'57"N 126?55'31"E 17.9 33.1 20.1 0.42 69 13.0+2.7 16.1 -2.6 9.9+0.7 8B 17.9 33.6 6.7 0.25 27 11.9+2.6 24.6+1.7 11.8?0.8 9S 33?25'58"N 126?55'51"E 17.0 34.2 8.0 0.05 19 4.1+1.8 8.2 0.7 12.3 0.5
Offshore water 10S 33?25'41"N 126?55'37"E 17.5 33.3 13.7 0.80 60 10B 17.0 34.2 6.6 0.45 21 IUS 33025'30"N 126?55'37"E 17.3 33.9 13.7 0.35 31 lB 16.7 33.5 8.7 0.25 19
12S 33025'18"N 126?55'56"E 16.9 34.0 13.9 0.25 32 2.8+1.6 6.4+1.1 13.5 0.9 12B 1 16.9 34.5 9.9 0.25 17 4.91+ .9 3.2+0.8 9.9+0.8 12B2 16.3 34.7 8.7 0.25 8
This content downloaded from 193.104.110.48 on Sun, 15 Jun 2014 15:06:06 PMAll use subject to JSTOR Terms and Conditions

Submarine groundwater discharge
A ^A 0 ) 1 X = - A - A - A A 33026'N 820 28 0.1 0.1 A 62 73
9 B20 *0.6 Bangdu *26 j9 Bangdu Peninsula _ A Peninsula I Peninsula
222Rn activity (dpm L-1) 224Ra activity (dpm 100 L-') 226 Ra activity (dpm 100 L-1)
Sinyangri Sinyangri Sinyangri 330 26'N
'10 2 0 25 13 . 10
i8 9 6 )25 13 1 2 s9 1 10
[' 7 ,3 3 Bangdu I 8 1 S- Bangdu 11 Bangdu I _ ^ Peninsula -- I I Peninsula - Peninsula
126?55'E 126056'126055'E 126056'126055'E 126056'
Fig. 2. The horizontal distributions of nutrients, 'Rn, and Ra isotopes in the surface seawater of Bangdu Bay in May 2004.
d226Ra = FRa-226 + FRa-226 + CRa-226 X A X Ao S;D dt Fish Diff GW Bott SGD
160 -_ I X Ra R-2 226 R-2 26 X Ra-
V AMX ( 1) 160 SW Ra-226 (EX
140A~\- d224 Ra ~140-~~ \ = FiRs224 + FRa-224 + C/Ra-224 X ABol X IS(i;L 140 dt F
\ if ~
ish Dift' GW Bott OSCGD dt Diti
\ ~~~120 ~~- __ -IRa-224 X ARa-224 C- Ra-224 VS X AM (2) 120Ra224 EX . i
dSi 2, 100- =-2.X+746 \ -
= 'Fish + FSDiff + CGW X ABO,I X ?SGD c;4 lu"y -21.0 x + 748.6
. (r2 = 0.80) - CS x X V, X AM, (3) E 80-
03; <^ \( _ where the terms on the right side of the equations represent v:CI)^~~~ 60-^^^\t~ Winput fluxes from the fish farm water (the first term), diffu- 60 - CI~~~Q 60^^^~~~~ ssion from sediments (the second term), submarine ground-
< \ ~water flow (the third term), and output fluxes from radio- 40 - active decay and mixing with open ocean water (the final
* bay seawater &2K term). The definitions and values of each term are shown in
20 - 0 open ocean water Table 3. The ingrowth term for 224Ra and 226Ra in seawater was neglected, since the activities of 22Th and "3Th in sea-
0 water were relatively negligible. At steady state, we can de- 0 ' ' '1 termine two unknown terms, AMix and sscD, using any pair
26 28 30 32 34 36 of three simultaneous equations. Here, the fluxes of each species from the fish farm (which
Salinity uses recirculating ground seawater) were estimated on the Fig. 3. Plot of salinity versus DSi in seawater of the study re- basis of the fluxes of the daily discharge of fish farm water
gion in May 2004. and the concentration in the fish farm water. The diffusive
1397
V J
This content downloaded from 193.104.110.48 on Sun, 15 Jun 2014 15:06:06 PMAll use subject to JSTOR Terms and Conditions

Hwang et al.
land
Ffish farm ?
land
Ffish farm
water column A
Ra inventory
XCRa
(decay)
Fatm
water column B
sea
Fmix
sea
/*~1 Fmix
Fig. 4. Box model showing the sources and sinks of (A) Ra isotopes and (B) Rn in the water column of Bangdu Bay.
fluxes of 226Ra, 224Ra, and DSi from the bottom sediment were based on estimations of diffusive fluxes from coastal sediments from Charette et al. (2001), Bird et al. (1999), and Jung and Cho (2003), respectively, multiplied by the areas of this bay. Although there are large uncertainties in these assumptions, the errors of calculated SGD arising from them appear to be small, since the maximum assumed values of diffusive fluxes are much smaller than the advective fluxes (Table 3). Furthermore, the diffusive fluxes of 224Ra from different sediment facies were similar (Bird et al. 1999). In the case of long-lived 226Ra, the production rate from 230Th is very slow in sediments (Rama and Moore 1996; Charette et al. 2003; Hwang et al. 2005).
The end-member concentrations of each species in coastal groundwater were from the average of four brackish ground- water samples. The end-member concentrations of 226Ra, 224Ra, and DSi in open ocean waters were assumed to be approximately 7.2 dpm 100 L-1 (Nozaki et al. 1991), 1.5 dpm 100 L-1 (Hwang et al. 2003), and 8 /umol L-1 (NFRDI 2003), respectively. The average concentrations of 226Ra, 224Ra, and DSi in bay water were calculated by dividing the entire bay water into 15 boxes in order to obtain a volume- weighted average. The average concentrations were calcu- lated to be about 12.2 dpm 100 L-1, 14.3 dpm 100 L-1, and 52 /umol L-1 for 22Ra, 224Ra, and DSi, respectively.
The residence times of bay water (l/AMix), based on 226Ra and 224Ra mass balances (Eqs. 1, 2), 226Ra and DSi mass balances (Eqs. 1, 3), and 224Ra and DSi mass balances (Eqs. 2, 3), were determined to be approximately 2.0, 2.1, and 2.0
d, respectively. The seepage rates (QSCD) estimated from these mass balance models ranged from 45 to 48 cm d-' (mean = 47 cm d-1) in the entire bay.
On the other hand, Kim et al. (2003a) previously mea- sured the seepage rates of coastal groundwater along the shore of Jeju by using manual seepage meters (modified from the Lee-type seepage meter) from April 2002 to August 2002. The seepage rates in eastern Jeju were in the range of 14-82 cm d-1, with a relatively small spatial and temporal variation. The seepage rates estimated in this study from Bangdu Bay (a natural chamber) fall within the range of the seepage rates measured by manual seepage meters (Kim et al. 2003a), showing consistency between various years and methods.
Estimating SGD using a 222Rn mass balance model- Since 222Rn is highly enriched in both fresh and brackish groundwater, the estimated seepage rate, based on a 222Rn mass balance, can be decoupled from that based on the mass balances of 226Ra and 224Ra, which are more enriched in brackish groundwater relative to fresh groundwater in Jeju Island (Kim et al. 2003a). Thus, in this study, we calculated SGD independently using a 222Rn tracer for comparison. For the mass balance of excess 222Rn (222Rn-226Ra) in bay water, we have to add a gas exchange term to the previous mass balances for 226Ra or 224Ra (Eqs. 1, 2) (Fig. 4B). At steady state, the mass balance of 222Rn may be expressed as follows (Eq. 4):
Fh2 222 22 F Rn-222 X Rn-222 X A Rn-222 rFish r Diff GW Bott X tSGD SW Rn-222
CRn-222 X VS X AMiX - FtRn-222 c ~~EX A ^/Atm (4)
where the terms on the left side of the equation represent input fluxes from fish farm water (the first term), diffusion from sediments (the second term), submarine groundwater flow (the third term), and output fluxes from radioactive de- cay (the fourth term), mixing with open ocean water (the fifth term), and evasion flux to the atmosphere (the final term).
The calculations of each term are similar to those for 226Ra and 224Ra. The input fluxes from fish farm water and diffu- sion from sediments were about 3.7 X 10⁸ and 8.1 X 10⁷
dpm d-~, respectively. The output fluxes from radioactive decay and mixing with the open ocean water were about 3.8 X 10⁹ and 1.0 X 10¹⁰ dpm d-1, respectively. Here, we cal- culated the water mixing fluxes on the basis of the water residence time (average from the 226Ra, 224Ra, and Si meth- ods) and the difference in 222Rn activities between open ocean water and the average of bay water.
The gas exchange across the air-water interface is a sig- nificant sink for dissolved radon in coastal waters (Corbett 1999). The total flux of dissolved gases escaping from the seawater to the atmosphere depends on the molecular dif- fusion resulting from the concentration gradient across the air-water interface and turbulent transfer by physical pro- cesses such as wind speed. In this study, the atmospheric loss of radon (FAtm) was calculated from the following equa- tion suggested by Macintyre et al. (1995):
FAtm k(CBW- aCAtm) X A (5)
Rn inventory
hCRn (decay)
1398
This content downloaded from 193.104.110.48 on Sun, 15 Jun 2014 15:06:06 PMAll use subject to JSTOR Terms and Conditions

Table 3. The definition and values used in the simultaneous equations for 226Ra, 224Ra, DSi, and 222Rn mass balances for calculating the residence time of seawater a]
seepage rates in Bangdu Bay, Jeju Island.
Value
Definition 226Ra 224Ra DSi 222Rn Unit
ABott Bottom area of bay 8.10X10⁵ 8.10X10⁵ 8.10X10⁵ 8.10x10⁵ m2 V, Water volume of bay 2.50x 10⁶ 2.50x 10⁶ 2.50x 10⁶ 2.50x 10⁶ m3 XRa Decay constant: Ra_226, ARa-224, and 'Rn222 1.17X10⁻⁶ 0.1904 0.1809 d-
FFish Input flux through fish farm water (F, X CVw) for 226Ra, 224Ra, 3.44X10⁶ 8.52 106 4.84X10⁶ 3.72X10⁸ dpm (or mmol) d- Si, and 222Rn F,: Discharge of fish farm water 2.00X 10⁴ 2.00X 10⁴ 2.00X 10⁴ 2.00x 10⁴ m3 d-l CFW: Concentrations in fish farm water for 226Ra, 224Ra, Si, and 172 426 242 18,600 dpm (or mmol) m-3 222Rn
FDiff Diffusive flux from bottom sediment (RG X ABot) for 226Ra, 224Ra, 3.56X10⁴ 1.70X10⁷ 4.05X10⁶ 8.10X10⁷ dpm (or mmol) d-I Si, and 222Rn
RG: Regeneration rate of 226Ra, 224Ra, Si, and 222Rn 0.044 21 5 100 dpm (or mmol) m-2 d
CGW Concentration in groundwater for 226Ra, 224Ra, Si, and 222Rn 152 522 119 56,800 dpm (or mmol) m-3 qJSGD Seepage rate of submarine groundwater ? ? ? ? m d-' Isw Inventory in bay water for 226Ra, 224Ra, and 222Rn 3.05x10⁸ 3.58X10⁸ - 2.07X 10¹⁰ dpm CEX Difference in activity between bay water and open ocean water 50 128 44 8,200 dpm (or mmol) m-3
(CB - C) for 226Ra, 224Ra, Si, and 222Rn XMix Exchange rate between bay water and open ocean water ? ? d-I FAtm Output flux of radon (FR X ABott) across air-sea interface FR: -2.02x 10⁹ dpm d-l
Average flux of radon out of the surface of each box by aerial 2,499 dpm m-2 d-' evasion
nd
:
;s
s-n
Z
s'
(^
COQ
e-
CZ, I z
Gr
ZS Z^
This content downloaded from 193.104.110.48 on Sun, 15 Jun 2014 15:06:06 PMAll use subject to JSTOR Terms and Conditions
Hwang et al.
where CBW represents the 222Rn activity in surface water (within -2 m of depth), CAtm represents the mean 222Rn ac- tivity in the air during the sampling period, A is the area of each box (-9.0 X 10⁴ m2), a is the Ostwald's solubility coefficient (dimensionless), and k is the gas transfer velocity (also referred to as the piston velocity). This gas transfer velocity (k) is dependent on the wind speed (Jahne et al. 1987; Macintyre et al. 1995; Corbett et al. 1997) and can be calculated from the following equation:
k = 0.45 x W( -6) X (Sc/600)-0'66667 (6)
where Ws is the wind speed, and Sc represents the Schmidt number (=V:Dm), which is the ratio of the kinematic vis- cosity (V = -0.0003t + 0.0169; cm2 s-1; t is water tem- perature) to the molecular diffusion coefficient (Dm = 10(-((980/(t+273))+1 59)); cm2 s-l) (Macintyre et al. 1995). The sol- ubility coefficient (a) can be calculated by the following equation:
a = ,3 X T/273 (7)
where /3 represents the Bunsen coefficient (=e(- 1 95+(31 66x(lO00/)))), and T represents the absolute temperature.
Given the measured water temperature (16.3-18.3?C), the measured 222Rn activity in water and air (-190 dpm m-3) from Kosan, Jeju Island, and the wind speed (-2.4 m s-l) during the sampling period, the evasion flux of 222Rn to the atmosphere is estimated to be 2.0 X 10⁹ dpm d- . Thus, the seepage rate is calculated to be approximately 34 cm d-', which is slightly lower than that from the 224Ra, 226Ra, and Si methods. However, this value is in the range (14-82 cm d-~) of the seepage rates obtained from the eastern coast of Jeju Island using a manual seepage meter. Thus, we used the average of the seepage rates obtained from all methods using 224Ra, 226Ra, Si, and 222Rn for calculating the nutrient fluxes from SGD in the next section. In this comparison of SGD, which is based on different methods, it is important to bear in mind that the uncertainties arising from chemical analysis and, more significantly, from the measurement of end-mem- ber samples of groundwater and open ocean water could be large, although we cannot determine these uncertainties be- cause of natural variability.
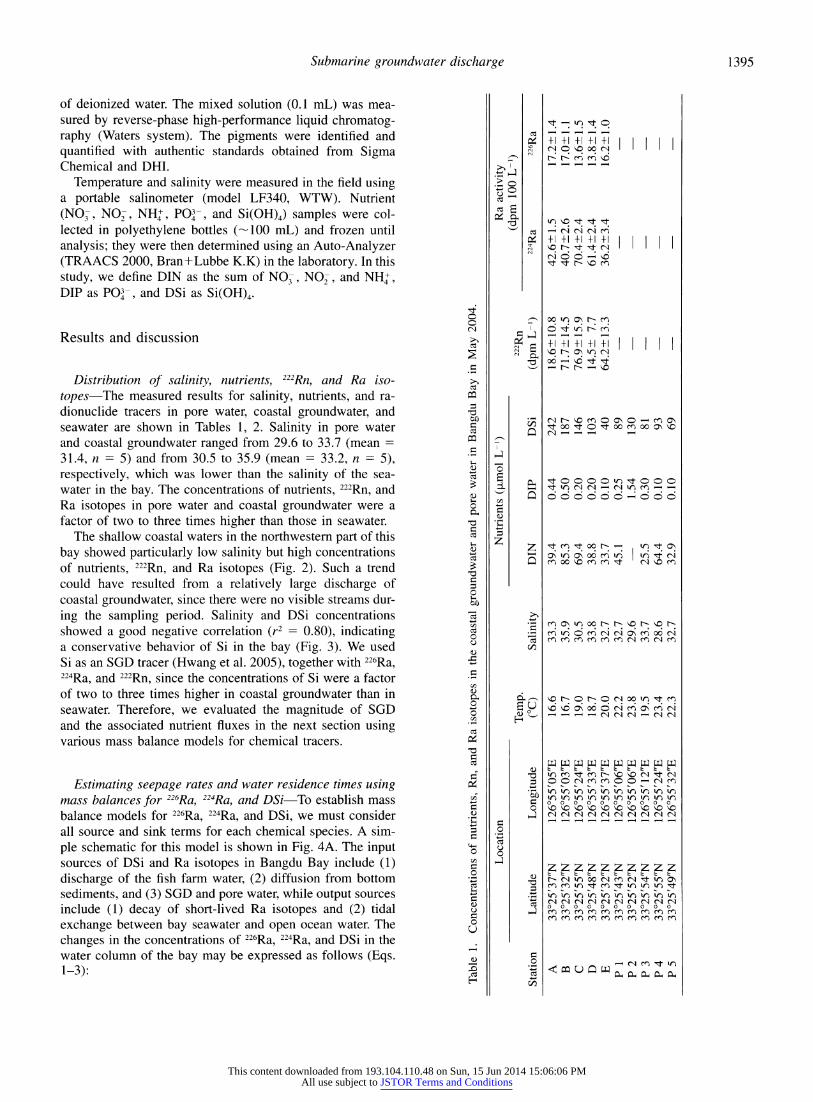
Fluxes of DIN, DIP, and DSi from SGD-To determine the main source of excess nutrients in bay water, we eval- uated the supply of nutrients from all sources such as fish farm water, diffusion from bottom sediment, and SGD. The nutrient fluxes via fish farm water were determined by mul- tiplying the discharge of fish farm water (-2.0 x 10⁴ m3 d-') by the concentrations of nutrients in the fish farm water samples (39, 0.44, and 242 /,mol L- for DIN, DIP, and DSi, respectively), yielding fluxes of 0.78 X 10³, 0.009 X 10³, and 4.8 x 10³ mol d-l for DIN, DIP, and DSi, respectively. The nutrient fluxes due to the regeneration of bottom sedi- ments were calculated by multiplying the area of the bay (-8.0 X 10⁵ m2) by the regeneration rates of nutrients mea- sured by Kim and Park (1998) and Jung and Cho (2003) in coastal bays and estuaries of Korea (1.3, 0.6, and 5.0 mmol m-2 d-' for DIN, DIP, and DSi, respectively). The fluxes of
Table 4. The comparison of nutrient fluxes through fish farm water, bottom sediment, and submarine groundwater discharge in Bangdu Bay, Jeju Island.
Nutrients (x 10 mol d-')
Pathway DIN DIP DSi
Fish farm water* 0.78 0.009 4.8 Diffusion from bottom sedimentst 1.1 0.5 4.1 Submarine groundwater discharget 17 0.13 37
* Based on the discharge of fish farm water multiplied by the concentrations of nutrients in the fish farm water samples.
t Calculated by multiplying the area by the regeneration rates of nutrients measured by Kim and Park (1998) and Jung and Cho (2003) in coastal bays and estuaries of Korea.
t Based on the average concentrations of nutrients in potential groundwater (including the pore water) multiplied by the estimated SGD.
estimated to be 1.1 X 10³, 0.5 X 10³, and 4.1 X 10³ mol d- , respectively.
On the basis of the average concentrations of nutrients in coastal salty groundwater and pore water (49, 0.36, and 104 /,umol L-' for DIN, DIP, and DSi, respectively) and the es- timated average of SGD, the fluxes of DIN, DIP, and DSi from SGD are calculated to be approximately 1.7 X 10⁴, 1.3 X 10², and 3.7 X 10⁴ mol d-~, respectively. Here, we as- sumed no loss of DIN by denitrification during the transport of groundwater within the sediment, since intrinsic nitrate removal by denitrification is often slow relative to the groundwater flow rate (Smith et al. 1996), and the denitri- fication process in coastal aquifers is mostly limited by the absence of electron donors (e.g., organic C, Fe(II), S-) (Starr and Gillham 1993; Devlin et al. 2000). These fluxes of DIN, DIP, and DSi from SGD contribute approximately 90%, 20%, and 80% of the total DIN, DIP, and DSi fluxes in the seawater of Bangdu Bay, respectively (Table 4). Therefore, SGD is the dominant source of new DIN and DSi in Bangdu Bay, although diffusion from bottom sediment is also im- portant for regenerated DIP in the water column (Table 4).
The estimated DIN flux from SGD in this bay is much higher than that observed in the eastern part of the United States, such as the North Inlet, Waquoit Bay, Rhode Island, and the Pettaquamscutt estuary, and in the Yeoja Bay of Korea (references are in Table 5). The DIP flux in this bay is much higher than that observed in Rhode Island and the Pettaquamscutt estuary, while it is of the same order as that observed in the North Inlet and Yeoja Bay (Table 5). Nutrient fluxes into Bangdu Bay are characterized by high DIN: DIP ratios (96-193) relative to the Redfield ratio (16) in seawater and are probably under the influence of contaminated sourc- es of DIN. Such a DIN: DIP imbalance can affect the eco- system of coastal seawater (Smith 1984; Paerl 1988; Krom et al. 1991).
Benthic eutrophication and the distributions of pigments in seawater-The blooming of benthic green algae (Ulva conglobata and Ulva pertusa) is perennial in the shallow areas of this bay (Fig. 5). Because of this benthic eutrophi- cation, tons of these benthic algae are removed daily from this bay. As shown from the budget of nutrients in this bay in the previous section, the large fluxes of excess nutrients
1400
DIN, DIP, and DSi by diffusion from bottom sediment were
This content downloaded from 193.104.110.48 on Sun, 15 Jun 2014 15:06:06 PMAll use subject to JSTOR Terms and Conditions

Submarine groundwater discharge
:~ ~ ~ -4 :'-?
a ~*
. . . . .
' "
-, - S* - 7-'
- 'o '-'r L rY "''v
rI oo IN m
\ C _ ,S I - -t _ r-> "c m _ "l-
o o.
,i ,I r-- o"I
-- ~ O-
0 .
N l t oooor- o 0
? 0000 '+1 6 d'6666d6
d
- tr) oo oo > I tl00in
-o o
0 ,. U 5 A
_ o .Z oo Un
0c.-|
o r B: & > ct
z> ,Xm
J' ~ ~.- 4 .'L~
,.4^^
*' ' "
"'
-J. .-/^ ^ q
"'~'5~"t h a.- * - l^ "t S '-'
^ts ^ > '&'^^ <. r. - ?' * - Clr~~~~~~~~~~~~~~~~~~q
Fig. 5. Photographs of dense distribution of benthic green algae in the shallow zone of Bangdu Bay.
from SGD appear to cause this benthic eutrophication. To confirm our hypothesis, direct measurement of benthic pro- duction and geochemical signatures (i.e., '5N) will be nec-
essary in the future. On the other hand, measurement of photosynthetic pig-
ments in overlying seawater was thought to be necessary, since a strong fluorescence signal was reported to be present toward the bottom in seawater off the South Carolina coast where subsurface fluid input is obvious (Moore and Shaw 1998). Chlorophyll a (Chl a) concentrations in bay seawater
ranged from 120 to 1,100 ng L-' (mean = 450 ng L-', n =
14), which was about a factor of five times higher than for sites out from the bay (Sta. 10-12) (Fig. 6). Similarly, the concentrations of carotenoid pigments, such as fucoxanthin, peridinin, and zeaxanthin, in bay seawater were a factor of two to three times higher than those in seawater out from the bay.
Distributions of Chl a and carotenoid pigments in surface seawater showed a large spatial variation (Fig. 6). Elevated concentrations of photosynthetic pigments were found in the shallow coastal waters (less than approximately I m) (par- ticularly in the northern part of this bay). The dominant phy- toplankton communities, calculated using the CHEMTAX
0
OC) 0
0 Cl
C a C ) I.
- 0 ,-. Ct-
MC U
llc
i- -u Q Ucr
1401
No Cl
o C3 N o
C tO _ 3 CA
4 = E
-0
X E
a E
z-
= I _ ,l = E
E
Z Z a -:
0 )E vl
C
.) '5 C4
C3
CO
3 0
oU 0 c.
-u
CO
0
cV
0
u
. 0-4
3
0
o
C
V:
cc
0)
0
._
0
CO C.
-O C,
-? -as `Hlh.
i II
Y
_s
This content downloaded from 193.104.110.48 on Sun, 15 Jun 2014 15:06:06 PMAll use subject to JSTOR Terms and Conditions

Hwang et al.
Pe nd . Zea conc. (ng l1) v Allo. conc. (ng 1L-1) * 100 < 0 100< * < 15 <
50-100 50 -100o 10 -15 10- 1 50 * 10 50 5 10
< 10 < I ? <10 < 5
126?55'E 126056' 126055'E 126056' 126055'E 126056'
Fig. 6. Horizontal distributions of pigments for Chl a, Chl b, fucoxanthin, peridinin, zeaxanthin, and alloxanthin in Bangdu Bay.
program for pigments (Mackey et al. 1996), are chlorophytes (40%), diatoms (34%), cyanobacteria (9%), and dinoflagel- lates (7%). The higher proportion of chlorophytes could be
largely attributed to the fragments of benthic green algae (Ulva sp.), which cover the upper or middle of the sandflat in the intertidal zone of this bay.
We cannot quantify the biological production of this bay, including benthic algal production, since the purpose of this
study was to gauge SGD and associated nutrient fluxes. However, the community structure and abundance of phy- toplankton and benthic eutrophication appear to be largely influenced by SGD, since SGD contributes the largest por- tion of nutrient inputs to this bay, and the distribution pat- terns of pigments are similar to the Rn distribution (an SGD tracer) away from the fish farm. To quantify the eutrophi- cation of coastal bays due to SGD, more extensive interdis-
ciplinary studies are necessary in the future.
References
BIRD, F L., P. W. FORD, AND G. J. HANCOCK. 1999. Effect of bur-
rowing macrobenthos on the flux of dissolved substances across the water-sediment interface. Mar. Freshwater Res. 50: 523-532.
BUGNA, G. C., J. P. CHANTON, J. E. CABLE, W. C. BURNETT, AND
P. H. CABLE. 1996. The importance of groundwater discharge to the methane budgets of nearshore and continental shelf wa- ters of the northeastern Gulf Mexico. Geochim. Cosmochim. Acta 60: 4735-4746.
BURNETT, W. C., H. BOKUNIEWICZ, M. HUETTEL, W. S. MOORE,
AND M. TANIGUCHI. 2003. Groundwater and pore water inputs to the coastal zone. Biogeochemistry 66: 3-33.
, G. KIM, AND D. LANE-SMITH. 2001. A continuous radon monitor for use in coastal ocean waters. J. Radioanal. Nucl. Chem. 249: 167-172.
CHARETTE, M. A., K. O. BUESSELER, AND J. E. ANDREWS. 2001.
Utility of radium isotopes for evaluating the input and transport of groundwater-derived nitrogen to a Cape Cod estuary. Lim- nol. Oceanogr. 46: 456-470.
, R. SPLIVALLO, C. HERBOLD, M. S. BOLLINGER, AND W. S.
MOORE. 2003. Salt marsh submarine groundwater discharge as traced by radium. Mar. Chem. 84: 113-121.
CHURCH, T. M. 1996. An undergroundwater route for the water cycle. Nature 380: 579-580.
CORBETT, D. R. 1999. Tracing groundwater flow into surface waters by application of natural and artificial tracers. Ph.D. disserta- tion, Florida State Univ.
, W. C. BURNETT, P. H. CABLE, AND S. B. CLARK. 1997. Radon tracing of groundwater input into Par Pond, Savanah River Site. J. Hydrol. 203: 209-227.
DEVLIN, J. E, R. EEDY, AND B. J. BUTLER. 2000. The effects of electron donor and granular iron on nitrate transformation rates in sediments from a municipal water supply aquifer. J. Con- tamin. Hydrol. 46: 81-97.
HWANG, D. W., G. KIM, Y. W. LEE, AND H. S. YANG. 2005. Esti- mating submarine inputs of groundwater and nutrients to a eu- trophic coastal bay using a radium tracer. Mar. Chem. 96: 61- 71.
AND H. S. YANG. 2003. Measurement of 2'4Ra and 223Ra in the Nakdong River estuary and the South Sea of Ko- rea. J. Korean Soc. Oceanogr. 38: 80-86.
JAHNE, B., K. O. MUNNICH, R. BOSINGER, A. DUTZI, W. HUBER,
1402
This content downloaded from 193.104.110.48 on Sun, 15 Jun 2014 15:06:06 PMAll use subject to JSTOR Terms and Conditions
Submarine groundwater discharge
AND P. LIBNER. 1987. On the parameters influencing air-water gas exchange. J. Geophys. Res. 92: 1937-1950.
JUNG, H. Y., AND K. J. CHO. 2003. SOD and inorganic nutrient fluxes from sediment in the downstream of the Nagdong River. Korean J. Limnol. 36: 322-335.
KELLY, R. P., AND S. B. MORAN. 2002. Seasonal changes in ground- water input to a well-mixed estuary estimated using radium isotopes and implications for coastal nutrient budgets. Limnol. Oceanogr. 47: 1796-1807.
KIM, D. H., AND C. K. PARK. 1998. Estimation of nutrients released from sediments of Deukryang Bay. J. Korean Environ. Sci. Soc. 7: 425-431.
KIM, G., W. C. BURNETT, H. DULAIOVA, P. W. SWARZENSKI, AND W. S. MOORE. 2001. Measurement of 224Ra and 226Ra activities in natural waters using a radon-in-air monitor. Environ. Sci. Technol. 35: 4680-4683.
, AND D. W. HWANG. 2002. Tidal pumping of groundwater into the coastal ocean revealed from submarine 222Rn and CH4 monitoring. Geophys. Res. Lett. 29, doi: 10.1029/ 2002GL015093.
, K. K. LEE, K. S. PARK, D. W. HWANG, AND H. S. YANG. 2003a. Large submarine groundwater discharge (SGD) from a volcanic island. Geophys. Res. Lett. 30, doi: 10.1029/ 2003aGLO 18378.
KIM, Y., AND OTHERS. 2003b. Hydrogeochemical and isotopic evi- dence of groundwater salinization in a coastal aquifer: A case study in Jeju volcanic island, Korea. J. Hydrol. 270: 282-294.
KOH, K. W. 1997. Characteristics of the groundwater and hydro- geologic implications of the Seoguipo Formation in Cheju Is- land. Ph.D. dissertation, Pusan National Univ.
KREST, J. M., W. S. MOORE, L. R. CARDNER, AND J. MORRIS. 2000. Marsh nutrient export supplied by groundwater discharge: Ev- idence from Ra measurements. Global Biogeochem. Cycles 14: 167-176.
KROM, M. D., N. KRESS, S. BRENNER, AND L. I. GORDON. 1991.
Phosphorus limitation of primary productivity in the eastern Mediterranean Sea. Limnol. Oceanogr. 36: 424-432.
LI, L., D. A. BARRY, F STAGNITTI, AND J. Y. PARLANGE. 1999. Submarine groundwater discharge and associated chemical in- put to a coastal sea. Water Resour. Res. 35: 3253-3259.
MACINTYRE, S., R. WANNINKHOF, AND J. P. CHANTON. 1995. Trace
gas exchange across the air-water interface in freshwater and coastal marine environments, p. 52-97. In P A. Matson and R. C. Harris [eds.], Biogenic trace gasses: Measuring emissions from soil and water. Blackwell.
MACKEY, M. D., D. J. MACKEY, H. W. HIGGINS, AND S. W. WRIGHT. 1996. CHEMTAX-a program for estimating class abundances
from chemical markers: Application to HPLC measurements of phytoplankton. Mar. Ecol. Prog. Ser. 144: 265-283.
MOORE, W. S. 1996. Large groundwater inputs to coastal waters revealed by 226Ra enrichment. Nature 380: 612-614.
.1997. High fluxes of radium and barium from the mouth of the Ganges-Brahmaputra River during low river discharge suggest a large groundwater source. Earth Planet. Sci. Lett. 150: 141-150.
, AND R. ARNOLD. 1996. Measurement of 223Ra and 224Ra in coastal waters using a delayed coincidence counter. J. Geophys. Res. 101: 1321-1329.
, AND T. J. SHAW. 1998. Chemical signals from submarine fluid advection onto the continental shelf. J. Geophys. Res. 103: 21543-21552.
NATIONAL FISHERIES RESEARCH AND DEVELOPMENT INSTITUTE [NFRDI]. 2003. Annual report of oceanographic observations for 2002. National Fisheries Research and Development Insti- tute, Korea 51: 1-315.
NOZAKI, Y., H. TSUBOTA, V. KASEMSUPAYA, M. YASHIMA, AND N. IKUTA. 1991. Residence times of surface water and particle- reactive 2'0Pb and 210Po in the East China and Yellow Seas. Geochim. Cosmochim. Acta 55: 1265-1272.
PAERL, H. 1988. Nuisance phytoplankton blooms in coastal, estu- arine, and inland waters. Limnol. Oceanogr. 33: 823-847.
RAMA, AND W. S. MOORE. 1996. Using the radium quartet for eval- uating groundwater input and water exchange in salt marshes. Geochim. Cosmochim. Acta 60: 4645-4652.
SCOTT, M. K., AND S. B. MORAN. 2001. Ground water input to coastal salt ponds of southern Rhode Island estimated using 226Ra as a tracer. J. Environ. Radioact. 54: 163-174.
SMITH, R. L., S. P. GARABEDIAN, AND M. H. BROOKS. 1996. Com- parison of denitrification activity measurements in groundwater using cores and natural gradient test. Environ. Sci. Technol. 30: 3448-3456.
SMITH, S. V. 1984. Phosphorus versus nitrogen limitation in the marine environment. Limnol. Oceangr. 29: 1149-1160.
STARR, R. C., AND R. W. GILLHAM. 1993. Denitrification and or- ganic carbon availability in two aquifers. Groundwater 31: 934-947.
WRIGHT, S. W., S. W. JEFFREY, R. F C. MANTOURA, C. A. LLEW- ELLYN, T. BJORNLAND, D. REPETA, AND N. WELSCHMEYER. 1991. Improved HPLC method for the analysis of chlorophylls and carotenoids from marine phytoplankton. Mar. Ecol. Prog. Ser. 77: 183-196.
YOUNGER, P L. 1996. Submarine groundwater discharge. Nature 382: 121-122.
Received: 12 November 2004 Accepted: 12 May 2005 Amended: 2 June 2005
1403
This content downloaded from 193.104.110.48 on Sun, 15 Jun 2014 15:06:06 PMAll use subject to JSTOR Terms and Conditions