large-scale les wind simulation using lattice … large-scale les wind simulation using lattice...
TRANSCRIPT

9
All-Atom Simulation of a Cell Membrane System of Photosynthetic Bacteria Using Large-Scale GPU Calculation
Large-scale LES Wind Simulation using Lattice Boltzmann Method for a 10km x 10km Area in Metropolitan Tokyo
Evaluation of Electromagnetic Wave Exposure by Large-scale Electromagnetic Field Analysis in Response to the Frequency Migration of Mobile-relay FPUs
02
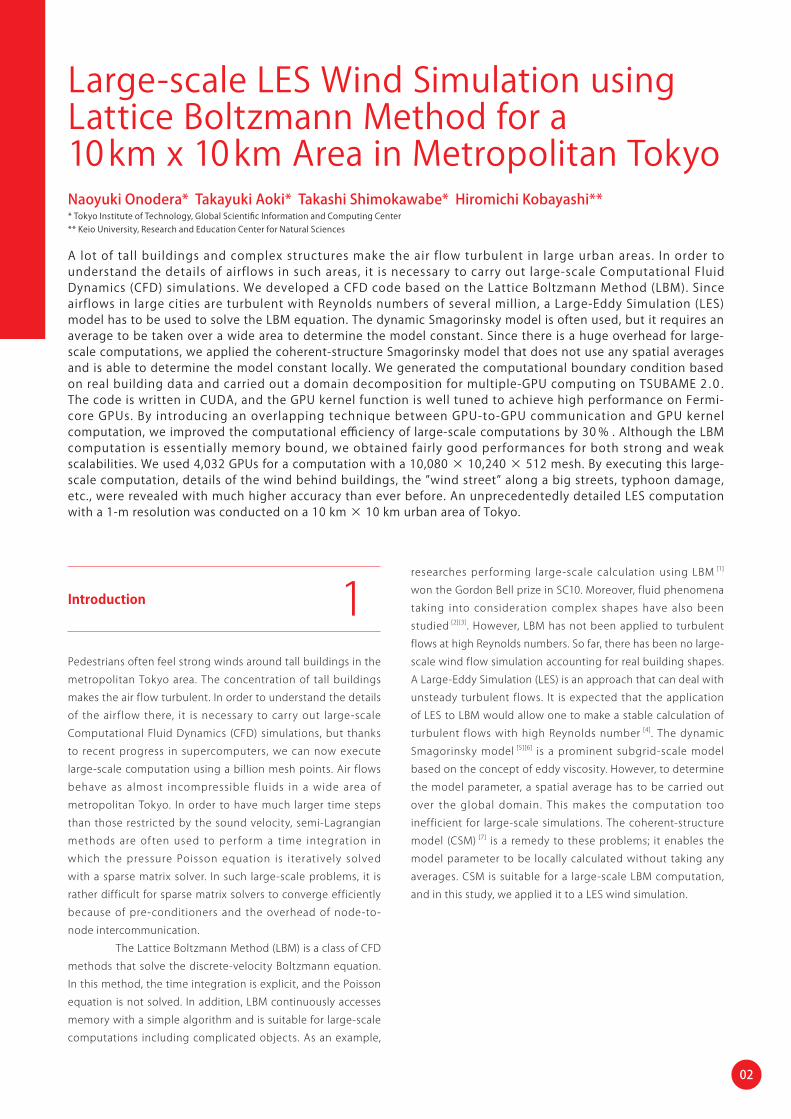
Large-scale LES Wind Simulation using Lattice Boltzmann Method for a 10 km x 10 km Area in Metropolitan Tokyo
A lot of tall buildings and complex structures make the air f low turbulent in large urban areas. In order to understand the details of airflows in such areas, it is necessary to carry out large-scale Computational Fluid Dynamics (CFD) simulations. We developed a CFD code based on the Lattice Boltzmann Method (LBM). Since airflows in large cities are turbulent with Reynolds numbers of several million, a Large-Eddy Simulation (LES) model has to be used to solve the LBM equation. The dynamic Smagorinsky model is often used, but it requires an average to be taken over a wide area to determine the model constant. Since there is a huge overhead for large-scale computations, we applied the coherent-structure Smagorinsky model that does not use any spatial averages and is able to determine the model constant locally. We generated the computational boundary condition based on real building data and carried out a domain decomposition for multiple-GPU computing on TSUBAME 2 . 0 . The code is written in CUDA, and the GPU kernel function is well tuned to achieve high performance on Fermi-core GPUs. By introducing an overlapping technique between GPU-to-GPU communication and GPU kernel computation, we improved the computational efficiency of large-scale computations by 30 % . Although the LBM computation is essentially memory bound, we obtained fairly good performances for both strong and weak scalabilities. We used 4,032 GPUs for a computation with a 10,080 × 10,240 × 512 mesh. By executing this large-scale computation, details of the wind behind buildings, the ”wind street” along a big streets, typhoon damage, etc., were revealed with much higher accuracy than ever before. An unprecedentedly detailed LES computation with a 1-m resolution was conducted on a 10 km × 10 km urban area of Tokyo.
Naoyuki Onodera* Takayuki Aoki* Takashi Shimokawabe* Hiromichi Kobayashi*** Tokyo Institute of Technology, Global Scientific Information and Computing Center ** Keio University, Research and Education Center for Natural Sciences
Pedestrians often feel strong winds around tall buildings in the
metropolitan Tokyo area. The concentration of tall buildings
makes the air flow turbulent. In order to understand the details
of the air f low there, it is necessary to carry out large-scale
Computational Fluid Dynamics (CFD) simulations, but thanks
to recent progress in supercomputers, we can now execute
large-scale computation using a billion mesh points. Air flows
behave as almost incompressible f luids in a wide area of
metropolitan Tokyo. In order to have much larger time steps
than those restricted by the sound velocity, semi-Lagrangian
methods are of ten used to per form a time integration in
which the pressure Poisson equation is iteratively solved
with a sparse matrix solver. In such large-scale problems, it is
rather difficult for sparse matrix solvers to converge efficiently
because of pre-conditioners and the overhead of node-to-
node intercommunication.
The Lattice Boltzmann Method (LBM) is a class of CFD
methods that solve the discrete-velocity Boltzmann equation.
In this method, the time integration is explicit, and the Poisson
equation is not solved. In addition, LBM continuously accesses
memory with a simple algorithm and is suitable for large-scale
computations including complicated objects. As an example,
Introduction 1 researches per forming large-scale calculation using LBM [1]
won the Gordon Bell prize in SC10. Moreover, fluid phenomena
taking into consideration complex shapes have also been
studied [2][3]. However, LBM has not been applied to turbulent
flows at high Reynolds numbers. So far, there has been no large-
scale wind flow simulation accounting for real building shapes.
A Large-Eddy Simulation (LES) is an approach that can deal with
unsteady turbulent f lows. It is expected that the application
of LES to LBM would allow one to make a stable calculation of
turbulent f lows with high Reynolds number [4]. The dynamic
Smagorinsky model [5][6] is a prominent subgrid-scale model
based on the concept of eddy viscosity. However, to determine
the model parameter, a spatial average has to be carried out
over the global domain. This makes the computation too
inefficient for large-scale simulations. The coherent-structure
model (CSM) [7] is a remedy to these problems; it enables the
model parameter to be locally calculated without taking any
averages. CSM is suitable for a large-scale LBM computation,
and in this study, we applied it to a LES wind simulation.

03
A large-eddy simulation (LES) resolves the f low dynamics of
large-scale structures on a grid scale (GS), and it takes into
account the ef fect of smaller-scale turbulent structures by
using a subgrid-scale (SGS) model. SGS models, which are
based on the concept of eddy viscosity, evaluate the effect of
turbulence as
Lattice Boltzmann method 2
Large-eddy simulation 3
Large-scale LES Wind Simulation using Lattice Boltzmann Method for a 10km x 10km Area in Metropolitan Tokyo
where is the model coefficient, and is the filter width.
The velocity strain tensor and its magnitude are defined as
3-1 Dynamic Smagorinsky model
In the conventional Smagorinsk y model (SM), the model
co ef f ic ient i s a cons tant in the ent i re computat ional
domain, and the SGS viscosity does not describe the correct
asymptotic behavior near a wall. The dynamic Smagorinsky
mo del (DSM) [5 ][6 ] overcomes th is defe c t by dy namica l ly
calculating the model parameter by using two types of grid
filter. Although DSM is the most notable breakthrough in LES,
the model parameter of DSM requires the average to be taken
in the global domain for the sake of numerical stability. This
introduces a large overhead fo large-scale simulations and
makes it difficult to treat complex geometries.
LBM is especially suitable for modeling boundary conditions
with complex shapes. The bounce-back (BB) scheme and
the interpolated bounce-back schemes [9][10] make it easy
to implement the no -s l ip veloci t y condit ion . Immersed
boundary methods (IBM) are able to handle complex boundary
conditions by adding external forces [11] in LBM. Since the BB
scheme directly applies these conditions to the distribution
function, it should be able to obtain high enough efficiency for
GPU computing. In this research, we applied the BB scheme to
LBM.
LBM solves the discrete Boltzmann equation to simulate the
f low of a Newtonian f luid. The f low field is expressed by a
limited number of pseudo particles in a streaming and collision
process. The physical space is discretized by a uniform grid.
Since pseudo particles move onto the neighbor lattice points
after one time step in the streaming process, this process is
completed without any error. The macroscopic dif fusion and
the pressure gradient are expressed by the collisional process,
and we used the BGK model [8], as most of the previous studies
did. The time evolution of the discretized velocity function is
Here, is the time interval, the relaxation time, and
the local equilibrium distribution at time and position . In
the D3Q19 model, the components of the velocity vector are
We used the following local equilibrium distribution
where is the density and is the macroscopic velocity. The
corresponding weighting factors of the D3Q19 model are
The relaxation time in the collisional process is determined
using the dynamic viscosity,

04
T h e o v e r l a p p i n g m e t h o d i s a t e c h n i q u e t o h i d e t h e
communicat ion t ime with the computat ion t ime [13][14]. A
computational domain is divided into a central region and a
boundary region. First, the GPU kernel for the boundary region
launches and the GPU kernel for the central region and the
GPU-to-GPU communication are executed simultaneously.
The data communication between a host memory and a GPU
device memory is performed done by using the CUDA runtime
API “cudaMemcpyAsync”, and we used the asynchronous MPI
library for data communications between compute nodes.
The TSUBAME 2.0 supercomputer at the Tokyo Institute of
Technology is equipped with more than 4,000 GPUs (NVIDIA
TESLA M2050) and has achieved 1.192 PFLOPS on the Linpack
benchmark. We measured the performance of our LBM code
on TSUBAME 2.0.
5-1 Performance on a single GPU
In our GPU implementation, the streaming and coll is ion
processes are fused so as to reduce memory accesses. The GPU
code is compiled with the support of the Super Function Unit
(SFU) and a 32-bit mode in association with other optimized
techniques. Figure 1 shows the performance of our LBM code
to compare with the theoretical performance estimated by
the improved roofline model, which is expressed in terms of
the amount of arithmetic operations ( ) , the amount of data
access ( ), the peak performance ( ), and the peak memory
bandwidth ( ):Optimization of the LBM computation for multiple GPU computing 4
Performance on TSUBAME 2.0 5
3-2 Coherent-structure Smagorinsky model
The coherent structure model (CSM) [12] is a promising approach
to solve the above problems. In CSM, we can determine the
model parameters locally by using the information about the
turbulent structure [7]. The model coefficient is calculated
by treating the coherent structure as a function of the
second invariant of the velocity gradient tensor and the
magnitude of the velocity gradient tensor :
The coefficient ' = 1/20 is a fixed model parameter, and it is
optimized for a wide range of simulations. CSM is suitable for
parallel computing without any average process.
3-3 Subgrid-scale eddy viscosity of the lattice Boltzmann method
Incorporation of CSM into LBM makes it possible to carry out
a large-scale simulation with complex boundaries at high
Reynolds numbers. The total relaxation time with the eddy
viscosity is
Regarding the domain decomposition, we divide
the domain two-dimensionally in the y- and z-directions. The
components of the velocity distribution function with the
velocity direction require communications about their directions.
In particular, six components of the velocity distribution function
, require MPI communications in the
y-direction, six components , require MPI
communications in the z-direction, and seven components
and u i require MPI communications in the y- and
z-directions.
The following parameters were used in this estimation:
We achieved 198 GFLOPS in 32-bit mode in single precision.
We have an 8 % performance increase with the 32-bit compile
option. The per formance ef f iciency relative to that of the
05
Large-scale LES Wind Simulation using Lattice Boltzmann Method for a 10km x 10km Area in Metropolitan Tokyo
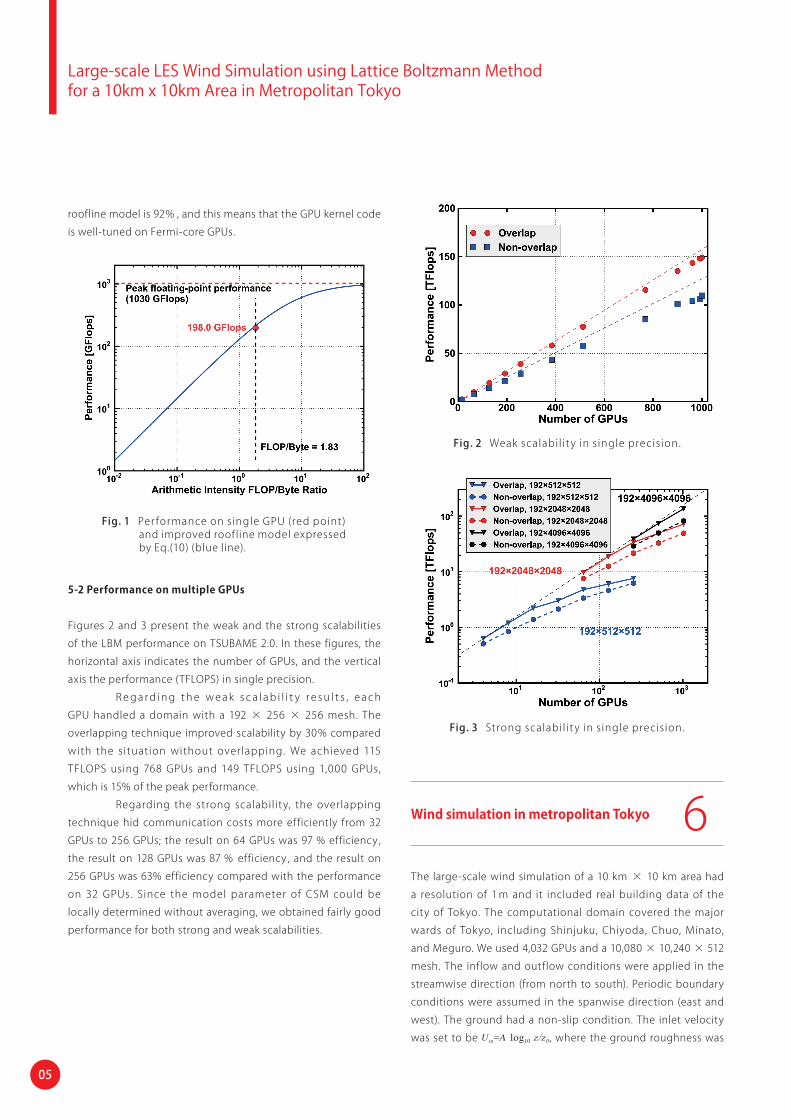
Fig. 1 Per formance on single GPU (red point) and improved roof line model expressed by Eq.(10) (blue line).
Fig. 2 Weak scalabil i t y in single precision.
Fig. 3 Strong scalabil i t y in single precision.
The large-scale wind simulation of a 10 km × 10 km area had
a resolution of 1 m and it included real building data of the
city of Tokyo. The computational domain covered the major
wards of Tokyo, including Shinjuku, Chiyoda, Chuo, Minato,
and Meguro. We used 4,032 GPUs and a 10,080 × 10,240 × 512
mesh. The inflow and outflow conditions were applied in the
streamwise direction (from north to south). Periodic boundary
conditions were assumed in the spanwise direction (east and
west). The ground had a non-slip condition. The inlet velocity
was set to be Uin=A log10 z/z0 , where the ground roughness was
Wind simulation in metropolitan Tokyo 6
roofline model is 92% , and this means that the GPU kernel code
is well-tuned on Fermi-core GPUs.
5-2 Performance on multiple GPUs
Figures 2 and 3 present the weak and the strong scalabilities
of the LBM performance on TSUBAME 2.0. In these figures, the
horizontal axis indicates the number of GPUs, and the vertical
axis the performance (TFLOPS) in single precision.
R e g a r d i n g t h e w e a k s c a l a b i l i t y r e s u l t s , e a c h
GPU handled a domain with a 192 × 256 × 256 mesh. The
overlapping technique improved scalability by 30% compared
with the situation without overlapping. We achieved 115
TFLOPS using 768 GPUs and 149 TFLOPS using 1,000 GPUs,
which is 15% of the peak performance.
Regarding the strong scalability, the overlapping
technique hid communication costs more efficiently from 32
GPUs to 256 GPUs; the result on 64 GPUs was 97 % efficiency ,
the result on 128 GPUs was 87 % efficiency , and the result on
256 GPUs was 63% efficiency compared with the performance
on 32 GPUs. Since the model parameter of CSM could be
locally determined without averaging, we obtained fairly good
performance for both strong and weak scalabilities.

06
Fig. 4 Tokyo area corresponding to the computation (north is up).
Fig. 5 Snapshot of wind f low using particles (north is up).
Fig. 6 Shinjuku area (north is up).
z 0 =2 and wind velocity was 10 m/s at a height of 100 m. The
Reynolds number, which was evaluated from the inlet velocity,
physical properties of the air, and heights of the buildings, was
about 106. Since the Reynolds number was very high, the wind
simulation without the SGS model was unstable and eventually
numerically diverged.
Figure 4 shows the map of the Tokyo area in the
computat ion (2012 Google ZENRIN), and Fig . 5 shows a
snapshot of the wind f lows visualized by using mass- less
particles. It is clear that tall buildings af fect the wind over a
broad area, and a strong turbulent wind arises near Shinagawa
Station.
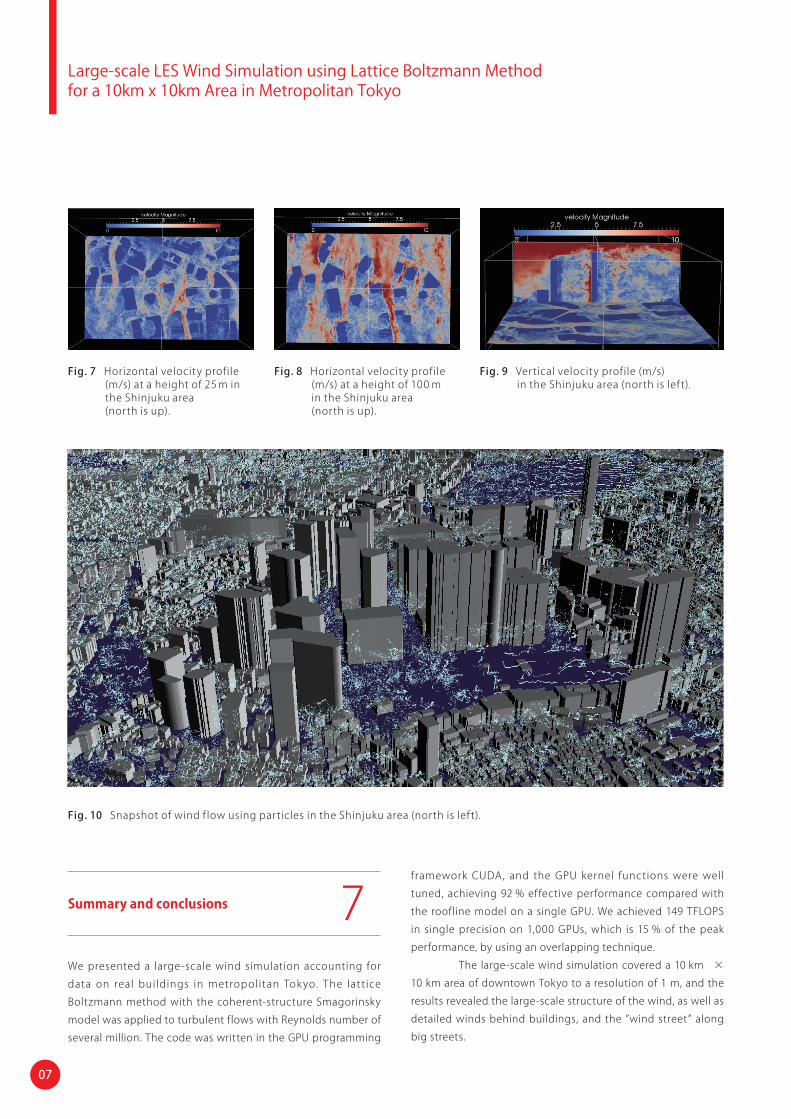
In order to study the wind flow in detail, we examined
the instantaneous velocity profiles. Figure 6 shows a map of
the Shinjuku area, and Fig. 7 shows the velocity profile at a
height of 25 m. The blue area indicates the buildings. It is clear
that strong winds blow along big streets and very complicated
velocity profiles are generated behind tall buildings. Figure 8
shows the velocity profile at a height of 100 m. We can see that
strong winds blow at higher altitudes and cause turbulence on
the ground.
Figure 9 shows the vertical velocity profile along the
red dotted line in Fig. 6. This figure shows that tall buildings
push down high-velocity flows, and turbulent vortices behind
bui ldings mix the atmosphere in the ver t ica l d i rec t ion .
Figure 10 shows a snapshot of the wind f low using massless
particles. The particles were generated at fixed points with
time sequence. The figure shows that streamlines formed by
the particles are strongly disturbed by the complicated flows
behind the buildings, whereas the streamlines near low-rise
buildings are not so disturbed.
The above results clearly show that by executing a
large-scale LES wind simulation using detailed data on real
buildings, we succeeded in getting a high-resolution profile of
the airflows in metropolitan Tokyo.
07
Large-scale LES Wind Simulation using Lattice Boltzmann Method for a 10km x 10km Area in Metropolitan Tokyo
We presented a large-scale wind simulation accounting for
data on real buildings in metropolitan Tok yo. The lat tice
Boltzmann method with the coherent-structure Smagorinsky
model was applied to turbulent flows with Reynolds number of
several million. The code was written in the GPU programming
Summary and conclusions 7 framework CUDA, and the GPU kernel functions were well
tuned, achieving 92 % effective performance compared with
the roofline model on a single GPU. We achieved 149 TFLOPS
in single precision on 1,000 GPUs, which is 15 % of the peak
performance, by using an overlapping technique.
The large-scale wind simulation covered a 10 km ×
10 km area of downtown Tokyo to a resolution of 1 m, and the
results revealed the large-scale structure of the wind, as well as
detailed winds behind buildings, and the ”wind street” along
big streets.
Fig. 7 Horizontal velocity profile (m/s) at a height of 25 m in the Shinjuku area (north is up).
Fig. 10 Snapshot of wind f low using particles in the Shinjuku area (north is lef t).
Fig. 8 Horizontal velocity profile (m/s) at a height of 100 m in the Shinjuku area (north is up).
Fig. 9 Vertical velocity profile (m/s) in the Shinjuku area (north is lef t).

08
We concluded that the present scheme is one of most
promising approaches to simulating a wide area of turbulence.
The LES computation for the 10 km × 10 km area with a 1-m
resolution is the most extensive of its kind.
Acknowledgements
The above peta-scale s imulat ions were executed as the
TSUBAME Grand Challenge Program, Category A in 2012 fall and
we would like express our special thanks to having a chance to
use the whole TSUBAME resources and all the GSIC staffs who
supported our project. This research was supported in part
by the Japan Society for the Promotion of Science (KAKENHI),
a Grant-in-Aid for Scientific Research (B) 23360046 from the
Ministry of Education, Culture, Sports, Science and Technology
(MEXT) of Japan, and Japan Science and Technology Agency
(JST) Core Research of Evolutional Science and Technology
(CREST) research programs on “ULP-HPC: Ultra Low-Power,
High-Performance Computing via Modeling and Optimization
of Next Generation HPC Technologies” and “Highly Productive,
and High Per formance Applicat ion Framework s for Post
Petascale Computing”.
References
[1] A. Rahimian, I. Lashuk, S. Veerapaneni, A.
Chandramowlishwaran, D. Malhotra, L. Moon, R. Sampath,
A. Shringarpure, J. Vetter, R. Vuduc, et al. Petascale direct
numerical simulation of blood f low on 200k cores and
heterogeneous architectures. In Proceedings of the 2010
ACM/IEEE International Conference for High Performance
Computing, Networking, Storage and Analysis, pages 1–11.
IEEE Computer Society, 2010.
[2] X . W a n g a n d T. A o k i . M u l t i - g p u p e r f o r m a n c e o f
incompressible f low computation by lattice boltzmann
method on gpu cluster. Parallel Computing, 2011.
[3] M. Bernaschi, M. Fatica, S. Melchionna, S. Succi, and E.
Kaxiras. A f lexible high-performance lattice boltzmann
gpu code for the simulations of f luid f lows in complex
geometries. Concurrency and Computation: Practice and
Experience, 22(1):1–14, 2009.
[4] H. Yu, S.S. Girimaji, and L.S. Luo. Dns and les of decaying
isotropic turbulence with and without frame rotation
using lattice boltzmann method. Journal of Computational
Physics, 209(2):599–616, 2005.
[5] M. Germano, U. Piomell i , P. Moin, and W.H. Cabot . A
dynamic subgrid-scale eddy viscosity model. Physics of
Fluids A: Fluid Dynamics, 3:1760, 1991.
[6] DK Lilly. A proposed modification of the germano subgrid-
scale closure method. Physics of Fluids A: Fluid Dynamics,
4:633, 1992.
[7] H.Kobayashi, F. Ham, and X. Wu. Application of a local
sgs model based on coherent structures to complex
geometries. International Journal of Heat and Fluid Flow,
29(3), 2008.
[8] Q. Zou and X. He. On pressure and velocity flow boundary
conditions and bounceback for the lattice boltzmann bgk
model. Arxiv preprint comp-gas/9611001, 1996.
[9] X. Yin and J. Zhang. An improved bounce-back scheme
for complex boundary conditions in lattice boltzmann
method. Journal of Computational Physics, 2012.
[10] B. Chun and AJC Ladd. Interpolated boundary condition
for lattice boltzmann simulations of flows in narrow gaps.
Physical review E, 75(6):066705, 2007.
[11] C. Shu, N. Liu, and YT Chew. A novel immersed boundary
velocity correction–lattice boltzmann method and its
application to simulate f low past a circular c yl inder.
Journal of Computational Physics, 226(2):1607–1622, 2007.
[12] H . K o b a y a s h i . L a r g e e d d y s i m u l a t i o n o f m a g n e t o
hydrodynamic turbulent channel flows with local subgrid-
scale model based on coherent structures. Physics of
Fluids, 18:045107, 2006.
[13] T. Shimokawabe, T. Aoki, C. Muroi, J. Ishida, K. Kawano, T.
Endo, A. Nukada, N. Maruyama, and S. Matsuoka. An 80-
fold speedup, 15.0 t f lops full gpu acceleration of non-
hydrostatic weather model asuca production code. In
High Performance Computing, Networking, Storage and
Analysis (SC), 2010 International Conference for, pages
1–11. IEEE, 2010.
[14] T. Shimokawabe, T. Aoki, T. Takaki, T. Endo, A. Yamanaka, N.
Maruyama, A. Nukada, and S. Matsuoka. Peta-scale phase-
field simulation for dendritic solidification on the tsubame
2.0 supercomputer. In Proceedings of 2011 International
Conference for High Performance Computing, Networking,
Storage and Analysis, page 3. ACM, 2011.