lapis sand dollars: an economic analysis of non-market ... · pohl lapis sand dollars. pohl and...
TRANSCRIPT

Lapis Sand Dollars
An Economic Analysis of Non-Market Impacts of Lapis Sand Mine in Southern Monterey Bay
Prepared by Alyssum Pohl and Lisa Johnston
August 2012

Pohl
Lapis Sand Dollars. Pohl and Johnston 1
Executive Summary The unique dunes and beaches of southern Monterey Bay, California are threatened by an intensified rate of coastal erosion caused by the Lapis Lustre sand mine in the city of Marina. This mine excavates high quality sand sold by the largest international cement and aggregate corporation, Cemex. Like many extractive industries, Lapis’ sand production results in negative externalities for the environment. This study quantifies some of these externalities by examining non-market costs including seawall construction and lost recreational value of beach due to Lapis. The annual cost of maintaining the existing seawalls at Ocean Harbor House and Monterey Beach Resort is $133,975. Any additional seawalls could increase this number to more than $256,562 annually. In addition, the cost of the recreational value of the beach area lost due to sand mining is currently $1,104,804 annually, and may rise to $1,122,970 annually in the future. These findings suggest that the non-market costs of the mine are significant, and would be even greater if a more diverse range of non-market costs were considered. This analysis fills a gap in information that should be considered in current and future decision-making regarding coastal resource use in Monterey County. Introduction The dune-covered coastline of Monterey Bay is a well-known landmark of the central California coast. The bay is characterized as a sandy, erosive shoreline backed by extensive dunes rising up to 46 meters (Thornton et al, 2006). The dunes and beaches provide numerous benefits to the local economy, attracting visitors and recreation seekers, supporting a wide range of biodiversity, and protecting coastal developments from storm surges. The dunes also have a long history of supporting a sand mining industry stretching from the mouth of the Salinas River near Moss Landing to Municipal Wharf II in Monterey (see Figure 1). Sand from the Monterey Bay coast is especially well suited for use in cement, asphalt, mortar, plaster, stucco, road construction, backfill, sand-blasting, filtration, glass and ceramics, foundry and engine sands, roofing, landscaping, and aquariums. Not all local sand, however, is of commercial interest due to variety of size and composition near Elkhorn Slough and Pajaro River where medium and fine grained sands are more prevalent. Commercially relevant coarse beach sands extend from Seaside northward to 2 miles south of Elkhorn Slough, centering in and around Fort Ord (Hart, 1966).

Pohl
Lapis Sand Dollars. Pohl and Johnston 2
Figure 1: Monterey Bay shoreline with number of kilometers from Monterey Wharf II and offshore bathymetry indicated. Mining operations marked with crossed pick-axes.
Source: Thornton et al, 2006 The southern coast of Monterey Bay was mined for sand intensively from 1906 to 1990. Six commercial sites operated in Marina and Sand City, primarily extracting sand directly from the surf zone using draglines to capture the high-value coarse sand deposits (Thornton et al, 2006). During the 1990’s, all shoreline mines were closed due to concern that they were contributing to significant shoreline erosion. However, one mine that extracts from the back beach and dunes

Pohl
Lapis Sand Dollars. Pohl and Johnston 3
instead of directly from the shoreline is still in operation today: the Lapis Lustre sand mine located in Marina, CA. Lapis was originally opened by E.B. and A.L. Stone in 1906 in response to demands for construction materials needed to rebuild San Francisco after the great earthquake (Hart, 1966). The mine has been held by several different owners and is currently owned and operated by Cemex, the largest cement, aggregates, and concrete company in the world. Today, the extracted sand is sorted by size, dried, blended, and predominantly sold for plaster and sandblasting. Since shoreline dredging at Lapis ceased in 1959, the mine has been using a suction dredging process to extract sand from a man-made pond located between the shoreline and dunes (Hart, 1966) (See Figure 2). This mining process acts as a sand sink, drawing in sand during annual storm events and high tides. This results in less sand available in the southern Monterey Bay littoral cell sand budget1 and significantly impacts the erosion rate (PWA, 2008). The southern Monterey Bay littoral cell is bound by the Salinas River to the north and Municipal Wharf II in Monterey to the south and comprises the geographical scope of this study. Waves refracting over the submarine canyon offshore from the Salinas River delta cause the mean alongshore sediment transport south of the Salinas River to be directed South, and the mean alongshore sediment transport north of the Salinas River to be directed North (Thornton et al, 2006). Figure 2: The Lapis mine site and dredge pond. Note how waves from the bay (foreground) wash over the beach (right side of photo), depositing water and sand into the Lapis mine pond.
Source: Thornton, 2007
1 A littoral cell is a geographically limited region along the coast with sand inputs such as rivers and
beaches. The sand budget refers to the amount of sand available for transportation up and down the
coast within the littoral cell.
Pohl
Lapis Sand Dollars. Pohl and Johnston 4
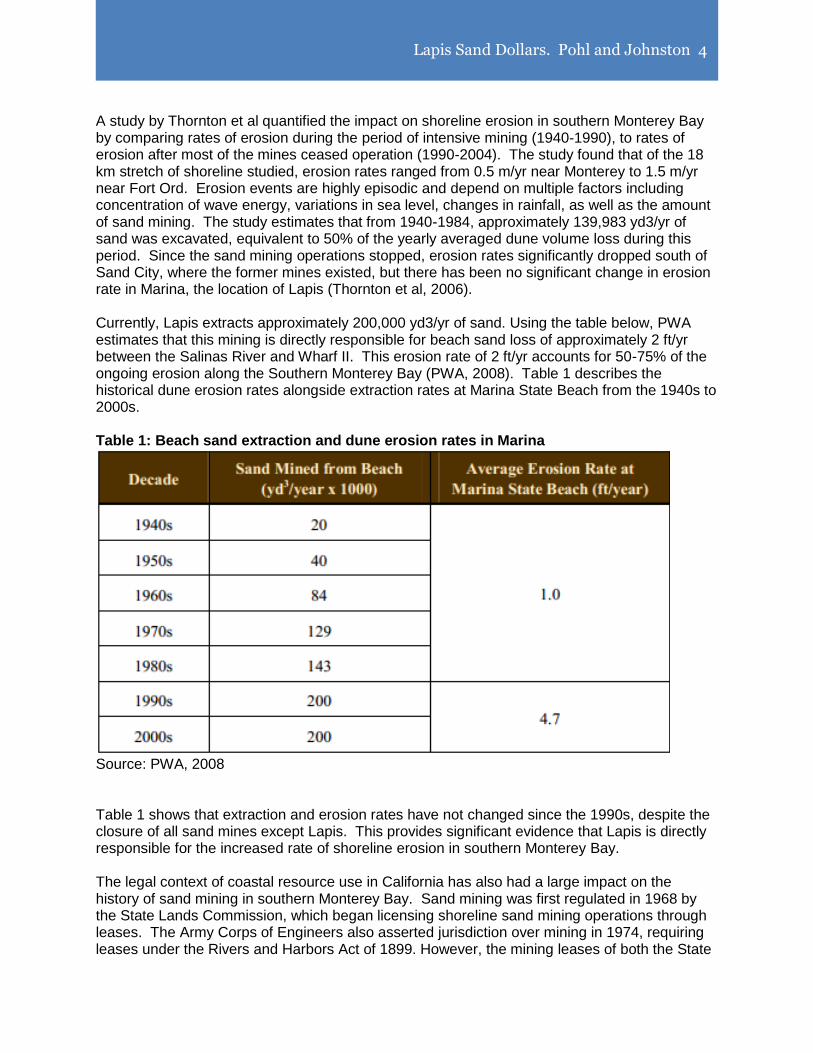
A study by Thornton et al quantified the impact on shoreline erosion in southern Monterey Bay by comparing rates of erosion during the period of intensive mining (1940-1990), to rates of erosion after most of the mines ceased operation (1990-2004). The study found that of the 18 km stretch of shoreline studied, erosion rates ranged from 0.5 m/yr near Monterey to 1.5 m/yr near Fort Ord. Erosion events are highly episodic and depend on multiple factors including concentration of wave energy, variations in sea level, changes in rainfall, as well as the amount of sand mining. The study estimates that from 1940-1984, approximately 139,983 yd3/yr of sand was excavated, equivalent to 50% of the yearly averaged dune volume loss during this period. Since the sand mining operations stopped, erosion rates significantly dropped south of Sand City, where the former mines existed, but there has been no significant change in erosion rate in Marina, the location of Lapis (Thornton et al, 2006). Currently, Lapis extracts approximately 200,000 yd3/yr of sand. Using the table below, PWA estimates that this mining is directly responsible for beach sand loss of approximately 2 ft/yr between the Salinas River and Wharf II. This erosion rate of 2 ft/yr accounts for 50-75% of the ongoing erosion along the Southern Monterey Bay (PWA, 2008). Table 1 describes the historical dune erosion rates alongside extraction rates at Marina State Beach from the 1940s to 2000s. Table 1: Beach sand extraction and dune erosion rates in Marina
Source: PWA, 2008 Table 1 shows that extraction and erosion rates have not changed since the 1990s, despite the closure of all sand mines except Lapis. This provides significant evidence that Lapis is directly responsible for the increased rate of shoreline erosion in southern Monterey Bay. The legal context of coastal resource use in California has also had a large impact on the history of sand mining in southern Monterey Bay. Sand mining was first regulated in 1968 by the State Lands Commission, which began licensing shoreline sand mining operations through leases. The Army Corps of Engineers also asserted jurisdiction over mining in 1974, requiring leases under the Rivers and Harbors Act of 1899. However, the mining leases of both the State

Pohl
Lapis Sand Dollars. Pohl and Johnston 5
Lands and Corps of Engineers in southern Monterey Bay expired in 1988 (Thornton et al, 2006). After that time the Corps concluded that the mining of beach sand caused coastal erosion and did not renew the permits for the five shoreline mining operations in southern Monterey Bay (PWA, 2008). In addition, the California Coastal Commission is the primary state agency responsible for regulating any land and water use within California’s coastal zone. Under the jurisdiction of the Coastal Commission, local governments run Local Coastal Programs (LCPs) to develop ground rules for future coastal developments as well as conservation of coastal resources. The Monterey County LCP was certified in 1988. Within the county LCP, city LCPs provide additional jurisdiction within city limits. The City of Marina’s LCP has specific policy related to sand mining operations within the Marina City limits, which are relevant to Lapis (PWA, 2008).2 While the legal considerations surrounding Lapis are highly relevant, they require a lengthy discussion which is beyond the scope of this report. The California Coastal Commission Enforcement Program is currently investigating whether Lapis is in compliance with the LCP. Purpose and Objectives Extractive industries generally fail to recognize the full array of negative externalities for which they are responsible. Instead, the public bears the burden. This case study typifies just such a situation, as the high rate of coastal erosion will continue to threaten the economic and ecological well-being along the southern coast of Monterey Bay, and will most likely be further exacerbated by increasingly unpredictable effects of climate change and sea level rise. Without taking action to minimize the causes of coastal erosion in southern Monterey Bay, the future economic implications for Monterey County could be great, as the beach from Moss Landing to Monterey could be gone or highly fragmented within 50 years.3 According to a study by PWA, the main factor exacerbating shoreline erosion in southern Monterey Bay is hydraulic sand mining from the beach at the Lapis mine in Marina. The study indicates that the mining operations account for a reduction of approximately 200,000 yd3 of sand per year from the littoral cell, which would otherwise replenish the beaches up and down the coast. This volume of sand loss accounts for 2 ft of beach loss each year, which is approximately 50-75% of the ongoing erosion that occurs in southern Monterey Bay (PWA, 2008). The economic cost of the additional beach erosion that results from sand mining has not been accounted for in previous studies.
2Relevant policies from Marina’s LCP include: “1) existing surf zone sand mining operations, as
established coastal dependent uses, shall be permitted to continue at their existing locations in
substantially the same manner as they are currently being conducted, and have been conducted in the
past. All provisions of the LCP (including the Implementation Plan) relating to mining shall be construed
and applied in a manner that supports such continuation of existing surf zone sand mining operations, so
long as such existing surf zone sand mining operations are in accordance with the LCP.
2) the City shall not approve or renew a Mining Permit and/or Coastal Development Permit for new surf
zone or beach sand mining, if it finds that such new sand mining, either individually or cumulatively, will
have significant adverse impacts on shoreline erosion.” (PWA, 2008)
3 Average width of beach = 200 ft/average erosion rate 4 ft/year = 50 years (PWA, 2008).

Pohl
Lapis Sand Dollars. Pohl and Johnston 6
This report aims to provide an analysis of the economic costs incurred by private sectors and the public as a result of the increased erosion caused by the mine. This information may support current and future decisions regarding coastal planning and regulation. The following analysis attempts to quantify a portion of the non-market values of the beaches that are impacted by Lapis by utilizing the two methodologies; 1) recreational value of beach loss, and 2) cost of seawall maintenance and sand loss mitigation. Location of Study This study focuses on the southern half of Monterey Bay because the Lapis mine primarily affects the southern littoral cell of Monterey Bay, which is bound by the Salinas River to the north and Municipal Wharf II in Monterey to the south and comprises the geographical scope of this study. Figure 3 identifies the location of areas critically affected by erosion in southern Monterey Bay. PWA identified ten specific locations within the highlighted areas in Figure 3. Numbers 1-7 below are labeled specifically in Figure 3, while numbers 8-10 lie within the highlighted areas in Figure 3: 1. Sanctuary Beach Resort near Reservation Road 2. Marina Coast Water District buildings near Reservation Road 3. Sand City and Tioga Avenue west of Highway I (relocate) 4. Seaside Pump Station at Bay Avenue (relocate) 5. Monterey Beach Resort 6. Ocean Harbor House condominiums 7. Monterey La Playa town homes at La Playa Street 8. Monterey Interceptor between Seaside Pump Station and Monterey Beach Resort (relocate) 9. Del Monte Beach Subdivision 10. Monterey Interceptor between Monterey Pump Station and Wharf II (relocate)

Pohl
Lapis Sand Dollars. Pohl and Johnston 7
Figure 3: Locations of critical areas of erosion
Source: PWA, 2008 Of these locations, this report provides an analysis of the costs incurred where seawalls have been or potentially could be installed as a means of protecting existing buildings. Seawall construction, while preventing near term damage to shore front structures, also causes additional shoreline erosion in the vicinity of the project, which requires sand loss mitigation. This has already occurred at locations where seawalls have been installed such as the Monterey Beach Resort and the Ocean Harbor House (OHHS, 2004). The areas marked with “relocate” in the list above indicate that a seawall will not have to be installed, but that the area or fixture will have to be entirely relocated. These relocations will incur additional costs, the calculations of which are beyond the scope of this study. Methodology 1: Recreational value of beach loss Tourism is the second largest industry in Monterey County. Because the beach from Moss Landing to Wharf II in Monterey is publicly accessible and frequently visited, this is one of the main losses that the public incurs due to erosion from Lapis. In this section, we place a recreational value on the land tied directly to the lost public access to these beaches due to erosion from sand extraction by Lapis.
Pohl
Lapis Sand Dollars. Pohl and Johnston 8
The beaches of southern Monterey Bay offer an estimated $13 per person in this area in consumer surplus (OHHS, 2004). This equates to a recreational value of beach of $253,001/acre (OHHS, 2004) in front of Ocean Harbor House Condominiums. This small area of beach is literally continuous with the rest of southern Monterey Bay beach, both to the north and to the south, so we extrapolate these numbers in the following calculations (benefit transfer). Thus, the annual recreational value of Monterey Bay beaches affected by erosion due to Lapis is $1,099,762.4 In addition to the lost beach area, erosion has caused the need for seawalls in front of coastal structures. The seawalls themselves cause additional erosion, half of which can be attributed to Lapis, and this must be accounted for in the annual recreational value of beach loss (OHHS, 2004). Currently two seawalls exist: one at Ocean Harbor House Condominiums, and one at the Monterey Bay Beach Resort (Best Western) both in Seaside. The combined annual recreational value of beach lost in front of these seawalls is $4,745.61 (see appendix A). When added to the recreational value of beach lost above, the total annual recreational value of beach lost due to Lapis in southern Monterey Bay is $1,104,804 (see appendix A). Additional seawalls will potentially need to be built to protect existing structures from the effects of the rising sea levels and surf zone encroachment, including Sanctuary Beach Resort near Reservation Road, Marina Coast Water District buildings near Reservation Road, and Monterey La Playa Town Homes on La Playa Street. If these areas were protected by seawalls, the additional erosion could add an additional $18,166.24 (see appendix A) annually in lost recreational value of beach due to Lapis. Methodology 2: Cost of seawall maintenance and sand loss mitigation Sea level rise and climate change events cause the shoreline of Monterey Bay to retreat, but the urgency of building these seawalls increases with the additional erosion caused by Lapis. In this section, we examine the cost of building the seawalls and the sand mitigation to maintain these seawalls, appropriated to Lapis. While Methodology 1 is a true non-market valuation, this methodology reflects a hybrid market/non-market valuation. The cost of sand per cubic yard is a market value, but this cost is not normally considered when discussing the impact of mining. Although the seawalls are built once and sand mitigation is not maintained on a yearly basis, we break these numbers down into annual amounts so that they are comparable with the annual costs we have already discussed.
4 18 miles total beach affected by sand loss from Lapis x 5280 ft/mile (conversion) = 95040 ft length of
beach affected. 95040 ft x 4 ft average projected erosion rate of Mty Bay = 380160 sq ft/yr area beach in
Mty Bay affected by erosion. 380160 sq ft x 0.5 (50% erosion due to Lapis) = 190080 sq ft/yr total area
beach in Mty Bay affected by erosion due to Lapis. 190080 sq ft/yr x 43560 sq ft/acre (conversion) = 4.36
acre/yr total area of beach in Mty Bay affected by erosion due to Lapis. 4.36 acre/yr x 207714
$2004/acre annual recreational value of Mty beach = 905633.04 $2004/yr = $1099762 in 2012 dollars.

Pohl
Lapis Sand Dollars. Pohl and Johnston 9
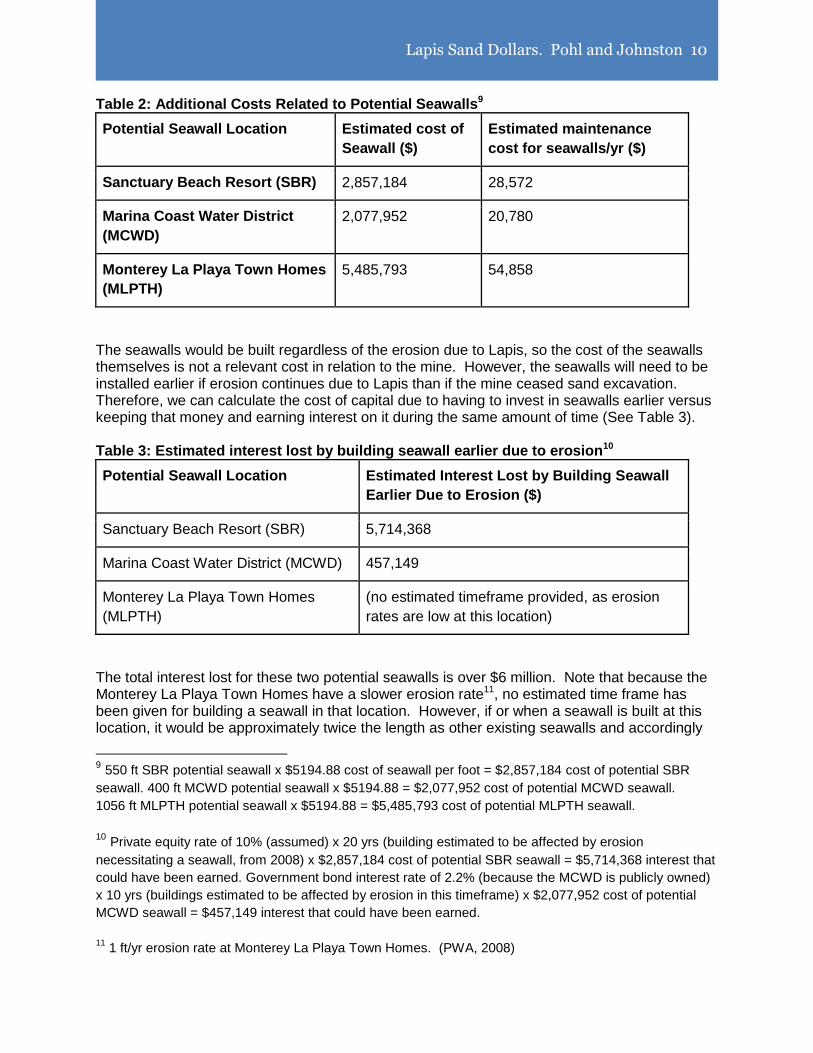
Extrapolating from information from Ocean Harbor House Seawall (OHHS), we calculate that the cost to replace sand due to erosion per foot of seawall is $61.11/ft annually.5 To use this value in other calculations, the seawall must have similar erosion rates to OHHS (~1.25ft/yr), which was the case for the Monterey Beach Resort where the erosion rate is ~1.5ft/yr. The annual cost to mitigate sand loss at the current seawalls (Ocean Harbor House Seawall and Monterey Beach Resort) is estimated at $72,415.35. Yearly maintenance costs for seawalls are estimated to be 1%-4% of total cost of the seawall, annually (Heberger et al, 2009). Average cost of seawalls in northern California is $5194.88/ft.6 Thus, the estimated yearly cost of maintenance for these existing seawalls is $61,559.33 for a total of $133,975/year in mitigation and maintenance costs for existing seawalls.7 If the other three seawalls were to be built, the annual cost to mitigate sand loss in southern Monterey Bay from these seawalls would increase by $122,586.66.8 Table 2 shows the additional costs related to building these potential seawalls. The sum of maintenance and sand loss mitigation costs for these potential seawalls is $226,797.
5 54350 yd
3 sand needed to mitigate OHHS x 50 yrs (length of project) = 1087 yd
3/yr sand loss mitigation
at OHHS. 1087 yd3/yr x $32.89/yd
3 cost to mitigate sand loss = $35,751.43 annual cost to mitigate OHHS
sand loss. $35,751.43/yr / 585 ft length of OHHS = $61.11 annual cost to mitigate sand loss per 1 ft of
seawall.
6 Average cost of seawalls per foot in northern California $2646-$6173 in 2005 dollars = $4409.5 average
cost in 2005 dollars = $5194.88 2012 dollars (Heberger et al, 2009)
7 585 ft length of OHHS + 600 ft length of Monterey Beach Resort seawall = 1185 ft existing seawalls in
S. Mty Bay. 1185 ft x $61.11/yr sand loss mitigation per 1 ft of seawall = $72,415.35 annual cost to
mitigate sand loss at OHHS and Monterey Beach Resort. 1185 ft x $5194.88/ft cost of seawalls x 1%
estimated annual maintenance cost for seawalls = $61,559.33/yr estimated cost of maintenance for
existing seawalls.
8 1056 ft length of potential seawall at Monterey La Playa town homes (measured) + 550 ft length of
potential seawall at Sanctuary Beach Resort + 400 ft length of potential seawall at Marina Coast Water
District buildings = 2006 ft additional length of seawall in southern Monterey Bay. 2006 ft x $61.11/yr =
$122,586.66 additional annual cost to mitigate sand loss in southern Monterey Bay.
Pohl
Lapis Sand Dollars. Pohl and Johnston 10
Table 2: Additional Costs Related to Potential Seawalls9
Potential Seawall Location Estimated cost of
Seawall ($)
Estimated maintenance
cost for seawalls/yr ($)
Sanctuary Beach Resort (SBR) 2,857,184 28,572
Marina Coast Water District
(MCWD)
2,077,952 20,780
Monterey La Playa Town Homes
(MLPTH)
5,485,793 54,858
The seawalls would be built regardless of the erosion due to Lapis, so the cost of the seawalls themselves is not a relevant cost in relation to the mine. However, the seawalls will need to be installed earlier if erosion continues due to Lapis than if the mine ceased sand excavation. Therefore, we can calculate the cost of capital due to having to invest in seawalls earlier versus keeping that money and earning interest on it during the same amount of time (See Table 3). Table 3: Estimated interest lost by building seawall earlier due to erosion10
Potential Seawall Location Estimated Interest Lost by Building Seawall
Earlier Due to Erosion ($)
Sanctuary Beach Resort (SBR) 5,714,368
Marina Coast Water District (MCWD) 457,149
Monterey La Playa Town Homes
(MLPTH)
(no estimated timeframe provided, as erosion
rates are low at this location)
The total interest lost for these two potential seawalls is over $6 million. Note that because the Monterey La Playa Town Homes have a slower erosion rate11, no estimated time frame has been given for building a seawall in that location. However, if or when a seawall is built at this location, it would be approximately twice the length as other existing seawalls and accordingly
9 550 ft SBR potential seawall x $5194.88 cost of seawall per foot = $2,857,184 cost of potential SBR
seawall. 400 ft MCWD potential seawall x $5194.88 = $2,077,952 cost of potential MCWD seawall.
1056 ft MLPTH potential seawall x $5194.88 = $5,485,793 cost of potential MLPTH seawall.
10 Private equity rate of 10% (assumed) x 20 yrs (building estimated to be affected by erosion
necessitating a seawall, from 2008) x $2,857,184 cost of potential SBR seawall = $5,714,368 interest that
could have been earned. Government bond interest rate of 2.2% (because the MCWD is publicly owned)
x 10 yrs (buildings estimated to be affected by erosion in this timeframe) x $2,077,952 cost of potential
MCWD seawall = $457,149 interest that could have been earned.
11
1 ft/yr erosion rate at Monterey La Playa Town Homes. (PWA, 2008)

Pohl
Lapis Sand Dollars. Pohl and Johnston 11
more expensive. Interest lost to building that seawall is not calculated here since the building of a seawall would be significantly in the future12, but this potential cost should be factored into decision making processes. Conclusion Extensive geotechnical and engineering evidence supports the conclusion that Lapis is directly responsible for the rapid erosion of the beach and dune ecosystem of southern Monterey Bay. In an effort to quantify the economic impact and environmental costs of the mine, this study conducted non-market analysis and found (Methodology 1) that the annual recreational value of Monterey Bay beaches affected by erosion due to Lapis is $1,104,804. An alternative valuation method (Methodology 2) shows that the annual cost of seawall maintenance and mitigation of sand loss at existing seawall sites is $133,975. If the other seawalls were to be built, this number would increase by at least $226,797 per year, and estimated interest lost by building seawalls earlier due to erosion could be between approximately $450,000 to more than $6 million. A third possible methodology would be to evaluate the real estate value of the beaches that will be lost due to erosion caused by the mine. Because the 18 km of beach between Moss Landing and Wharf II in Monterey are primarily public, state-owned beaches, this area is not expected to incur significant development in the future. Although this stretch of beach is public, if it were private land, southern Monterey Bay would experience approximately $5,294,596 worth of annual beach loss due to Lapis sand mining operations. Including additional methods of non-market valuation could greatly strengthen the findings of this study. However, due to limitations in time and resources, additional methodologies were beyond the scope of this report. This study provides a starting point for additional non-market valuation studies to build upon in the future.
It is important to remember that the calculations of cost are conservative and do not
comprehensively reflect the entire non-market values of the beaches and dunes of southern
Monterey Bay. In addition, this study does not take into account the full range of ecosystem
services provided by the beaches and dunes, such as the value of habitat for endangered
species and unique biodiversity, the existence value that community and visitors have for
beaches and dunes, or the value of hydrologic functions they provide. It is worth pointing out
that Lapis produces 19 jobs and ~$202,000/yr in property tax revenue to Monterey County
community (appendix B). These are important factors to consider for coastal management
planning. However, the intention of this study was to put a value on the externalities of the
Lapis Lustre sand mine, which had previously not been attempted. In short, the estimates
provided herein do not consider the full range of non-market costs that the public bears in order
to support the private extraction of a public good. We hope that local decision makers will
consider the findings herein during current and future discussions of the Lapis mine.
Considering the non-market implications of any natural resource use can lead to better-informed
policy and regulations that benefit both the environment and the economy.
12
Average width of beach = 200 ft (PWA, 2008). Average erosion rate at MLPTH = 1 ft/yr. 200 ft / (1 ft/yr)
= 200 yrs before surf reaches MLPTH.

Pohl
Lapis Sand Dollars. Pohl and Johnston 12
Appendix A Calculations for non-market recreational value of beach loss due to Lapis. Ocean Harbor House Condominiums 435 ft shoreline affected x 1.7 ft/yr erosion rate at this location = 739.5 sq ft/yr area affected annually at OHHC 739.5 sq ft/yr x 0.5 (50% erosion due to Lapis) = 369.75 sq ft/yr area beach by OHHC affected by erosion due to Lapis 369.75 sq ft/yr / 43560 sq ft/acre (conversion) = 0.0085 acre/yr area beach by OHHC affected by erosion due to Lapis 0.0085 acre/yr x 207714 $/acre annual recreational value of s Mty beach = $1763.14/yr (2004 years) = $2147.55 (2012 years) annual recreational value of beach by OHHC affected by erosion due to Lapis Monterey Bay Beach Resort 600 ft shoreline affected x 1.5 ft/yr erosion rate at this location = 900 sq ft/yr area affected annually at MBBR 900 sq ft/yr x 0.5 (50% erosion due to Lapis) = 450 sq ft/yr area beach by MBBR affected by erosion due to Lapis 450 sq ft/yr / 43560 sq ft/acre (conversion) = 0.0103 acre/yr area beach by MBBR affected by erosion due to Lapis 0.0103 acre/yr x 207714 $/acre annual recreational value of s Mty beach = $2139.45/yr (2004 years) = $2598.06 (2012 years) annual recreational value of beach by MBBR affected by erosion due to Lapis Sanctuary Beach Resort 550 ft shoreline affected x 5.5 ft/yr erosion rate at this location = 3025 sq ft/yr area affected annually at SBR 3025 sq ft/yr x 0.5 (50% erosion due to Lapis) = 1512.5 sq ft/yr area beach by SBR affected by erosion due to Lapis 1512.5 sq ft/yr / 43560 sq ft/acre (conversion) = 0.03472 acre/yr area beach by SBR affected by erosion due to Lapis 0.03472 acre/yr x 207714 $/acre annual recreational value of s Mty beach = $7211.83/yr (2004 years) = $8757.73 (2012 years) annual recreational value of beach by SBR affected by erosion due to Lapis Marina Coast Water District 400 ft shoreline affected x 5.5 ft/yr erosion rate at this location = 2200 sq ft/yr area affected annually at MCWD 2200 sq ft/yr x 0.5 (50% erosion due to Lapis) = 1100 sq ft/yr area beach by MCWD affected by erosion due to Lapis 1100 sq ft/yr / 43560 sq ft/acre (conversion) = 0.0253 acre/yr area beach by MCWD affected by erosion due to Lapis 0.0253 acre/yr x 207714 $/acre annual recreational value of s Mty beach = $5255.17/yr (2004 years) = $6381.64 (2012 years) annual recreational value of beach by MCWD affected by erosion due to Lapis Monterey La Playa Town Homes 1056 ft shoreline affected x 1 ft/yr erosion rate at this location = 1056 sq ft/yr area affected annually at MLPTH
Pohl
Lapis Sand Dollars. Pohl and Johnston 13
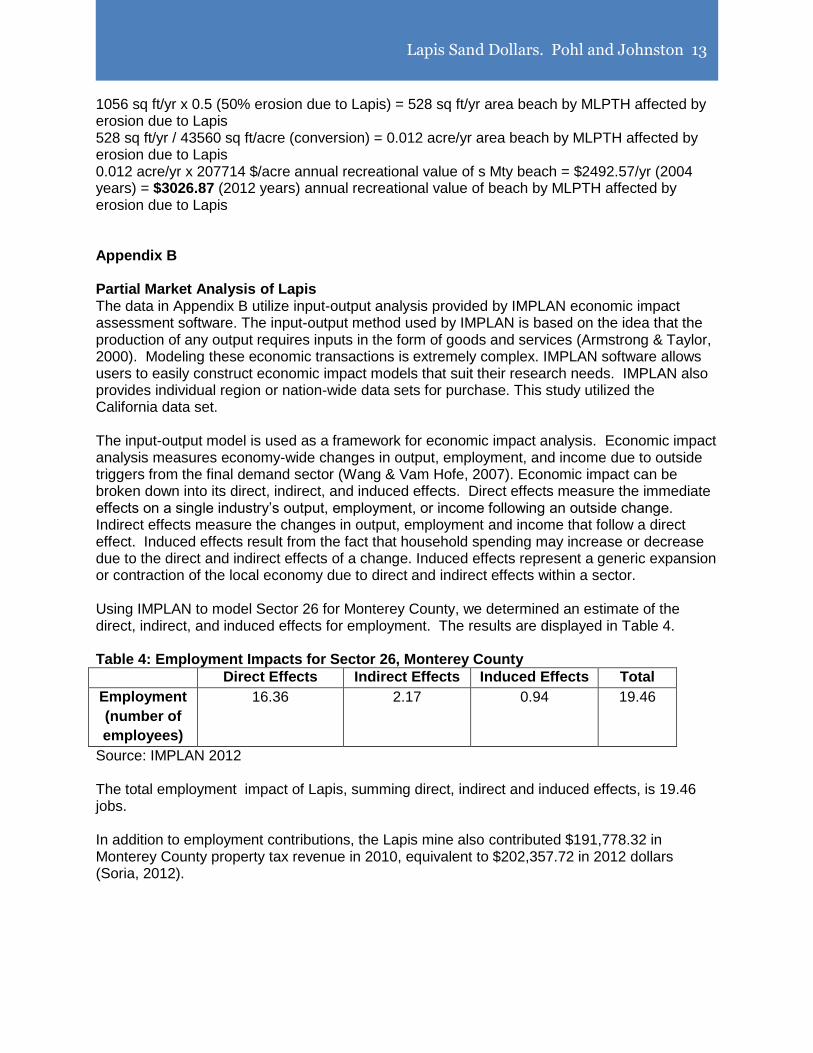
1056 sq ft/yr x 0.5 (50% erosion due to Lapis) = 528 sq ft/yr area beach by MLPTH affected by erosion due to Lapis 528 sq ft/yr / 43560 sq ft/acre (conversion) = 0.012 acre/yr area beach by MLPTH affected by erosion due to Lapis 0.012 acre/yr x 207714 $/acre annual recreational value of s Mty beach = $2492.57/yr (2004 years) = $3026.87 (2012 years) annual recreational value of beach by MLPTH affected by erosion due to Lapis Appendix B Partial Market Analysis of Lapis The data in Appendix B utilize input-output analysis provided by IMPLAN economic impact assessment software. The input-output method used by IMPLAN is based on the idea that the production of any output requires inputs in the form of goods and services (Armstrong & Taylor, 2000). Modeling these economic transactions is extremely complex. IMPLAN software allows users to easily construct economic impact models that suit their research needs. IMPLAN also provides individual region or nation-wide data sets for purchase. This study utilized the California data set. The input-output model is used as a framework for economic impact analysis. Economic impact analysis measures economy-wide changes in output, employment, and income due to outside triggers from the final demand sector (Wang & Vam Hofe, 2007). Economic impact can be broken down into its direct, indirect, and induced effects. Direct effects measure the immediate effects on a single industry’s output, employment, or income following an outside change. Indirect effects measure the changes in output, employment and income that follow a direct effect. Induced effects result from the fact that household spending may increase or decrease due to the direct and indirect effects of a change. Induced effects represent a generic expansion or contraction of the local economy due to direct and indirect effects within a sector. Using IMPLAN to model Sector 26 for Monterey County, we determined an estimate of the direct, indirect, and induced effects for employment. The results are displayed in Table 4. Table 4: Employment Impacts for Sector 26, Monterey County
Direct Effects Indirect Effects Induced Effects Total
Employment
(number of
employees)
16.36 2.17 0.94 19.46
Source: IMPLAN 2012 The total employment impact of Lapis, summing direct, indirect and induced effects, is 19.46 jobs. In addition to employment contributions, the Lapis mine also contributed $191,778.32 in Monterey County property tax revenue in 2010, equivalent to $202,357.72 in 2012 dollars (Soria, 2012).
Pohl
Lapis Sand Dollars. Pohl and Johnston 14
Works Cited Armstrong and Taylor. The Input-Output Approach to Modeling the Regional Economy. Rep. 3rd ed. Regional Economics and Policy, 2000. Hart, Earl. Mines and Mineral Resources of Monterey County, California. County Report 5, California Division of Mines and Geology. 1966. http://archive.org/stream/minesandmineral05hart#page/n5/mode/2up Heberger, Matthew, Heather Cooley, Pablo Herrera, Peter Gleick, and Eli
Moore. Impacts of Sea Level Rise on the California Coast. Rep. California Climate Change Center, 2009.
Ocean Harbor House Homeowners’ Association (OHHS). "Revised Findings for Coastal Development Permit Application." California Coastal Commission, 16 Dec. 2004. Web. <http://www.coastal.ca.gov/sc/Th13a-1-2005.pdf>. PWA. Coastal Regional Sediment Management Plan for Southern Monterey Bay. Tech. no. 1902.00. PWA, 2008. Soria, Frank, Office of Tax Collection Monterey County. Personal Communication April 27, 2012. Thornton, Edward, Abby Sallenger, Juan C. Sesto, Laura Egley, Timothy McGee,
and Rost Parsons. "Sand Mining Impacts on Long-term Dune Erosion in Southern Monterey Bay." Marine Geology 229 (2006): 45-58.
Thornton, Edward. Sand Mining Impacts on Shoreline Erosion in Southern
Monterey Bay. Rep. Web. July 2007. http://www.csc.noaa.gov/cz/CZ07_Proceedings/PDFs/Monday_Abstracts/2866.Thornton.pdf
Wang and Vam Hofe. "Input-Output Analysis for Planning Purposes." Research Methods in Urban Planning. Springer, 2007. Wiley, Peter C., Vernon R. Leeworthy, and Edward A. Stone. Southern California
Beach Valuation Project: Economic Impact of Beach Closures and Changes in Water Quality for Beaches in Southern California. Rep. National Oceanic and Atmospheric Administration, National Ocean Service Management and Budget Office, 2006.

Pohl
Lapis Sand Dollars. Pohl and Johnston 15
Acknowledgements We would like to thank Jason Scorse, Ph.D. and Fernando DePaolis, Ph.D. for offering the first iteration of Ocean and Coastal Economics at the Monterey Institute of International Studies, and for their dedication to students’ understanding of economic issues. We would also like to thank the following people for their helpful insights as we conducted this study. Gary Griggs, Professor, University of California Santa Cruz Mike Watson, California Coastal Commission Santa Cruz Dave Revell, Philip Williams & Associates, Ltd. Nancy Cave, California Coastal Commission Frank Soria, Office of Tax Collection, Monterey County Theresa Szymanis, Planning Services Manager, City of Marina