lao agricultural census: 2010/11 - food and agriculture ... · pdf filelao agricultural census...
TRANSCRIPT

Result of Analysis on Lao Agricultural Census 2010/11
Mr. Souksavanh INTHARACK Senior Statistician of Center for Agricultural Statistics, Department of Planning
and Cooperation, Ministry of Agriculture and Forestry, Lao PDR. E-mail: [email protected]
18-21 February 2014
Don Chan Palace Hotel
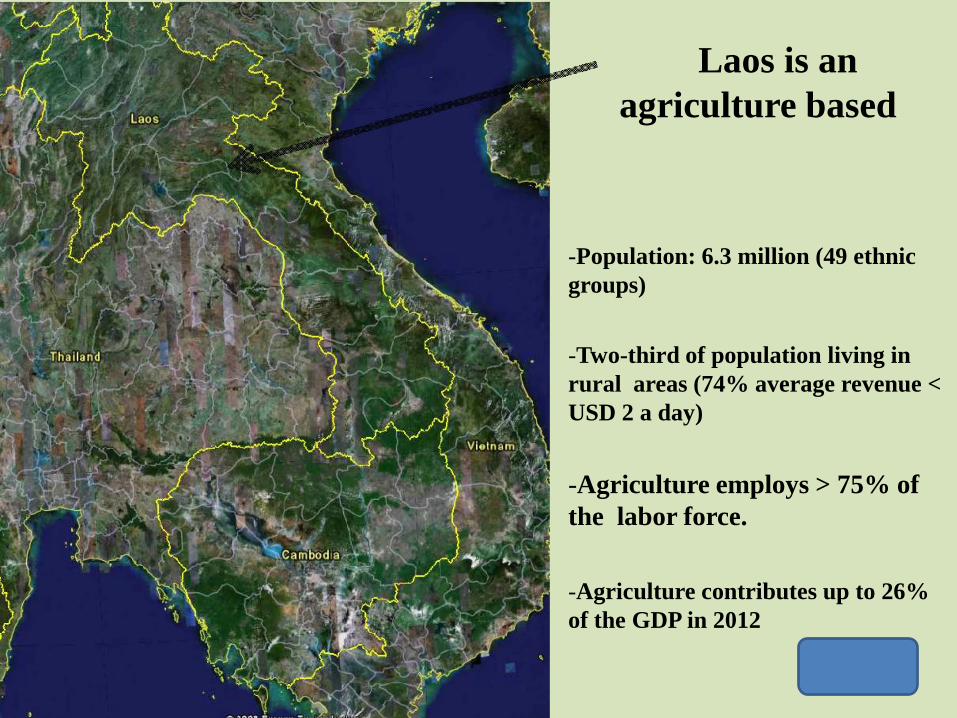
Laos is an
agriculture based -Population: 6.3 million (49 ethnic groups)
-Two-third of population living in rural areas (74% average revenue < USD 2 a day)
-Agriculture employs > 75% of the labor force.
-Agriculture contributes up to 26% of the GDP in 2012

1. Lao Census of Agriculture 2010/11: an overview
The Lao Census of Agriculture 2010/11 was the second agricultural census undertaken in Lao PDR.
There have been many changes in agriculture sector since the first census was conducted in 1998/99 and it was important to capture the changes through another census so as to help devise agriculture development policies and future strategies.
The LCA 2010/11 was much more comprehensive, with significant improvements in the system of data collection as well as coverage of themes and topics.
It was based on a critical review of the LCA 1998/99 by the MAF, with technical inputs and support provided by the FAO, including the recommendations of an Agricultural Statistics Expert
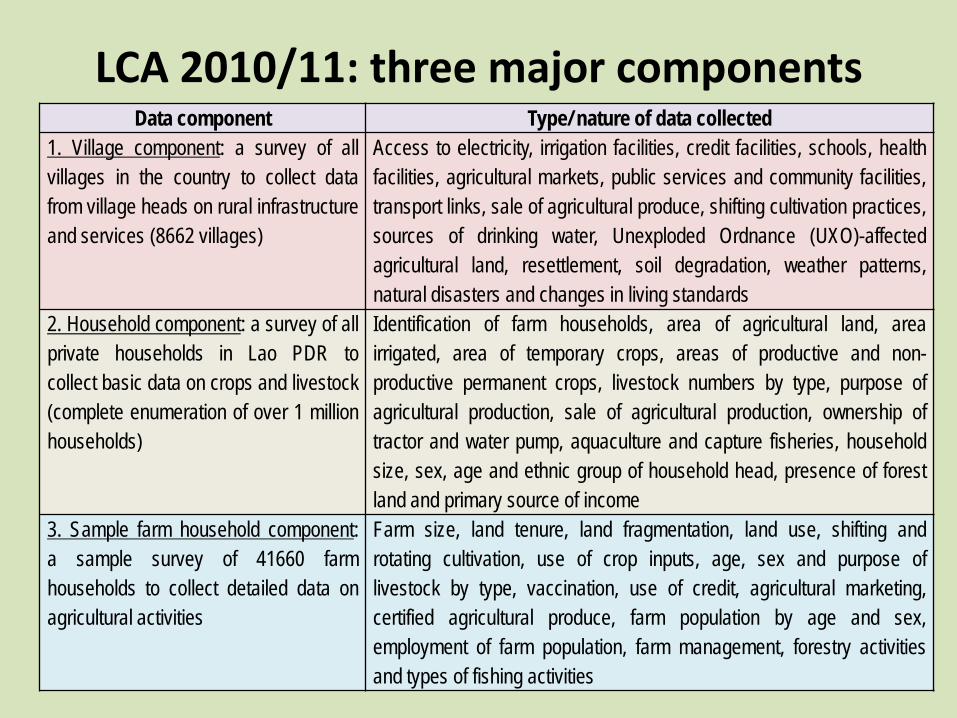
LCA 2010/11: three major components Data component Type/ nature of data collected
1. Village component: a survey of all villages in the country to collect data from village heads on rural infrastructure and services (8662 villages)
Access to electricity, irrigation facilities, credit facilities, schools, health facilities, agricultural markets, public services and community facilities, transport links, sale of agricultural produce, shifting cultivation practices, sources of drinking water, Unexploded Ordnance (UXO)-affected agricultural land, resettlement, soil degradation, weather patterns, natural disasters and changes in living standards
2. Household component: a survey of all private households in Lao PDR to collect basic data on crops and livestock (complete enumeration of over 1 million households)
Identification of farm households, area of agricultural land, area irrigated, area of temporary crops, areas of productive and non-productive permanent crops, livestock numbers by type, purpose of agricultural production, sale of agricultural production, ownership of tractor and water pump, aquaculture and capture fisheries, household size, sex, age and ethnic group of household head, presence of forest land and primary source of income
3. Sample farm household component: a sample survey of 41660 farm households to collect detailed data on agricultural activities
Farm size, land tenure, land fragmentation, land use, shifting and rotating cultivation, use of crop inputs, age, sex and purpose of livestock by type, vaccination, use of credit, agricultural marketing, certified agricultural produce, farm population by age and sex, employment of farm population, farm management, forestry activities and types of fishing activities
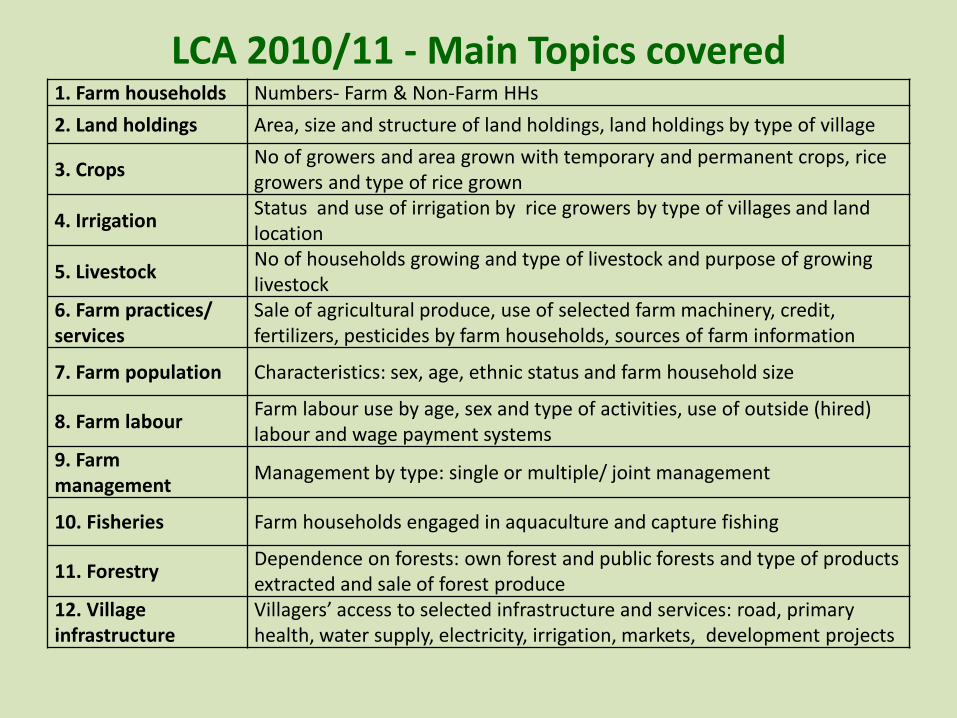
LCA 2010/11 - Main Topics covered 1. Farm households Numbers- Farm & Non-Farm HHs
2. Land holdings Area, size and structure of land holdings, land holdings by type of village
3. Crops No of growers and area grown with temporary and permanent crops, rice growers and type of rice grown
4. Irrigation Status and use of irrigation by rice growers by type of villages and land location
5. Livestock No of households growing and type of livestock and purpose of growing livestock
6. Farm practices/ services
Sale of agricultural produce, use of selected farm machinery, credit, fertilizers, pesticides by farm households, sources of farm information
7. Farm population Characteristics: sex, age, ethnic status and farm household size
8. Farm labour Farm labour use by age, sex and type of activities, use of outside (hired) labour and wage payment systems
9. Farm management
Management by type: single or multiple/ joint management
10. Fisheries Farm households engaged in aquaculture and capture fishing
11. Forestry Dependence on forests: own forest and public forests and type of products extracted and sale of forest produce
12. Village infrastructure
Villagers’ access to selected infrastructure and services: road, primary health, water supply, electricity, irrigation, markets, development projects
Thematic reports based on LCA 2010/11
1. Profile of farm households in Lao PDR.
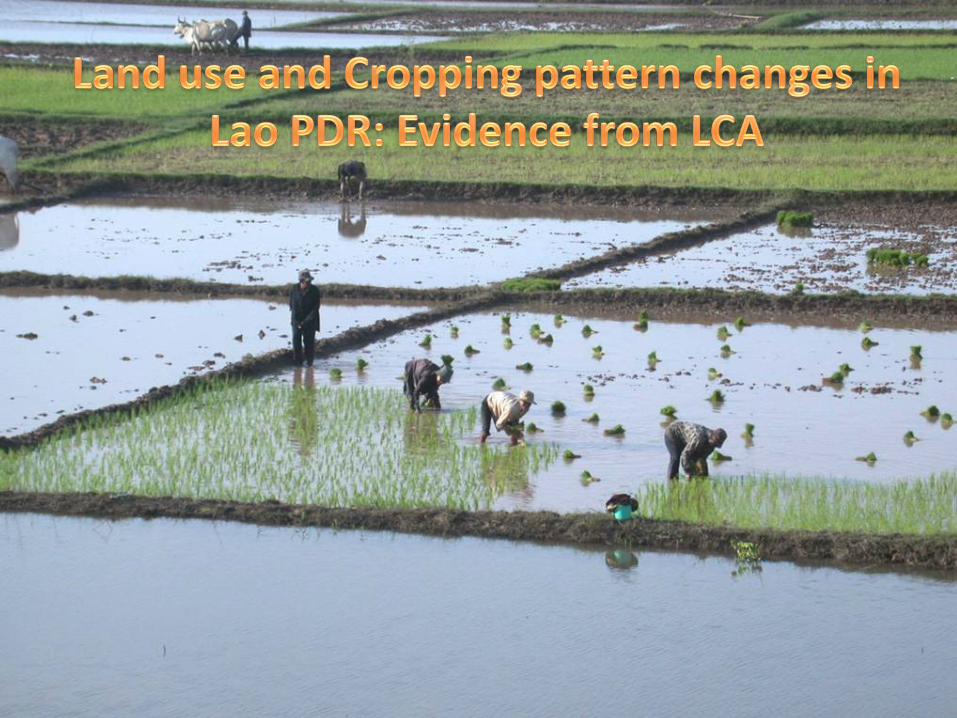
2. Land use, cropping pattern changes and agricultural performance in Lao PDR.
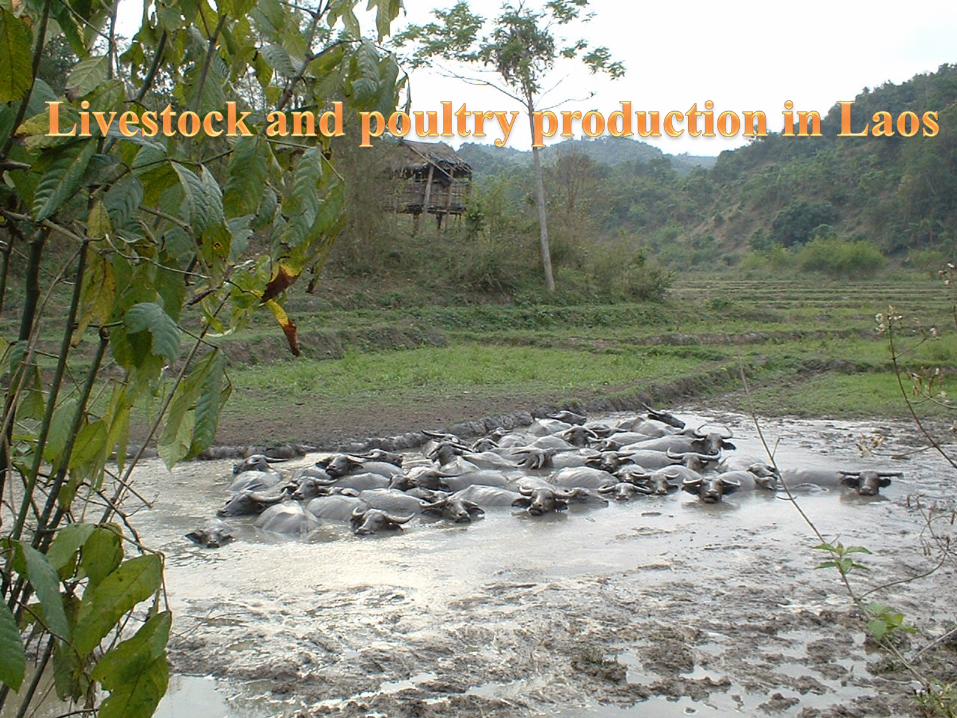
3. Livestock sector in Lao PDR .
4. Forestry, aquaculture and fisheries sectors in Lao PDR.
5. Status of Infrastructure and Development Constraints in the Lao PDR Villages .
6. Gender in Agriculture in Lao PDR.
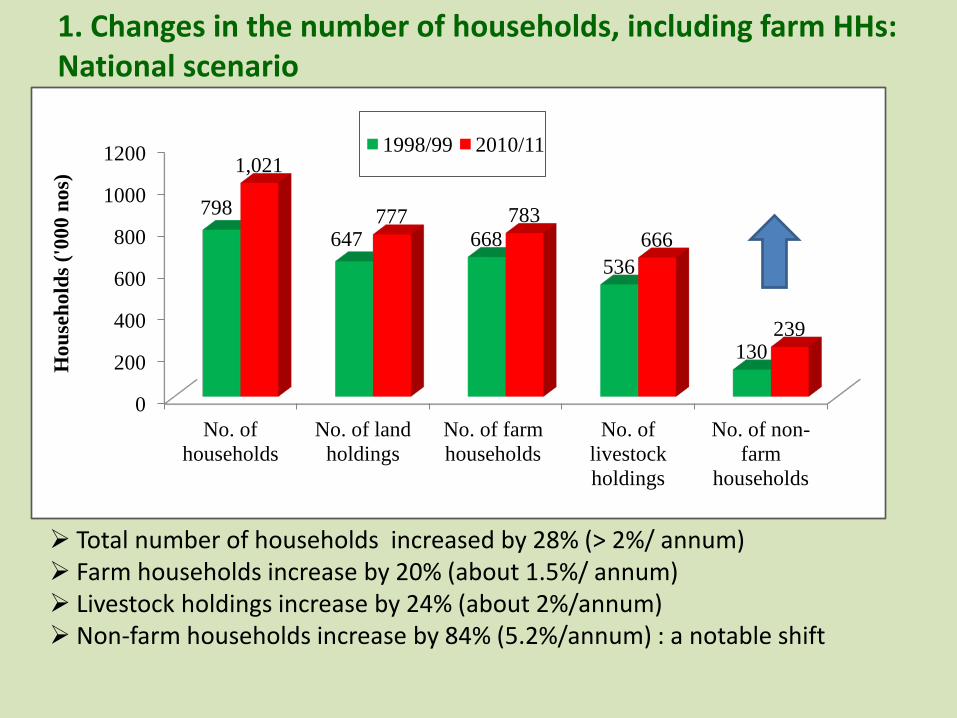
1. Changes in the number of households, including farm HHs: National scenario
0
200
400
600
800
1000
1200
No. of households
No. of land holdings
No. of farm households
No. of livestock holdings
No. of non-farm
households
798 647 668
536
130
1,021
777 783 666
239
Hou
seho
lds (
'000
nos
)
1998/99 2010/11
Total number of households increased by 28% (> 2%/ annum) Farm households increase by 20% (about 1.5%/ annum) Livestock holdings increase by 24% (about 2%/annum) Non-farm households increase by 84% (5.2%/annum) : a notable shift
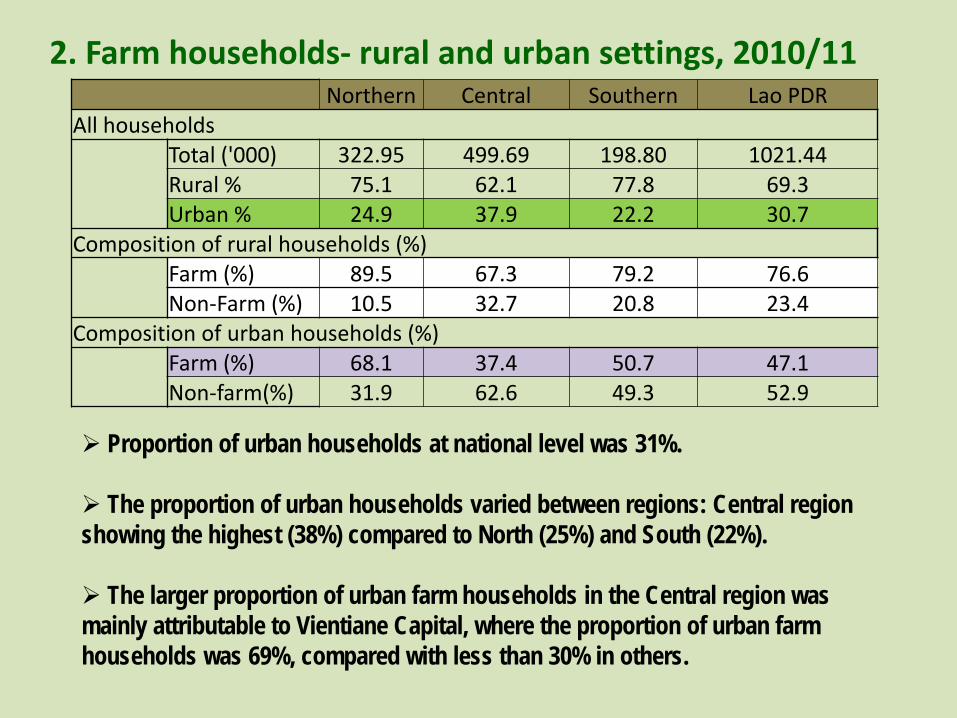
2. Farm households- rural and urban settings, 2010/11 Northern Central Southern Lao PDR All households
Total ('000) 322.95 499.69 198.80 1021.44 Rural % 75.1 62.1 77.8 69.3 Urban % 24.9 37.9 22.2 30.7
Composition of rural households (%) Farm (%) 89.5 67.3 79.2 76.6 Non-Farm (%) 10.5 32.7 20.8 23.4
Composition of urban households (%) Farm (%) 68.1 37.4 50.7 47.1 Non-farm(%) 31.9 62.6 49.3 52.9
Proportion of urban households at national level was 31%. The proportion of urban households varied between regions: Central region showing the highest (38%) compared to North (25%) and South (22%).
The larger proportion of urban farm households in the Central region was mainly attributable to Vientiane Capital, where the proportion of urban farm households was 69%, compared with less than 30% in others.
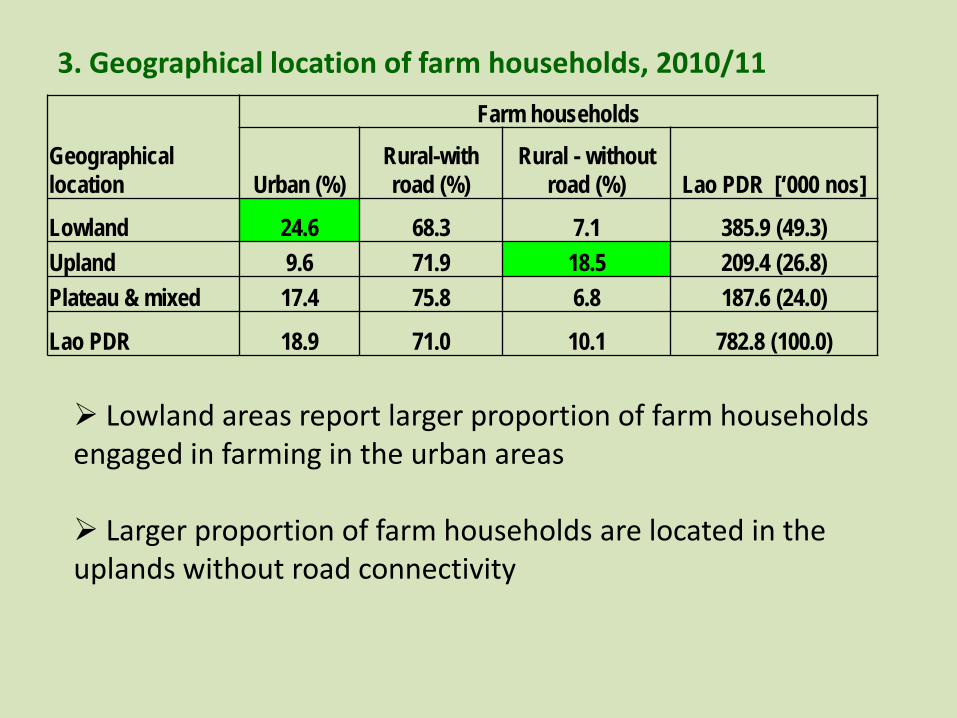
3. Geographical location of farm households, 2010/11
Geographical location
Farm households
Urban (%) Rural-with road (%)
Rural - without road (%) Lao PDR [‘000 nos]
Lowland 24.6 68.3 7.1 385.9 (49.3) Upland 9.6 71.9 18.5 209.4 (26.8) Plateau & mixed 17.4 75.8 6.8 187.6 (24.0)
Lao PDR 18.9 71.0 10.1 782.8 (100.0)
Lowland areas report larger proportion of farm households engaged in farming in the urban areas Larger proportion of farm households are located in the uplands without road connectivity
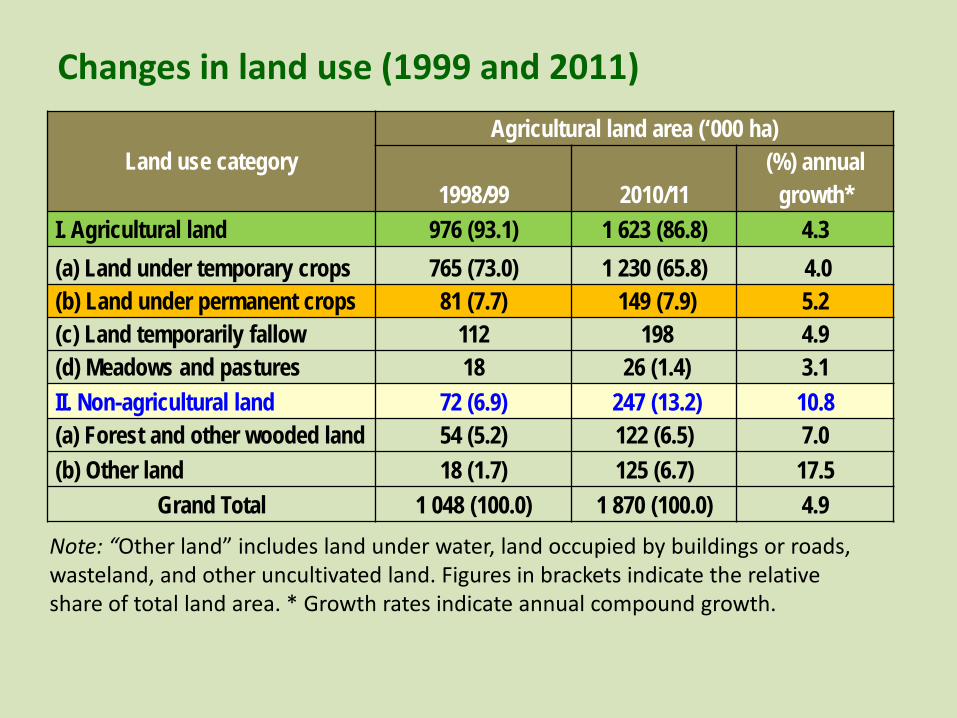
Changes in land use (1999 and 2011)
Land use category Agricultural land area (‘000 ha)
1998/99 2010/11 (%) annual
growth* I. Agricultural land 976 (93.1) 1 623 (86.8) 4.3 (a) Land under temporary crops 765 (73.0) 1 230 (65.8) 4.0 (b) Land under permanent crops 81 (7.7) 149 (7.9) 5.2 (c) Land temporarily fallow 112 198 4.9 (d) Meadows and pastures 18 26 (1.4) 3.1 II. Non-agricultural land 72 (6.9) 247 (13.2) 10.8 (a) Forest and other wooded land 54 (5.2) 122 (6.5) 7.0 (b) Other land 18 (1.7) 125 (6.7) 17.5
Grand Total 1 048 (100.0) 1 870 (100.0) 4.9 Note: “Other land” includes land under water, land occupied by buildings or roads, wasteland, and other uncultivated land. Figures in brackets indicate the relative share of total land area. * Growth rates indicate annual compound growth.
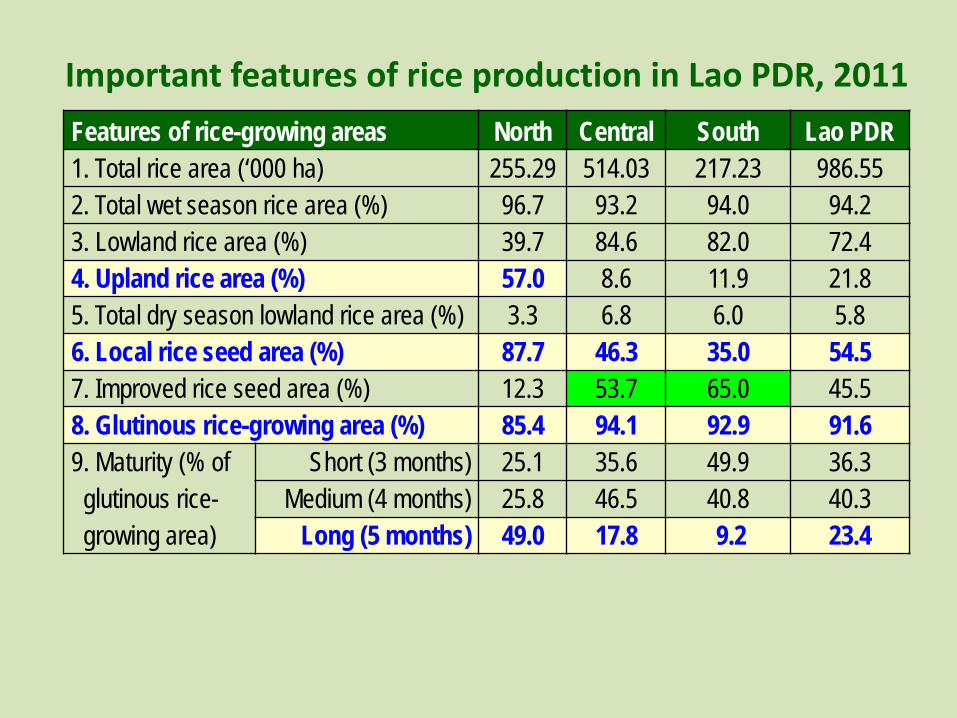
Important features of rice production in Lao PDR, 2011
Features of rice-growing areas North Central South Lao PDR 1. Total rice area (‘000 ha) 255.29 514.03 217.23 986.55 2. Total wet season rice area (%) 96.7 93.2 94.0 94.2 3. Lowland rice area (%) 39.7 84.6 82.0 72.4 4. Upland rice area (%) 57.0 8.6 11.9 21.8 5. Total dry season lowland rice area (%) 3.3 6.8 6.0 5.8 6. Local rice seed area (%) 87.7 46.3 35.0 54.5 7. Improved rice seed area (%) 12.3 53.7 65.0 45.5 8. Glutinous rice-growing area (%) 85.4 94.1 92.9 91.6 9. Maturity (% of glutinous rice-growing area)
Short (3 months) 25.1 35.6 49.9 36.3 Medium (4 months) 25.8 46.5 40.8 40.3
Long (5 months) 49.0 17.8 9.2 23.4
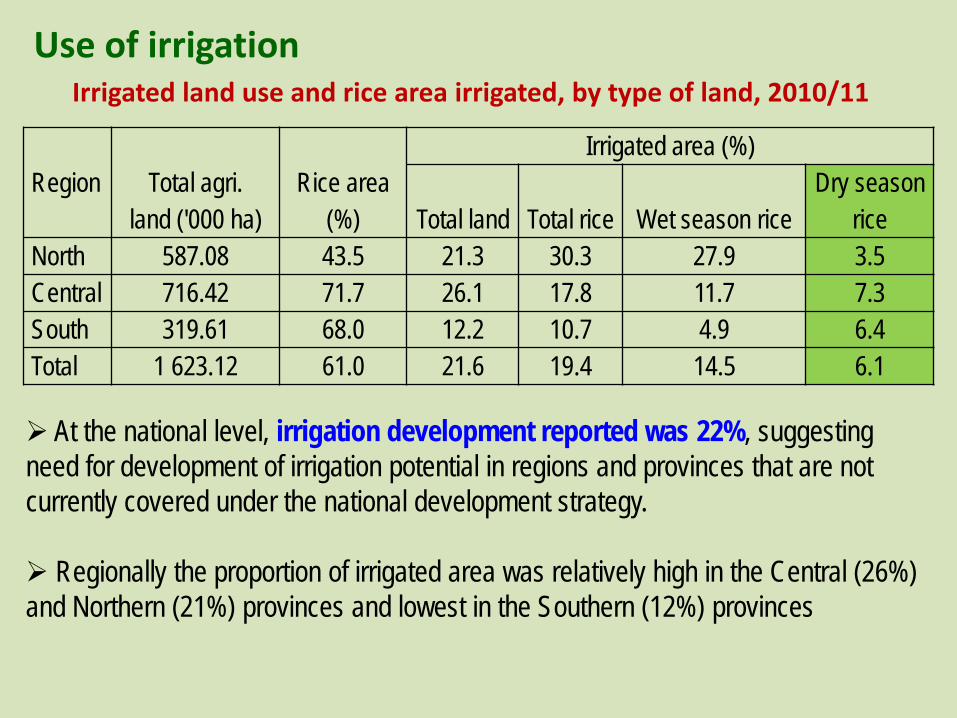
Irrigated land use and rice area irrigated, by type of land, 2010/11
Region Total agri. land ('000 ha)
Rice area (%)
Irrigated area (%)
Total land Total rice Wet season rice Dry season
rice North 587.08 43.5 21.3 30.3 27.9 3.5 Central 716.42 71.7 26.1 17.8 11.7 7.3 South 319.61 68.0 12.2 10.7 4.9 6.4 Total 1 623.12 61.0 21.6 19.4 14.5 6.1
At the national level, irrigation development reported was 22%, suggesting need for development of irrigation potential in regions and provinces that are not currently covered under the national development strategy.
Regionally the proportion of irrigated area was relatively high in the Central (26%) and Northern (21%) provinces and lowest in the Southern (12%) provinces
Use of irrigation
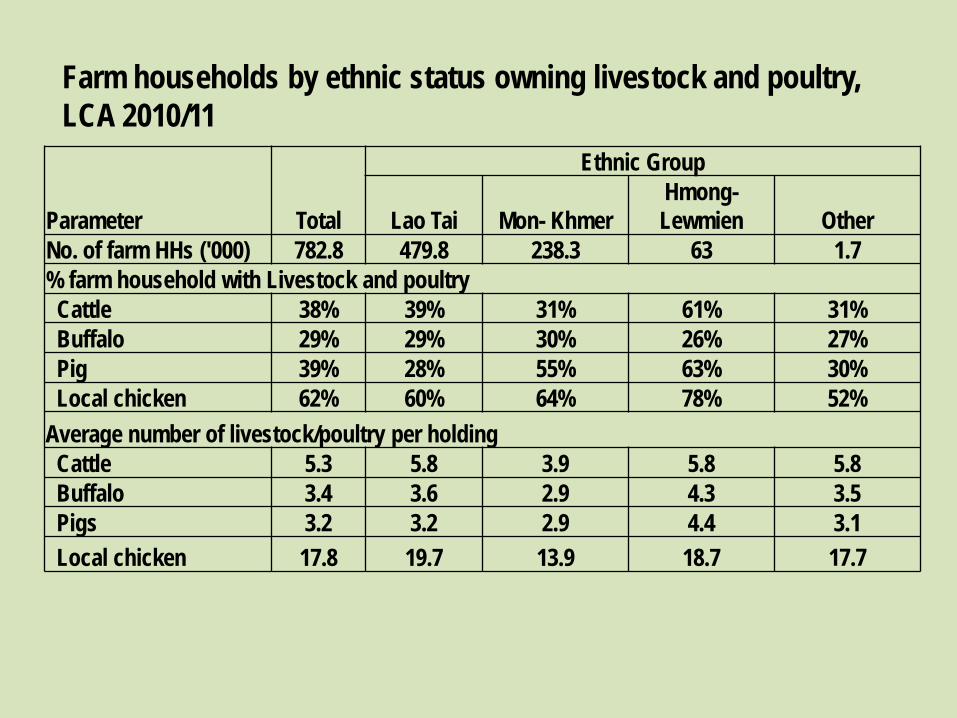
Farm households by ethnic status owning livestock and poultry, LCA 2010/11
Parameter Total
Ethnic Group
Lao Tai Mon- Khmer Hmong- Lewmien
Other
No. of farm HHs ('000) 782.8 479.8 238.3 63 1.7 % farm household with Livestock and poultry Cattle 38% 39% 31% 61% 31% Buffalo 29% 29% 30% 26% 27% Pig 39% 28% 55% 63% 30% Local chicken 62% 60% 64% 78% 52% Average number of livestock/poultry per holding Cattle 5.3 5.8 3.9 5.8 5.8 Buffalo 3.4 3.6 2.9 4.3 3.5 Pigs 3.2 3.2 2.9 4.4 3.1 Local chicken 17.8 19.7 13.9 18.7 17.7
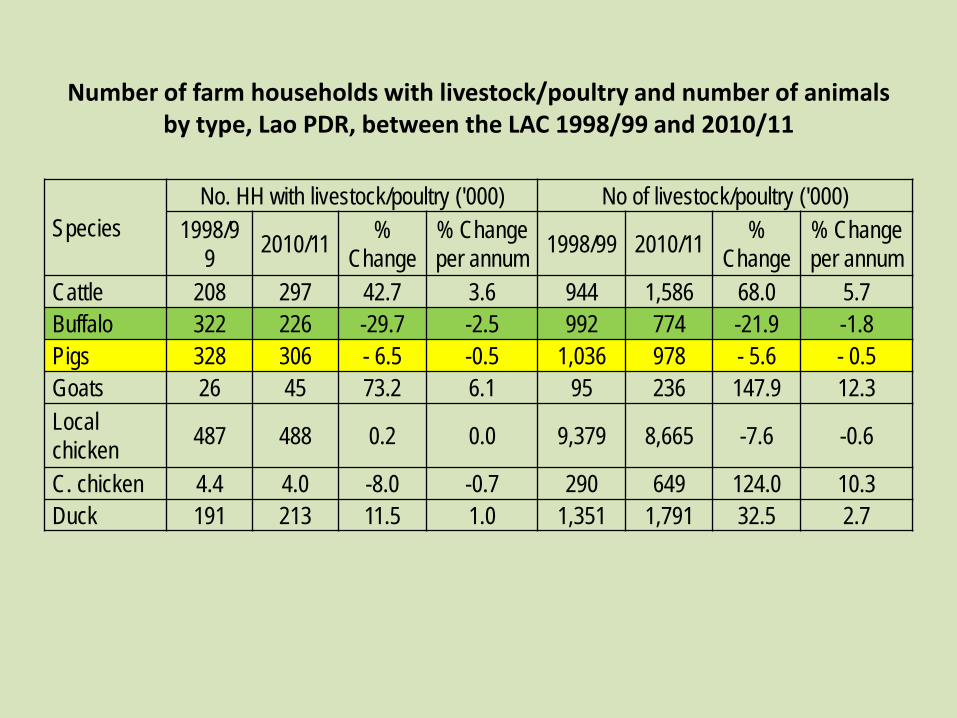
Number of farm households with livestock/poultry and number of animals by type, Lao PDR, between the LAC 1998/99 and 2010/11
Species No. HH with livestock/poultry ('000) No of livestock/poultry ('000)
1998/99 2010/11 %
Change % Change per annum 1998/99 2010/11 %
Change % Change per annum
Cattle 208 297 42.7 3.6 944 1,586 68.0 5.7 Buffalo 322 226 -29.7 -2.5 992 774 -21.9 -1.8 Pigs 328 306 - 6.5 -0.5 1,036 978 - 5.6 - 0.5 Goats 26 45 73.2 6.1 95 236 147.9 12.3 Local chicken 487 488 0.2 0.0 9,379 8,665 -7.6 -0.6
C. chicken 4.4 4.0 -8.0 -0.7 290 649 124.0 10.3 Duck 191 213 11.5 1.0 1,351 1,791 32.5 2.7
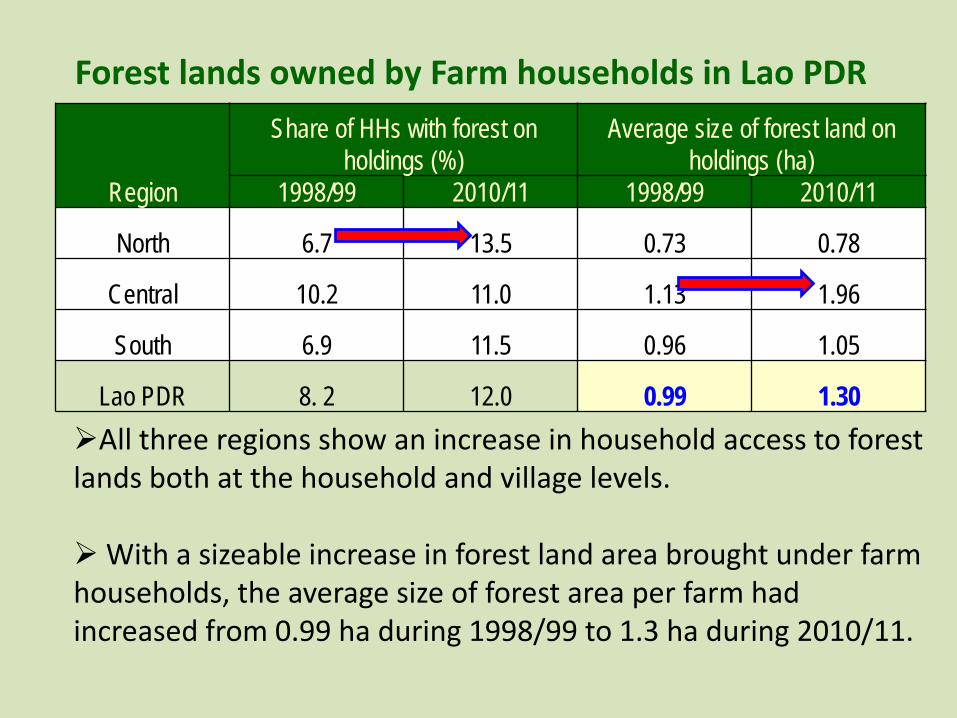
Forest lands owned by Farm households in Lao PDR
Region
Share of HHs with forest on holdings (%)
Average size of forest land on holdings (ha)
1998/99 2010/11 1998/99 2010/11
North 6.7 13.5 0.73 0.78
Central 10.2 11.0 1.13 1.96
South 6.9 11.5 0.96 1.05
Lao PDR 8. 2 12.0 0.99 1.30 All three regions show an increase in household access to forest lands both at the household and village levels.
With a sizeable increase in forest land area brought under farm households, the average size of forest area per farm had increased from 0.99 ha during 1998/99 to 1.3 ha during 2010/11.
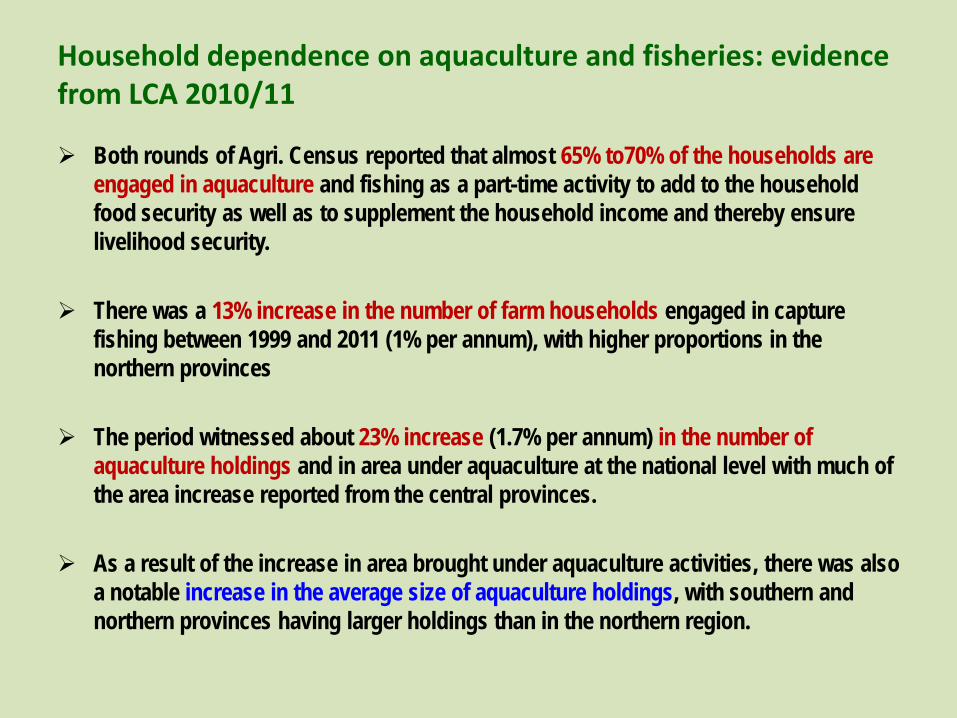
Household dependence on aquaculture and fisheries: evidence from LCA 2010/11
Both rounds of Agri. Census reported that almost 65% to70% of the households are engaged in aquaculture and fishing as a part-time activity to add to the household food security as well as to supplement the household income and thereby ensure livelihood security.
There was a 13% increase in the number of farm households engaged in capture
fishing between 1999 and 2011 (1% per annum), with higher proportions in the northern provinces
The period witnessed about 23% increase (1.7% per annum) in the number of aquaculture holdings and in area under aquaculture at the national level with much of the area increase reported from the central provinces.
As a result of the increase in area brought under aquaculture activities, there was also a notable increase in the average size of aquaculture holdings, with southern and northern provinces having larger holdings than in the northern region.
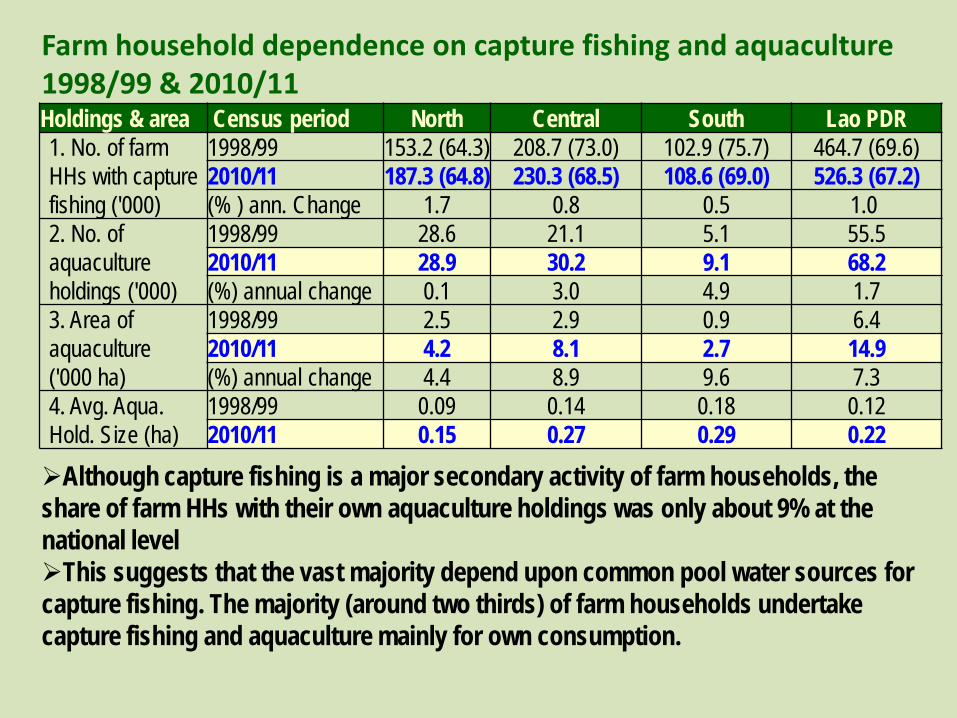
Farm household dependence on capture fishing and aquaculture 1998/99 & 2010/11 Holdings & area Census period North Central South Lao PDR 1. No. of farm HHs with capture fishing ('000)
1998/99 153.2 (64.3) 208.7 (73.0) 102.9 (75.7) 464.7 (69.6) 2010/11 187.3 (64.8) 230.3 (68.5) 108.6 (69.0) 526.3 (67.2) (% ) ann. Change 1.7 0.8 0.5 1.0
2. No. of aquaculture holdings ('000)
1998/99 28.6 21.1 5.1 55.5 2010/11 28.9 30.2 9.1 68.2 (%) annual change 0.1 3.0 4.9 1.7
3. Area of aquaculture ('000 ha)
1998/99 2.5 2.9 0.9 6.4 2010/11 4.2 8.1 2.7 14.9 (%) annual change 4.4 8.9 9.6 7.3
4. Avg. Aqua. Hold. Size (ha)
1998/99 0.09 0.14 0.18 0.12 2010/11 0.15 0.27 0.29 0.22
Although capture fishing is a major secondary activity of farm households, the share of farm HHs with their own aquaculture holdings was only about 9% at the national level This suggests that the vast majority depend upon common pool water sources for capture fishing. The majority (around two thirds) of farm households undertake capture fishing and aquaculture mainly for own consumption.
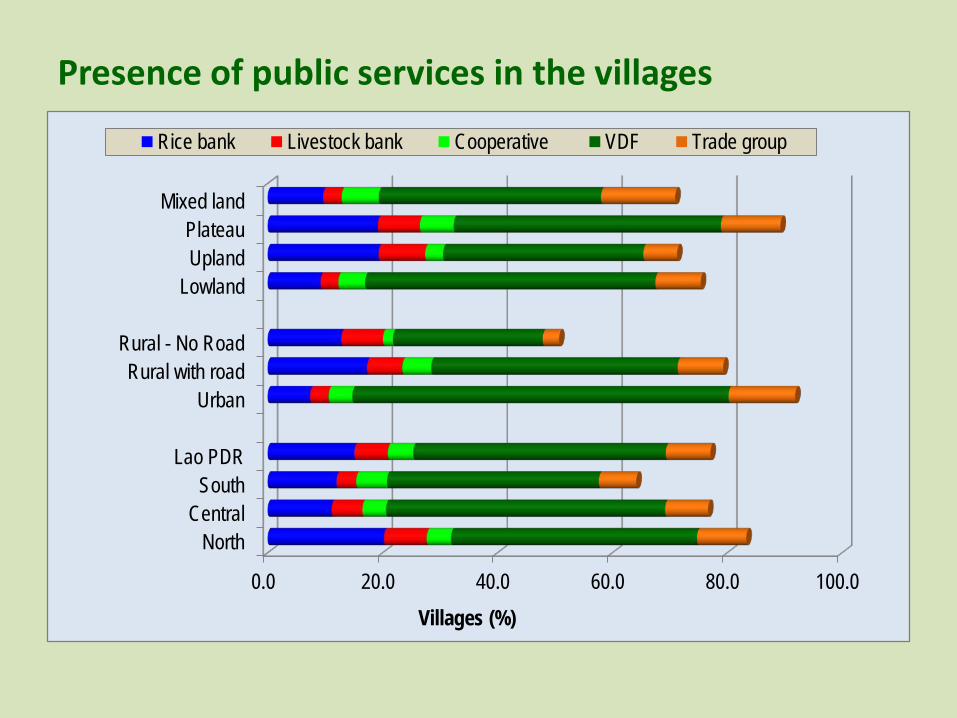
Presence of public services in the villages
0.0 20.0 40.0 60.0 80.0 100.0
North Central
South Lao PDR
Urban Rural with road
Rural - No Road
Lowland Upland Plateau
Mixed land
Villages (%)
Rice bank Livestock bank Cooperative VDF Trade group
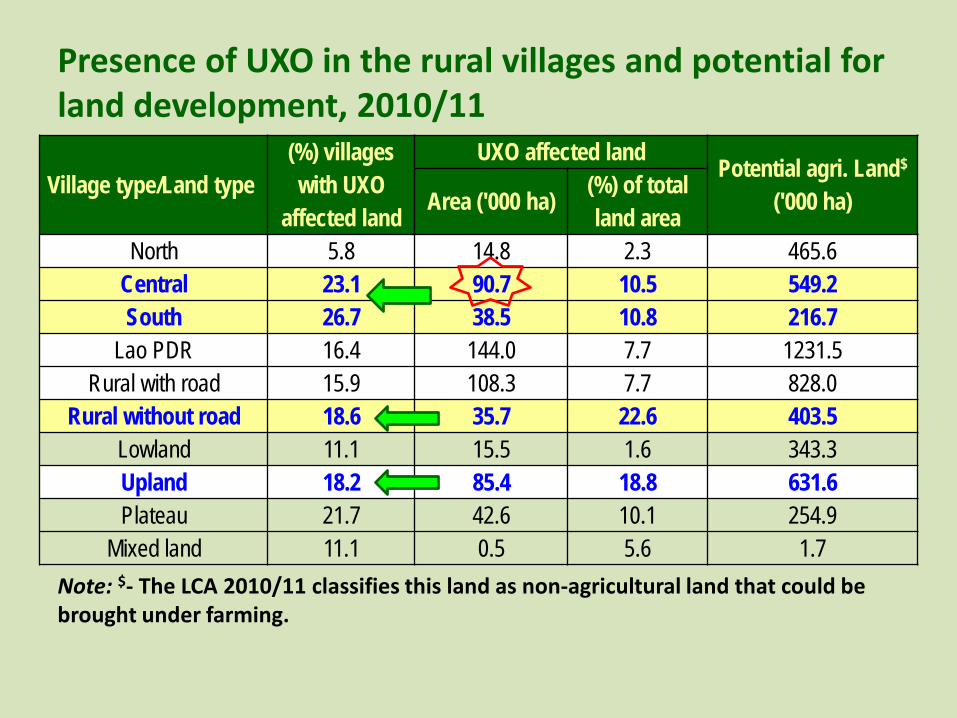
Presence of UXO in the rural villages and potential for land development, 2010/11
Village type/Land type (%) villages with UXO
affected land
UXO affected land Potential agri. Land$
('000 ha) Area ('000 ha) (%) of total land area
North 5.8 14.8 2.3 465.6 Central 23.1 90.7 10.5 549.2 South 26.7 38.5 10.8 216.7
Lao PDR 16.4 144.0 7.7 1231.5 Rural with road 15.9 108.3 7.7 828.0
Rural without road 18.6 35.7 22.6 403.5 Lowland 11.1 15.5 1.6 343.3 Upland 18.2 85.4 18.8 631.6 Plateau 21.7 42.6 10.1 254.9
Mixed land 11.1 0.5 5.6 1.7 Note: $- The LCA 2010/11 classifies this land as non-agricultural land that could be brought under farming.
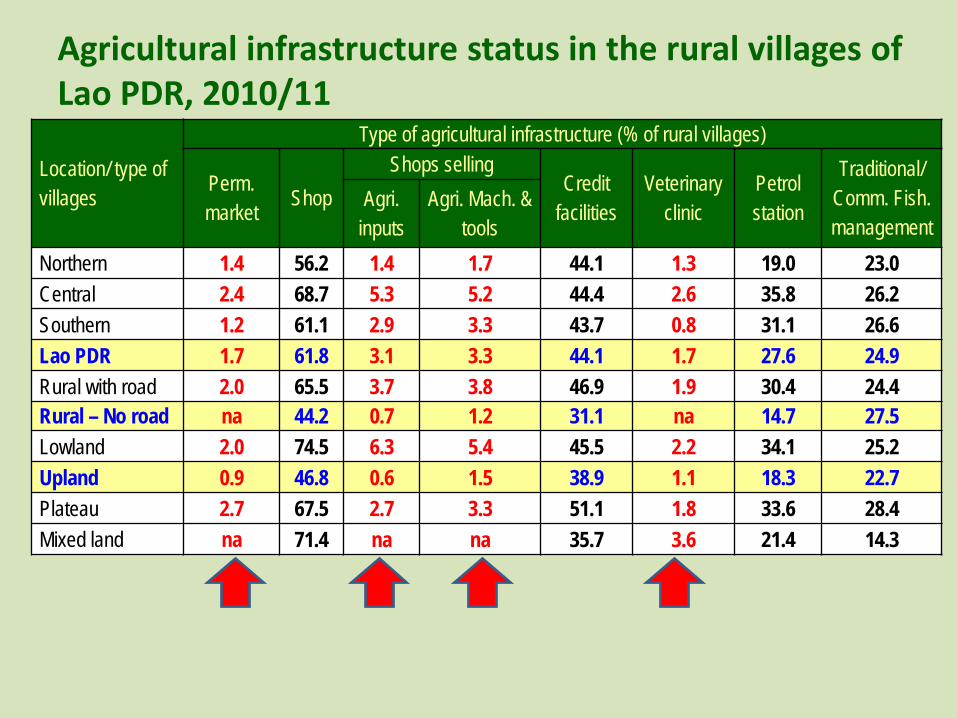
Agricultural infrastructure status in the rural villages of Lao PDR, 2010/11
Location/ type of villages
Type of agricultural infrastructure (% of rural villages)
Perm. market Shop
Shops selling Credit
facilities Veterinary
clinic Petrol station
Traditional/ Comm. Fish. management
Agri. inputs
Agri. Mach. & tools
Northern 1.4 56.2 1.4 1.7 44.1 1.3 19.0 23.0 Central 2.4 68.7 5.3 5.2 44.4 2.6 35.8 26.2 Southern 1.2 61.1 2.9 3.3 43.7 0.8 31.1 26.6 Lao PDR 1.7 61.8 3.1 3.3 44.1 1.7 27.6 24.9 Rural with road 2.0 65.5 3.7 3.8 46.9 1.9 30.4 24.4 Rural – No road na 44.2 0.7 1.2 31.1 na 14.7 27.5 Lowland 2.0 74.5 6.3 5.4 45.5 2.2 34.1 25.2 Upland 0.9 46.8 0.6 1.5 38.9 1.1 18.3 22.7 Plateau 2.7 67.5 2.7 3.3 51.1 1.8 33.6 28.4 Mixed land na 71.4 na na 35.7 3.6 21.4 14.3

Constraints and problems faced by the villages
0.0 10.0 20.0 30.0 40.0 50.0 60.0
Lack of irrigation
Lack of inputs
Lack of vaccination
Low commodity prices
Lack of land
Lack of markets
Lack draughts & machinery
Lack of labour
59
43
40
38 29
25
16
10
Constraints & problems faced by Villages (%)
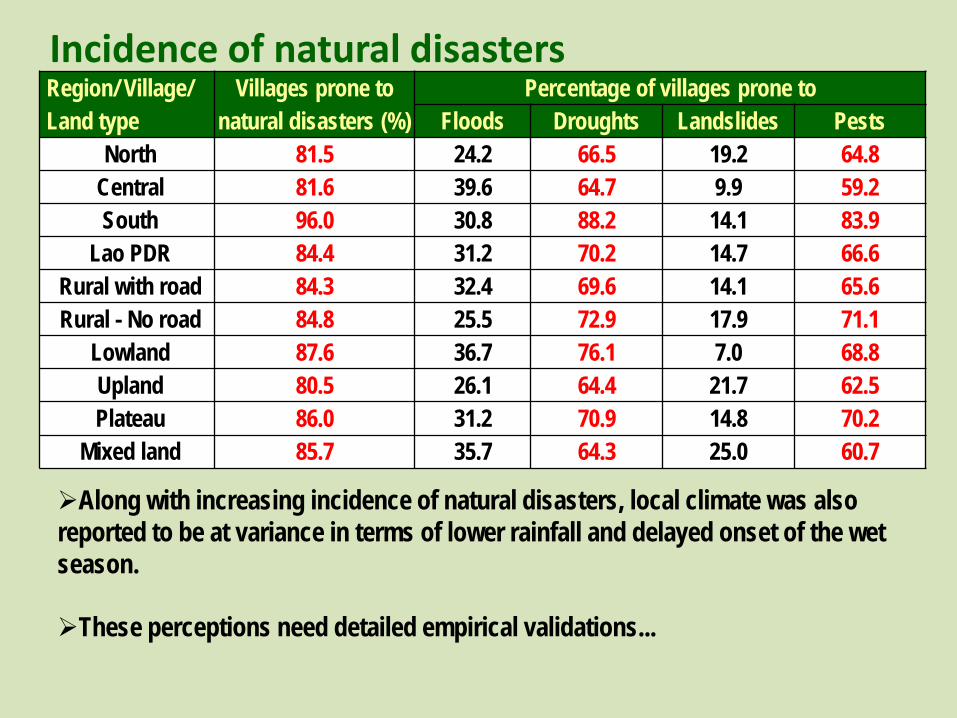
Incidence of natural disasters Region/ Village/ Land type
Villages prone to natural disasters (%)
Percentage of villages prone to Floods Droughts Landslides Pests
North 81.5 24.2 66.5 19.2 64.8 Central 81.6 39.6 64.7 9.9 59.2 South 96.0 30.8 88.2 14.1 83.9
Lao PDR 84.4 31.2 70.2 14.7 66.6 Rural with road 84.3 32.4 69.6 14.1 65.6 Rural - No road 84.8 25.5 72.9 17.9 71.1
Lowland 87.6 36.7 76.1 7.0 68.8 Upland 80.5 26.1 64.4 21.7 62.5 Plateau 86.0 31.2 70.9 14.8 70.2
Mixed land 85.7 35.7 64.3 25.0 60.7
Along with increasing incidence of natural disasters, local climate was also reported to be at variance in terms of lower rainfall and delayed onset of the wet season.
These perceptions need detailed empirical validations...