language use in the united states: 2011 american community
TRANSCRIPT
U.S. Department of Commerce Economics and Statistics Administration U.S. CENSUS BUREAU
census.gov
By Camille RyanIssued August 2013ACS-22
American Community Survey Reports
Language Use in the United States: 2011
INTRODUCTION
English is the language spoken by most people in the United States. The official language of many states is English1 and it is the language used in nearly all gov-ernmental functions. Despite this predominance, many people in the United States speak languages other than English, and there has long been an interest in these groups and in how well they are able to partici-pate in civic life and interact with the English-speaking majority. Beginning in 1890, the U.S. Census Bureau started inquiring about the languages that people spoke and, with some interruptions in the middle of the twentieth century, similar questions continue to this day.
The primary purpose of the current questions on language use is to measure the portion of the U.S. population that may need help in understand-ing English. These data are used in a wide variety of legislative, policy, and research applications as well as for legal, financial, and marketing decisions. People who speak a particular language other than English and cannot speak English “very well” can be helped with translation services, education, or assistance in accessing government services. The federal govern-ment uses data on language use and English-speaking ability to determine which local areas must provide language-assistance services under the Voting Rights Act. These data are also used to allocate educational funds to states to help their schools teach students with lower levels of English proficiency. In 2000,
1 Schildkraut, Deborah, 2001, “Official-English and the States: Influences on Declaring English the Official Language in the United States,” Political Research Quarterly, Vol. 54, No. 2: pp. 445–457.
President Clinton signed an executive order requir-ing federal agencies to identify the need for services to those with limited English proficiency (LEP) and to implement a system to provide meaningful access to language-assistance services. Agencies rely on these data to determine how and where to provide language-assistance services.2 Many other institutions, organiza-tions, local governments, and private enterprises make use of these data in similar ways.
2 See <www.lep.gov>.
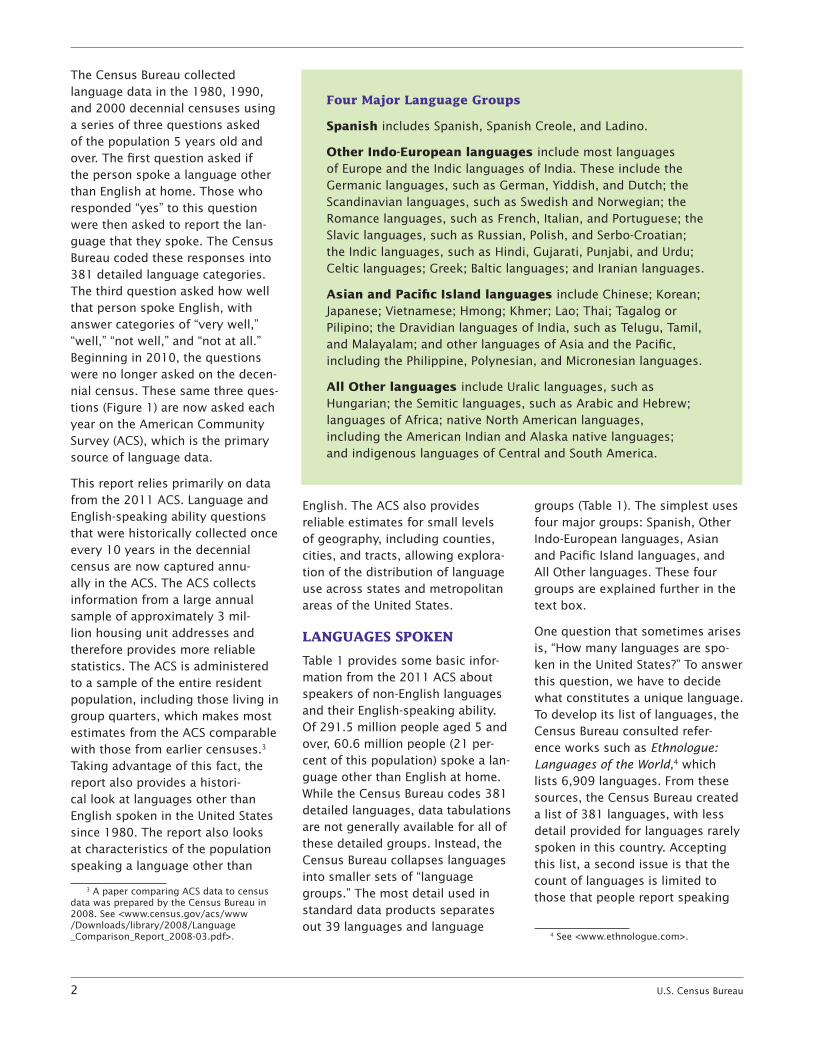
Source: U.S. Census Bureau, 2011 American Community Survey.
Figure 1.Reproduction of the Questions on Language From the 2011 American Community Survey
Yes
No SKIP to question 15a
b. What is this language?
c. How well does this person speak English?
Very well
Well
Not well
Not at all
For example: Korean, Italian, Spanish, Vietnamese
a. Does this person speak a language other thanEnglish at home?
14
2 U.S. Census Bureau
The Census Bureau collected language data in the 1980, 1990, and 2000 decennial censuses using a series of three questions asked of the population 5 years old and over. The first question asked if the person spoke a language other than English at home. Those who responded “yes” to this question were then asked to report the lan-guage that they spoke. The Census Bureau coded these responses into 381 detailed language categories. The third question asked how well that person spoke English, with answer categories of “very well,” “well,” “not well,” and “not at all.” Beginning in 2010, the questions were no longer asked on the decen-nial census. These same three ques-tions (Figure 1) are now asked each year on the American Community Survey (ACS), which is the primary source of language data.
This report relies primarily on data from the 2011 ACS. Language and English-speaking ability questions that were historically collected once every 10 years in the decennial census are now captured annu-ally in the ACS. The ACS collects information from a large annual sample of approximately 3 mil-lion housing unit addresses and therefore provides more reliable statistics. The ACS is administered to a sample of the entire resident population, including those living in group quarters, which makes most estimates from the ACS comparable with those from earlier censuses.3 Taking advantage of this fact, the report also provides a histori-cal look at languages other than English spoken in the United States since 1980. The report also looks at characteristics of the population speaking a language other than
3 A paper comparing ACS data to census data was prepared by the Census Bureau in 2008. See <www.census.gov/acs/www /Downloads/library/2008/Language _Comparison_Report_2008-03.pdf>.
English. The ACS also provides reliable estimates for small levels of geography, including counties, cities, and tracts, allowing explora-tion of the distribution of language use across states and metropolitan areas of the United States.
LANGUAGES SPOKEN
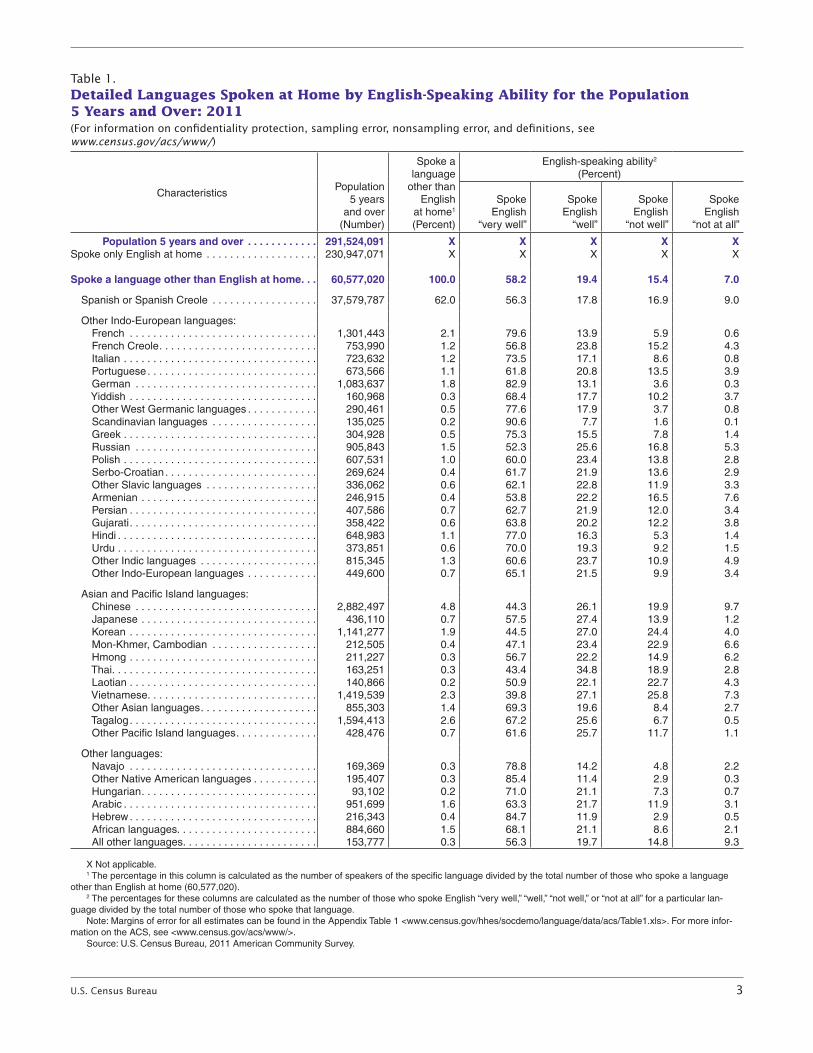
Table 1 provides some basic infor-mation from the 2011 ACS about speakers of non-English languages and their English-speaking ability. Of 291.5 million people aged 5 and over, 60.6 million people (21 per-cent of this population) spoke a lan-guage other than English at home. While the Census Bureau codes 381 detailed languages, data tabulations are not generally available for all of these detailed groups. Instead, the Census Bureau collapses languages into smaller sets of “language groups.” The most detail used in standard data products separates out 39 languages and language
groups (Table 1). The simplest uses four major groups: Spanish, Other Indo-European languages, Asian and Pacific Island languages, and All Other languages. These four groups are explained further in the text box.
One question that sometimes arises is, “How many languages are spo-ken in the United States?” To answer this question, we have to decide what constitutes a unique language. To develop its list of languages, the Census Bureau consulted refer-ence works such as Ethnologue: Languages of the World,4 which lists 6,909 languages. From these sources, the Census Bureau created a list of 381 languages, with less detail provided for languages rarely spoken in this country. Accepting this list, a second issue is that the count of languages is limited to those that people report speaking
4 See <www.ethnologue.com>.
Four Major Language Groups
Spanish includes Spanish, Spanish Creole, and Ladino.
Other Indo-European languages include most languages of Europe and the Indic languages of India. These include the Germanic languages, such as German, Yiddish, and Dutch; the Scandinavian languages, such as Swedish and Norwegian; the Romance languages, such as French, Italian, and Portuguese; the Slavic languages, such as Russian, Polish, and Serbo-Croatian; the Indic languages, such as Hindi, Gujarati, Punjabi, and Urdu; Celtic languages; Greek; Baltic languages; and Iranian languages.
Asian and Pacific Island languages include Chinese; Korean; Japanese; Vietnamese; Hmong; Khmer; Lao; Thai; Tagalog or Pilipino; the Dravidian languages of India, such as Telugu, Tamil, and Malayalam; and other languages of Asia and the Pacific, including the Philippine, Polynesian, and Micronesian languages.
All Other languages include Uralic languages, such as Hungarian; the Semitic languages, such as Arabic and Hebrew; languages of Africa; native North American languages, including the American Indian and Alaska native languages; and indigenous languages of Central and South America.
U.S. Census Bureau 3
Table 1.Detailed Languages Spoken at Home by English-Speaking Ability for the Population 5 Years and Over: 2011(For information on confidentiality protection, sampling error, nonsampling error, and definitions, see www.census.gov/acs/www/)
CharacteristicsPopulation
5 years and over
(Number)
Spoke a language
other than English
at home1 (Percent)
English-speaking ability2 (Percent)
Spoke English
“very well”
Spoke English
“well”
Spoke English
“not well”
Spoke English
“not at all”
Population 5 years and over . . . . . . . . . . . . 291,524,091 X X X X XSpoke only English at home . . . . . . . . . . . . . . . . . . . 230,947,071 X X X X X
Spoke a language other than English at home . . . 60,577,020 100 .0 58 .2 19 .4 15 .4 7 .0
Spanish or Spanish Creole . . . . . . . . . . . . . . . . . . 37,579,787 62 .0 56 .3 17 .8 16 .9 9 .0
Other Indo-European languages: French . . . . . . . . . . . . . . . . . . . . . . . . . . . . . . . . 1,301,443 2 .1 79 .6 13 .9 5 .9 0 .6 French Creole . . . . . . . . . . . . . . . . . . . . . . . . . . . 753,990 1 .2 56 .8 23 .8 15 .2 4 .3 Italian . . . . . . . . . . . . . . . . . . . . . . . . . . . . . . . . . 723,632 1 .2 73 .5 17 .1 8 .6 0 .8 Portuguese . . . . . . . . . . . . . . . . . . . . . . . . . . . . . 673,566 1 .1 61 .8 20 .8 13 .5 3 .9 German . . . . . . . . . . . . . . . . . . . . . . . . . . . . . . . 1,083,637 1 .8 82 .9 13 .1 3 .6 0 .3 Yiddish . . . . . . . . . . . . . . . . . . . . . . . . . . . . . . . . 160,968 0 .3 68 .4 17 .7 10 .2 3 .7 Other West Germanic languages . . . . . . . . . . . . 290,461 0 .5 77 .6 17 .9 3 .7 0 .8 Scandinavian languages . . . . . . . . . . . . . . . . . . 135,025 0 .2 90 .6 7 .7 1 .6 0 .1 Greek . . . . . . . . . . . . . . . . . . . . . . . . . . . . . . . . . 304,928 0 .5 75 .3 15 .5 7 .8 1 .4 Russian . . . . . . . . . . . . . . . . . . . . . . . . . . . . . . . 905,843 1 .5 52 .3 25 .6 16 .8 5 .3 Polish . . . . . . . . . . . . . . . . . . . . . . . . . . . . . . . . . 607,531 1 .0 60 .0 23 .4 13 .8 2 .8 Serbo-Croatian . . . . . . . . . . . . . . . . . . . . . . . . . . 269,624 0 .4 61 .7 21 .9 13 .6 2 .9 Other Slavic languages . . . . . . . . . . . . . . . . . . . 336,062 0 .6 62 .1 22 .8 11 .9 3 .3 Armenian . . . . . . . . . . . . . . . . . . . . . . . . . . . . . . 246,915 0 .4 53 .8 22 .2 16 .5 7 .6 Persian . . . . . . . . . . . . . . . . . . . . . . . . . . . . . . . . 407,586 0 .7 62 .7 21 .9 12 .0 3 .4 Gujarati . . . . . . . . . . . . . . . . . . . . . . . . . . . . . . . . 358,422 0 .6 63 .8 20 .2 12 .2 3 .8 Hindi . . . . . . . . . . . . . . . . . . . . . . . . . . . . . . . . . . 648,983 1 .1 77 .0 16 .3 5 .3 1 .4 Urdu . . . . . . . . . . . . . . . . . . . . . . . . . . . . . . . . . . 373,851 0 .6 70 .0 19 .3 9 .2 1 .5 Other Indic languages . . . . . . . . . . . . . . . . . . . . 815,345 1 .3 60 .6 23 .7 10 .9 4 .9 Other Indo-European languages . . . . . . . . . . . . 449,600 0 .7 65 .1 21 .5 9 .9 3 .4
Asian and Pacific Island languages: Chinese . . . . . . . . . . . . . . . . . . . . . . . . . . . . . . . 2,882,497 4 .8 44 .3 26 .1 19 .9 9 .7 Japanese . . . . . . . . . . . . . . . . . . . . . . . . . . . . . . 436,110 0 .7 57 .5 27 .4 13 .9 1 .2 Korean . . . . . . . . . . . . . . . . . . . . . . . . . . . . . . . . 1,141,277 1 .9 44 .5 27 .0 24 .4 4 .0 Mon-Khmer, Cambodian . . . . . . . . . . . . . . . . . . 212,505 0 .4 47 .1 23 .4 22 .9 6 .6 Hmong . . . . . . . . . . . . . . . . . . . . . . . . . . . . . . . . 211,227 0 .3 56 .7 22 .2 14 .9 6 .2 Thai . . . . . . . . . . . . . . . . . . . . . . . . . . . . . . . . . . . 163,251 0 .3 43 .4 34 .8 18 .9 2 .8 Laotian . . . . . . . . . . . . . . . . . . . . . . . . . . . . . . . . 140,866 0 .2 50 .9 22 .1 22 .7 4 .3 Vietnamese . . . . . . . . . . . . . . . . . . . . . . . . . . . . . 1,419,539 2 .3 39 .8 27 .1 25 .8 7 .3 Other Asian languages . . . . . . . . . . . . . . . . . . . . 855,303 1 .4 69 .3 19 .6 8 .4 2 .7 Tagalog . . . . . . . . . . . . . . . . . . . . . . . . . . . . . . . . 1,594,413 2 .6 67 .2 25 .6 6 .7 0 .5 Other Pacific Island languages . . . . . . . . . . . . . . 428,476 0 .7 61 .6 25 .7 11 .7 1 .1
Other languages: Navajo . . . . . . . . . . . . . . . . . . . . . . . . . . . . . . . . 169,369 0 .3 78 .8 14 .2 4 .8 2 .2 Other Native American languages . . . . . . . . . . . 195,407 0 .3 85 .4 11 .4 2 .9 0 .3 Hungarian . . . . . . . . . . . . . . . . . . . . . . . . . . . . . . 93,102 0 .2 71 .0 21 .1 7 .3 0 .7 Arabic . . . . . . . . . . . . . . . . . . . . . . . . . . . . . . . . . 951,699 1 .6 63 .3 21 .7 11 .9 3 .1 Hebrew . . . . . . . . . . . . . . . . . . . . . . . . . . . . . . . . 216,343 0 .4 84 .7 11 .9 2 .9 0 .5 African languages . . . . . . . . . . . . . . . . . . . . . . . . 884,660 1 .5 68 .1 21 .1 8 .6 2 .1 All other languages . . . . . . . . . . . . . . . . . . . . . . . 153,777 0 .3 56 .3 19 .7 14 .8 9 .3
X Not applicable .1 The percentage in this column is calculated as the number of speakers of the specific language divided by the total number of those who spoke a language
other than English at home (60,577,020) .2 The percentages for these columns are calculated as the number of those who spoke English “very well,” “well,” “not well,” or “not at all” for a particular lan-
guage divided by the total number of those who spoke that language .Note: Margins of error for all estimates can be found in the Appendix Table 1 <www .census .gov/hhes/socdemo/language/data/acs/Table1 .xls> . For more infor-
mation on the ACS, see <www .census .gov/acs/www/> .Source: U .S . Census Bureau, 2011 American Community Survey .
4 U.S. Census Bureau
the language at home. Therefore, while no definitive answer to the question is available, a tabulation from the 2006–2008 ACS listed over 300 languages spoken in the United States.5
Many of the languages spoken in the United States are native North American languages. The ACS provides codes for 169 distinct native North American languages, and 134 of these languages were recorded in the tabulations from 2006–2008. In 2011, the Census Bureau published a brief report on native North American languages spoken in the United States.6
ENGLISH-SPEAKING ABILITY
Most people who spoke a non- English language at home also reported that they spoke English “very well” (Table 4). Overall, the proportion was 58 percent who spoke “very well,” with another 19 percent who spoke English “well,” 15 percent who spoke “not well,” and 7 percent who spoke English “not at all.”
The usefulness of the self-rated English-speaking ability question was established in the 1980s, when research confirmed a strong relation between this rating and separate tests of ability to perform
5 See <www.census.gov/hhes/socdemo /language/data/other/detailed-lang-tables .xls>.
6 See <www.census.gov/prod/2011pubs /acsbr10-10.pdf>.
tasks in English.7 In many of its tables, the Census Bureau makes a distinction between those who speak English only or speak English “very well” on the one hand and those who speak English less than “very well” on the other.
Even among the speakers of the top ten languages, English-speaking ability varied greatly (Figure 2). A high proportion (80 percent or more) of French and German speakers spoke English “very well.” In contrast, less than 50 percent of those who spoke Korean, Chinese, or Vietnamese spoke English “very well.” The proportion of those who spoke English “very well” among Russian, Spanish, French Creole, Arabic, and Tagalog speakers ranged from 52 percent to 67 percent.
Among the most common non-English languages in 2011, Spanish experienced growth in the past several years. Interestingly, while the percentage of the total popula-tion 5 years and over who spoke Spanish increased from 2005 to 2011, the percentage of the total population who spoke Spanish and spoke English less than “very well” actually decreased (Figure 3). The percentage of the total population 5 years and over who spoke Spanish grew from 12.0 percent
7 See Department of Education, Office of Planning Budget and Evaluation, 1987, “Numbers of Limited English Proficient Children: National, State and Language-Specific Estimates” (April) mimeo, which examined the school-aged population and Kominski, Robert, 1989, “How Good is “How Well”? An Examination of the Census English-Speaking Ability Question,” accessed at <www.census.gov/hhes/socdemo/language /data/census/ASApaper1989.pdf>, presented at the Annual meetings of the American Statistical Association, which examined the general population.
in 2005 to 12.9 percent in 2011, while the percentage who spoke Spanish and spoke English less than “very well” decreased from 5.7 percent in 2005 to 5.6 percent in 2011.
Overall, speakers of all languages other than English who spoke English less than “very well” had not changed as a percentage of the total population 5 years and over from 2007 to 2011 (8.7 percent). This percentage had increased from 8.1 percent in 2000 to 8.7 percent in 2007.
LANGUAGES SPOKEN IN THE UNITED STATES: A HISTORICAL LOOK
Data on language spoken and ability to speak English were first collected in the census of 1890 (Appendix A). The form of census questions about language has varied over the years, as well as the population covered. In 1890 and 1900, all people 10 years old and over who did not speak English were asked what language they spoke. In 1910, 1920, 1930, and 1960, foreign-born people were asked about their “mother tongue” (the language spoken in the household when the respondent was growing up). Finally, in the 1980 Census, and in data collec-tions since that time, respondents were asked the standard set of three questions shown in Figure 1. These questions are now asked of everyone aged 5 and over in the household.8
8 See Gillian Stevens, 1999, “A Century of U.S. Censuses and the Language Characteristics of Immigrants,” Demography, Vol. 36, No. 3, pp. 387–397.

U.S. Census Bureau 5
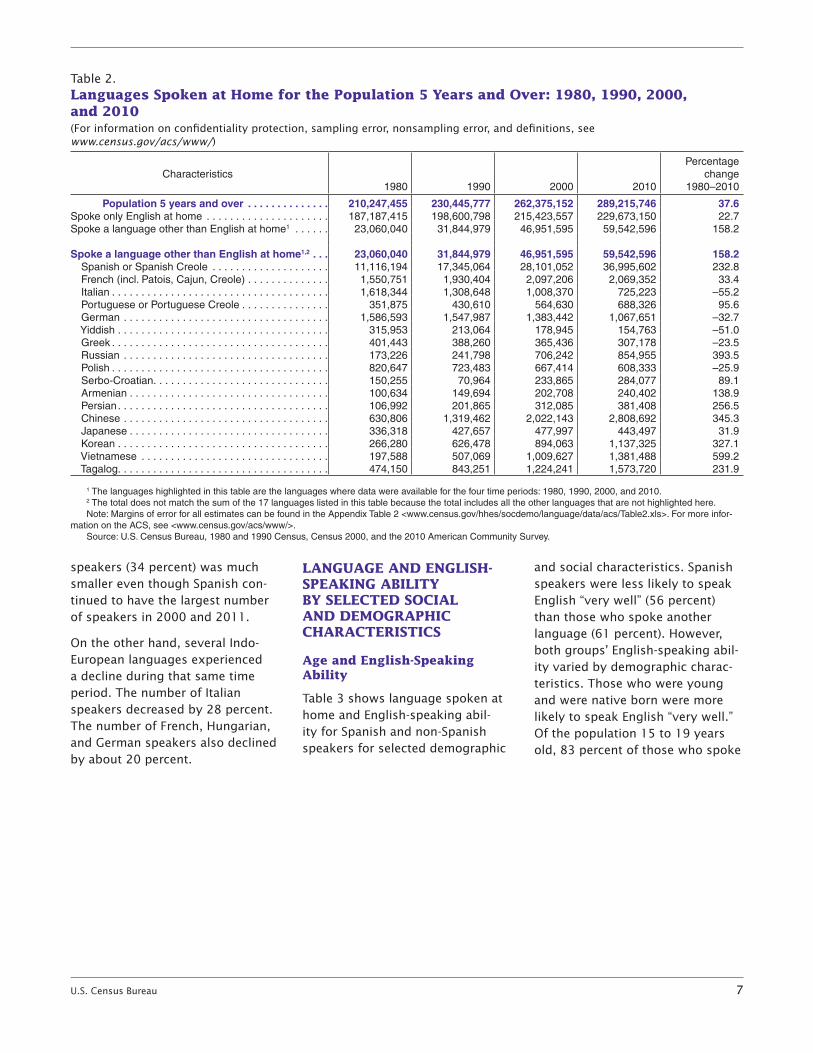
Table 2 provides a detailed list of 17 of the common languages other than English spoken in the home for the period 1980 to 2010.9 This list provides data for only those languages that were available in all
9 Data from 1980, 1990, and 2000 are from decennial censuses, while the data from 2010 come from the 2010 ACS. For more information about language use and English-speaking ability differences between the census and the ACS, read “Comparison of the Estimates on Language Use and English-Speaking Ability from the ACS, the C2SS, and Census 2000 (Report).” This report can be accessed at <www.census.gov/acs/www /Downloads/library/2008/Language _Comparison_Report_2008-03.pdf>.
four time periods. In 1980, 23.1 million people spoke a language other than English at home, com-pared with 59.5 million people in 2010 (a 158 percent increase, dur-ing which time the population grew 38 percent).
Some languages showed remark-able growth since 1980, while oth-ers declined. The largest numeric increase was for Spanish speakers (25.9 million more in 2010 than in 1980). Vietnamese speakers had the largest percentage increase
(599 percent). Eight languages more than doubled during the period, including four that had 200,000 speakers or fewer in 1980: Russian, Persian, Armenian, and Vietnamese.
While increased immigration led to gains for some language groups, other groups experienced aging populations and dwindling migrant flows into the United States. The languages that declined in use since 1980 include Italian, which had a net decline of about 900,000
Figure 2. English-Speaking Ability for the Top Ten Languages: 2011
Source: U.S. Census Bureau, 2011 American Community Survey.
(Population 5 years and over who spoke a language other than English at home)
0 10 20 30 40 50 60 70 80 90 100
Vietnamese
Chinese
Korean
Russian
Spanish
French Creole
Arabic
Tagalog
French
German
“Very well” “Well” “Not well” “Not at all”
Percent

6 U.S. Census Bureau
speakers (55 percent decline). Other languages, such as Polish, Yiddish, German, and Greek, have also seen large proportionate decreases.
The Census Bureau recently exam-ined the future of language use in the United States. Two offset-ting influences determine the number of people in the United States who speak a language other than English. The first is immigra-tion—if an increased number of
people enter the country from places where English is not the main language, the number who speak other languages at home will increase. A second major influence is population aging—as people get older and spend time in the United States, they are increasingly likely to make English their main language of communication. The research shows that we can expect a small increase in the percentage
who speak a language other than English at home in coming years.10
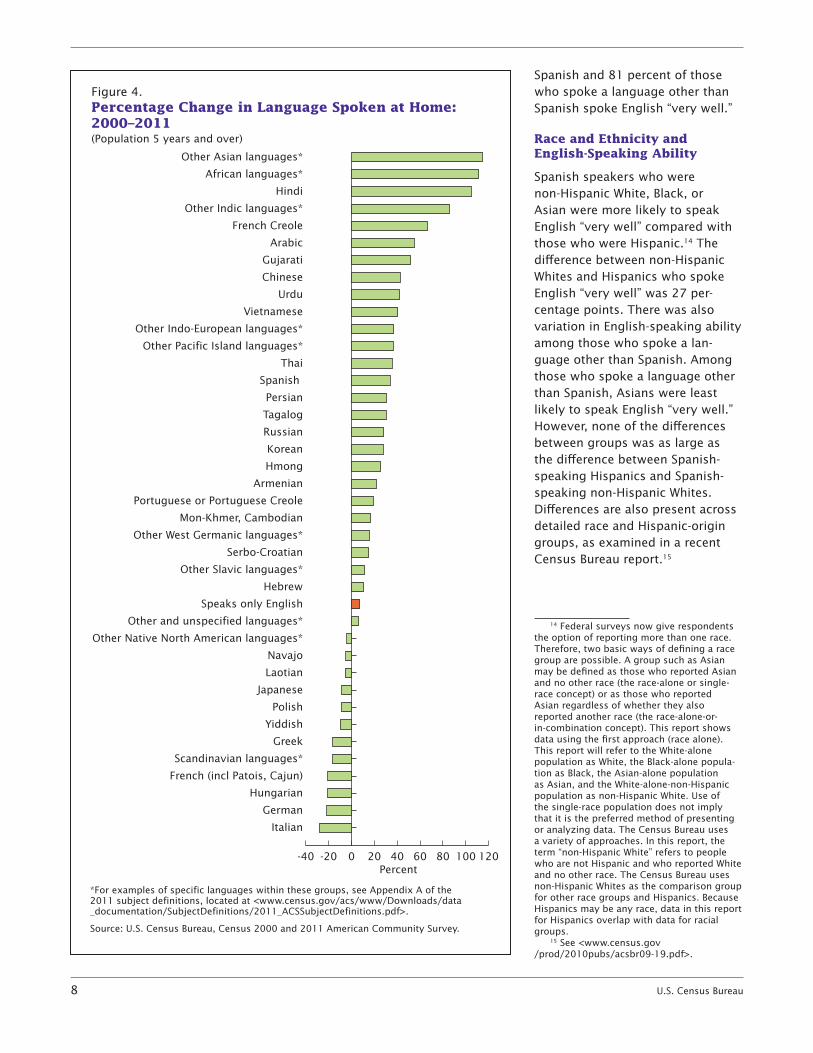
Even looking over the span of a little more than a decade, changes in language use are evident. Several languages or language groups experienced major growth between 2000 and 2011 (Figure 4). South Asian languages in par-ticular experienced high levels of growth. “Other Asian languages,” a group comprised mostly of the South Asian languages, Malayalam, Telugu, and Tamil, grew by 115 percent, and Hindi grew by 105 percent.11 “Other Indic languages” (languages such as Punjabi, Bengali, and Marathi) grew by 86 percent. The slowest growing South Asian languages were Gujarati (52 percent) and Urdu (42 percent).12
“African languages,” which includes languages such as Amharic, Ibo, Yoruba, and Swahili, also experi-enced significant growth of 111 percent.13 This indicates that the number of speakers in this lan-guage group more than doubled. In comparison, the growth of Spanish
10 See <www.census.gov/hhes/socdemo /language/data/acs/Ortman_Shin_ASA2011 _paper.pdf>.
11 The percentage change for “Other Asian languages” was not statistically different from the percentage change for Hindi.
12 The percentage change for Gujarati was not statistically different from the percentage change for Urdu.
13 The percentage change for “African languages” was not statistically different from the percentage change for “Other Asian languages” or Hindi.
Figure 3. Percentage Who Spoke Spanish and Percentage WhoSpoke Spanish and Spoke English Less Than “VeryWell” of the Population 5 Years and Over: 2005–2011
Source: U.S. Census Bureau, 2005, 2006, 2007, 2008, 2009, 2010, 2011American Community Surveys.
0
2
4
6
8
10
12
14
2011201020092008200720062005
Spoke Spanish
Percent
Spoke Spanish and spoke English less than “very well”
U.S. Census Bureau 7
Table 2.Languages Spoken at Home for the Population 5 Years and Over: 1980, 1990, 2000, and 2010(For information on confidentiality protection, sampling error, nonsampling error, and definitions, see www.census.gov/acs/www/)
Characteristics1980 1990 2000 2010
Percentage change
1980–2010
Population 5 years and over . . . . . . . . . . . . . . 210,247,455 230,445,777 262,375,152 289,215,746 37 .6Spoke only English at home . . . . . . . . . . . . . . . . . . . . . 187,187,415 198,600,798 215,423,557 229,673,150 22 .7Spoke a language other than English at home1 . . . . . . 23,060,040 31,844,979 46,951,595 59,542,596 158 .2
Spoke a language other than English at home1,2 . . . 23,060,040 31,844,979 46,951,595 59,542,596 158 .2 Spanish or Spanish Creole . . . . . . . . . . . . . . . . . . . . 11,116,194 17,345,064 28,101,052 36,995,602 232 .8 French (incl . Patois, Cajun, Creole) . . . . . . . . . . . . . . 1,550,751 1,930,404 2,097,206 2,069,352 33 .4 Italian . . . . . . . . . . . . . . . . . . . . . . . . . . . . . . . . . . . . . 1,618,344 1,308,648 1,008,370 725,223 –55 .2 Portuguese or Portuguese Creole . . . . . . . . . . . . . . . 351,875 430,610 564,630 688,326 95 .6 German . . . . . . . . . . . . . . . . . . . . . . . . . . . . . . . . . . . 1,586,593 1,547,987 1,383,442 1,067,651 –32 .7 Yiddish . . . . . . . . . . . . . . . . . . . . . . . . . . . . . . . . . . . . 315,953 213,064 178,945 154,763 –51 .0 Greek . . . . . . . . . . . . . . . . . . . . . . . . . . . . . . . . . . . . . 401,443 388,260 365,436 307,178 –23 .5 Russian . . . . . . . . . . . . . . . . . . . . . . . . . . . . . . . . . . . 173,226 241,798 706,242 854,955 393 .5 Polish . . . . . . . . . . . . . . . . . . . . . . . . . . . . . . . . . . . . . 820,647 723,483 667,414 608,333 –25 .9 Serbo-Croatian . . . . . . . . . . . . . . . . . . . . . . . . . . . . . . 150,255 70,964 233,865 284,077 89 .1 Armenian . . . . . . . . . . . . . . . . . . . . . . . . . . . . . . . . . . 100,634 149,694 202,708 240,402 138 .9 Persian . . . . . . . . . . . . . . . . . . . . . . . . . . . . . . . . . . . . 106,992 201,865 312,085 381,408 256 .5 Chinese . . . . . . . . . . . . . . . . . . . . . . . . . . . . . . . . . . . 630,806 1,319,462 2,022,143 2,808,692 345 .3 Japanese . . . . . . . . . . . . . . . . . . . . . . . . . . . . . . . . . . 336,318 427,657 477,997 443,497 31 .9 Korean . . . . . . . . . . . . . . . . . . . . . . . . . . . . . . . . . . . . 266,280 626,478 894,063 1,137,325 327 .1 Vietnamese . . . . . . . . . . . . . . . . . . . . . . . . . . . . . . . . 197,588 507,069 1,009,627 1,381,488 599 .2 Tagalog . . . . . . . . . . . . . . . . . . . . . . . . . . . . . . . . . . . . 474,150 843,251 1,224,241 1,573,720 231 .9
1 The languages highlighted in this table are the languages where data were available for the four time periods: 1980, 1990, 2000, and 2010 .2 The total does not match the sum of the 17 languages listed in this table because the total includes all the other languages that are not highlighted here .Note: Margins of error for all estimates can be found in the Appendix Table 2 <www .census .gov/hhes/socdemo/language/data/acs/Table2 .xls> . For more infor-
mation on the ACS, see <www .census .gov/acs/www/> .Source: U .S . Census Bureau, 1980 and 1990 Census, Census 2000, and the 2010 American Community Survey .
speakers (34 percent) was much smaller even though Spanish con-tinued to have the largest number of speakers in 2000 and 2011.
On the other hand, several Indo-European languages experienced a decline during that same time period. The number of Italian speakers decreased by 28 percent. The number of French, Hungarian, and German speakers also declined by about 20 percent.
LANGUAGE AND ENGLISH-SPEAKING ABILITY BY SELECTED SOCIAL AND DEMOGRAPHIC CHARACTERISTICS
Age and English-Speaking Ability
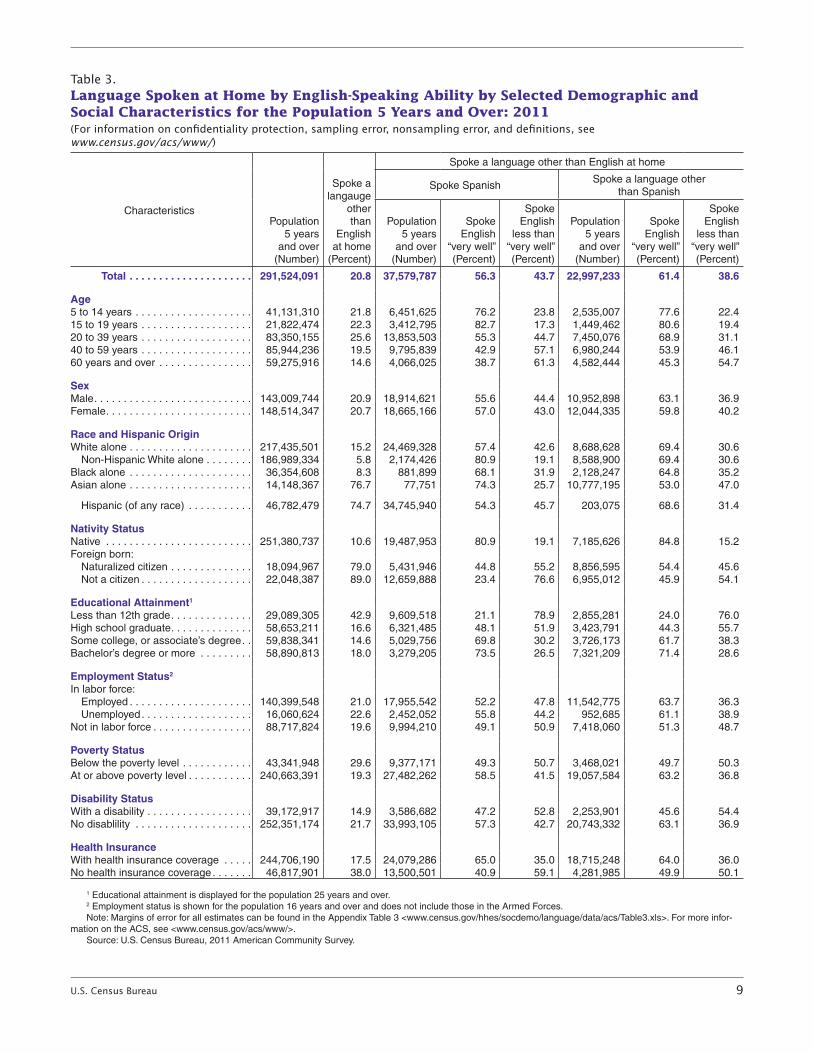
Table 3 shows language spoken at home and English-speaking abil-ity for Spanish and non-Spanish speakers for selected demographic
and social characteristics. Spanish speakers were less likely to speak English “very well” (56 percent) than those who spoke another language (61 percent). However, both groups’ English-speaking abil-ity varied by demographic charac-teristics. Those who were young and were native born were more likely to speak English “very well.” Of the population 15 to 19 years old, 83 percent of those who spoke
8 U.S. Census Bureau
Figure 4. Percentage Change in Language Spoken at Home: 2000–2011(Population 5 years and over)
*For examples of specific languages within these groups, see Appendix A of the2011 subject definitions, located at <www.census.gov/acs/www/Downloads/data_documentation/SubjectDefinitions/2011_ACSSubjectDefinitions.pdf>.
Source: U.S. Census Bureau, Census 2000 and 2011 American Community Survey.
-40 -20 0 20 40 60 80 100 120
Italian
German
Hungarian
French (incl Patois, Cajun)
Scandinavian languages*
Greek
Yiddish
Polish
Japanese
Laotian
Navajo
Other Native North American languages*
Other and unspecified languages*
Speaks only English
Hebrew
Other Slavic languages*
Serbo-Croatian
Other West Germanic languages*
Mon-Khmer, Cambodian
Portuguese or Portuguese Creole
Armenian
Hmong
Korean
Russian
Tagalog
Persian
Spanish
Thai
Other Pacific Island languages*
Other Indo-European languages*
Vietnamese
Urdu
Chinese
Gujarati
Arabic
French Creole
Other Indic languages*
Hindi
African languages*
Other Asian languages*
Percent
Spanish and 81 percent of those who spoke a language other than Spanish spoke English “very well.”
Race and Ethnicity and English-Speaking Ability
Spanish speakers who were non-Hispanic White, Black, or Asian were more likely to speak English “very well” compared with those who were Hispanic.14 The difference between non-Hispanic Whites and Hispanics who spoke English “very well” was 27 per-centage points. There was also variation in English-speaking ability among those who spoke a lan-guage other than Spanish. Among those who spoke a language other than Spanish, Asians were least likely to speak English “very well.” However, none of the differences between groups was as large as the difference between Spanish-speaking Hispanics and Spanish-speaking non-Hispanic Whites. Differences are also present across detailed race and Hispanic-origin groups, as examined in a recent Census Bureau report.15
14 Federal surveys now give respondents the option of reporting more than one race. Therefore, two basic ways of defining a race group are possible. A group such as Asian may be defined as those who reported Asian and no other race (the race-alone or single-race concept) or as those who reported Asian regardless of whether they also reported another race (the race-alone-or- in-combination concept). This report shows data using the first approach (race alone). This report will refer to the White-alone population as White, the Black-alone popula-tion as Black, the Asian-alone population as Asian, and the White-alone-non-Hispanic population as non-Hispanic White. Use of the single-race population does not imply that it is the preferred method of presenting or analyzing data. The Census Bureau uses a variety of approaches. In this report, the term “non-Hispanic White” refers to people who are not Hispanic and who reported White and no other race. The Census Bureau uses non-Hispanic Whites as the comparison group for other race groups and Hispanics. Because Hispanics may be any race, data in this report for Hispanics overlap with data for racial groups.
15 See <www.census.gov /prod/2010pubs/acsbr09-19.pdf>.
U.S. Census Bureau 9
Table 3.Language Spoken at Home by English-Speaking Ability by Selected Demographic and Social Characteristics for the Population 5 Years and Over: 2011(For information on confidentiality protection, sampling error, nonsampling error, and definitions, see www.census.gov/acs/www/)
CharacteristicsPopulation
5 years and over
(Number)
Spoke a langauge
other than
English at home
(Percent)
Spoke a language other than English at home
Spoke SpanishSpoke a language other
than Spanish
Population 5 years
and over (Number)
Spoke English
“very well” (Percent)
Spoke English
less than “very well” (Percent)
Population 5 years
and over (Number)
Spoke English
“very well” (Percent)
Spoke English
less than “very well” (Percent)
Total . . . . . . . . . . . . . . . . . . . . . 291,524,091 20 .8 37,579,787 56 .3 43 .7 22,997,233 61 .4 38 .6
Age5 to 14 years . . . . . . . . . . . . . . . . . . . . 41,131,310 21 .8 6,451,625 76 .2 23 .8 2,535,007 77 .6 22 .4 15 to 19 years . . . . . . . . . . . . . . . . . . . 21,822,474 22 .3 3,412,795 82 .7 17 .3 1,449,462 80 .6 19 .4 20 to 39 years . . . . . . . . . . . . . . . . . . . 83,350,155 25 .6 13,853,503 55 .3 44 .7 7,450,076 68 .9 31 .1 40 to 59 years . . . . . . . . . . . . . . . . . . . 85,944,236 19 .5 9,795,839 42 .9 57 .1 6,980,244 53 .9 46 .1 60 years and over . . . . . . . . . . . . . . . . 59,275,916 14 .6 4,066,025 38 .7 61 .3 4,582,444 45 .3 54 .7
SexMale . . . . . . . . . . . . . . . . . . . . . . . . . . . 143,009,744 20 .9 18,914,621 55 .6 44 .4 10,952,898 63 .1 36 .9 Female . . . . . . . . . . . . . . . . . . . . . . . . . 148,514,347 20 .7 18,665,166 57 .0 43 .0 12,044,335 59 .8 40 .2
Race and Hispanic OriginWhite alone . . . . . . . . . . . . . . . . . . . . . 217,435,501 15 .2 24,469,328 57 .4 42 .6 8,688,628 69 .4 30 .6 Non-Hispanic White alone . . . . . . . . 186,989,334 5 .8 2,174,426 80 .9 19 .1 8,588,900 69 .4 30 .6 Black alone . . . . . . . . . . . . . . . . . . . . . 36,354,608 8 .3 881,899 68 .1 31 .9 2,128,247 64 .8 35 .2 Asian alone . . . . . . . . . . . . . . . . . . . . . 14,148,367 76 .7 77,751 74 .3 25 .7 10,777,195 53 .0 47 .0
Hispanic (of any race) . . . . . . . . . . . 46,782,479 74 .7 34,745,940 54 .3 45 .7 203,075 68 .6 31 .4
Nativity StatusNative . . . . . . . . . . . . . . . . . . . . . . . . . 251,380,737 10 .6 19,487,953 80 .9 19 .1 7,185,626 84 .8 15 .2 Foreign born: Naturalized citizen . . . . . . . . . . . . . . 18,094,967 79 .0 5,431,946 44 .8 55 .2 8,856,595 54 .4 45 .6 Not a citizen . . . . . . . . . . . . . . . . . . . 22,048,387 89 .0 12,659,888 23 .4 76 .6 6,955,012 45 .9 54 .1
Educational Attainment1
Less than 12th grade . . . . . . . . . . . . . . 29,089,305 42 .9 9,609,518 21 .1 78 .9 2,855,281 24 .0 76 .0 High school graduate . . . . . . . . . . . . . . 58,653,211 16 .6 6,321,485 48 .1 51 .9 3,423,791 44 .3 55 .7 Some college, or associate’s degree . . 59,838,341 14 .6 5,029,756 69 .8 30 .2 3,726,173 61 .7 38 .3 Bachelor’s degree or more . . . . . . . . . 58,890,813 18 .0 3,279,205 73 .5 26 .5 7,321,209 71 .4 28 .6
Employment Status2
In labor force: Employed . . . . . . . . . . . . . . . . . . . . . 140,399,548 21 .0 17,955,542 52 .2 47 .8 11,542,775 63 .7 36 .3 Unemployed . . . . . . . . . . . . . . . . . . . 16,060,624 22 .6 2,452,052 55 .8 44 .2 952,685 61 .1 38 .9 Not in labor force . . . . . . . . . . . . . . . . . 88,717,824 19 .6 9,994,210 49 .1 50 .9 7,418,060 51 .3 48 .7
Poverty StatusBelow the poverty level . . . . . . . . . . . . 43,341,948 29 .6 9,377,171 49 .3 50 .7 3,468,021 49 .7 50 .3 At or above poverty level . . . . . . . . . . . 240,663,391 19 .3 27,482,262 58 .5 41 .5 19,057,584 63 .2 36 .8
Disability StatusWith a disability . . . . . . . . . . . . . . . . . . 39,172,917 14 .9 3,586,682 47 .2 52 .8 2,253,901 45 .6 54 .4 No disablility . . . . . . . . . . . . . . . . . . . . 252,351,174 21 .7 33,993,105 57 .3 42 .7 20,743,332 63 .1 36 .9
Health InsuranceWith health insurance coverage . . . . . 244,706,190 17 .5 24,079,286 65 .0 35 .0 18,715,248 64 .0 36 .0 No health insurance coverage . . . . . . . 46,817,901 38 .0 13,500,501 40 .9 59 .1 4,281,985 49 .9 50 .1
1 Educational attainment is displayed for the population 25 years and over .2 Employment status is shown for the population 16 years and over and does not include those in the Armed Forces .Note: Margins of error for all estimates can be found in the Appendix Table 3 <www .census .gov/hhes/socdemo/language/data/acs/Table3 .xls> . For more infor-
mation on the ACS, see <www .census .gov/acs/www/> .Source: U .S . Census Bureau, 2011 American Community Survey .
10 U.S. Census Bureau
Citizenship and English-Speaking Ability
English-speaking ability varied by citizenship status among Spanish speakers much more than it did among those who spoke other lan-guages. Among Spanish speakers, 45 percent of foreign-born natural-ized citizens spoke English “very well” compared with 23 percent of foreign-born noncitizens. Among those who spoke a foreign lan-guage other than Spanish, the gap between foreign-born naturalized citizens and foreign-born nonciti-zens was smaller—only 9 percent.
Other Characteristics and English-Speaking Ability
Education, employment status, pov-erty status, disability status, and health insurance coverage were also correlated with English speak-ing ability. Seventy-three percent of Spanish-speakers with a bachelor’s degree or more education spoke English “very well,” compared with 71 percent of those who spoke a language other than Spanish for this same education level.
LANGUAGE CONCENTRATIONS IN STATES
Languages spoken at home are not evenly distributed throughout the nation. Some areas have high percentages of speakers of non-English languages, while others have lower levels. Table 4 shows the proportion of people who spoke a language other than English at home across the 50 states and the District of Columbia, as well as the English-speaking ability levels in those states. English-speaking ability varied across states. In West Virginia, only 2 percent of people 5 years old and over reported speaking a language other than English at home, while 44 percent of people in California reported the same.
Levels of English-speaking ability were also different across states. In Montana, a large percentage of those who spoke a language other than English at home (84 percent) reported speaking English “very well.” In Alabama, this percentage was 55 percent.
Quite often, concentrations of spe-cific language groups were found in certain areas of the country. An examination of some of these patterns is provided in the 2007 version of this report (Shin and Kominski, 2011).16 In the short term, the factors creating these concentrations include points of entry into the United States and family connections facilitating chain migration (Alberto Palloni et al., 2001).17 In the longer term, internal migration streams, employ-ment opportunities, and other family situations can sometimes facilitate the diffusion of language groups within the country.
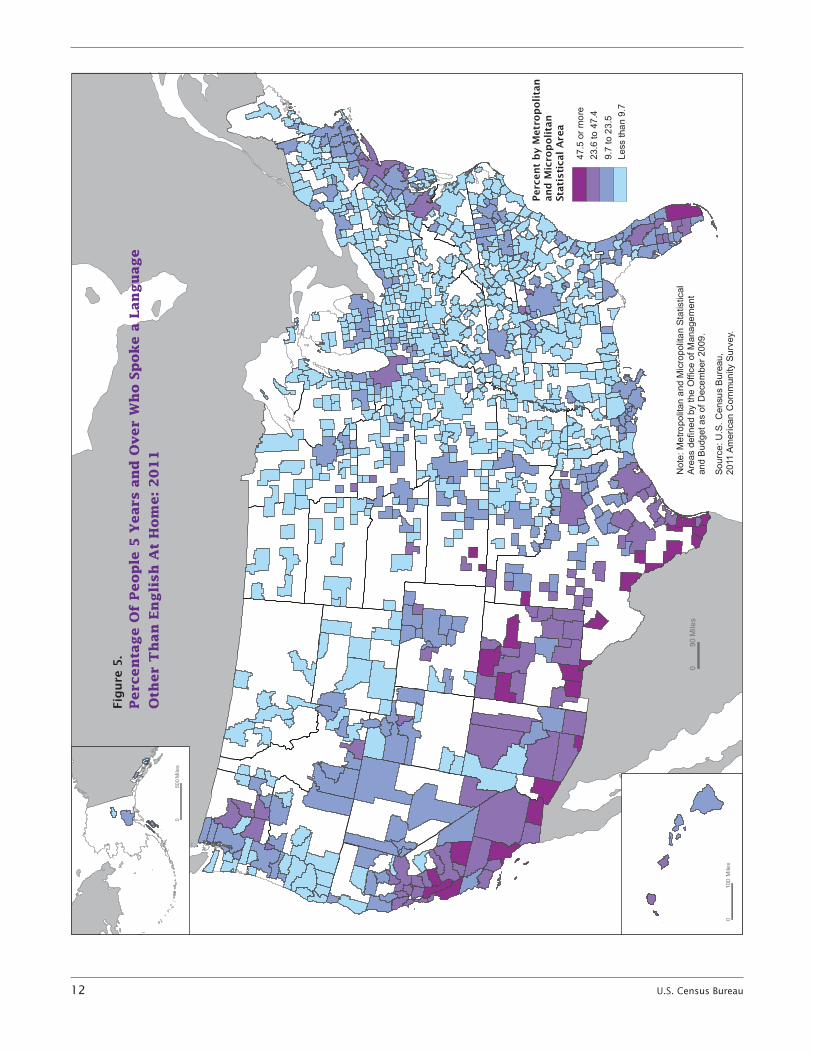
LANGUAGES SPOKEN IN METROPOLITAN AND MICROPOLITAN AREAS
Just as languages are dispersed unevenly across states, some languages are concentrated in certain metropolitan and micro-politan statistical areas. Large metropolitan areas such as New York, Los Angeles, and Chicago generally have large proportions of people who speak a language other than English at home because of the economic opportunities in these places or because they act as gateway points of entry into the country. Not all of the high levels of language clustering occur in the largest metropolitan areas, how-ever. Many smaller metropolitan
16 See <www.census.gov/hhes /socdemo/language/data/acs/ACS-12.pdf>.
17 Alberto Palloni et al., 2001, “Social Capital and International Migration: A Test Using Information on Family Networks,” American Journal of Sociology, Vol. 106, No. 5: 1262–1298.
areas also had high proportions of people who spoke a language other than English at home.
Figure 5 shows a geographic distri-bution of the proportion of people who spoke a language other than English at home across metropoli-tan and micropolitan areas. In gen-eral, metropolitan and micropolitan areas within the west, south, and northeast tended to have higher levels of foreign-language speak-ers. Metropolitan and micropolitan areas located in the midwestern states tended to have lower levels of foreign-language speakers, with the exception of Illinois.
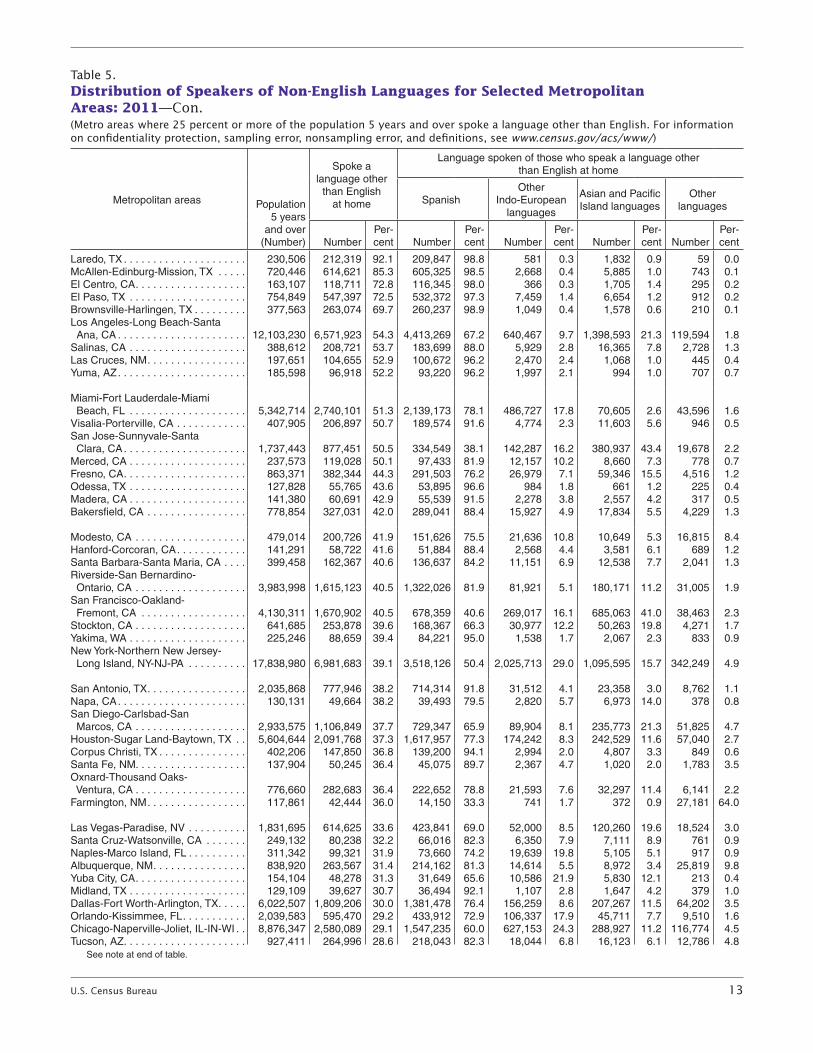
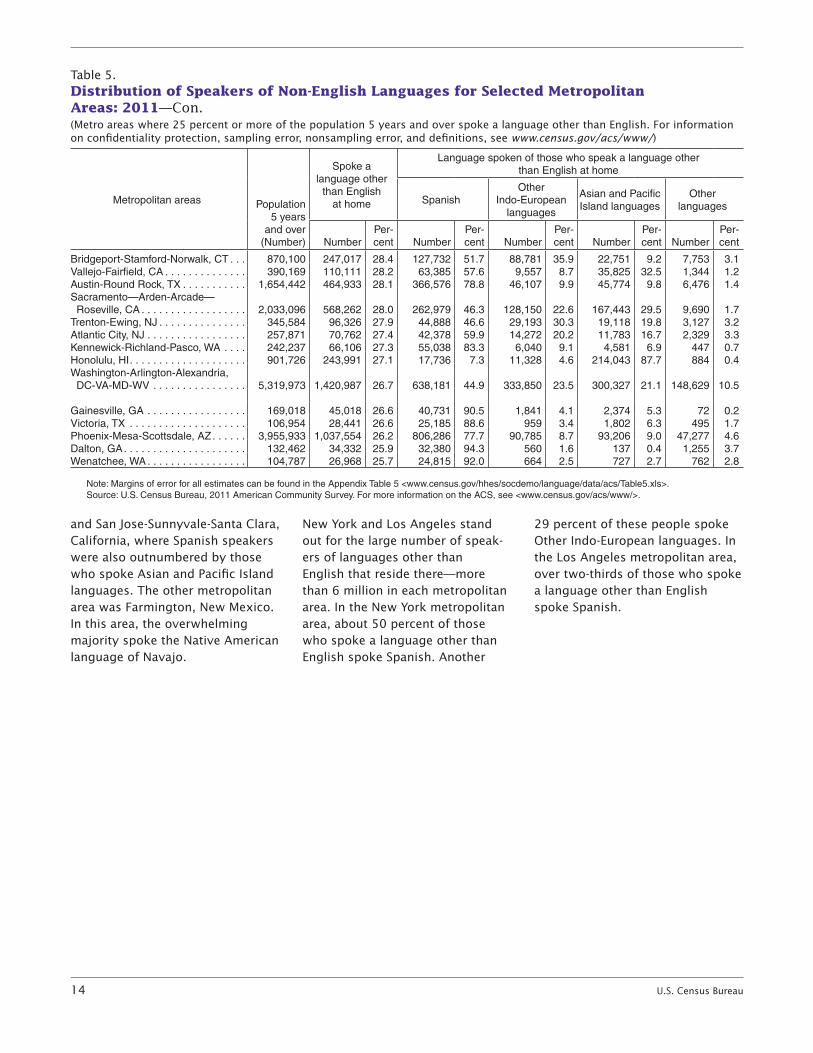
Table 5 presents the distribution of the languages other than English for the 57 metropolitan areas where one-fourth or more of the population 5 years and older speak a language other than English at home. Twenty-two of these metropolitan areas are located in California, and 12 are in Texas. The remaining 23 are in various states, such as Florida, New Mexico, Arizona, and New Jersey. The Laredo, Texas, metropolitan area had the highest percentage of the population who spoke a language other than English. The great majority of these non-English language speakers spoke Spanish (99 percent). Other metropolitan areas with at least 90 percent Spanish speakers among those speaking a language other than English included several cities located on the border with Mexico, including Brownsville-Harlingen, McAllen-Edinburg-Mission, and El Paso in Texas; Yuma, Arizona; El Centro, California; and Las Cruces, New Mexico. Spanish speakers were less than 40 percent of all non-English language speakers in only three of the listed metropoli-tan areas. This included Honolulu, Hawaii, where 88 percent spoke Asian and Pacific Island languages,

U.S. Census Bureau 11
Table 4.Language Spoken at Home and English-Speaking Ability by State: 2011(For information on confidentiality protection, sampling error, nonsampling error, and definitions, see www.census.gov/acs/www/)
StatePopulation
5 years and over
(Number)
Spoke a language other than English at home
English-speaking ability (Percent)
Number Percent
Spoke English
“very well”
Spoke English
“well”
Spoke English
“not well”
Spoke English
“not at all”
United States . . . . . . . 291,524,091 60,577,020 20 .8 58 .2 19 .4 15 .4 7 .0
Alabama . . . . . . . . . . . . . . . . 4,504,275 235,830 5 .2 55 .4 19 .0 20 .2 5 .3Alaska . . . . . . . . . . . . . . . . . . 668,687 111,319 16 .6 69 .2 20 .9 8 .6 1 .3Arizona . . . . . . . . . . . . . . . . . 6,034,541 1,629,853 27 .0 65 .5 15 .7 12 .9 5 .9Arkansas . . . . . . . . . . . . . . . . 2,740,313 204,666 7 .5 54 .7 23 .0 17 .0 5 .2California . . . . . . . . . . . . . . . . 35,158,257 15,390,211 43 .8 55 .7 19 .4 16 .6 8 .4Colorado . . . . . . . . . . . . . . . . 4,775,755 798,923 16 .7 62 .0 18 .1 14 .5 5 .4Connecticut . . . . . . . . . . . . . . 3,384,503 724,026 21 .4 61 .5 19 .2 14 .4 5 .0Delaware . . . . . . . . . . . . . . . . 851,887 115,717 13 .6 65 .1 17 .1 12 .5 5 .4District of Columbia . . . . . . . . 581,764 87,516 15 .0 72 .5 16 .2 8 .6 2 .7
Florida . . . . . . . . . . . . . . . . . . 17,983,218 4,959,186 27 .6 57 .0 19 .2 15 .5 8 .3Georgia . . . . . . . . . . . . . . . . . 9,141,183 1,214,783 13 .3 57 .2 19 .3 17 .8 5 .7Hawaii . . . . . . . . . . . . . . . . . . 1,286,790 323,915 25 .2 52 .4 27 .5 17 .5 2 .7Idaho . . . . . . . . . . . . . . . . . . . 1,466,499 152,712 10 .4 62 .4 15 .6 15 .9 6 .1Illinois . . . . . . . . . . . . . . . . . . . 12,042,289 2,730,437 22 .7 57 .3 20 .7 15 .9 6 .2Indiana . . . . . . . . . . . . . . . . . . 6,088,598 501,711 8 .2 60 .1 21 .0 14 .7 4 .2Iowa . . . . . . . . . . . . . . . . . . . . 2,864,107 208,066 7 .3 59 .1 19 .5 15 .6 5 .8Kansas . . . . . . . . . . . . . . . . . . 2,669,198 304,111 11 .4 59 .3 19 .0 16 .2 5 .5Kentucky . . . . . . . . . . . . . . . . 4,090,258 197,131 4 .8 58 .1 21 .2 16 .7 4 .0Louisiana . . . . . . . . . . . . . . . . 4,261,861 371,986 8 .7 67 .2 16 .4 11 .5 4 .9Maine . . . . . . . . . . . . . . . . . . . 1,261,967 83,579 6 .6 76 .8 13 .0 8 .3 1 .9
Maryland . . . . . . . . . . . . . . . . 5,465,168 914,110 16 .7 62 .9 19 .9 13 .6 3 .6Massachusetts . . . . . . . . . . . . 6,224,979 1,370,449 22 .0 59 .6 20 .3 13 .9 6 .2Michigan . . . . . . . . . . . . . . . . 9,292,794 847,255 9 .1 64 .8 19 .1 12 .4 3 .7Minnesota . . . . . . . . . . . . . . . 4,992,262 540,623 10 .8 60 .6 20 .3 13 .8 5 .2Mississippi . . . . . . . . . . . . . . . 2,773,115 105,186 3 .8 55 .7 16 .9 19 .0 8 .4Missouri . . . . . . . . . . . . . . . . . 5,629,071 362,210 6 .4 62 .0 20 .8 12 .9 4 .3Montana . . . . . . . . . . . . . . . . . 937,750 43,660 4 .7 83 .7 13 .2 2 .7 0 .4Nebraska . . . . . . . . . . . . . . . . 1,711,659 176,008 10 .3 54 .1 19 .4 20 .1 6 .4Nevada . . . . . . . . . . . . . . . . . 2,538,136 754,531 29 .7 57 .8 21 .3 15 .3 5 .6New Hampshire . . . . . . . . . . . 1,250,588 97,479 7 .8 70 .5 18 .8 8 .4 2 .3
New Jersey . . . . . . . . . . . . . . 8,285,611 2,520,761 30 .4 57 .4 20 .7 15 .4 6 .4New Mexico . . . . . . . . . . . . . . 1,937,824 707,597 36 .5 72 .5 13 .9 9 .1 4 .6New York . . . . . . . . . . . . . . . . 18,307,740 5,506,992 30 .1 55 .3 20 .9 16 .9 6 .9North Carolina . . . . . . . . . . . . 9,029,678 966,322 10 .7 56 .3 18 .7 16 .9 8 .1North Dakota . . . . . . . . . . . . . 637,666 32,380 5 .1 71 .6 18 .4 8 .8 1 .2Ohio . . . . . . . . . . . . . . . . . . . . 10,836,508 721,796 6 .7 64 .9 20 .8 11 .4 2 .9Oklahoma . . . . . . . . . . . . . . . 3,527,312 329,017 9 .3 58 .8 17 .4 17 .1 6 .8Oregon . . . . . . . . . . . . . . . . . . 3,633,190 540,456 14 .9 57 .8 19 .0 15 .6 7 .6Pennsylvania . . . . . . . . . . . . . 12,021,912 1,237,714 10 .3 62 .6 19 .7 13 .3 4 .4Rhode Island . . . . . . . . . . . . . 995,856 211,150 21 .2 58 .8 21 .0 13 .7 6 .5
South Carolina . . . . . . . . . . . . 4,376,509 289,004 6 .6 58 .6 20 .2 15 .2 6 .0South Dakota . . . . . . . . . . . . . 765,534 50,335 6 .6 66 .2 16 .5 14 .7 2 .7Tennessee . . . . . . . . . . . . . . . 6,003,565 414,669 6 .9 57 .8 20 .7 17 .0 4 .4Texas . . . . . . . . . . . . . . . . . . . 23,721,334 8,221,202 34 .7 58 .1 18 .2 14 .8 8 .9Utah . . . . . . . . . . . . . . . . . . . . 2,554,924 380,382 14 .9 64 .4 17 .3 14 .2 4 .1Vermont . . . . . . . . . . . . . . . . . 595,658 29,402 4 .9 71 .4 20 .1 6 .5 2 .0Virginia . . . . . . . . . . . . . . . . . . 7,588,188 1,132,310 14 .9 62 .8 20 .1 13 .4 3 .7Washington . . . . . . . . . . . . . . 6,390,691 1,186,543 18 .6 57 .1 21 .2 15 .6 6 .0West Virginia . . . . . . . . . . . . . 1,751,216 40,310 2 .3 64 .7 22 .0 12 .1 1 .3Wisconsin . . . . . . . . . . . . . . . 5,362,567 467,555 8 .7 62 .1 19 .0 14 .3 4 .6Wyoming . . . . . . . . . . . . . . . . 529,136 33,934 6 .4 72 .8 14 .0 10 .5 2 .7
Note: Margins of error for all estimates can be found in the Appendix Table 4 <www .census .gov/hhes/socdemo/language/data/acs/Table4 .xls> . For more infor-mation on the ACS, see <www .census .gov/acs/www/> .
Source: U .S . Census Bureau, 2011 American Community Survey .
12 U.S. Census Bureau
050
0M
iles
090
Mile
s
010
0M
iles
Perc
en
t b
y M
etr
op
oli
tan
an
dM
icro
po
lita
n
Stati
sti
cal
Are
a
Fig
ure
5.
Perc
en
tage O
f Peop
le 5
Years
an
d O
ver
Wh
o S
pok
e a
Lan
gu
age
O
ther
Th
an
En
gli
sh
At
Hom
e:
20
11
Not
e: M
etro
polit
an a
nd M
icro
polit
an S
tatis
tical
Ar
eas
defin
ed b
y th
e O
ffice
of M
anag
emen
t an
d B
udge
t as
of D
ecem
ber 2
009.
Sour
ce: U
.S. C
ensu
s B
urea
u,
2011
Am
eric
an C
omm
unity
Sur
vey.
47.5
or m
ore
23.6
to 4
7.4
9.7
to 2
3.5
Less
than
9.7
U.S. Census Bureau 13
Table 5.Distribution of Speakers of Non-English Languages for Selected Metropolitan Areas: 2011—Con.(Metro areas where 25 percent or more of the population 5 years and over spoke a language other than English. For information on confidentiality protection, sampling error, nonsampling error, and definitions, see www.census.gov/acs/www/)
Metropolitan areas Population 5 years
and over (Number)
Spoke a language other
than English at home
Language spoken of those who speak a language other than English at home
SpanishOther
Indo-European languages
Asian and Pacific Island languages
Other languages
NumberPer-cent Number
Per-cent Number
Per-cent Number
Per-cent Number
Per-cent
Laredo, TX . . . . . . . . . . . . . . . . . . . . . 230,506 212,319 92 .1 209,847 98 .8 581 0 .3 1,832 0 .9 59 0 .0McAllen-Edinburg-Mission, TX . . . . . 720,446 614,621 85 .3 605,325 98 .5 2,668 0 .4 5,885 1 .0 743 0 .1El Centro, CA . . . . . . . . . . . . . . . . . . . 163,107 118,711 72 .8 116,345 98 .0 366 0 .3 1,705 1 .4 295 0 .2El Paso, TX . . . . . . . . . . . . . . . . . . . . 754,849 547,397 72 .5 532,372 97 .3 7,459 1 .4 6,654 1 .2 912 0 .2Brownsville-Harlingen, TX . . . . . . . . .Los Angeles-Long Beach-Santa
377,563 263,074 69 .7 260,237 98 .9 1,049 0 .4 1,578 0 .6 210 0 .1
Ana, CA . . . . . . . . . . . . . . . . . . . . . . 12,103,230 6,571,923 54 .3 4,413,269 67 .2 640,467 9 .7 1,398,593 21 .3 119,594 1 .8Salinas, CA . . . . . . . . . . . . . . . . . . . . 388,612 208,721 53 .7 183,699 88 .0 5,929 2 .8 16,365 7 .8 2,728 1 .3Las Cruces, NM . . . . . . . . . . . . . . . . . 197,651 104,655 52 .9 100,672 96 .2 2,470 2 .4 1,068 1 .0 445 0 .4Yuma, AZ . . . . . . . . . . . . . . . . . . . . . .
Miami-Fort Lauderdale-Miami
185,598 96,918 52 .2 93,220 96 .2 1,997 2 .1 994 1 .0 707 0 .7
Beach, FL . . . . . . . . . . . . . . . . . . . . 5,342,714 2,740,101 51 .3 2,139,173 78 .1 486,727 17 .8 70,605 2 .6 43,596 1 .6Visalia-Porterville, CA . . . . . . . . . . . .San Jose-Sunnyvale-Santa
407,905 206,897 50 .7 189,574 91 .6 4,774 2 .3 11,603 5 .6 946 0 .5
Clara, CA . . . . . . . . . . . . . . . . . . . . . 1,737,443 877,451 50 .5 334,549 38 .1 142,287 16 .2 380,937 43 .4 19,678 2 .2Merced, CA . . . . . . . . . . . . . . . . . . . . 237,573 119,028 50 .1 97,433 81 .9 12,157 10 .2 8,660 7 .3 778 0 .7Fresno, CA . . . . . . . . . . . . . . . . . . . . . 863,371 382,344 44 .3 291,503 76 .2 26,979 7 .1 59,346 15 .5 4,516 1 .2Odessa, TX . . . . . . . . . . . . . . . . . . . . 127,828 55,765 43 .6 53,895 96 .6 984 1 .8 661 1 .2 225 0 .4Madera, CA . . . . . . . . . . . . . . . . . . . . 141,380 60,691 42 .9 55,539 91 .5 2,278 3 .8 2,557 4 .2 317 0 .5Bakersfield, CA . . . . . . . . . . . . . . . . . 778,854 327,031 42 .0 289,041 88 .4 15,927 4 .9 17,834 5 .5 4,229 1 .3
Modesto, CA . . . . . . . . . . . . . . . . . . . 479,014 200,726 41 .9 151,626 75 .5 21,636 10 .8 10,649 5 .3 16,815 8 .4Hanford-Corcoran, CA . . . . . . . . . . . . 141,291 58,722 41 .6 51,884 88 .4 2,568 4 .4 3,581 6 .1 689 1 .2Santa Barbara-Santa Maria, CA . . . .Riverside-San Bernardino-
399,458 162,367 40 .6 136,637 84 .2 11,151 6 .9 12,538 7 .7 2,041 1 .3
Ontario, CA . . . . . . . . . . . . . . . . . . .San Francisco-Oakland-
3,983,998 1,615,123 40 .5 1,322,026 81 .9 81,921 5 .1 180,171 11 .2 31,005 1 .9
Fremont, CA . . . . . . . . . . . . . . . . . . 4,130,311 1,670,902 40 .5 678,359 40 .6 269,017 16 .1 685,063 41 .0 38,463 2 .3Stockton, CA . . . . . . . . . . . . . . . . . . . 641,685 253,878 39 .6 168,367 66 .3 30,977 12 .2 50,263 19 .8 4,271 1 .7Yakima, WA . . . . . . . . . . . . . . . . . . . .New York-Northern New Jersey-
225,246 88,659 39 .4 84,221 95 .0 1,538 1 .7 2,067 2 .3 833 0 .9
Long Island, NY-NJ-PA . . . . . . . . . . 17,838,980 6,981,683 39 .1 3,518,126 50 .4 2,025,713 29 .0 1,095,595 15 .7 342,249 4 .9
San Antonio, TX . . . . . . . . . . . . . . . . . 2,035,868 777,946 38 .2 714,314 91 .8 31,512 4 .1 23,358 3 .0 8,762 1 .1Napa, CA . . . . . . . . . . . . . . . . . . . . . .San Diego-Carlsbad-San
130,131 49,664 38 .2 39,493 79 .5 2,820 5 .7 6,973 14 .0 378 0 .8
Marcos, CA . . . . . . . . . . . . . . . . . . . 2,933,575 1,106,849 37 .7 729,347 65 .9 89,904 8 .1 235,773 21 .3 51,825 4 .7Houston-Sugar Land-Baytown, TX . . 5,604,644 2,091,768 37 .3 1,617,957 77 .3 174,242 8 .3 242,529 11 .6 57,040 2 .7Corpus Christi, TX . . . . . . . . . . . . . . . 402,206 147,850 36 .8 139,200 94 .1 2,994 2 .0 4,807 3 .3 849 0 .6Santa Fe, NM . . . . . . . . . . . . . . . . . . .Oxnard-Thousand Oaks-
137,904 50,245 36 .4 45,075 89 .7 2,367 4 .7 1,020 2 .0 1,783 3 .5
Ventura, CA . . . . . . . . . . . . . . . . . . . 776,660 282,683 36 .4 222,652 78 .8 21,593 7 .6 32,297 11 .4 6,141 2 .2Farmington, NM . . . . . . . . . . . . . . . . . 117,861 42,444 36 .0 14,150 33 .3 741 1 .7 372 0 .9 27,181 64 .0
Las Vegas-Paradise, NV . . . . . . . . . . 1,831,695 614,625 33 .6 423,841 69 .0 52,000 8 .5 120,260 19 .6 18,524 3 .0Santa Cruz-Watsonville, CA . . . . . . . 249,132 80,238 32 .2 66,016 82 .3 6,350 7 .9 7,111 8 .9 761 0 .9Naples-Marco Island, FL . . . . . . . . . . 311,342 99,321 31 .9 73,660 74 .2 19,639 19 .8 5,105 5 .1 917 0 .9Albuquerque, NM . . . . . . . . . . . . . . . . 838,920 263,567 31 .4 214,162 81 .3 14,614 5 .5 8,972 3 .4 25,819 9 .8Yuba City, CA . . . . . . . . . . . . . . . . . . . 154,104 48,278 31 .3 31,649 65 .6 10,586 21 .9 5,830 12 .1 213 0 .4Midland, TX . . . . . . . . . . . . . . . . . . . . 129,109 39,627 30 .7 36,494 92 .1 1,107 2 .8 1,647 4 .2 379 1 .0Dallas-Fort Worth-Arlington, TX . . . . . 6,022,507 1,809,206 30 .0 1,381,478 76 .4 156,259 8 .6 207,267 11 .5 64,202 3 .5Orlando-Kissimmee, FL . . . . . . . . . . . 2,039,583 595,470 29 .2 433,912 72 .9 106,337 17 .9 45,711 7 .7 9,510 1 .6Chicago-Naperville-Joliet, IL-IN-WI . . 8,876,347 2,580,089 29 .1 1,547,235 60 .0 627,153 24 .3 288,927 11 .2 116,774 4 .5Tucson, AZ . . . . . . . . . . . . . . . . . . . . .
See note at end of table .927,411 264,996 28 .6 218,043 82 .3 18,044 6 .8 16,123 6 .1 12,786 4 .8
14 U.S. Census Bureau
Table 5.Distribution of Speakers of Non-English Languages for Selected Metropolitan Areas: 2011—Con.(Metro areas where 25 percent or more of the population 5 years and over spoke a language other than English. For information on confidentiality protection, sampling error, nonsampling error, and definitions, see www.census.gov/acs/www/)
Metropolitan areas Population 5 years
and over (Number)
Spoke a language other
than English at home
Language spoken of those who speak a language other than English at home
SpanishOther
Indo-European languages
Asian and Pacific Island languages
Other languages
NumberPer-cent Number
Per-cent Number
Per-cent Number
Per-cent Number
Per-cent
Bridgeport-Stamford-Norwalk, CT . . . 870,100 247,017 28 .4 127,732 51 .7 88,781 35 .9 22,751 9 .2 7,753 3 .1Vallejo-Fairfield, CA . . . . . . . . . . . . . . 390,169 110,111 28 .2 63,385 57 .6 9,557 8 .7 35,825 32 .5 1,344 1 .2Austin-Round Rock, TX . . . . . . . . . . . 1,654,442 464,933 28 .1 366,576 78 .8 46,107 9 .9 45,774 9 .8 6,476 1 .4Sacramento—Arden-Arcade— Roseville, CA . . . . . . . . . . . . . . . . . . 2,033,096 568,262 28 .0 262,979 46 .3 128,150 22 .6 167,443 29 .5 9,690 1 .7Trenton-Ewing, NJ . . . . . . . . . . . . . . . 345,584 96,326 27 .9 44,888 46 .6 29,193 30 .3 19,118 19 .8 3,127 3 .2Atlantic City, NJ . . . . . . . . . . . . . . . . . 257,871 70,762 27 .4 42,378 59 .9 14,272 20 .2 11,783 16 .7 2,329 3 .3Kennewick-Richland-Pasco, WA . . . . 242,237 66,106 27 .3 55,038 83 .3 6,040 9 .1 4,581 6 .9 447 0 .7Honolulu, HI . . . . . . . . . . . . . . . . . . . . 901,726 243,991 27 .1 17,736 7 .3 11,328 4 .6 214,043 87 .7 884 0 .4Washington-Arlington-Alexandria, DC-VA-MD-WV . . . . . . . . . . . . . . . . 5,319,973 1,420,987 26 .7 638,181 44 .9 333,850 23 .5 300,327 21 .1 148,629 10 .5
Gainesville, GA . . . . . . . . . . . . . . . . . 169,018 45,018 26 .6 40,731 90 .5 1,841 4 .1 2,374 5 .3 72 0 .2Victoria, TX . . . . . . . . . . . . . . . . . . . . 106,954 28,441 26 .6 25,185 88 .6 959 3 .4 1,802 6 .3 495 1 .7Phoenix-Mesa-Scottsdale, AZ . . . . . . 3,955,933 1,037,554 26 .2 806,286 77 .7 90,785 8 .7 93,206 9 .0 47,277 4 .6Dalton, GA . . . . . . . . . . . . . . . . . . . . . 132,462 34,332 25 .9 32,380 94 .3 560 1 .6 137 0 .4 1,255 3 .7Wenatchee, WA . . . . . . . . . . . . . . . . . 104,787 26,968 25 .7 24,815 92 .0 664 2 .5 727 2 .7 762 2 .8
Note: Margins of error for all estimates can be found in the Appendix Table 5 <www .census .gov/hhes/socdemo/language/data/acs/Table5 .xls> .Source: U .S . Census Bureau, 2011 American Community Survey . For more information on the ACS, see <www .census .gov/acs/www/> .
and San Jose-Sunnyvale-Santa Clara, California, where Spanish speakers were also outnumbered by those who spoke Asian and Pacific Island languages. The other metropolitan area was Farmington, New Mexico. In this area, the overwhelming majority spoke the Native American language of Navajo.
New York and Los Angeles stand out for the large number of speak-ers of languages other than English that reside there—more than 6 million in each metropolitan area. In the New York metropolitan area, about 50 percent of those who spoke a language other than English spoke Spanish. Another
29 percent of these people spoke Other Indo-European languages. In the Los Angeles metropolitan area, over two-thirds of those who spoke a language other than English spoke Spanish.
U.S. Census Bureau 15
SUMMARY
This report provides illustrative evi-dence of the continuing and grow-ing role of non-English languages as part of the national fabric. Fueled by both long-term historic immigration patterns and more recent ones, the language diver-sity of the country has increased over the past few decades. As the nation continues to be a destina-tion for people from other lands, this pattern of language diversity will also likely continue. Given the patterns of location and reloca-tion over time, local areas may see specific or diverse changes in the languages spoken in any given locality.
SOURCE OF THE DATA
Estimates in this report are from the 2011 American Community Survey (ACS). The population rep-resented (the population universe) in the 2011 ACS includes both the household and the group quarters populations (that is, the resident population). The group quarters population consists of the insti-tutionalized population (such as people in correctional institutions or nursing homes) and the non- institutionalized population (most of whom are in college dormitories).
ACCURACY OF THE ESTIMATES
Statistics from sample surveys are subject to sampling error and nonsampling error. All comparisons presented in this report have taken sampling error into account and are significant at the 90 percent confidence level.18 This means the 90 percent confidence interval for the difference between estimates being compared does not include zero. Nonsampling error in surveys may be attributed to a variety of sources, such as how the survey was designed, how respondents interpret questions, how able and willing respondents are to provide correct answers, and how accu-rately answers are coded and clas-sified. To minimize these errors, the Census Bureau employs qual-ity control procedures in sample selection, the wording of questions, interviewing, coding, data process-ing, and data analysis.
The final ACS population estimates are adjusted in the weighting pro-cedure for coverage error by con-trolling specific survey estimates to independent population controls by sex, age, race, and Hispanic origin. This weighting partially corrects for
18 The tables reporting the margins of error for all the tables in this report can be accessed at <www.census.gov/hhes /socdemo/language/data/acs/2011 /appendix.html>.
bias due to over- or undercoverage, but biases may still be present, for example, when people who were missed differ from those inter-viewed in ways other than sex, age, race, and Hispanic origin. How this weighting procedure affects other variables in the survey is not pre-cisely known. All of these consid-erations affect comparisons across different surveys or data sources. For information on sampling and estimation methods, confidentiality protection, and sampling and non-sampling errors, please see the “2011 ACS Accuracy of the Data” document located at <www.census.gov/acs/www /Downloads/data_documentation /Accuracy/ACS_Accuracy_of _Data_2011.pdf>.
MORE INFORMATION
Detailed tabulations, related information, and historic data are available on the Internet at the Language Use page on the Census Bureau’s Web site at <www.census.gov/hhes/socdemo /language/index.html>. For addi-tional questions or comments, contact the Education and Social Stratification Branch at 301-763-2464 or e-mail Camille L. Ryan at <[email protected]>.
16 U.S. Census Bureau
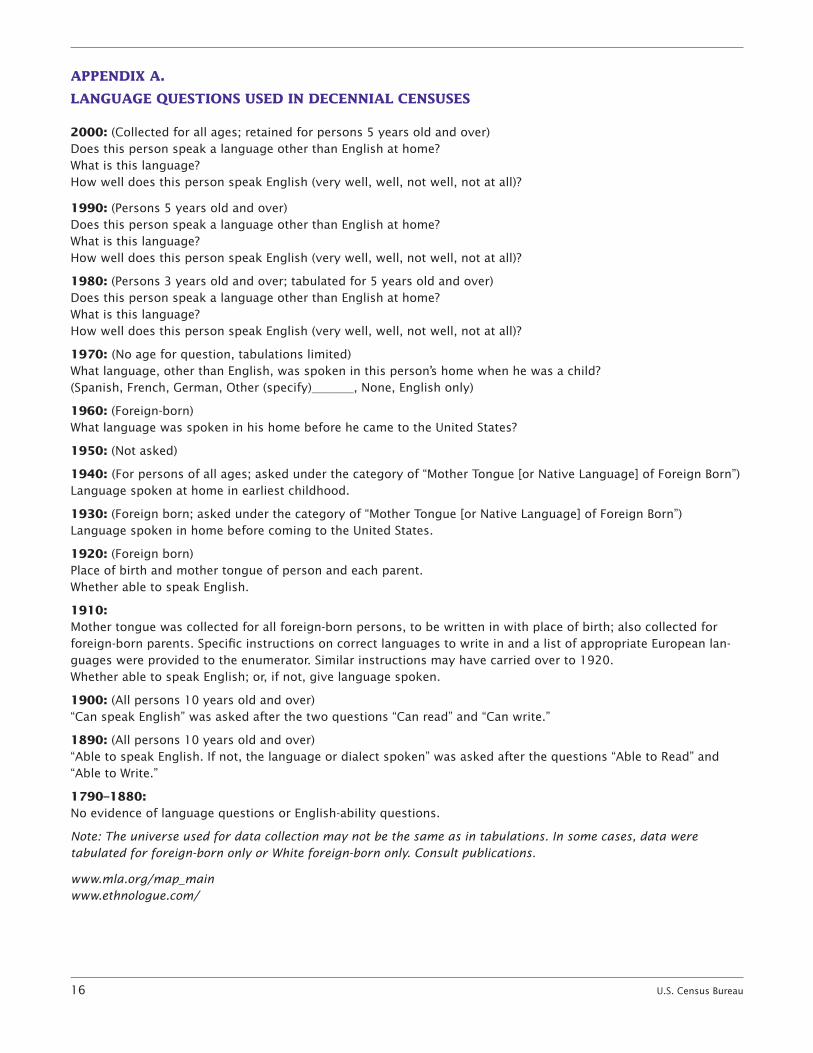
APPENDIX A.
LANGUAGE QUESTIONS USED IN DECENNIAL CENSUSES
2000: (Collected for all ages; retained for persons 5 years old and over) Does this person speak a language other than English at home? What is this language? How well does this person speak English (very well, well, not well, not at all)?
1990: (Persons 5 years old and over) Does this person speak a language other than English at home? What is this language? How well does this person speak English (very well, well, not well, not at all)?
1980: (Persons 3 years old and over; tabulated for 5 years old and over) Does this person speak a language other than English at home? What is this language? How well does this person speak English (very well, well, not well, not at all)?
1970: (No age for question, tabulations limited) What language, other than English, was spoken in this person’s home when he was a child? (Spanish, French, German, Other (specify)_______, None, English only)
1960: (Foreign-born) What language was spoken in his home before he came to the United States?
1950: (Not asked)
1940: (For persons of all ages; asked under the category of “Mother Tongue [or Native Language] of Foreign Born”) Language spoken at home in earliest childhood.
1930: (Foreign born; asked under the category of “Mother Tongue [or Native Language] of Foreign Born”) Language spoken in home before coming to the United States.
1920: (Foreign born) Place of birth and mother tongue of person and each parent. Whether able to speak English.
1910: Mother tongue was collected for all foreign-born persons, to be written in with place of birth; also collected for foreign-born parents. Specific instructions on correct languages to write in and a list of appropriate European lan-guages were provided to the enumerator. Similar instructions may have carried over to 1920. Whether able to speak English; or, if not, give language spoken.
1900: (All persons 10 years old and over) “Can speak English” was asked after the two questions “Can read” and “Can write.”
1890: (All persons 10 years old and over) “Able to speak English. If not, the language or dialect spoken” was asked after the questions “Able to Read” and “Able to Write.”
1790–1880: No evidence of language questions or English-ability questions.
Note: The universe used for data collection may not be the same as in tabulations. In some cases, data were tabulated for foreign-born only or White foreign-born only. Consult publications.
www.mla.org/map_main www.ethnologue.com/