landscape scale surface albedo in idaho/montana from 2000-2012 mcd43a products
DESCRIPTION
Landscape scale surface albedo in Idaho/Montana from 2000-2012 MCD43A products. I. Process chain. Target period for the statistics: DOY (209-249) (i.e. August -early Sep) Target region : P41R28 (same with the investigation using our temporal Landsat albedo) - PowerPoint PPT PresentationTRANSCRIPT
Landscape scale surface albedo in Idaho/Montana from 2000-2012 MCD43A products
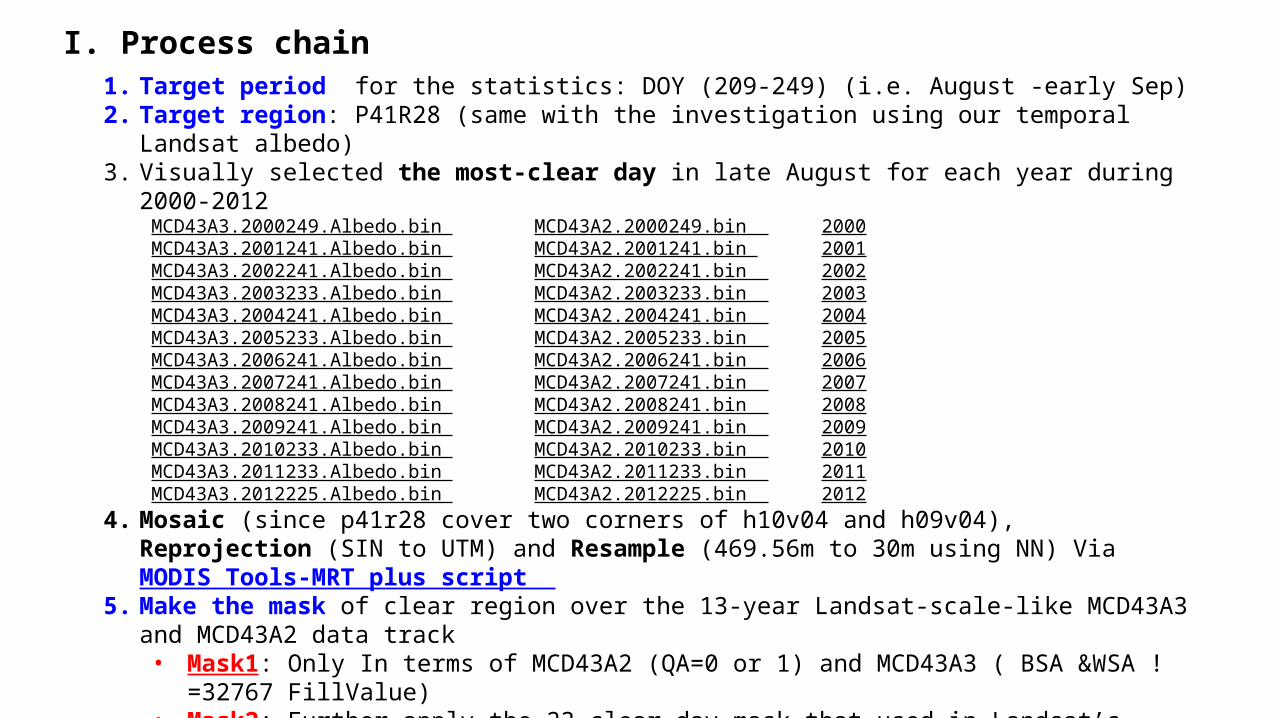
1. Target period for the statistics: DOY (209-249) (i.e. August -early Sep) 2. Target region: P41R28 (same with the investigation using our temporal Landsat albedo)3. Visually selected the most-clear day in late August for each year during 2000-2012
MCD43A3.2000249.Albedo.bin MCD43A2.2000249.bin 2000MCD43A3.2001241.Albedo.bin MCD43A2.2001241.bin 2001MCD43A3.2002241.Albedo.bin MCD43A2.2002241.bin 2002MCD43A3.2003233.Albedo.bin MCD43A2.2003233.bin 2003MCD43A3.2004241.Albedo.bin MCD43A2.2004241.bin 2004MCD43A3.2005233.Albedo.bin MCD43A2.2005233.bin 2005MCD43A3.2006241.Albedo.bin MCD43A2.2006241.bin 2006MCD43A3.2007241.Albedo.bin MCD43A2.2007241.bin 2007MCD43A3.2008241.Albedo.bin MCD43A2.2008241.bin 2008MCD43A3.2009241.Albedo.bin MCD43A2.2009241.bin 2009MCD43A3.2010233.Albedo.bin MCD43A2.2010233.bin 2010MCD43A3.2011233.Albedo.bin MCD43A2.2011233.bin 2011MCD43A3.2012225.Albedo.bin MCD43A2.2012225.bin 2012
4. Mosaic (since p41r28 cover two corners of h10v04 and h09v04), Reprojection (SIN to UTM) and Resample (469.56m to 30m using NN) Via MODIS Tools-MRT plus script
5. Make the mask of clear region over the 13-year Landsat-scale-like MCD43A3 and MCD43A2 data track• Mask1: Only In terms of MCD43A2 (QA=0 or 1) and MCD43A3 ( BSA &WSA !=32767 FillValue) • Mask2: Further apply the 23-clear-day mask that used in Landsat’s landscape albedo statistics
6. Consistent trend, but a little bit lower than the generation from Landsat albedo
I. Process chain

I. Temporal plots of Landsat-scale-like MCD43A Black Sky Albedo (BSA) using Mask1
2000 2001 2002 2003 2004 2005 2006 2007 2008 2009 2010 2011 2012 20130.01
0.02
0.03
0.04
0.05
0.06
0.07
0.08
0.09
0.10
0.11
0.12
0.0E+00
2.0E+07
4.0E+07
6.0E+07
8.0E+07
1.0E+08
1.2E+08
1.4E+08
1.6E+08Cnt_dist Cnt_Undist Cnt_whole Avg_whole Avg_dist Avg_Undist Std_whole Std_dist Std_Undist
Year
Ave
rage
d L
ands
cape
Whi
te S
ky
Alb
edo
Pix
el N
umbe
r
2000 2001 2002 2003 2004 2005 2006 2007 2008 2009 2010 2011 2012 20130.04
0.05
0.06
0.07
0.08
0.09
0.10
0.11
0.12
0.0E+00
4.0E+06
8.0E+06
1.2E+07
1.6E+07
2.0E+07
2.4E+07
2.8E+07LowFire_PixCnt MediumFire_PixCnt HighFire_PixCnt NonFire_PixCnt LowFire_BSA(mod) MediumFire_BSA(mod)HighFire_BSA(mod) NonFire_BSA(mod)
Year
Ave
rage
d La
ndsc
ape
Shor
twav
e A
lbed
o of
dis
turb
ed r
egio
n
Pix
el n
umbe
r of
dis
turb
ed r
egio
n

1 2 3 4 5 6 7 8 9 10 11 12 13 14 15 16 17 18 19 20 21 22 23 24 25 26 27 28 29 300.06
0.07
0.08
0.09
0.10
0.11
0.12
0.13
0.0E+00
2.0E+06
4.0E+06
6.0E+06
8.0E+06
1.0E+07
1.2E+07
1.4E+07
1.6E+07LowFire_PixCnt MediumFire_PixCnt HighFire_PixCnt NonFire_PixCnt LowFire_BSA(mod)MediumFire_BSA(mod) HighFire_BSA(mod) NonFire_BSA(mod)
Year since disturbance
Ave
rage
d La
ndsc
ape
Shor
twav
e A
lbed
o of
dis
turb
ed re
gion
Pixe
l Num
ber o
f dis
turb
ed re
gion
I. Temporal plots of Landsat-scale-like MCD43A Black Sky Albedo (BSA) using Mask1 (Cont.)

Big jump of highFire BSA at age-28 in the temporal plots
MCD43A3-BSA (day 2012-225) MCD43A-BSA(day 2011-233) BSA difference (day2012225-2011233) Scale factor 0.001

II. Temporal plots of Landsat-scale-like MCD43A Black Sky Albedo (WSA) using Mask2
2000 2001 2002 2003 2004 2005 2006 2007 2008 2009 2010 2011 2012 20130.01
0.02
0.03
0.04
0.05
0.06
0.07
0.08
0.09
0.10
0.11
0.12
0.0E+00
2.0E+07
4.0E+07
6.0E+07
8.0E+07
1.0E+08
1.2E+08
1.4E+08
1.6E+08Cnt_dist Cnt_Undist Cnt_whole Avg_whole Avg_dist Avg_Undist Std_whole Std_dist Std_Undist
Year
Ave
rage
d L
ands
cape
Whi
te S
ky
Alb
edo
Pix
el N
umbe
r
2000 2001 2002 2003 2004 2005 2006 2007 2008 2009 2010 2011 2012 20130.04
0.05
0.06
0.07
0.08
0.09
0.10
0.11
0.12
0.0E+00
4.0E+06
8.0E+06
1.2E+07
1.6E+07
2.0E+07
2.4E+07
2.8E+07LowFire_PixCnt MediumFire_PixCnt HighFire_PixCnt NonFire_PixCnt LowFire_WSA(mod) MediumFire_WSA(mod)HighFire_WSA(mod) NonFire_WSA(mod)
Year
Ave
rage
d La
ndsc
ape
Shor
twav
e A
lbed
o of
dis
turb
ed r
egio
n
Pixe
l num
ber
of d
istu
rbed
reg
ion

II. Temporal plots of Landsat-scale-like MCD43A White Sky Albedo (WSA) using Mask2 (cont.)
Note: To avoid illumination direction effect in BSA, WSA is better for the cross comparison of trends between the generation from MODIS and Landsat
1 2 3 4 5 6 7 8 9 10 11 12 13 14 15 16 17 18 19 20 21 22 23 24 25 26 27 28 29 300.06
0.07
0.08
0.09
0.10
0.11
0.12
0.13
0.14
0.15
0.16
0.0E+00
2.0E+06
4.0E+06
6.0E+06
8.0E+06
1.0E+07
1.2E+07
1.4E+07
1.6E+07LowFire_PixCnt MediumFire_PixCnt HighFire_PixCnt NonFire_PixCnt LowFire_WSA(mod)MediumFire_WSA(mod) HighFire_WSA(mod) NonFire_WSA(mod)
Year since disturbance
Ave
rage
d La
ndsc
ape
Shor
twav
e A
lbed
o of
dis
turb
ed re
gion
Pixe
l Num
ber o
f dis
turb
ed re
gion

II. Temporal plots of Landsat-scale-like MCD43A BSA & WSA combination (WSA) using Mask2 (cont.)
2000 2001 2002 2003 2004 2005 2006 2007 2008 2009 2010 2011 20120.06
0.08
0.10
0.12
0.14
0.16
0.18
0.20
0.22 NLCD11NLCD12NLCD21NLCD22NLCD23NLCD24NLCD31NLCD41NLCD42NLCD43NLCD52NLCD71NLCD81NLCD82NLCD90NLCD95
Year
Aver
aged
land
scap
shor
twav
e BS
A fo
r eac
h un
dist
urbe
d N
LCD
cla
ss
2000 2001 2002 2003 2004 2005 2006 2007 2008 2009 2010 2011 20120.06
0.08
0.10
0.12
0.14
0.16
0.18
0.20
0.22NLCD11NLCD12NLCD21NLCD22NLCD23NLCD24NLCD31NLCD41NLCD42NLCD43NLCD52NLCD71NLCD81NLCD82NLCD90
Year
Ave
rage
d la
ndsc
ap s
hort
wav
e W
SA f
or e
ach
undi
stur
bed
NL
CD
cla
ss

II. Temporal plots of Landsat-scale-like MCD43A Black Sky Albedo (BSA) using Mask2
2000 2001 2002 2003 2004 2005 2006 2007 2008 2009 2010 2011 2012 20130.01
0.02
0.03
0.04
0.05
0.06
0.07
0.08
0.09
0.10
0.11
0.12
0.0E+00
2.0E+07
4.0E+07
6.0E+07
8.0E+07
1.0E+08
1.2E+08
1.4E+08
1.6E+08
Cnt_dist Cnt_Undist Cnt_whole Avg_whole Avg_dist Avg_Undist Std_whole Std_dist Std_Undist
Year
Ave
rage
d L
and
scap
e S
hor
twav
e B
lack
Sk
y A
lbed
o
Pix
el N
um
ber

2000 2001 2002 2003 2004 2005 2006 2007 2008 2009 2010 2011 2012 20130.05
0.06
0.07
0.08
0.09
0.10
0.11
0.12
0.13
0.0E+00
4.0E+06
8.0E+06
1.2E+07
1.6E+07
2.0E+07
2.4E+07
2.8E+07LowFire_PixCnt MediumFire_PixCnt HighFire_PixCnt NonFire_PixCnt LowFire_WSA MediumFire_WSA
HighFire_WSA NonFire_WSA LowFire_BSA MediumFire_BSA HighFire_BSA NonFire_BSA
Year
Ave
rage
d La
ndsc
ape
Shor
twav
e A
lbed
o of
dis
turb
ed re
gion
Pixe
l num
ber o
f dis
turb
ed re
gion
III. Temporal plots of Landsat-scale-like MCD43A WSA &BSA using Mask2

1 2 3 4 5 6 7 8 9 10 11 12 13 14 15 16 17 18 19 20 21 22 23 24 25 26 27 28 29 300.06
0.07
0.08
0.09
0.10
0.11
0.12
0.13
0.14
0.15
0.16
0.0E+00
2.0E+06
4.0E+06
6.0E+06
8.0E+06
1.0E+07
1.2E+07
1.4E+07
1.6E+07LowFire_PixCnt MediumFire_PixCnt HighFire_PixCnt NonFire_PixCnt LowFire_WSAMediumFire_WSA HighFire_WSA NonFire_WSA LowFire_BSA MediumFire_BSAHighFire_BSA NonFire_BSA
Year since disturbance
Ave
rage
d La
ndsc
ape
Shor
twav
e A
lbed
o of
dis
turb
ed r
egio
n
Pixe
l Num
ber
of d
istu
rbed
reg
ion
III. Temporal plots of Landsat-scale-like MCD43A WSA &BSA using Mask2 (Cont.)