landscape – lifescape a context and risk analysis
TRANSCRIPT
LANDSCAPE – LIFESCAPEA CONTEXT AND RISK ANALYSIS
For nine districts in Lombok, South Sulawesi & Sumba Island
GREEN PROSPERITY PROJECT
Hivos, Winrock International, Yayasan Rumah Energi & Village Infrastructure Angels


3 HIVOS - LLA GREEN PROSPERITY
TABLE OFCONTENTS
ACKNOWLEDGEMENTS 4
EXECUTIVE SUMMARY 5
SUMMARY OF KEY 6
SOUTH SULAWESI
General Geographic Information 8
Landscape Elements 9
Lifescape Elements 12
Community Livelihoods 15
LOMBOK
General Geographic Information 20
Landscape Elements 21
Lifescape Elements 24
Community Livelihoods 27
SUMBA
General Geographic Information 32
Landscape Elements 33
Lifescape Elements 36
Community Livelihoods 40
BENEFICIARY ASSESSMENT
Biogas 46
Micro Milling Equipment 53
School Pv Systems 55
Lanterns 58
Solar Kiosks 60
STAKEHOLDER ASSESSMENT
National Government 62
Local Governments 63
Construction Partner Organizations 64
Sumba Iconic Island Stakeholders 64
DEVELOPMENT CONTEXT AND LESSONS LEARNED
Development Context 66
Lessons Learned: Biogas 67
Lessons Learned: Solar Pv, Sumba 68
CHALLENGES, RISKS AND OPPORTUNITIES
Environmental, Social And Economic Challenges And Potential 70
Locally Challenging Conditions 71
ANNEX I: METHODOLOGY 75
ANNEX II: SEASONAL CALENDARS 77
ANNEX III: SELECT BIBLIOGRAPHY & REFERENCES 80
I
II
III
IV
V
VI
VII
4 HIVOS - LLA GREEN PROSPERITY
ACKNOWLEDGEMENTS
The research team is grateful to the many informants who gave up time to support the analysis in this study: local leaders and staff of local government departments, biogas users, farmers, school heads and teachers, and many other men and women, in all the project areas. Gavriel Langford was the technical lead on the research design and training for the field teams, which included the following full time members:
Stepanus Makambombu, Consultant researcher, led the field research team in Sumba
Dr Max M Richter, Social-cultural Anthropologist, Monash University & Australia-Indonesia Centre Energy Cluster, conducted research on Communities, Natural Resource Management and Renewable Energy in Sumba
Intan Maya Sari, Consultant social development and gender specialist undertook field research in Sumba and Lombok
Dwi Puji Lestari, Consultant specializing in Forestry, Environment and Livelihood, undertook all stages of fieldwork in Lombok, and North and East Luwu
Arni Djawa Rambadeta, Yayasan Rumah Energi staff and social and gender specialist, conducted research in Lombok and Luwu
Arina Rupa Rada, BIRU provincial coordinator and gender specialist from Yayasan Rumah Energi, conducted research in Sumba
Krishna Wijaya, Yayasan Rumah Energi staff and biogas quality inspector, conducted field research in Lombok
Sunandar, Yayasan Rumah Energi staff and biogas quality inspector, conducted fieldwork in North Luwu and East Luwu
Winrock renewable energy specialist Joni Chandra and Village Infrastructure Angels Renewable Energy Specialist Adi Lagur provided valuable advice and support for the fieldwork in Sumba.
The project teams from Hivos, Winrock International and Village Infrastructure Angels also provided valuable support and inputs during the research and contributed comments on drafts of this report.
Desk research for this study was conducted by Paul Adams, who co-wrote the report with Gavriel Langford and Dr Max M Richter. Gavriel Langford and Dr Max M Richter provided inputs at all stages of the research, from field planning to full field immersion, through to conceptualising and writing up the findings.
5 HIVOS - LLA GREEN PROSPERITY
EXECUTIVE SUMMARY
This report presents the findings of a Landscape Lifescape Analysis in the three areas of the MCA-I funded, Hivos-consortium program “Investing in Renewable Energy for Rural, Remote Communities”. The program has four primary components, implemented in three regions of Indonesia. Animal dung domestic biogas digesters will be constructed in three districts of Lombok, a follow-on from previous programs in which more than 15,000 biogas units have been installed by Hivos and its partners. Biogas digesters will also be constructed in the two selected districts of South Sulawesi (for simplicity referred to as Luwu), an area new to Hivos and its partners. All four components will be implemented across the four districts of Sumba (referred to herein as Sumba) as part of the wider “Sumba Iconic Island” program, including biogas digesters, solar photovoltaic electrification of schools including the dissemination of solar charged lanterns for school students and their families, solar powered maize and rice mills, and remote area solar charging kiosks. Two commercially-oriented service centres will also be established in Sumba to support promotion, servicing and management of retributions. All projects are market based to a greater or lesser degree, with some degree of consumer subsidies for the biogas component in particular. Field research and analysis for this LLA, supplemented and guided by a review of the extensive secondary literature–technical, program and contextual documents–concludes the following:
• Risk of negative impacts to the environment and natural capital is low. • If successfully implemented, the probability that the program will have positive impacts on the environment
and natural capital is moderate to high. • Risk of negative impacts to social and livelihood systems is low. • If successfully implemented, the probability that the program will have positive outcomes for individuals,
households and communities is high.• Successful accomplishment of construction targets may be a challenge in Luwu, where program operations
are relatively new and given that the program period is short. The geographical remoteness of rural Sumba adds a layer of complexity to the construction of high quality, physical infrastructure.
• Long term sustainability and continuity of function of built infrastructure is recognized as a critical challenge, which the proposed interventions are intended to address. The staff-intensive and time-consuming “softer” processes of building new business-oriented institutions and knowledge, overcoming negative perceptions of past technology failures, stimulating demand and fostering a willingness to pay for and maintain new technologies are a very significant task in remote, rural Sumba.
• Most of the challenges identified by this analysis have realistic and manageable solutions.• Household level data on existing expenditures indicate that potential customers of the various services and
technologies offered by the programme have the financial ability to pay, assuming the above mentioned willingness to pay challenges have been overcome. This finding is relevant also for the low-cash economy of rural Sumba.
• As potential customers and users of the various services and technologies being offered, women and children are highly likely to represent a significant proportion of the direct beneficiaries of the program. The socio-cultural lifescape in all three locations does not preclude women from accessing and benefitting from opportunities.
• Income and asset poverty will be the most typical determinant of inability to purchase, pay for and use biogas facilities and milling services. Payment for school lanterns is financially feasible even for poorer households.

6 HIVOS - LLA GREEN PROSPERITY
SUMMARY OF KEY RECOMMENDATIONS
Key recommendations developed from the landscape lifescape analysis process are presented below. The main body of the report contains a more complete series of recommendations.
Monitor uptake of biogas units in Luwu, as well as issues of competition with LPG. Consider reallocating a portion of the target to Lombok or Sumba depending on progress in the first year.
Promote smaller biogas units in rural Sumba to ensure that a wider proportion of the population has the opportunity to benefit from the technology. The assessment of prevailing livestock rearing practices and typical herd sizes of cattle and pigs, and some limitations related to water access, suggest that the promotion of smaller digester sizes than the current 4m3 digester may greatly expand the potential market for biogas in this area. This may also support reduction of costs, particularly for subsidies.
Promote biogas on the basis of the demonstrated benefits of bioslurry to address the limited financial incentive to switch from firewood to biogas. Efforts to maximize bioslurry utilization should be pursued in collaboration with the MCA-I funded GADING project, which will support intensification of bioslurry utilization through R&D, promotion of bioslurry applications, and commercialization, including in Lombok and Sumba.
Ensure that the number of technical and programmatic staff in the partner organizations is sufficient for infrastructure construction, monitoring visits, and for the “softer” aspects crucial for the successful implementation of the project.
Invest in socialization, and ensure training for all field staff so that they can provide comprehensive explanations of all the various technical, financial and service elements of interventions,
Include both primary and secondary schools in the solar charged lantern component to broaden the impact. Monitor and evaluate to determine if there are major differences in feasibility and outcomes.
Lobby government partners to secure complementary and follow-on financial support for replication and scale up of many, if not all, of the proposed interventions, significantly increasing the likelihood of sustainability. Local and national governments have proven ready to fund dissemination of biogas and solar PV technologies to support energy access, particularly in remote areas.
SOUTH SULAWESI

8 HIVOS - LLA GREEN PROSPERITY
Luwu Utara and Luwu Timur are the target districts for biogas interventions in South Sulawesi province. The two districts
straddle the north end of the Bay of Bone, which lies in the middle of the horseshoe described by Sulawesi’s South and
Southeast peninsulas. The more westerly district, Luwu Utara shares a border with West Sulawesi. Luwu Timur borders
Southeast Sulawesi to the east. A long border with Central Sulawesi runs along the mountainous interiors in the north of
both districts.
Luwu Utara and Luwu Timur are similar in size, and together cover an area of nearly 14,500 km2. The topography of the
districts ranges from flat or gently sloping lowland areas that surround roughly 100 km of coast to a mountainous interior
with elevations over 2,000 m. Luwu Timur is notable for the large lakes in the Verbeek mountain area in the east of the
district, which cover over 850 km2. These include lakes Towuti (585 km2) and Matano (246 km2), the deepest lake in
Indonesia.
Both districts have wet tropical climates with distinct rainy and dry seasons. There is variability in humidity and temperatures
in lowland and hilly areas. In the areas visited, the rainy season lasts six to seven months. Water is generally abundant. The
lowland plains are transected by rivers, which flow from the forested mountainous interiors. The biggest of Luwu Utara’s
eight large rivers is the 185 km long Baliase River. There are 14 rivers in Luwu Timur, ranging in length from 15 km to the
85 km long Kalaena River.
Luwu Utara and Luwu Timur have high levels of forest coverage, particularly in the large mountainous inland sub-districts.
Two-thirds to three-quarters of land in Luwu Utara and Luwu Timur is classified as forest area. However, a significant
amount of this has long been used for settlements or agriculture, and some is in the process of being reclassified. Up
to half of Luwu Utara and over one-third of Luwu Timur is designated as protected forest. The extensive lowland areas
around the coast are fertile and water is generally available throughout the year. Much of the agricultural land in these
areas is dedicated to irrigated rice farming and cash crops including cocoa and oil palm. The two districts are also known
for fruit production, including durian and rambutan. Luwu Timur is well known for nickel mining in the east part of the
district, which is home to the largest open pit mine in Indonesia.
Luwu Utara and Luwu Timur are divided into 12 and 13 sub-districts respectively with a total of 299 villages. The highland
sub-districts of Seko, Rambi and Limbong in the north and west of Luwu Utara and Nuha, Wasoponda and Towuti in the
east of Luwu Timur make up over half of the land area but are home to only about one-fifth of villages. In Luwu Utara,
these villages also tend to be smaller, just 500-1,000 people, compared to those in lowland areas, which may have 1,000-
2,000 residents. By contrast, villages in the sparsely populated eastern subdistricts of Luwu Timur may be quite populous,
with upwards of 2,000 people.
Masamba, the capital of Luwu Utara, sits on the trans-Sulawesi highway. This road, which connects through Luwu Timur
to Central and Southeast Sulawesi, runs up from provincial capital Makassar about 400 km to the south, contouring the
feet of the hills that encircle the fertile agricultural plains of both districts. The road trip to Makassar takes roughly ten
hours. Masamba can also be accessed by direct flight from Makassar. Malili, the capital of Luwu Timur, is about 2 hours
drive to the east.
The technical potential for biogas in terms of numbers of cattle and livestock management practices appears to lie
primarily in the flatter and more highly populated lowland areas nearer to the coast and on the border between the two
districts. These areas were identified for survey by local government and program staff. Migrant communities in these
areas (from Java, Bali, Lombok, Toraja) were identified as most highly potential, due to their strong culture to keep cattle
GENERAL GEOGRAPHIC INFORMATIONGeographic Range
South Sulawesi

9 HIVOS - LLA GREEN PROSPERITY
The areas visited for this survey lie in the crescent shaped coastal lowlands of Luwu Utara and Luwu Timur, which are
divided by the 3,000m Buyu Balease mountain. These areas were identified by local government and program staff as
having the most potential for domestic biogas, due in large part to concentrations of livestock. These areas are the most
densely populated in the two subdistricts, with around 150 people per square kilometer. Village areas can be large–100 ha
or more. Villages are typically divided into 5-8 subvillages. In the sub-village settlements visited, houses stretched along
village roads for perhaps 2-3 kilometers, surrounded by rice fields and plantation land. A typical village in these areas may
have a population of 1,500 to 2,000 people.
Access to villages in these areas is easy. Village and inter-village roads are asphalt and in good condition. Village offices
are also in good condition, with tiled floors and roofs. Chain mini-markets like Indomart can be found at village level,
and each village also has markets and roving salespeople selling vegtables and household equipment. Cooking gas is
sold in kiosks in most subvillages. There are about 1,000 mosques and around half that number of churches in Luwu
Utara and Luwu Timur. There are also a couple of hundred Hindu temples in the two districts, many located in Sukamaju,
Mappadecang, Angkona and Tomini Timur subdistricts, signalling concentrations of Balinese people.
Luwu Utara and Luwu Timur produce around 500 thousand tons of rice every year–around half of the rice harvest of
Lombok, an island with over six times their population. In Luwu Utara, 17,000 ha was given over to irrigated rice cultivation,
with an additional 11,000 ha of rainfed rice fields. Irrigated rice farming is concentrated in the coastal crescent, in Sabbang,
Baebunta, Sukamaju, Bone-Bone, Masemba and Mappedeceng. Sukamaju is the leading rice production area, producing
more than 20% of rice in the district. In Luwu Timur, about 24 thousand hectares is used for rice cultivation, over 90%
of it in irrigated fields. The vast majority rice cultivation takes place on the coastal crescent from Angkona to the border
with Luwu Utara. Burau and Wotu are the most productive rice growing areas in the district. There are currently efforts by
local government to expand the agricultural area under rice production, at least in Luwu Utara. In one settlement visited,
plantation area had been converted to rice fields.
Corn is also an important food crop in Luwu Utara. It is cultivated in most major rice producing areas, and is also intensively
farmed in the southerly subdistricts Malangke and Malangke Barat, which have limited irrigated rice land. There is some
limited production of cassava and sweet potato across both districts.
Both districts are known for fruit, together producing about 30 thousand tons of durian and nearly 10 thousand tons of
rambutan annually, as well as substantial quantities of duku and bananas, particularly in Luwu Timur. Horticulture activities
are limited. In Luwu Utara, perhaps two thousand hectares are used for the cultivation of crops such as chilli, cabbage,
spinach, tomatos, beans and eggplant, over half of it in Baebunta and Sukamaju. In Luwu Timur, horticulture activities are
scattered and much less developed.
Oil palm and cocoa are key cash crops, with around 90 thousand hectares used for their cultivation, mainly in the lowlands.
Cocoa is the favored crop, and two to three times as much land is given over to cocoa than to oil palm. Major cocoa
producing areas include Sabbang, Baebunta and Malangke in Luwu Utara, and Burau, Wasoponda and Tomini in Luwu
LANDSCAPE ELEMENTS
District AreaPopulation(BPS 2013/4)
PopulationDensity
#Villages
Luwu Utara 7,503 Km2 299,989 40 172
Luwu Timur 6,945 Km2 286,901 41 127
TOTAL 14,447 Km2 586,890 41 299
Structure and Function
Settlements
Agriculture

10 HIVOS - LLA GREEN PROSPERITY
Timur. Coconut is grown on farms across both districts. Pepper is cultivated in relatively small areas in many subdistricts,
and intensively in Towuti in the east of Luwu Timur, where over 3,000 ha is used for pepper. Its cultivation is reportedly
increasingly seen as a commercially promising opportunity by government and farmers in the area.
Cattle are present throughout Luwu Utara and Luwu Timur. Luwu Utara is home to about 25,000 cows, about twice as
many as its neighbor. Based on recent district figures, about 80% of these are concentrated in just 5 subdistricts from
Baebunta to the eastern border with Luwu Timur, particularly in Bone-Bone (7,356), Sukamaju (5,504) and Mappadecang.
These were the three subdistricts visited for this survey. By contrast, in the western coastal crescent of Luwu Timur
from Angkona to the west, where most cattle farming occurs, there are only around 10,000 cows distributed across six
subdistricts. Luwu Utara has quite large numbers of buffalo (13,323), mainly in areas with relatively few cows.
Luwu Utara in particular has a significant amount of grassland/pasture–around 18,000 ha–but in both districts grazing
is only widely available in the more mountainous areas. In the lowland survey locations, most households had stables
behind the house that were used day and night, with dung piled up behind the yard. An informant from the district ESDM
office noted that, in contrast to the transmigrant settlements visited, Luwu and Buginese tend to release animals to graze.
This is more likely to occur in areas with lower density of cattle that have more access to grazing. Cattle holdings in the
survey areas typically ranged from 2-5 cows, with poorer households managing 1-3 cows on behalf of richer villagers
under the so-called ‘ngadas’ profit sharing system.
In addition to cattle, there are fairly large numbers of pigs in the main lowland cattle farming areas. Luwu Utara has over
30,000 pigs, seventy percent of them in Sukamaju, Bone-Bone and Mappadecang subdistricts; most of these are farmed
by Balinese or Torajan settlers who are concentrated in these areas. In addition, there are around 14,500 pigs in Luwu
Timur, three quarters of which are concentrated in the small strip running from Mangkutana through Tomini Timur to
Wotu subdistrict. Pigs are generally stabled in the yard. Goats are present in smaller numbers throughout the two districts.
Meandering rivers cover the fertile lowland areas of Luwu Utara and Luwu Timur, feeding extensive irrigated rice production
in the coastal subdistricts. Flooding reportedly sometimes occurs at times of heavy rains, but was not generally noted as
a problem by informants. Rivers are used for fishing and in some places sand mining, and also for washing clothes and
bathing. During the survey it was observed that irrigation canals were also used for washing dishes and for defecation.
Rubbish was also thrown into rivers. The main source of water for household purposes is piped water from PDAM and
water from wells, which is used for drinking.
Around 350,000 ha of land in each district are designated as protected forest or conservation area, with an additional
125,000 ha to 150,000 in Luwu Utara and Luwu Timur categorized as productive forest. Most forestry land is located in
highland areas. In Luwu Utara at least, some designated forestry area has long been used for agriculture and settlement,
and is in the process of being reclassified. There is reportedly little sign of forest encroachment for plantation in the
surveyed districts. Luwuan people in particular are reported to live closer to forested areas utilize forest products, including
timber, rattan, bamboo and honey.
Mining and quarrying absorb an estimated 10-15% of the working population of Luwu Timur. Mining activities are
concentrated in the east of Luwu Timur, in particular around Sorowako, where the nickel mine under the management of
PT Vale is Indonesia’s largest open pit mine.
Animal Husbandry
Natural Capital
South Sulawesi

11 HIVOS - LLA GREEN PROSPERITY
The analysis of value placed on the local environment and its functions is necessarily impressionistic. Overall, survey
informants appeared to attach little cultural or customary value to their environment and natural resources, perhaps
because most were first or second generation transmigrant settlers from elsewhere. Some disregard for the living
and natural environment was evident in day-to-day life. Rivers and irrigation streams were observed being used for a
variety of purposes: bathing, washing clothes and dishes, throwing rubbish, washing vegtables, defecating, and cleaning
pesticide tanks. Disposal of animal waste in rivers–in particular from pigs–has reportedly also sometimes been a trigger
for conflict between communities (ICG, 2003). Farmers also seemed to take a somewhat passive approach to irrigation
management, and some informants expressed the opinion that managing and fixing irrigation canals was the responsibility
of government, not farmers.
In general, people in Luwu appeared to value land for its economic potential but with limited regard to sustainability. As
a previous LLA survey in the area also noted, use of fertilizer and pesticide appeared to be high for all types of crops. For
example, a crop of water spinach that takes 20 days to grow may be sprayed twice for pests. There appears to be limited
use of manure as fertilizer, despite its widespread availability. In almost every village visited, men and women claimed
that soils were less fertile than twenty or thirty years ago, and noted that production is now highly dependent on fertilizer
application. The head of the local energy and mining agency concurred with this view.
Values

12 HIVOS - LLA GREEN PROSPERITY
A long history of settlement, transmigration, internal displacement, and spontaneous in-migration has shaped the
demography of Luwu Utara and Luwu Timur. The two districts were the base of South Sulawesi’s oldest Bugis kingdom,
which incorporated peoples from Toraja to Mamuju and Kendari, resulting in a present day mix of twelve ethnic groups
and nine dialects in the area. Today ‘Luwuans’ include Bugis, To’ala and Rongkong who number among the main ‘native’
inhabitants of the lowland areas; Bugis settlers from elsewhere are not regarded as Luwuan. With the exception of the
Rongkong, the majority of Luwuans are Muslim. Torajans are also not considered Luwuan, in part because of their Christian
religion.
Most settlements visited were established by transmigrants. Transmigration first took place with the Dutch relocation of
25,000 Javanese to the area between 1938-41. Families interviewed in Muktisari and Tulungsari villages in Luwu Utara
dated their presence back to this time. In the early 70s, the Suharto government resettled a further 25,000 people from
Java, Bali, Lombok and NTT. Many settlements were established in Sukamaju, Bone-Bone, Mangkutana and Tomini on
the present day borders of the two districts. In the wake of this program, some local leaders supported the relocation of
highlanders in a bid to secure local land ownership of the plains. Others sold land, including to Bugis and Torajan migrants.
The pioneering of cocoa in the 1980s started a “Bugis and Toraja invasion,” an influx of outsiders that was exacerbated
by the ‘brown gold’ boom in the 1990s. By 1999, over one-third of Luwu Utara’s population were transmigrants and
spontaneous economic migrants. Internal migration has also shaped the lowland population, and many Rongkong people
were moved down to the (then) forested plains from Baebunta to Sabbang during the Darul Islam rebellion in the 1950s.
The result is a complex patchwork of ethnicities and religions. Relations between residents have not always been
harmonious, and the late nineties and early 2000s saw conflicts that caused deaths and property damage, including in
Baebunta, Sabbang and West Malangke in Luwu Utara. Although conflicts were sometimes cast as inter-ethnic or inter-
religious, land disputes with settlers were a major factor, and particularly affected economic in-migrants and Rongkong
people who lacked formal title. Economic jealousy was also an important factor, as Luwuans found themselves being
outpaced by settlers with larger holdings and better farming techniques. Transmigrants were also more successful in
farming cocoa and rice, but since land ownership in their settlements was clearer, these areas were little affected. Although
it remains of some concern to district authorities, conflict has not recurred at scale since the administrative division of
Luwu into four districts in 2003. However, informants did note some tensions around land acquisition by economically
successful people, often of transmigrant descent, and some villages apparently implement moratoria on excessive land
acquisition for this reason.
Reflecting this diversity, the populations of the villages visited were very heterogeneous. However, subvillage (dusun)
populations were much more homogenous. These settlements were typically defined by the presence of one majority
group: Luwu, Bugis, Jawa, Bali, Toraja or Lombok, who generally had just one shared place of worship. Transmigrants
continue to use their native language in their day-to-day lives. Bonds of mutual assistance between neighbors were
also said to be strong, including for community events and building places of worship. Despite the relative segregation
of settlements, informants also noted that different ethnic and religious groups are linked through economic activities,
including through relations of credit and wage labor.
Village populations appear to be relatively stable. There is some seasonal migration within the project area, as large
numbers of poorer people–mainly men–seek work as agricultural or construction laborers in nearby plantations or
projects following the harvest, for periods of up to three months in one year. During this time, women tend to stay in the
village, where they take care of children and livestock and seek labor opportunities. Many informants appeared to perceive
farming as an insecure or less desirable means of livelihood. Nevertheless, most young people lack other opportunities
and remain in their village to assist their parents. Those with higher levels of education appear keen to become civil
servants or seek commercial work if possible.
Culture and Social Life
LIFESCAPE ELEMENTSSocioeconomic Conditions
South Sulawesi

13 HIVOS - LLA GREEN PROSPERITY
General Status
Luwu Utara and Luwu Timur are the exception among the project districts in having reasonably good indicators for
human development. In the 2014 Human Development Index (HDI), indicators for life expectancy (67-69.5), expected
years of schooling for children (12 years) and adult mean years of schooling (7-8 years) more or less mirrored national
figures. Meanwhile, annual per capita expenditures in Luwu Utara and Luwu Timur are IDR 700,000–2 million greater than
the national average of IDR 9.9 million.
Poverty figures also more or less mirror national trends. Based on a 2011 household consumption survey, about 30% of
the population are in wealth deciles 1-3. BPS figures for 2010 show that poverty rates are a bit higher in Luwu Utara, where
16.2% of the population are poor, compared to Luwu Timur, with just 9.2%. Poverty levels in these target areas are around
one-half to one-third of those in the other project districts.
Food insecurity is not a major problem. The 2015 Food Security and Vulnerability Atlas classed Luwu Utara and Luwu
Timur as Priority 5 and 6 respectively–‘less vulnerable or food secure’. Village leaders noted that even the poorest people
in the district are able to access sufficient food throughout the year.
Table 1.3.1. 2014 Human Development Index Luwu Utara & Luwu Timur
Vulnerable Groups
The survey did not identify any clear ethnic or religious markers of vulnerability, nor was there any apparent vulnerability
related to ‘indigenous’ populations, albeit that in Luwu ‘natives’ are said not to thrive as much off agriculture as
transmigrants or other settlers. There are naturally specific vulnerable groups such as physically or mentally disabled
people, or vulnerable elderly people in all project districts, however the survey brings no insights in this respect.
Compared to Lombok and Sumba, gender relations among informants in Luwu Utara and Luwu Timur are regarded
as relatively more equal. Women move around quite freely both within villages and to local towns. Important asssets
including land are more often regarded as owned at least equally with wives, though land certificates are generally in
the name of men. While some informants report that inheritances are divided roughly equally, it is likely that men are
somewhat favored.
Women are well represented in civil service jobs, for example making up 65% of the Luwu Timur government workforce;
Luwu Utara also has a female Bupati. Women are also active at village level in the administration of family planning or
healthcare services, though they are heavily outnumbered in leadership positions. They also play a restricted role in public
decision-making at this level. By default, men represent the household for any invitation unless it is specified that women
should come, and even when attending meetings meetings women may play a limited role except perhaps in helping
with logistics.
AREALIFEEXPECTANCY
EXPECTED YRS SCHOOL (5 Y.O.)
MEAN YRS SCHOOL (25+)
PER CAPITA SPENDING(MILLIONS)
HDI SCORE
Luwu Timur 69.44 11.95 7.80 11.859 69.75
Luwu Utara 67.00 12.09 7.19 10.605 66.90
INDONESIA 70.59 12.39 7.73 9.903 68.90
Women’s and Men’s Roles

14 HIVOS - LLA GREEN PROSPERITY
Domestic work, including cooking, cleaning, and childcare, is the preserve of women. Informants noted that men play
next to no part in childcare. Women tend to remain in the village to attend to domestic tasks and manage livestock if
their husbands leave to seek seasonal work. It is also a woman’s job to manage household cash for the purchase of food
items, clothing and household equipment, and provide spending money for their husbands. Major decisions, including
expenditures on luxury goods, buying land, taking credit, purchase of motorcycles or handphones and payments for
health and education are usually taken together. In general, expenditures on household and education take priority, while
agricultural inputs will be procured only once these needs have been met.
Women are involved in most agricultural activities, including planting, harvesting, post-harvesting, marketing, though
men are responsible for forming terraces, ploughing and pesticide application. Harvesting oil palm is also work for men.
Men are generally responsible for buying agricultural inputs and selling larger quantities of crops, though women are
often consulted. Women play a role in managing cattle, in particular in gathering fodder, however men play a greater
role in managing cows and are generally responsible for mucking out the stable. Conversely, women are responsible
for managing pigs, in areas where they are kept. In some farming households, women may conduct petty trading to
supplement household income. For agricultural labor, women report that they are paid the same as men: IDR 60,000-
70,000, including food, for a full day of work.
South Sulawesi

15 HIVOS - LLA GREEN PROSPERITY
Community Livelihoods
Land size, livestock, and human capital are the primary determinants of household wealth in the areas of Luwu included
in this study. This is summarized in the table below, which shows the wealth group analysis conducted with informants in
these areas. There are clear trends by wealth group, with better off and rich households having multiple income sources,
each of them more lucrative than any single source for poorer households. Wealth group 1 refers to those households
at the lowest end of the socioeconomic spectrum, often referred to as 'miskin' (poor). They are predominantly landless
laborers. Wealth group 2 and wealth group 3 are increasingly better off (lower and upper middle) and can generally be
classified as small and medium farmers. Wealth group 4 are locally considered 'kaya' (rich).
Table 1.4.1: Luwu Utara and Luwu Timur Wealth Group breakdown
*) Cash incomes are estimated. Annual household expenditure was calculated based on actual expenditures in the 12 month period May 2015 to April 2016. It is assumed that households essentially earn as much as they spend, in the absence of savings, which were not reported as common.
Land sizes were historically more evenly distributed when the majority of the non-Luwu population began to settle
the area in the early-mid 20th century. Factors such as selling and mortgaging of land, as well as inter-generational
inheritance, have resulted in increasingly smaller land sizes. Associated directly with land size is the ability to raise and
earn profit from livestock, which is significant in the area. Finally, these factors have likely led to variations in employment
opportunities that typically go to better educated, more connected and better off families (i.e. those that have done well
from agriculture and livestock rearing decades past). Balinese families, well known in Luwu for their hard work ethic,
strong community/customary bonds, larger land sizes and diversified farming interests tend to be in the upper parts of
the wealth spectrum in the villages where they are present.
Land is of two main varieties–irrigated rice fields and non-irrigated fields (kebun), which are used to produce non-rice
crops such as cocoa, palm oil, vegetables, maize, etc. Irrigated land is typically cultivated with rice twice in a year (2 x four
months). For the third cultivation season, land is cultivated with a legume crop, or alternatively left fallow and grazed with
cattle. Padi rice is cultivated with machine tools such as tillers and hand tractors, as well as chemical inputs including
intensive use of fertiliser. Manure is used by some farmers, in particular by those who own sufficient numbers of cattle
and whose lands are located nearby to the cattle stable (not the majority of the population). Households from wealth
groups 3 and 4 cultivate rice crops sufficient to meet a full year of food needs as well as sale of surpluses. Wealth group 2
households report producing sufficient rice for 6 months of their food needs. Cocoa and palm oil are rainfed crops that
rely on intensive use of inputs. The area is very much cash-based with essentially all payments for inputs and labor made
in cash.
Wealth Group 1 Wealth Group 2 Wealth Group 3 Wealth Group 4
Landless 0.25 - 1 Ha 1 - 2 Ha > 2 Ha
No cultivation(some sharecropping)
rice, vegetables, maize, cocoa, coconut
rice, vegetables, palm oil, cocoa, coconut
rice, palm oil, vegetables
1-3 shared cattle(bagi hasil)
1-3 shared cattle(bagi hasil)
3-5 cattle(owned)
Provide 5-15 shared cattle to poorer HHs
Primary source of cash
Laboring
Primary sources of cash
Laboring, petty trading (mobile vegetable sales),crop saleslivestock sales
Primary sources of cash
Crop & vegetable sales,crop buying (village level), livestock sales, skilled jobs (e.g. palm oil plantations, govt workers, trades)
Primary sources of cash
Large trade of agricultural commodities incl. cloves, cocoa & pepper, some have businesses,skilled jobs (e.g. palm oil plantations, local govt members, mining companies)
Estimated cash income* ~ 20 million per year
Estimated cash income*~ 30-35 million per year
Estimated cash income*~ 55 million per year
No information
Major Sources of Livelihoods

16 HIVOS - LLA GREEN PROSPERITY
Cattle and pigs are usually stabled nearby homes, being more typically (but not exclusively) kept by “transmigrants” from
Bali, Java, Toraja and Lombok. Ethnic Bugis and Luwu people tend to free-graze livestock, and in some cases have a
preference for goats over cattle. 'Cattle fattening' (i.e. buy young-fatten-sell-buy again) is of as equal importance as 'cattle'
breeding (herd development by insemination of female) as a livelihood system in the Luwu area. There is a regular and
normal rotation of animals through the stable. Respondents stated that it is rare for the stable to be totally empty for more
than a few months (if at all). Men conduct most cattle rearing tasks, including collecting grass twice a day, watering and
cleaning the stable. Women and children sometimes assist in these tasks. Men are the primary decision makers when it
comes to sales and purchases. Pigs, which are raised by ethnic Balinese and Toraja, tend to be managed by women. Most
households raise chicken and ducks; the size of holdings increases by wealth group.
Poorer households rely heavily on selling labor to better off households within their village as well as externally. This is
mostly for agricultural and plantation work. Males of some poorer households supplement labor incomes with collection
and sale of forest products (rattan, bamboo, etc) and sale of handicrafts. These households are the most reliant on forest
resources, especially the poor of ethnic Luwu communities. Poorer households tend not to own livestock in Luwu, rather
they rear on behalf of better off households, taking a share in the profit upon sale (or calves are shared if female cows
are reared). These households purchase all of their food needs through all seasons of the year. For them, October to
December are the most difficult months due to shortages in labor opportunities coinciding with the onset of the rainy
season.
The graphic below summarises the total annual expenditure for the three wealth groups. Information covers the twelve-
month period from May 2015 to April 2016.
Figure 1.4.1: Annual expenditure patterns by wealth group, Luwu Utara and Luwu Timur
The expenditure categories in the legend are:
• Primary foods - rice, noodles, wheat flour, noodles, fresh and dried fish, meat (mostly chicken), tofu, tempe,
eggs, fruits and vegetables.
• Secondary foods - cooking condiments, salt, oil, sugar, coffee, tea, snacks.
• Personal hygiene - soap, detergent, washing powder, teeth hygiene, women’s hygiene products, razors.
• Fuel, lighting, water - LPG, firewood, kerosene, electricity, gasoline, water.
• Agricultural production costs - seeds, fertilizer, pesticides, ploughing, etc.
• Other production costs - fodder, livestock vaccinations, etc.
• Education - uniforms, books, fees.
• Health - doctor’s fees, medicines, informal cures.
• Miscellaneous - festivals, phone credit, cigarettes, betel, school snacks (pocket money),
non-essential beauty products, etc.
Fuel, Lighting, and Water
Annual Expenditure Patterns - Luwu
Expenditure Analysis by Wealth Group
Primary Foods
Agric Production Costs
Other Production Costs
Education Health Miscellaneous
Secondary Foods Personal Hygiene
South Sulawesi

17 HIVOS - LLA GREEN PROSPERITY
The majority of households have a mobile phone and a motorbike, with increasing number and quality by wealth group.
Wealth group 4 households have 4-wheel vehicles including family cars and utility vehicles used for productive purposes.
All households access and use LPG for cooking, however for poorer households this is only to supplement the use of
firewood, which is more dominant. Firewood is often used for preparation of meals in the afternoon when there is more
time, as well as for boiling of water and preparation of larger meals. LPG canisters are available for sale at the sub-village
level in most locations, with some shortages experienced around the time of major religious festivals. Poorer households
typically purchase 1 to 2 canisters per month, to supplement firewood, while better off households purchase 3 to 4
canisters per month. Firewood is usually collected from fields and plantation areas, rather than from forests. It is not
typically a stand-alone activity, rather it is done on-the-go while completing other tasks. Women do more of this task
than men and children.
All wealth groups access PLN for their lighting and electricity needs. Water is available at all times of year for all wealth
groups. Education achievement is relatively good by rural Indonesian standards, with even some poorer households
achieving graduation at secondary level. Better off (wealth group 4) households send their children to universities in
distant locations such as Makassar.
Households of wealth groups 3 and 4 report a willingness and ability to enter commercial opportunities that include an
element of financial risk, including accessing of credit. Wealth group 3 households interviewed for this research indicated
an interest in biogas technology if there is financial support (the term “bantuan” was used implying a preference for free
handouts). Wealth group 2 households instead stated an interest in the technology if the bioslurry is truly beneficial for
their cultivation.
South Sulawesi


LOMBOK

20 HIVOS - LLA GREEN PROSPERITY
Lombok is the second largest island in Nusa Tenggara Barat province, with a total area of 4,677 km2. It is situated about 40
km to the east of Bali, and is only about 10 km west of its closest neighbor Sumbawa. The target districts on Lombok are
Lombok Timur, Lombok Tengah and Lombok Utara, which make up 77% of the area of Lombok, excluding Lombok Barat
district and provincial capital Mataram.
The topography of Lombok ranges from flat and gently sloped lowland areas with an elevation of 0-250 m, where irrigated
paddy fields are mostly found, to mountains in the north of the island. The 3,726 m high Mount Rinjani in Lombok Utara
district dominates the island, and the forested Rinjani area takes up about one-third of Lombok’s total area. To its south,
the slopes drop to fertile alluvial plains in the centre and east of the island. Further south towards the coast, conditions in
Lombok Tengah and Lombok Timur are drier, and the landscape is dominated by barren scrub covered hills.
Figure 2.1.1. Satellite map of Lombok Island
In general, Lombok is drier than Luwu and has greater challenges for water access. Seasonal calendars developed with
informants in each district show that it has five to six months of rain and a dry season that runs from May or June to
November. There is variability in rainfall across the island, and the southern part is more arid with less rainfall. All districts
are heavily dependent on water from the Rinjani area, which feeds rivers and irrigation canals. There are periodic water
shortages in the late dry season, particularly in El Nino years. Around one-third of the island’s rivers are vulnerable to heavy
or flash floods during the rainy season.
The flat and gently sloping plains in the centre and east of Lombok are highly cultivated, with large areas given over
to irrigated rice cultivation, which is also to be found on the northeast coastal strip of Lombok Utara. The highlands of
northern Lombok, which dominate Lombok Utara and the northern parts of Lombok Timur and Lombok Tengah, are
mainly forest clad and much less developed. Dryland farming in more sloping areas with less water access in the three
districts includes staples such as maize and singkong, horticulture, and cash crops including cashew, cocoa, coffee and
clove.
Lombok is home to nearly 3.5 million people, and the three target districts have a combined population of around 2.25
million: 57,766 in Lombok Utara, 269,882 in Lombok Tengah and 338,549 in Lombok Timur. The project area includes 426
villages and 37 subdistricts. On average, villages in Lombok Tengah and Lombok Utara have a population of about 6,500.
Villages in Lombok Timur are generally smaller, with an average of 4,500 residents.
Lombok is easy to reach through the large international airport located in Praya in Lombok Tengah. The main road network
in Lombok is in good condition. Road access to and within villages is also generally good, with the exception of some
areas visited in the north and south of the island where some roads are not paved and in poor condition.
GENERAL GEOGRAPHIC INFORMATIONGeographic Range
Lombok

21 HIVOS - LLA GREEN PROSPERITY
LANDSCAPE ELEMENTS
District AreaPopulation(BPS 2013/4)
PopulationDensity
#Villages
Lombok Utara 810 Km2 210,133 260 33
Lombok Timur 1,606 Km2 1,153,773 719 254
Lombok Tengah 1,208 Km2 903,432 748 139
TOTAL 3,623 Km2 2,267,338 626 426
Structure and Function
Settlements
Most lowland areas in the target districts, in particular in the central and eastern parts of Lombok, are covered with
densely populated contiguous village settlements surrounded by wet paddy fields. These contrast with the more scattered
settlements, dryland farms and plantations in elevated ‘mid-land’ and upland areas around the mountains in the north.
Lombok Tengah and Lombok Timur have high population densities, averaging 731 people per square kilometer. Lombok
Utara is comparatively lightly populated, with 260 people/km2, though it is still more densely populated than any other
project district. Village area is much smaller than in Luwu or Sumba, however the population of one village may be as
many as 6,000 or more.
Villages and sub-villages have generally good access by road. These are mostly asphalt, with the exception of some
villages visited in Lombok Utara and in the south of Lombok Tengah. Mini-market chain stores are easily accessible on
main roads to local towns. Each village usually hosts a small market and roving vegtable sellers are present in many dusun.
Kiosks in most sub-villages sell necessities including bottled gas. Village offices are generally solidly constructed with
cement walls and good access to health facilities (puskesmas). Known as the, “land of 1,000 mosques,” mosque building
and renovation is visable across the island, and Lombok is now home to over 2,500 mosques–four to every village in the
island (Klock, 2008).
Lombok is one of Indonesia’s main rice producing areas, with an annual production of nearly one million tons in 2014.
Around 85% of rice production area is irrigated paddy; the remainder is dry-seeded in rain fed fields, which are succession
planted with secondary crops, including corn and soy. The fertile lowlands of Lombok Tengah and Lombok Timur are the
rice basket of the island, accounting for over three quarters of production. Rainfed rice farming is concentrated in these
areas in the centre and south of the island, though it was also present in one of three villages visited in Lombok Utara.
Only 7% of Lombok’s rice crop is produced in Lombok Utara, where some paddy is found in lowland areas around the
north coast.
In more upland areas in the north part of Lombok with less water availability, the main staples include maize and singkong.
Cash crops include cashew, cocoa, coffee, clove and tobacco. Plantation crops are a very significant source of livelihood.
The production of Virginia tobacco for sale to large cigarette companies is concentrated in the southeast of the island
from Janapria and Praya Timur in Lombok Tengah across to the east coast and down to Jerowaru on the southeast tip.
Coconut trees are cultivated across the island.
Horticulture is an important source of income in some parts of Lombok Timur, in particular in Sembalun, Wanasaba, Aikmel
and Sambelia in the north. Crops include shallots, garlic, chilli, tomatoes and cabbage. It is also found to a lesser extent
in the centre and east of the district. Labuan Haji and Selong districts on the east coast are notable for chilli cultivation.
Agriculture
Lombok

22 HIVOS - LLA GREEN PROSPERITY
Cattle are found throughout Lombok and play an important role in the livelihoods of the island’s farmers. The target
districts have a recorded total of about 362,500 mainly Bali cows, and less than one-tenth that number of buffalo (2013/14).
The highest rates of cow ownership are in the more sparsely populated Lombok Utara, where there is one cow for every
2.5 people, followed by Lombok Tengah and Lombok Timur, where the ratio is one-quarter of that in Lombok Utara.
However, Lombok Tengah has 157,000 cows, nearly twice as many as in Lombok Utara. Holdings in Lombok Tengah and
Lombok Timur districts appear to have doubled since 2008 under a determined NTB government drive to increase cattle
farming. The districts also have 224,338 goats or (to a small extent) sheep – though numbers vary significantly between
subdistricts.
Cattle holdings per household have reportedly declined in recent decades, due to reduction in the size and carrying
capacity of grazing land as a result of population increase, over grazing and agricultural conversion. Most livestock is
raised using the cut-and-carry system. The exception is for farmers in the northeastern savannahs of the more sparsely
populated Rinjani ecosystem, which support grazing. Limited land availability is regarded as a major constraint for
development of the sector. (Sutaryono et al, 2012)
Most cattle in Lombok is stabled. This was the case in all villages visited, where lack of grazing meant that stables were used
day and night. Due to pressure of space in more densely populated areas, stables–even toilets–were not uncommonly
located in front of the house. The survey identified that average cattle holdings appear to be in the range of 2-4 cattle,
and farmers in lower wealth groups often manage 1-3 cows on behalf of the owners in the so-called ‘ngadas’ profit-
sharing system, which was also found in Luwu. Communal housing in stables of 100-1000 m2 is not uncommon, to
defend against thieves; this occurs particularly in Lombok Tengah, where some areas are well known–and even pride
themselves–for cattle rustling. Here, communal stabling was observed in one of three villages. In such arrangements,
farmers feed and manage their animals, but collaborate on security and cleaning. (see ACIAR, 2010; Dahlauddin et al,
2005).
Although most villages visited were not located in forestry area, all target districts depend heavily on the Rinjani forest
ecosystem. This area includes the 45,000 ha Rinjani National Park and 85,000 ha of protected forest, on which three of
the island’s four main watersheds depend. These are a critical resource for irrigation, drinking water and industry in all
project districts. However, deforestation is a major issue, and has been recognized in recent national development plans.
About 600,000 people live on the south slopes of the Rinjani area where the largest watershed is located, many of them
poor and landless farmers who depend on the forest for their livelihoods. Here, roughly 17% of forest was converted to
plantation between 1995-2010, and the government considers 40% of forest to be in critical or very critical condition.
(Suhartanto et al., 2012)
Lombok has 33 major rivers, 90% of which start in the Rinjani area. Intensive rice agriculture has shaped Lombok’s rivers,
and most have been diverted or dammed to support irrigation (Monk 1997). Floods are a routine occurance in about two
thirds of rivers in wet season, and the Watershed Management Agency has categorized ten as being at risk of heavy or
flash floods (2010). Floods have been exacerbated by erosion and sedmention due to forest degradation, and by heavier
rains in the wet season. Lombok is also prone to droughts around the end of the dry season, when an increasing numbers
of rivers and canals run dry, particularly in the more frequent El Nino years. Lombok Tengah is one of the most affected
areas. Residents in two villages visited in Lombok Utara and Lombok Tengah complained of water shortages between May
and December, which they seek to alleviate by trapping rain, buying water, or drilling wells. A Ministry of Environment and
GIZ study on Lombok’s watersheds under different climate change scenarios predicts a long-term decline in water supply,
which will have significant negative consequences for water security and agricultural productivity.
Animal Husbandry
Natural Capital
Lombok
23 HIVOS - LLA GREEN PROSPERITY
Values
There are reported to be quite long traditions of natural resource management including among Sasak and Balinese
people in Lombok. The Balinese brought a modified form of the well-known subak rice irrigation system to Lombok.
Water is important for ritual use, and is a key factor in the siting of mosques and temples; its importance to livelihoods
is sometimes recognized in religious or folk rituals. Koch (2008) also notes that Muslims and Hindus on the island have
numerous traditions of protecting forests and planting trees. Nevertheless, concern for the natural or living envirnment
was not strongly reflected in communities surveyed. Informants confessed to dumping manure in ditches or rivers. As
in Luwu, the survey suggests that farmers have relatively limited concern for improving soil condition, and tend to rely
heavily on chemical fertilizer and pesticide. However, more than in Luwu, informants report spreading manure on fields if
they are sufficiently close to the home. In terms of wider issues for the natural environment, forest encroachment in the
Rinjani area is also reported to be a significant threat to the ecological function of the area. Sand mining is also a common
enough occupation in Lombok, and can have significant negative effects for the environment.
Lombok

24 HIVOS - LLA GREEN PROSPERITY
Over 90% of Lombok’s 2.9 million inhabitants are ethnic Sasak Muslims, including a small minority of those practicing an
unorthodox old local version of the faith located around Tanjung and Bayan in Lombok Utara. Religious minorities include
60,000 Balinese Hindus, mainly in the west and central lowlands, and 20,000 Sasak animist-Buddists, living mainly in the
north on the slopes of Rinjani. Islam is a strong part of the identity for most of Lombok’s inhabitants, and taking the haj
pilgrimmage is an important marker of social status. Remnants of a former caste system, transformed by Islam, continue
to be important in determining marriage. (Smith 2014) Religious leaders and mass organizations play a key role in politics
on the island and the province at large.
In general, informants noted the strong communal bonds that exist in villages, including practices of mutual assistance
and loan making between neighbors, and donations for community events. However, loan sharks and market middlemen
are also a common feature of rural life, and one survey found as many as 20% of farmers were in debt to rentenir
moneylenders. (Montgomery 2010) Lombok is also known for its thief networks, involved in cattle rustling and robberies,
and for its vigilante groups, which have recruited many jobless young men and play an active role in local elections up to
the present day (Macdougall, 2007; Jaffrey et al, 2016). Land conflicts are not uncommon, including in tourist spots and
in the Rinjani forest area, where there have been conflicts over maintainance of utilization of waterways, and between
communities, government and business interests over ownership and use of forest. (Astawa, 2004)
High levels of landlessness and poverty have led to significant outmigration from villages for overseas work or seasonal
labor opportunities in other villages or in nearby islands. Many young people also seek service jobs in Mataram or in tourist
areas in Lombok. Seasonal labor is an important source of income for poorer families. Locally, some labor opportunities
exist in sand mining, brick making, and construction. Men may also stay in other villages for one month at a time to
plant or harvest rice, or pick cloves, or form small work parties to seek seasonal work in nearby Bali. Lombok is a fertile
recruiting ground for overseas workers, with a well-established network of agents and recruiters down to the village level.
Documented and irregular migration–mainly of young men, most often to Malaysia–are important income sources. In
2006-09, remittances amounted to perhaps 5% of GDRP in Lombok districts. (Bachtiar 2011) Migration is also an important
resort for farmers in the face of crop failure. Remittances are reported to average at around IDR 3 million, typically sent
every two to four months. (IOM 2010) In FGDs with migrant worker families in Lombok in 2010, all stated that overseas
migration had enabled the family to improve their welfare, send the children to school, renovate their home, acquire a
farmland, and start a small business.
While it is economically beneficial, the result of male migration is a high prevalence of female-headed households–
the so-called Malaysia widows (Jamal: Janda Malaysia) and orphans. (Beazley, 2007) Informants noted that male out-
migration leads to unstable cattle ownership, as the family normally sell all their cattle in order to provide funds for the
husband, and because the wife will not be able to take care of the cattle by herself. Migration also contributes to high
divorce rates on the island. (Smith 2014)
General Status
The target districts in Lombok perform comparatively poorly in relation to key human development indicators, particularly
Lombok Utara, which ranks in the bottom three project districts based on the 2014 HDI. Annual per capita expenditures
range from IDR 7.6 millon in Lombok Utara to IDR 8.7 million in Lombok Tengah, well below the national average of nearly
IDR 10 million. Average years of schooling for over-25s is very low in all districts, particularly in Lombok Utara, where it is
just under five years.
Culture and Social Life
Human Development
LIFESCAPE ELEMENTSSocioeconomic Conditions
Lombok

25 HIVOS - LLA GREEN PROSPERITY
Based on BPS 2010 figures, there are around half a million poor people in the three project districts. The least populous
district, Lombok Utara, has the highest level of poverty–over 40%–about twice the poverty rate in the other two districts.
Over the past decade, Lombok has made significant progress on alleviating chronic food insecurity. The 2015 Food
Security and Vulnerability Atlas classed all districts on Lombok as Priority 3–‘moderately vulnerable’. Lombok Timur ranked
highest at 135th out of Indonesia’s districts, and Lombok Utara was ranked lowest at only 49th. A recent WFP survey on
the effects of drought in Lombok Utara and Lombok Tengah found that households were generally less badly affected
than those surveyed in Sumba. While 23-28% were found to be moderately food insecure, only 1% were severely affected.
Vulnerable Groups
The survey did not identify widespread ethnic or religious markers of vulnerability–although there have been well known
problems in Lombok for members of so-called deviant Islamic sects. It also brings no insights on other groups such as
disabled people.
The survey identifies two general groups that might be said to be vulnerable. The first is poor and landless households,
which are found particularly in Lombok and Sumba. Poverty appears to be more debilitating in Sumba, however, possibly
because of the greater availability of alternative livelihoods options in Lombok. Informants in Lombok noted that even the
poorest could still live hand to mouth by seeking work as agricultural or construction laborers, or in sand mining or brick
factories.
Female-headed households are a second major vulnerable group, particularly in Lombok. The large number of female-
headed households on the island is the result of male out-migration, and the (often associated) high divorce rate. (Smith
2014) Female-headed households face a range of social and economic challenges and discrimination, which make it
difficult for them to achieve financial stability.
Women in Lombok move around quite freely; they ride motorcycles and participate in most livelihood activities together
with men. However, society in Lombok is still quite patriarchical, and women and daughters are generally in subordinate
positions. A woman’s status is first and foremost determined by marriage and motherhood. (Smith 2014) Polygamy is
common. Before marriage, women are dependent on their male elders and have more restricted mobility. (Bennett 2005)
The tradition of bride stealing (kawin curi)–though more consensual than it sounds–still positions women as ‘valuable
goods’. Domestic violence is reportedly quite widespread. (Smith 2014) Men typically receive the bulk of inheritances.
Women’s education has also traditionally not been prioritized, and female illiteracy rates are high, particularly among older
women. Meanwhile, high rates of male out-migration and divorce have also resulted in many female-headed households,
who face significant social and economic disadvantages.
Women play a limited role in public life. By default, men represent the household in community forums, and women
Area LIFE EXPECTANCYEXPECTED YRS SCHOOL (5 Y.O.)
MEAN YRS SCHOOL(25+)
PER CAPITA SPENDING(MILLIONS)
HDI SCORE
Lombok Timur 64.04 13.10 6.06 7.750 62.07
Lombok Tengah 64.45 12.36 5.52 8.652 61.88
Lombok Utara 65.19 12.31 4.97 7.594 60.17
Indonesia 70.59 12.39 7.73 9.903 68.90
Table 2.3.1. 2014 Human Development Index, Lombok districts
Women’s and Men’s Roles
Lombok

26 HIVOS - LLA GREEN PROSPERITY
generally only attend meetings if specifically requested. Women are involved in community leadership roles, but most
often only in areas regarded as the domain of women, such as family planning and healthcare. Other positions are
commonly regarded as the preserve of men. Following the post-reformasi resurgence of adat (local custom) in Lombok
there are reportedly even fewer women in village leadership roles than during the New Order period (Henley & Davidson
2008)
Women shoulder almost all the burden of domestic work–cooking, washing clothes and cleaning the house. Men
occasionally help with childcare when women are busy cooking. During late-pregnancy and post-delivery, women stay
at home and take care of children. Harvest is a particularly busy time, as women prepare food for laborers from as early as
3 or 4 o’clock in the morning, while still going to the fields at the same time as men.
Women typically manage household cash, and are responsible for buying food, clothing, and household equipment. In
this sense, they provide a service for their partners, who are able to access spending money from their wives. Decisions on
health, education, and large purchases such as motorcycles and mobile phones are agreed together. Although men are
responsible for buying agricultural inputs and selling crops, women are often consulted. Women report that expenditures
on household and education are prioritized, while agricultural inputs may be purchased once household needs have been
secured.
Women are involved in most agricultural activities–planting, weeding, harvest and post-harvest activities. Men are
responsible for heavier work like land preparation, which uses handtractor, and spraying for pests. Men also have more
responsibility for the marketing of larger quantities of food/cash crops. Management of cattle, including cleaning of
stables, is more the preserve of men, though women help to collect fodder. Informants noted that women often engage
in supplementary work, sometimes with their husbands, including sand mining, brick making and petty trading.
Lombok
27 HIVOS - LLA GREEN PROSPERITY
Community Livelihoods
Land size is the primary determinant of household wealth in the areas of Lombok included in this study. Land sizes are far
bigger in the uplands than in the lowlands. This relates to population density (lower in the uplands), land type (irrigated
sawah and rainfed ladang), as well as the fertility of soils and suitability for cultivation. In general the lowlands are more
suited to intensified cultivation. Some households have irrigated sawah, some have rainfed ladang, while others cultivate
both.
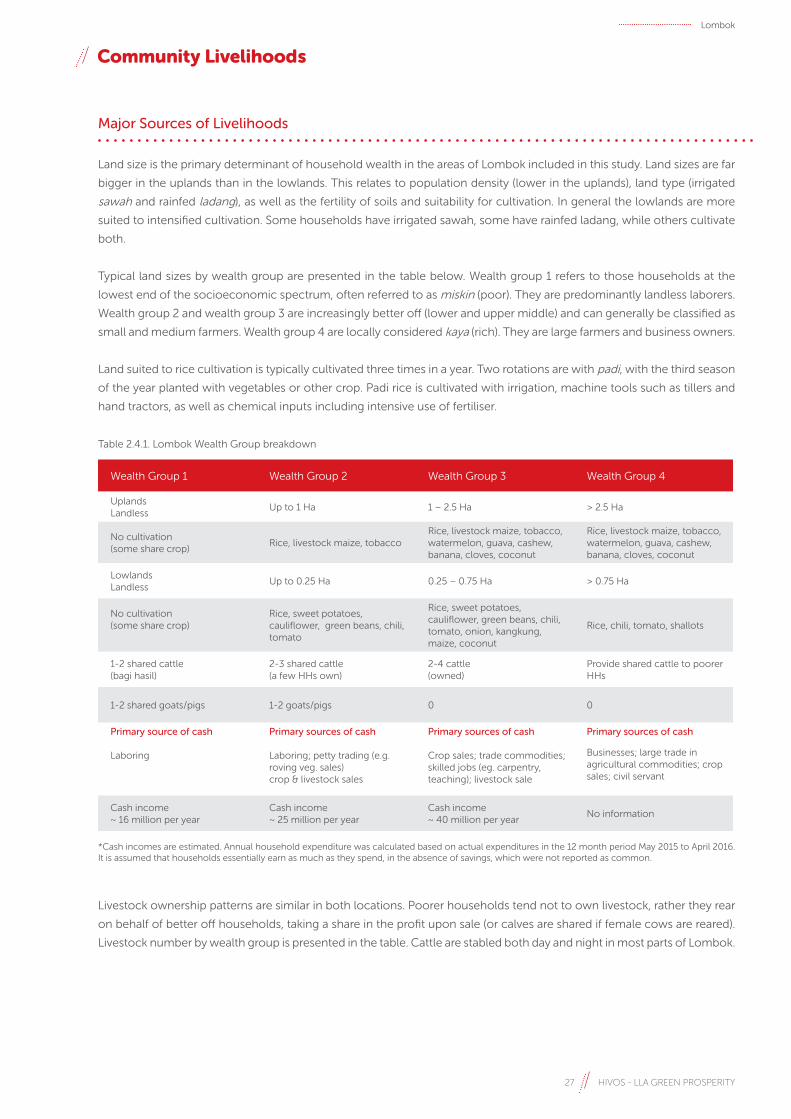
Typical land sizes by wealth group are presented in the table below. Wealth group 1 refers to those households at the
lowest end of the socioeconomic spectrum, often referred to as miskin (poor). They are predominantly landless laborers.
Wealth group 2 and wealth group 3 are increasingly better off (lower and upper middle) and can generally be classified as
small and medium farmers. Wealth group 4 are locally considered kaya (rich). They are large farmers and business owners.
Land suited to rice cultivation is typically cultivated three times in a year. Two rotations are with padi, with the third season
of the year planted with vegetables or other crop. Padi rice is cultivated with irrigation, machine tools such as tillers and
hand tractors, as well as chemical inputs including intensive use of fertiliser.
Table 2.4.1. Lombok Wealth Group breakdown
*Cash incomes are estimated. Annual household expenditure was calculated based on actual expenditures in the 12 month period May 2015 to April 2016. It is assumed that households essentially earn as much as they spend, in the absence of savings, which were not reported as common.
Livestock ownership patterns are similar in both locations. Poorer households tend not to own livestock, rather they rear
on behalf of better off households, taking a share in the profit upon sale (or calves are shared if female cows are reared).
Livestock number by wealth group is presented in the table. Cattle are stabled both day and night in most parts of Lombok.
Major Sources of Livelihoods
Wealth Group 1 Wealth Group 2 Wealth Group 3 Wealth Group 4
UplandsLandless
Up to 1 Ha 1 – 2.5 Ha > 2.5 Ha
No cultivation(some share crop)
Rice, livestock maize, tobaccoRice, livestock maize, tobacco, watermelon, guava, cashew, banana, cloves, coconut
Rice, livestock maize, tobacco, watermelon, guava, cashew, banana, cloves, coconut
LowlandsLandless
Up to 0.25 Ha 0.25 – 0.75 Ha > 0.75 Ha
No cultivation(some share crop)
Rice, sweet potatoes, cauliflower, green beans, chili, tomato
Rice, sweet potatoes, cauliflower, green beans, chili, tomato, onion, kangkung, maize, coconut
Rice, chili, tomato, shallots
1-2 shared cattle(bagi hasil)
2-3 shared cattle(a few HHs own)
2-4 cattle(owned)
Provide shared cattle to poorer HHs
1-2 shared goats/pigs 1-2 goats/pigs 0 0
Primary source of cash
Laboring
Primary sources of cash
Laboring; petty trading (e.g. roving veg. sales)crop & livestock sales
Primary sources of cash
Crop sales; trade commodities; skilled jobs (eg. carpentry, teaching); livestock sale
Primary sources of cash
Businesses; large trade in agricultural commodities; crop sales; civil servant
Cash income~ 16 million per year
Cash income~ 25 million per year
Cash income~ 40 million per year
No information
Lombok

28 HIVOS - LLA GREEN PROSPERITY
The graphic below summarises the total annual expenditure for the three wealth groups. Information covers the twelve
month period from May 2015 to April 2016.
Figure 2.4.1. Annual expenditure patterns by wealth group, Lombok
The expenditure categories in the legend are:
• Primary foods - rice, noodles, wheat flour, noodles, fresh and dried fish, meat (mostly chicken), tofu, tempe, eggs,
fruits and vegetables.
• Secondary foods - cooking condiments, salt, oil, sugar, coffee, tea, snacks.
• Personal hygiene - soap, detergent, washing powder, teeth hygiene, women’s hygiene products, razors.
• Fuel, lighting, water - LPG, firewood, kerosene, electricity, gasoline, water.
• Agricultural production costs - seeds, fertilizer, pesticides, ploughing, etc.
• Other production costs - fodder, livestock vaccinations, etc.
• Education - uniforms, books, fees.
• Health - doctor’s fees, medicines, informal cures.
• Miscellaneous - festivals, phone credit, cigarettes, betel, school snacks (pocket money),
non-essential beauty products, etc.
The graphs following provide a comparison of the proportion of annual expenditure represented by various essential
items, including cooking gas (LPG) and fertiliser, as well as various non-essential items.
Basically all households have a mobile phone and a motorbike, with increasing number and quality by wealth group.
All upland households are using LPG, with wealth groups 1 and 2 supplementing with firewood. Many households from
wealth groups 2 and 3 in the lowlands are recipients and users of biogas units. Lighting is typically via official connections
with PLN, both in lowland and upland areas.
Most households in all wealth groups achieve primary and secondary schooling, and some wealth group 3 and most
wealth group 4 households have someone that reaches tertiary education. Households in all wealth groups have a
relatively uniform size of around 4 members living together, with variation from 3 to 5 most typical.
Credit rollover (loan from B to pay back A), indebtedness, advance sale of crops (i.e. pre-harvest sale) and mortgaging of
land are significant aspects of the community economy. Most households have some level of debt.
Around 60% of the population falls into wealth groups 1 (around 20%) and wealth group 2 (around 40%).
Expenditure Analysis By Wealth Group
Annual Expenditure Patterns - Lombok
Other Production Costs
Fuel, Lighting, and WaterPrimary Foods
Agric Production CostsEducation Health
MiscellaneousSecondary Foods Personal Hygiene
Lombok

29 HIVOS - LLA GREEN PROSPERITY
Figure 2.4.2. Wealth group 2 expenditure breakdown, Lombok
Figure 2.4.3. Wealth group 3 expenditure breakdown, Lombok
Pocket money forchildren (snacks)
8%Cigarettes, tobacco,sirih pinang8%
Sugar3%
LPG 1%
Fertiliser1%
Manure1%
Everything else74%
Pocket money forchildren (snacks)
8%
Cigarettes, tobacco,sirih pinang10%
Sugar2%
LPG 1%
Fertiliser4%
Manure1%
Everything else74%
Lombok


SUMBA

32 HIVOS - LLA GREEN PROSPERITY
Sumba is one of the larger islands in Nusa Tenggara Timor province. It lies about 50 km to the south of Flores and Sumbawa,
and 250 km to the west of the provincial capital Kupang in West Timor. The island is about 80 km wide and 200 km long,
and is said to be shaped like a horse’s head. It has a total landmass of just over 11,000 km2.
The topography of Sumba consists of lowland coastal areas, hilly grasslands and limestone plateaus. As in other islands in
Nusa Tenggara Timur, the soils are formed on limestone, and are relatively thin, not very fertile and vulnerable to erosion.
The hilly terrain in Sumba is rugged and dissected by steep river valleys and creeks. Typical elevations in the interior range
from 200-600m. The highest point in Sumba is the 1,225m Wanggameti Mountain in the southeast.
Figure 3.1.1. Satellite map of Sumba Island
Rainfall varies across the island. The least rain falls in coastal areas and in the east, where the climate is hotter and drier. The
greatest rainfall is in the hills of west Sumba. The wet season generally lasts just 4-5 months, with a dry season from April
to October or November. During the dry season water access becomes more difficult, as many rivers and creeks dry up.
Sumba was largely deforested following intensive exploitation during the colonial era and forest cover is now estimated
to be less than 20%, and as little as 6%. (Fisher 2005) Key conservation areas include Laiwangi Wanggameti and Manupeu
Tanah Daru national parks, where much of Sumba’s protected forest is found. Slope is a major limiting factor for food
crops. There is a limited amount of flat land, and wet rice cultivation is the preserve of relatively few households. More
gently sloping land is used for a variety of subsistence crops, including corn, cassava and sweet potato. Key plantation
crops include cashew, coconut and coffee. The west part of Sumba is generally more fertile. Vegetation includes teak and
pine, and the landscape and climate support more intensive agriculture, including cash crops like candlenut and cashew.
Sumba’s grasslands support light grazing for cattle and horses.
Sumba’s four districts–Sumba Timur, Sumba Tengah, Sumba Barat and Sumba Barat Daya–are home to almost 750,000
people. Sumba Timur is the largest and most sparsely populated district, with 227,835 people in an area of 7,000 km2–33
people per square kilometer. By contrast, the most westerly district Sumba Barat Daya is home to 283,818 people living in
just 1,447 km2. Sumba has 44 subdistricts and 426 villages. A typical village has 1,000-2,000 residents. The least populace
villages are in Sumba Tengah, where many have less than 1,000 inhabitants.
Waingapu, the main port city, located in Sumba Timur, has been the capital of the island for more than 150 years. It is
served by regular flights including from Denpasar and Surabaya. Tambolaka in Sumba Barat is the main airport for the west
part of Sumba. The island’s main two-lane road network is paved and in fairly good condition. It runs about 140 km east to
west from Waingapu to Waitabula (Tambolaka) through Waikabubak–a journey of about 3-4 hours–and from Waingapu
for a short distance to the north as well as 120 km down around the southeast coast to Baing. The secondary roads that
serve large areas of the island are in generally poorer condition. Access roads to villages are not always paved and can be
difficult to pass particularly in the rainy season.
GENERAL GEOGRAPHIC INFORMATIONGeographic Range
Sumba

33 HIVOS - LLA GREEN PROSPERITY
LANDSCAPE ELEMENTS
District AreaPopulation(BPS 2013/4)
PopulationDensity
#Villages
Sumba Timur 7,000 km2 245,260 35 156
Sumba Tengah 1,869 km2 69,598 37 65
Sumba Barat 737 km2 119,907 163 74
SUMBA BARAT DAYA 1,447 km2 312,510 216 131
TOTAL 11,054 km2 747,275 68 426
Structure and Function
Settlements
About half of Sumba’s villages are in the sparsely populated Sumba Timur and Sumba Tengah districts, which together
make up about 80% of the island’s landmass. Here, village population is typically 1,000–1,500 people (Dalam Angka,
2014/15). Settlement patterns include more concentrated nuclear sub-village settlements, often some distance apart,
and more disbursed patterns of settlement, in which houses are scattered among fields. The south part of Sumba Tengah
and the two more westerly districts seem to follow a more disbursed settlement pattern. However, population density is
much greater in the latter two districts; villages are closer together, and are typically home to 1,600–2,400 people (ibid).
In contrast to the main trunk roads connecting east and west Sumba, village access roads are often in poor condition,
with loose stones and potholes. Roads are not all paved, or sometimes only paved with sand and stones. In one village
(Umamanu in Sumba Timur) it took one hour to travel just six kilometers from the main subdistrict road to home of the
village chief; in another, Leilunggi, car access required a four wheel drive, and in the rainy season may be hampered by
poor road condition and difficulties fording the river. According to the local Public Works office, 40% of roads in the district
are badly damaged. Roads between subvillages are generally unpaved.
Sumba’s villages have much less by way of commercial facilities than those in Luwu or Lombok. Markets are generally
further away and there are fewer kiosks in villages. Unlike in the other two project areas, bottled gas is not widely available
from such outlets. Village offices were observed to be generally in fairly good condition though most appeared to be
underutlilised, and in contrast to the other two project areas, some had limited furnishings, and lacked electricity, toilets
or clean water. Puskesmas health facilities are mainly found in sub-district towns, due to limited availability of doctors.
There are around 750 elementary schools and just over 200 junior highs serving 426 villages and municipal wards in
Sumba (Dalam Angka, 2014/15). All villages visited had at least one elementary school, though some were merged with
a junior high. The condition of the visited school buildings and facilities was fairly poor, including in schools that had
installed a PV solar system. This appears to be common; for example, Sumba Timur district categorizes around half of
elementary school classroms as ‘rusak’ or ‘rusak berat’ (Dalam Angka, 2015).
Around eighty percent of Sumba’s population rely on the cultivation of food crops for their livelihoods. The soil on the
island is based on limestone, and is comparatively thin, rocky and not very fertile, though better soils are found in the west
of the island and in combination with higher rainfall this makes the area more favorable for agriculture. In general, slope
is the major factor limiting crop production, and erratic rainfall one of the major risks.
Rice and corn are the major food crops, and are cultivated across the island. Around 55,000 ha is used for rice cultivation,
over half of it in irrigated fields (Dalam Angka, 2014/15); however, seven of the eight villages visited had only rain-fed
agriculture, with the exception of Wanga in Sumba Timur. Rice farming is more intensive in Sumba Barat and SBD, though
in the latter rice production mostly rainfed (sawah tadah hujan). A similar area is given over to growing corn, over 30,000 ha
Agriculture
Sumba

34 HIVOS - LLA GREEN PROSPERITY
of it in SBD district alone, where productivity is highest (ibid). The district accounts for 65% of recorded maize production,
and per capita production is double or triple that in the other three districts. Here, Kodi Utara subdistrict alone produces
over 10% of Sumba’s maize crop, followed by Wewewa Barat (9.6%). Cassava is another key food crop, cultivated across
the island, most intensively in Sumba Barat. Other important food crops include sweet potato and pulses.
Cashew is a major cash crop, and is found in all districts. Pinang is also cultivated in all districts. SBD is the major producer
for cash crops, in particular cashew, coffee, cocoa and pinang. Meanwhile, Sumba Timur and Sumba Tengah are the major
areas for candlenut production. Coconut is planted across the island, particularly in Sumba Barat, where sirih is also an
important cash crop.
Livestock are an integral part of the landscape and life on Sumba, and their significance goes well beyond economic value.
Animal ownership is a primary signifier of wealth and status, and cultural rituals and life cycle events including weddings
and funerals demand the exchange and slaughter of animals. Sumba Timur, with its large savannah, has traditionally been
a major site of livestock farming, with large herds of cows, horses and buffalo tended by lower status people. All villages
visited have access to common grazing land.
A 2011 assessment for biogas in Sumba notes the large number of cattle in the island–these currently include around
65,500 cows (Dalam Angka, 2014/15). There are also similar numbers of water buffalo, particularly in the east (ibid). The
report discounts the presence of pigs in yards on the basis that dung will be difficult to collect, and notes that access to
grazing and limited stabling of cattle is a very significant limiting factor. Poor access to water, which affects an estimated
40% of households also greatly limits technical potential (Hivos/SNV, 2011). Horses–which currently number around
46,500–are discounted due to grazing and stabling practices (Dalam Angka, 2014/15).
The assessment remains relevant, except that three years of biogas promotion in Sumba have established that much
of the immediate potential for biogas lies in pig manure, due to difficulties with dung collection for cattle. Permanent
stabling of large animals like buffalo, cow, horse, goat/ sheep is not attractive since it will be necessary to provide food
and water. Only pigs may be stabled day and night. (JRI 2013)
Informants noted that in Sumba, pigs are highly valued compared even to cattle. There are currently over 240,000 pigs
recorded in Sumba–roughly 50,000 in each district, with the exception of Sumba Timur, which has double that amount.
Pig holdings appear to be greatest in Sumba Tengah, where there are an average of four pigs for every household. This
ratio drops to two per household in Sumba Barat and Sumba Timur and just one per household in SBD. Traditional raised
houses include stabling underneath the floor, though this is not a feature of modern houses, and pigs are often kept in
the yard. Dung collection is feasible, although access to water remains a significant constraint. Continuity of ownership is
also an important issue for biogas, given the importance of pigs in ceremonial exchange and slaughter. The head of one
district agriculture agency perceived that there is a need to change livestock practices by promoting more continuous
ownership.
Sumba was once covered by deciduous forest, however now only about one-quarter of the island is designated as forestry
land. Around half of this is national park or protected forest. Actual forest cover on the island is reported to be as low as
6%. (Sudjatnika et al, 2000) Most forestry area, including over 90% of protected forest and national park area is located
in Sumba Timur and Sumba Tengah. This includes over 60,000 ha of protected forest in the Laiwangga Wanggameti
complex and Lulundilu in the southeast, and the Manupeu-Tanah Daru national park in south-central Sumba, which
covers 88,000 ha.
Animal Husbandry
Natural Capital
Sumba

35 HIVOS - LLA GREEN PROSPERITY
Although Sumba has many rivers and creeks, many are intermittent and run dry in the dry season. Springs are the major
source of water for household needs. The major upland forest areas in the southeast and central parts of the island play an
important role in the provision of ecological services, and are key water catchment areas for the island. Reported threats
include grazing, tree felling, and burning. A survey by Walhi in 2012 reported that 50% of Sumba’s 12 major watercourses
(DAS) are damaged.
Extensive assessments of resource potential for the Sumba Iconic Island program, including by partner Winrock, global
energy consultancy KEMA, and Indonesian-based renewable energy consultants Entec, identify that Sumba has abundant
resources for on- and off-grid renewable energy development. The island has high levels of insolation, its rivers have
excellent potential for hydro power, and wind energy resources were found to be virtually unlimited. Sumba was also
assessed to have large potential for the generation of energy from biomass, including biofuels and biogas.
In comparison with the other project areas, people in rural Sumba appear to place much more explicit cultural value on
the natural and lived environment. Across the island, land is known as a ‘mother’, which provides food. Land is divided into
clan domains, and people are traditionally tied to ancestral villages and places of origin. Clans also exercise authority over
land use and ownership, although individually recognized ownership is now common. As noted above, animals play a
highly valued role in social life, including in ceremonies, ritual exchange and as a signifier of social status.
In general, it may be said farming systems in Sumba are not largely driven by a concern to maximize profit or productivity,
but rather to sustain livelihoods. As Vel notes, there has traditionally been no separate capitalistic sector in the agricultural
economy in Sumba, in contrast to the commercial services economy dominated by other ethnic groups in urban areas
(Vel, 1994). Although the cash economy has slowly extended into rural areas over recent decades, other forms of exchange
remain important up to the present day. The use of agricultural inputs, including fertilizer, appears to be generally very low,
due reportedly to low priority for increasing productivity.
Nevertheless, some livelihoods practices have quite damaging effects. Slash and burn agriculture practices are widespread;
one study found that 29% of eastern Sumba was burnt in 2003, mostly in savannah and cultivated areas. (Fisher et al.
2005) Forest exploitation, particularly for logging, agricultural conversion and grazing has also been noted as a concern.
This was noted in two of the eight villages visited, Umamamu and Leilunggi in Sumba Timur, where forest–in one case,
protected forest area–is used for planting cash crops and gathering firewood. Similar activities have been noted in villages
around Manupeu-Tanah Daru park. However, district governments have implemented strict penalties reportedly leading
to a reduction in logging; one village head (in Wanga) noted that people had turned to planting their own trees for this
reason. The survey also noted encouraging practices, including in Cendana Barat in Sumba Tengah and Lailunggi villages
in Sumba Tengah and Sumba Timur, where large savannah area have been extensively planted including with trees over
the past decade.
Values
Sumba

36 HIVOS - LLA GREEN PROSPERITY
Society on Sumba is often cast as ‘traditional’. However, trade, colonial government, and penetration by church and state
have exerted a strong influence on development. Prior to the 20th century, Sumba was known for trade in horses, slaves
and sandalwood, though over exploitation denuded it of the latter (Lundry, 2009). Beyond this, the island was of limited
economic or strategic interest, and people lived insecure lives away from the control of the Dutch. Chronic insecurity due
to warfare between clan chiefs and slave raids from Ende shaped settlement patterns. Fortified villages were established
in elevated areas away from the coast, and land was the domain of the first clan to establish a settlement. Society was
stratified into three castes: nobility, who gave protection; freemen, who sought it; and slaves, who were captured, bought
or sold. (Lundry 2009) Only in the early 1900s did the Dutch pacify Sumba, bringing greater stability. However, they did
not put an end to slavery. The post-independence government clamped down on the practice, though it continued in
modified form as hereditary servitude, which may still be found even up to the present day. Noble families continued to
enjoy high status and wealth in the form of large holdings of horses, cattle and pigs, which play a key role in social events
and ceremonial exchange.
Sumba is predominantly Protestant, though with a sizable Catholic minority. Over 90% of the population are ethnic
Sumbanese. (Vel & Makambombu, 2011) The importance of pigs for the Sumbanese is said to be a key reason why Islam
could not gain a foothold. Sumba was also major focal area for the Dutch Reformed Church outside Java from the 1900s.
However, only over the course of the 1970s and 1980s did the majority of people convert to Christianity. The church now
plays an important role in society, providing an alternative line of organization and route for enhancement. (Vel, 1994)
Nevertheless, the traditional merapu ancestral religious system remains important for many Sumbanese, binding them to
clans and places of origin. Beyond this, there are small numbers of Hindus, Buddhists and Muslims, primarily in coastal and
urban areas, which are home to a mix of ethnic groups from outside the island.
From the 1970s, the state started to have a much stronger presence at village level, including through agricultural
extension and family planning, and through the establishment of schools. Local elites were incorporated through Golkar
and its affiliated organizations. While this created opportunities to get ahead, it also reinforced social divisions. Higher
levels of education were the preserve of elites, who continue to be the main beneficiaries of the ‘iron rice bowl’ of state
employment. The wage bill for civil servants accounts for a large portion of district government spending, and having a
family member in state employment is an important source of cash for some rural households. Recent years have brought
increasing social fluidity, and for example, village heads are now not exclusively members of the nobility. Traditional slavery
no longer exists, and with some exceptions, informants noted that, “these days, we don’t differentiate between people.”
Nevertheless, forms of servitude can still be found, and long-standing social hierarchies do endure albeit in more modern
forms.
To a much greater extent than the other project areas, Sumba remains a world to itself. The island has seen significant
change over recent decades, not least through greater mobility, market penetration and growth of the cash economy.
The state has also intervented to regulate or modify social and cultural practices–for example pasola or animal sacrifice.
Nevertheless, Sumba remains, “among the most peripheral regions in Indonesia,” lacking strategic or economic importance
and receiving limited development funding. (Lundry 2009, 358) This accounts for the very low electrification rate on
the island. Despite incorporation into the state system, Sumbanese have limited connection to the centre. Tellingly, one
school visited had not yet updated pictures of the previous president on the walls, two years after his term ended. In
another village, pictures of Suharto were on prominent display in the village office. (cf. Lundry 2010) Sumbanese have not
generally sought or obtained significant positions in national politics. Many rural dwellers have limited access to television
or even radio. For example, one farmer noted that he occasionally watched an intermittently used TV in the local church
because, “sometimes we want to know what is going on in Jakarta.” Handphones also have limited penetration in rural
areas. A 2013 baseline for all of Sumba suggests that just 50% of households have telecoms expenditures; this figure was
confirmed in a 2015 market survey. These figures included respondents in towns and their peripheries. During interviews
in rural locations, researchers observed that perhaps just 20% or so of informants seemed to have mobile phones.
Culture and Social Life
LIFESCAPE ELEMENTSSocioeconomic Conditions
Sumba

37 HIVOS - LLA GREEN PROSPERITY
Women and, more often, men do seek work outside Sumba, including in construction or service jobs in Bali. Women
may also be recruited as domestic workers in Malaysia. But despite high rates of poverty, out-migration appears to be
relatively low, especially compared to Lombok, and only one of the more easily accessible villages visited appeared to
have significant numbers of people working in other areas. There has been limited transmigration to the island, though
some remote villages–such as Leilungi, visited–have been ‘translocated’ to bring them into the orbit of government
services.
Religious and ethnic relations are generally peaceable, with for example no major anti-Chinese or anti-Muslim violence.
Nevertheless, as Vel notes, violence is not uncommon in Sumba. A media-based violence-monitoring project identified
30 violent incidents on the island in 2014 alone, causing 10 deaths and 19 injuries. Most was a result of criminality, however
other important causes included disputes over land or other local resources, and local political disputes. Reports by
project partners refer to two cases of conflict on the margins of project sites or potential project sites, including a major
inter-village land dispute that led to a re-siting of activities. Meanwhile, reports from the survey found that at least one
village had recently experienced a heated dispute over a village head election, while planned research in another village
had to be relocated due to a community dispute over subsidized rice distribution program Raskin.
General Status
Sumba is one of the more disadvantaged parts of one of Indonesia’s most disadvantaged provinces. The 2014 HDI score
for Nusa Tenggara Timur placed the province 31st out of 34 provinces, and all Sumba districts received scores below the
provincial average. The best performing district, Sumba Timur, received a score similar to those for Lombok Tengah and
Lombok Timur. Sumba Tengah and Sumba Barat Daya were the worst performing of all project districts, and count among
the relatively few districts in Indonesia to receive an HDI score under 60.
Human development indicators show many similarities between Sumba’s four districts. In common with most project
districts, life expectancy is around 65-67 years, though somewhat lower in Sumba Timur. Also in common with other
areas, children are expected to spend around 12 years in school. Education attainment of adults is quite low, however, and
the average adult (25+) has had only had 5-6 years in education.
Annual per capita expenditures are well below the national average. They also vary significantly between districts. Sumba
Timur has the highest per capita expenditures, of IDR 8.8 million per year. Sumba Barat comes some way behind, with
annual spending per person calculated at just IDR 6.7 million. Sumba Tengah and Sumba Barat Daya have the lowest per
capita expenditures: IDR 5.8-5.9 million.
Poverty is widespread in Sumba. BPS figures from 2010 show that 30-34% of the population in Sumba’s four districts is
poor. Many more people live close to the poverty line. For example, a 2011 Proxy Means Test survey shows that 60% of
Sumba’s population falls within the bottom thirty percent nationally by wealth status. About 25% of people in every district
were classed in wealth decile 1.
Table 3.3.1. 2014 Human Development Index, Sumba
Human Development
District LIFE EXPECTANCYEXPECTED YRS SCHOOL (5 Y.O.)
MEAN YRS SCHOOL(25+)
PER CAPITA SPENDING(MILLIONS)
HDI SCORE
Sumba Timur 63.48 12.02 6.14 8.808 62.04
Sumba Barat 66.11 12.11 6.38 6.714 60.90
SBD 67.08 12.59 6.01 5.880 59.90
Sumba Tengah 67.65 11.44 5.10 5.788 57.90
Indonesia 70.59 12.39 7.73 9.903 68.90
Sumba

38 HIVOS - LLA GREEN PROSPERITY
Vulnerable groups
Poor households clearly constitute a major vulnerable group in Sumba. Female-headed households may also be regarded
as a vulnerable group. Members of the women’s empowerment agency in one district noted that–as in Lombok–this is
a particular problem for households where the male partner migrates for work. One informant from this agency noted
that malnutrition and cases of untreated illnesses are higher in such households. The scale of this problem is not known,
however it may be assumed to be much less than in Lombok and also less widespread than the more general problem of
poverty and food insecurity on the island.
While NGO workers in Sumba note that there has been significant progress towards improving the position of women,
there remain strong gender divisions on the island. Women’s roles are greatly defined by marriage, reproduction and
domestic work. Marriage occurs quite young, and by the age of 20 unmarried girls may reportedly be pressured or forced
to marry; old unmarried women and widows are said to be marginalized. (JRI 2013) Illiteracy among women runs at
around 15%, higher than among men (ibid). While about 60% of people in Sumba report that men and women jointly own
houses, farmland and livestock, men are regarded as the main owner in a significant minority of cases (ibid). In other cases,
men’s rights over assets may also be deemed greater. According to the custom of Sumba’s patrilineal clans, women do not
inherit or own land except as dowry; for them, ownership emerges through marriage.
As is often the case, women in Sumba play a more limited role in public life. They traditionally do not occupy political
leadership or specialized customary roles, and have little or no say in clan decision-making. (Vel 2008) Women do play
important roles in village life, but these are generally those that are seen as the preserve of women, like healthcare and
family planning. By default, men tend to represent the household in public forums. Fewer women attend neighborhood
and village meetings, and their participation is also less substantive.
Women play the primary role in managing domestic needs: caring for children, gathering vegetables, buying necessities
in kiosks or the market, cooking, and fetching water. In the mornings, women cook water and food, wash dishes, pound
corn, feed pigs, and prepare children for school. These activities take 2-3 hours, after which women follow men to the
fields. Women also cook for neighbours that provide reciprocal labor for land preparation, planting and harvesting. Men,
women and children collect firewood in plantations or near the house. Fetching water is generally the work of women
and children, taking on average one hour a day. Women are housebound in late pregnancy and post-delivery, though they
may visit fields to bring lunch to their partner.
Household cash management is generally the preserve of women; only in around ten percent of households do men
dominate decisions about daily spending. Nevertheless, men have access to household funds including for expenditures
such as cigarettes and fertilizer. Informants report that decisions regarding education, health, sale or purchase of livestock,
and large purchases like motorcycles generally taken together. A baseline for Sumba suggests that this may be the case in
around two-thirds of households.
Women are heavily involved in the food and cash crop cultivation that form the basis for rural livelihoods on the island. A
typical day will involve long hours in fields or orchards from perhaps nine to six, punctuated by a long mid-day break to
eat, rest and gather wood, fetch water or pig fodder. Women participate in most aspects of farming, including planting,
weeding, harvesting and post-harvest work, although heavier work such as land preparation as well as pesticide application
are more the preserve of men. Women also have the primary role in the management of smaller livestock such as pigs and
poultry, while men play a much greater role in managing cows, buffalo and horses.
Women’s and Men’s Roles
Sumba

39 HIVOS - LLA GREEN PROSPERITY
In general, women seem to have limited time or opportunities to supplement household income by making handicrafts.
Some weave cloth, though weaving was only found to be relatively widespread in one of the surveyed villages visited in
Sumba Timur. In another village in SBD, some women made bamboo mats. District governments register just 8,500 people
in Sumba involved in weaving or handicraft enterprise activities, most of them in Sumba Timur and to a lesser extent in
SBD (Dalam Angka, 2014/15). However, this appears to understate the number of women involved in handicrafts, and as
noted below, production of traditional handicrafts may be an important source of income for a sizeble proportion of the
poorer wealth group. In three coastal villages visited, women also collect and sell salt prior to the harvest. Supplementary
income is generally spent on household needs such as food.
Sumba

40 HIVOS - LLA GREEN PROSPERITY
In many parts of Sumba, the size of land owned by a household is less of a determinant of wealth, than the actual amount
of land that a household can cultivate. As can be seen from the table below wealth group 2 and 3 households own a lot
more land than they cultivate. Ability to cultivate land is determined by the amount of labor that is available within the
household, or, that can be hired by a household. The quality and location of land are also important factors in determining
how much land will be cultivated. Livestock is both a determinant and an indicator of wealth, in that livestock are as often
kept for ceremonial and customary uses as for productive uses.
There are three primary wealth groups in Sumba. Wealth group 1 are those households typically referred to as poor. Wealth
group 2 households are referred to locally as “pas-pasan” (Bahasa Indonesia), which implies producing enough to meet
needs. Considering the poor make ends meet (through hard struggle), it is more likely that the “pas-pasan” term refers to
ability to live a minimum standard of comfortable living, rather than just “survival living” as is more typical for the poor.
Wealth group 3 are those households typically referred to as well off, or rich.
Agriculture is typically practised using mixed cropping techniques, with the exception of irrigated rice. Maize is typically
cultivated twice per year, however geographical conditions vary meaning that some locations only support a single
cultivation, while in a few areas with higher rainfall even 3 rotations are possible. Unlike the maize cultivated in Lombok and
Luwu, maize cultivated in Sumba are traditional, open pollinating varieties for human consumption. Tuber crops including
sweet potatoes and cassava are important supplements to the two primary staple foods, rice and maize. This variety in
staple crops is an influencing factor in determining the number of months that stocks are available within the household–
the more diverse, the longer stocks last. This is perhaps more reflective of capacity to cultivate, as once a minimum of
rice and maize are cultivated, then farmers will add on supplementary crops including both tubers and beans, to lengthen
the duration of consumption and as well as the variety of diet. The strategy to culitivate various types of crops, as well as
the mixed cultivation technique is indicative of risk reduction techniques that ensure there is something that survives and
does well (if not all of them). The use of crop inputs is generally lower in Sumba, as compared with Lombok and Luwu,
mostly limited to fertilizer and pesticide. Around a quarter of people intereviewed for this report collected animal dung for
application to fields.
Community Livelihoods
Major Sources of Livelihoods
Sumba
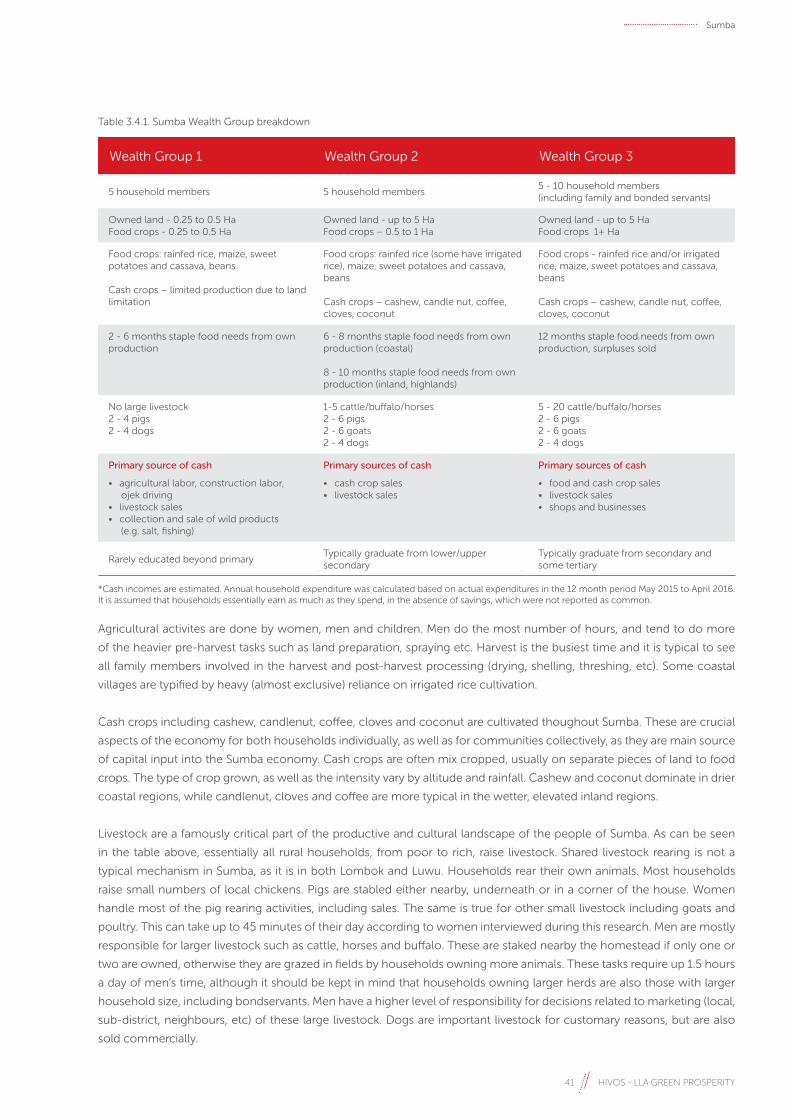
41 HIVOS - LLA GREEN PROSPERITY
Wealth Group 1 Wealth Group 2 Wealth Group 3
5 household members 5 household members5 - 10 household members(including family and bonded servants)
Owned land - 0.25 to 0.5 HaFood crops - 0.25 to 0.5 Ha
Owned land - up to 5 HaFood crops – 0.5 to 1 Ha
Owned land - up to 5 HaFood crops 1+ Ha
Food crops: rainfed rice, maize, sweet potatoes and cassava, beans
Cash crops – limited production due to land limitation
Food crops: rainfed rice (some have irrigated rice), maize, sweet potatoes and cassava, beans
Cash crops – cashew, candle nut, coffee, cloves, coconut
Food crops - rainfed rice and/or irrigated rice, maize, sweet potatoes and cassava, beans
Cash crops – cashew, candle nut, coffee, cloves, coconut
2 - 6 months staple food needs from own production
6 - 8 months staple food needs from own production (coastal)
8 - 10 months staple food needs from own production (inland, highlands)
12 months staple food needs from own production, surpluses sold
No large livestock2 - 4 pigs2 - 4 dogs
1-5 cattle/buffalo/horses2 - 6 pigs2 - 6 goats2 - 4 dogs
5 - 20 cattle/buffalo/horses2 - 6 pigs2 - 6 goats2 - 4 dogs
Primary source of cash
• agricultural labor, construction labor, ojek driving• livestock sales• collection and sale of wild products (e.g. salt, fishing)
Primary sources of cash
• cash crop sales• livestock sales
Primary sources of cash
• food and cash crop sales• livestock sales• shops and businesses
Rarely educated beyond primary Typically graduate from lower/upper secondary
Typically graduate from secondary and some tertiary
Table 3.4.1. Sumba Wealth Group breakdown
*Cash incomes are estimated. Annual household expenditure was calculated based on actual expenditures in the 12 month period May 2015 to April 2016. It is assumed that households essentially earn as much as they spend, in the absence of savings, which were not reported as common.
Agricultural activites are done by women, men and children. Men do the most number of hours, and tend to do more
of the heavier pre-harvest tasks such as land preparation, spraying etc. Harvest is the busiest time and it is typical to see
all family members involved in the harvest and post-harvest processing (drying, shelling, threshing, etc). Some coastal
villages are typified by heavy (almost exclusive) reliance on irrigated rice cultivation.
Cash crops including cashew, candlenut, coffee, cloves and coconut are cultivated thoughout Sumba. These are crucial
aspects of the economy for both households individually, as well as for communities collectively, as they are main source
of capital input into the Sumba economy. Cash crops are often mix cropped, usually on separate pieces of land to food
crops. The type of crop grown, as well as the intensity vary by altitude and rainfall. Cashew and coconut dominate in drier
coastal regions, while candlenut, cloves and coffee are more typical in the wetter, elevated inland regions.
Livestock are a famously critical part of the productive and cultural landscape of the people of Sumba. As can be seen
in the table above, essentially all rural households, from poor to rich, raise livestock. Shared livestock rearing is not a
typical mechanism in Sumba, as it is in both Lombok and Luwu. Households rear their own animals. Most households
raise small numbers of local chickens. Pigs are stabled either nearby, underneath or in a corner of the house. Women
handle most of the pig rearing activities, including sales. The same is true for other small livestock including goats and
poultry. This can take up to 45 minutes of their day according to women interviewed during this research. Men are mostly
responsible for larger livestock such as cattle, horses and buffalo. These are staked nearby the homestead if only one or
two are owned, otherwise they are grazed in fields by households owning more animals. These tasks require up 1.5 hours
a day of men’s time, although it should be kept in mind that households owning larger herds are also those with larger
household size, including bondservants. Men have a higher level of responsibility for decisions related to marketing (local,
sub-district, neighbours, etc) of these large livestock. Dogs are important livestock for customary reasons, but are also
sold commercially.
Sumba

42 HIVOS - LLA GREEN PROSPERITY
Production of traditional handicrafts such as woven sarongs and grass tikar mats is an important income source for some
households. Although the number of these households is not a majority overall, they may represent a sizeble proportion
of the poorer wealth group.
Post harvest milling of rice is typically done at the village level by small machines operated by local shops. A large
proportion of wealth group 2 and wealth group 3 households utilize this service, despite distances being significant.
Poorer households buy polished rice (beras) for 6-10 months of the year, and either manually mill their own-produced
rice (padi) or pay for it to be milled when they have the money for that. (Poorer households also earn rice–probably padi–
as payment for labor that they contribute on the fields of better off households). It is worth noting that manually milled
rice is nutritionally healthier than machine polished white rice due to the remaining hull and bran which is rich in protein
and micronutrients, although overwhelming demand is for polished white rice.
Coverage of small diesel-operated maize mills is significantly lower than for rice mills, with most households processing
by hand according to requirement (i.e. daily needs, maximum 3kg for a household of 5, but likely to be less). Storage
losses are lower if maize is stored on cobs as weevils are unable to access the softer base (tip cap) of loosened kernels.
This small-scale daily processing may be a factor for why there has not been a widespread proliferation of small maize
mills by local entrepreneurs, as has taken place with rice mills. An additional strategy for minimizing storage losses of
maize, is storing cobs under the roof of houses, where smoke from cooking fires deliberately lit under the eaves drifts up
into the apex of the roof, effectively smoking out weevils and other insects.
The economy of many villages in Sumba remains a mixed cash-barter economy. This is particularly true for villages in
isolated areas which tend more toward barter, and vice versa for villages near urban centres. Labor for agriculture, as well
as other services, is often sold by poorer households to better off households, with payment being made in-kind, (e.g.
rice or maize). Locally produced goods, as well as goods imported into Sumba from outside (e.g. instant noodles, cooking
condiments, tea, sugar, etc) are bartered. Some examples of goods-for-goods exchange rates (from different villages) are
as follows:
• 100kg maize = 1 breeding hen + 10 chicks
• 1 pig aged 4 months = 200kg sweet potatoes
• 1 pig aged 4 months = 100kg rice
• 1 pig aged 4 months = 10 medium size chickens
• Other commodities such as fish and salt are bartered
• 1 bar of soap (value 3,000) = 1 coconut
Cash-based trade is still present in all locations as is reflected by the expenditures that households described making in
the period May 2015 to April 2016.
Figure 3.4.1. Annual expenditure patterns by wealth group, Sumba
Expenditure Analysis By Wealth Group
Annual Expenditure Patterns - Lombok
Other Production Costs
Fuel, Lighting, and WaterPrimary Foods
Agric Production CostsEducation Health
MiscellaneousSecondary Foods Personal Hygiene
Sumba

43 HIVOS - LLA GREEN PROSPERITY
The expenditure categories in the legend are:
• Primary foods - rice, fresh and dried fish, chicken
• Secondary foods - cooking condiments, salt, oil, sugar, coffee, tea
• Personal hygiene - soap, detergent, washing powder, teeth hygiene, women’s hygiene products, razors
• Fuel, lighting, water - kerosene, electricity, gasoline
• Agricultural production costs - mostly fertilizer and pesticides
• Other production costs - fodder, livestock vaccinations (very limited)
• Education - uniforms, books, fees
• Health - doctor’s fees, medicines, informal cures
• Miscellaneous - festivals, phone credit, cigarettes, betel, school snacks (pocket money), non-essential beauty
products, etc
All villages have weekly markets at which the majority of people do their trading. Occasionally, people will travel to sub-
district and district level markets. Selling of products such as vegetables and fish fetches a lower price in these bigger
markets as compared with at the village level, while commodities such as sugar and coffee are cheaper in these central
locations.
Based on the seasonal calendars developed with informants for this exercise, and the accounts of survey informants, in
general January and February are times of year when members of the lowest wealth group may face difficulties with cash
flow (see annexes for seasonal calendars).
A majority of wealth group 2 and 3 households own motorbikes (at least 50%, up to 75% depending on the location of the
village), with fewer owned by poorer households. These motorbikes are often used for productive purposes such as going
to fields and for transport services. The majority of households in all three wealth groups own and use a mobile phone.
This is no longer an indicator of wealth as it was 5-10 years ago.
Households from all wealth groups use firewood for cooking, mostly collected from their own fields, rather than
neighbouring forests. A 2010 census found that 90% of Sumba households use firewood for cooking, with kerosene
sometimes being used as a starter. Firewood collection is not a stand alone activity, rather it is done at the same time as
other tasks need to be done in the field. Women do more of this task than men, with assistance from children. During
the dry season, firewood is collected less frequently, because more is collected each time. Wood is stockpiled during this
time. In the rainy season, smaller amounts of wood are collected every day, to be chopped and dried.
Households in villages located far from electricity grids rely on simple kerosene bottle lamps (pelita) for lighting. Poorer
households tend to use two lamps within the home while better off households use more.
Access to water is determined by geographical factors rather than wealth group variation. Households store rainwater in
some locations, access natural springs where they are available, and others use boreholes installed by government and
NGOs. Despite subsidized primary and secondary schooling, poorer households remain unable to achieve graduation
from secondary due to other costs associated with education, such as transport to the further-away secondary schools
etc.
The main reason reported by wealth group 1 respondents for remaining poor is lack of access to land. Some cases occur
of wealth group 2 households becoming poor, most often associated with overambitious expenditure on cultural and
custom events within the household. People in higher up wealth groups often stated that a poor work ethic was the cause
of poor households becoming/remaining poor. It is likely that individuals with a poor work ethic are present in similar
numbers in all wealth groups, simply that the effects of this attitude are less visible when better off households are lazy,
because they are “carried” by the momentum of their social and political access, higher education status and existing farm
and non-farm businesses. The keeping of bondservants by better off households is also likely to minimize the effects of
a poor work ethic.
Sumba

44 HIVOS - LLA GREEN PROSPERITY

BENEFICIARY ASSESSMENT
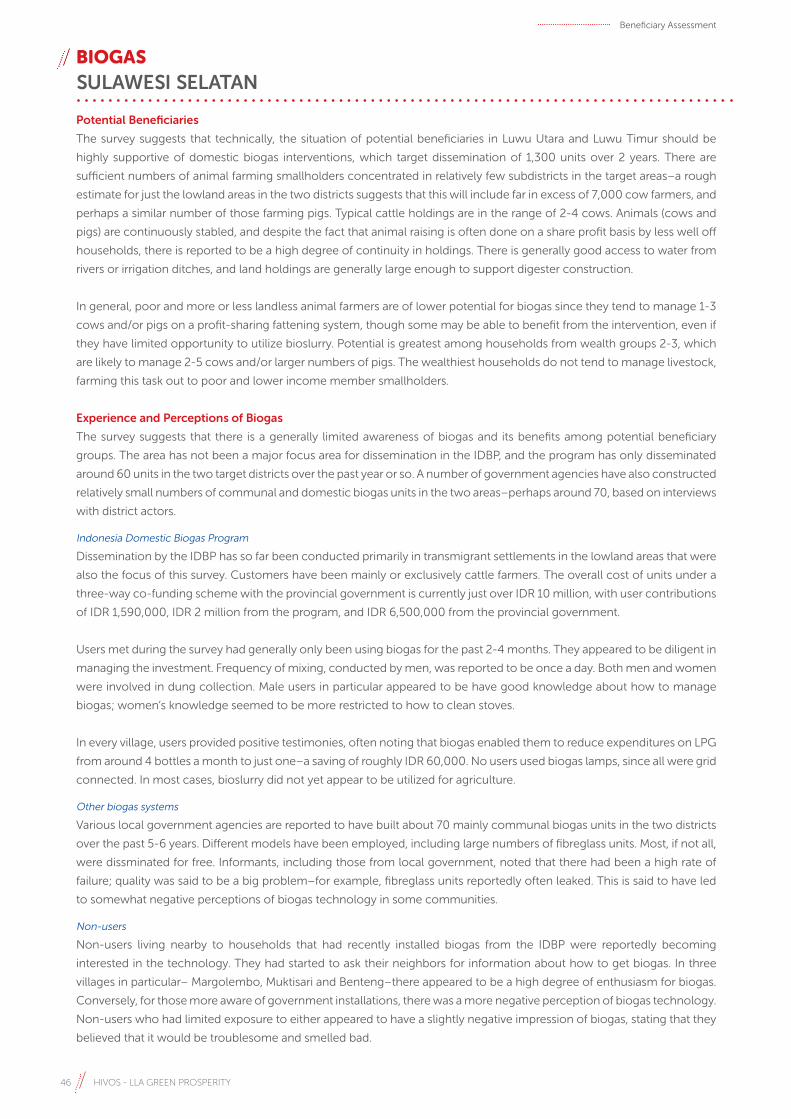
46 HIVOS - LLA GREEN PROSPERITY
Potential Beneficiaries
The survey suggests that technically, the situation of potential beneficiaries in Luwu Utara and Luwu Timur should be
highly supportive of domestic biogas interventions, which target dissemination of 1,300 units over 2 years. There are
sufficient numbers of animal farming smallholders concentrated in relatively few subdistricts in the target areas–a rough
estimate for just the lowland areas in the two districts suggests that this will include far in excess of 7,000 cow farmers, and
perhaps a similar number of those farming pigs. Typical cattle holdings are in the range of 2-4 cows. Animals (cows and
pigs) are continuously stabled, and despite the fact that animal raising is often done on a share profit basis by less well off
households, there is reported to be a high degree of continuity in holdings. There is generally good access to water from
rivers or irrigation ditches, and land holdings are generally large enough to support digester construction.
In general, poor and more or less landless animal farmers are of lower potential for biogas since they tend to manage 1-3
cows and/or pigs on a profit-sharing fattening system, though some may be able to benefit from the intervention, even if
they have limited opportunity to utilize bioslurry. Potential is greatest among households from wealth groups 2-3, which
are likely to manage 2-5 cows and/or larger numbers of pigs. The wealthiest households do not tend to manage livestock,
farming this task out to poor and lower income member smallholders.
Experience and Perceptions of Biogas
The survey suggests that there is a generally limited awareness of biogas and its benefits among potential beneficiary
groups. The area has not been a major focus area for dissemination in the IDBP, and the program has only disseminated
around 60 units in the two target districts over the past year or so. A number of government agencies have also constructed
relatively small numbers of communal and domestic biogas units in the two areas–perhaps around 70, based on interviews
with district actors.
Indonesia Domestic Biogas Program
Dissemination by the IDBP has so far been conducted primarily in transmigrant settlements in the lowland areas that were
also the focus of this survey. Customers have been mainly or exclusively cattle farmers. The overall cost of units under a
three-way co-funding scheme with the provincial government is currently just over IDR 10 million, with user contributions
of IDR 1,590,000, IDR 2 million from the program, and IDR 6,500,000 from the provincial government.
Users met during the survey had generally only been using biogas for the past 2-4 months. They appeared to be diligent in
managing the investment. Frequency of mixing, conducted by men, was reported to be once a day. Both men and women
were involved in dung collection. Male users in particular appeared to be have good knowledge about how to manage
biogas; women’s knowledge seemed to be more restricted to how to clean stoves.
In every village, users provided positive testimonies, often noting that biogas enabled them to reduce expenditures on LPG
from around 4 bottles a month to just one–a saving of roughly IDR 60,000. No users used biogas lamps, since all were grid
connected. In most cases, bioslurry did not yet appear to be utilized for agriculture.
Other biogas systems
Various local government agencies are reported to have built about 70 mainly communal biogas units in the two districts
over the past 5-6 years. Different models have been employed, including large numbers of fibreglass units. Most, if not all,
were dissminated for free. Informants, including those from local government, noted that there had been a high rate of
failure; quality was said to be a big problem–for example, fibreglass units reportedly often leaked. This is said to have led
to somewhat negative perceptions of biogas technology in some communities.
Non-users
Non-users living nearby to households that had recently installed biogas from the IDBP were reportedly becoming
interested in the technology. They had started to ask their neighbors for information about how to get biogas. In three
villages in particular– Margolembo, Muktisari and Benteng–there appeared to be a high degree of enthusiasm for biogas.
Conversely, for those more aware of government installations, there was a more negative perception of biogas technology.
Non-users who had limited exposure to either appeared to have a slightly negative impression of biogas, stating that they
believed that it would be troublesome and smelled bad.
BIOGASSULAWESI SELATAN
Beneficiary Assessment

47 HIVOS - LLA GREEN PROSPERITY
Capacity and Willingness to Pay
Capacity to pay
The capacity of potential beneficiaries Luwu Utara and Luwu Timur to pay for biogas is generally somewhat higher than
in the other project areas. Per capita incomes are somewhat higher than the national average, and the rate of poverty
is significantly lower than in other target districts. Members of the lowest wealth group have limited capacity to pay,
however they state that they would be able to make in-kind labor contributions. For those in wealth group 2 and above,
financial capacity should be sufficient.
Willingness to pay
Despite relatively good ability to pay, however, willingness to pay for biogas appeared to be quite low. For those in the
lowest wealth group, some were interested to provide in-kind labor contributions, but not to pay in cash. For this group,
the fuel substitution effect may be less attractive, since they reduce expenditures on LPG by substituting free firewood.
For those in higher wealth groups, biogas was generally less of a priority than meeting household needs and developing
their income generating activities. Informants in two of the six villages did state readiness to pay up to IDR 2 million, but in
other villages they did not seem to be convinced. The highly successful dissemination of LPG, which is easy to access and
costs just IDR 20,000 for a 3kg bottle, means that these groups have continuous access to a convenient source of cooking
fuel. Expenditures equate to perhaps IDR 80,000 per month. Time spent on wood gathering is not necessarily regarded
as a particular burden. Meanwhile, despite expenditures on fertilizer, the potential benefits of bioslurry are not necessarily
recognized. Indeed, in general manure is underutilized on fields. Limited exposure to and trust in the technology and its
benefits may also be an important factor affecting willingness to pay.
Beneficiary Assessment

48 HIVOS - LLA GREEN PROSPERITY
Potential Beneficiaries
Technically, biogas appears to be highly feasible for very large numbers of smallholder cattle farmers in Lombok. The target
districts have over 350,000 cows, ten times the number in Luwu Utara and Luwu Timur. There are therefore many tens of
thousands of potential beneficiary households–90,000 if we assume a conservative average of four cows per household.
The majority are in the highly populated Lombok Timur and Lombok Tengah districts. Cows are generally permanently
stabled, though around 20% of them may be in communal stables that are usually close to residences. Average holdings
appear to be in the range of 2-4 heads of cattle, though poor landless farmers (the bottom 20% or so by wealth) may only
have holdings of 1-2 cows. Significant numbers of cattle farmers–around 13% based on a BIRU assessment–raise cows
on a profit-sharing basis. For these households, cattle are reared following a fattening mechanism rather than a traditional
‘herd breeding’ mechanism, and there are likely to be times in the year when the household does not have cattle in the
stable.
Technical constraints on biogas utilization for beneficiaries in Lombok include access to water and limited land for biogas
installation. Issues with water access may be a problem in some areas, however limited space by the house for digester
construction is a greater problem. This occurs in densely populated areas with small housing plots–probably more often
in Lombok Timur. A 2010 BIRU survey in Lombok found that 17% of cattle owners interviewed did not have sufficient space
to install biogas.
Many livestock farmers need fertilizer to support their agricultural activities. The survey identifies that cultivation habits
tend towards high usage of chemical inputs, most importantly fertilizer. The typical annual spend of households from
wealth groups 2 and 3 on fertilizer was IDR 630,000 and IDR 1,725,000 respectively. Need for fertilizer is clearly much
higher among the latter wealth group. Non-livestock farming households from both groups buy manure–an average
spend of IDR 250,000 per annum. A significant portion of livestock farmers cannot benefit from manure use, however.
40% of farmers interviewed for the 2010 BIRU market survey did not utilize manure since they had no or limited farmland
on which to use it.
Experience and Perceptions of Biogas
Awareness of biogas among informants in Lombok appeared to be quite high. The island has been a major target area for
the IDBP since roughly 2012, and over 3,000 units have already been installed since this time. Over the past decade or so,
local government agencies, including ESDM, Livestock, KLH and Community Empowerment agencies have conducted
their own biogas programs, reportedly dissminating a few hundred individual and communal biogas units.
Indonesia Domestic Biogas Program
The IDBP already operates across all target districts in Lombok. All nine villages visited had some biogas users. Different
pricing models have been used, including a ‘swadaya’ model in which farmers pay 4-5 million, matched by a contribution
of IDR 2.5 million from the program. About 50 out of a planned 600 digesters are reportedly going to be built using this
model in 2016. Meanwhile, under a more common ‘sharing’ model, local governments provide subsidies of around IDR
3-4 million, the program contributes IDR 2 million, and users are expected to pay IDR 800,000-1.5 millon, including in-
kind contributions. In some cases, installation may be fully subsidized, however users are still asked to provide in-kind
contributions of labor.
BIRU users met during the survey came from low and middle income households. The majority were in what we identify
as wealth group 2 (see above). Lower income households (WG 1 & 2) were generally recipients of higher levels of subsidies
funded by local governments, which target poorer households. Some of the WG 3 recipients had paid much more under
the ‘swadaya’ scheme.
Overall, and with few exceptions, the installations were in continuous use and well maintained, including those built
in 2012-13. Male users in particular had a good understanding of operation and maintenance issues, though women’s
knowledge was often limited to stove cleaning and mixing. Frequency of mixing varied. Many informants reported that
they had begun by filling digesters every one or two days, and those who relied heavily on biogas for cooking continued
LOMBOK
Beneficiary Assessment

49 HIVOS - LLA GREEN PROSPERITY
to do so. Despite this, firewood was still used as a supplementary fuel in most biogas households, including for cooking
water, rice, and when cooking for large numbers. Those who use firewood more frequently report that they now refill
digesters just once or twice per week. A 2013 impact evaluation notes that the need to collect water from a shared source
was mentioned as one of the reasons why some biogas users only fill their digester once or twice a week.
Most informants gave positive testimonies, noting in particular the benefit of substitution for LPG, which reduced household
expenditures and meant that they no longer suffered from periodic shortages of bottled gas, especially around the fasting
month. Users also noted that biogas helped to address the problem of firewood shortage in the rainy season. This tallies
with the results of a recent survey in Lombok and East Java, in which users cited significant timesavings from improved
manure management, cleaning cooking utensils, lighting fires and gathering wood. (Wocan, 2015) All households had
access to electricity and none used biogas lamps. Bioslurry seems to be underutilized, although in every village there were
always a few male informants from wealth groups 2 & 3 who were enthusiastic bioslurry users; their neighbors testified
about the benefits for the farming activities of these users. The finding of bioslurry underutilization appears to tally with
the Wocan survey, which found that only 10% of male and female respondents cited reduction in expenditures on fertilizer
as one of top three benefits. One reason may be that some users have no or limited farmland. Others also find it more
convenient to use chemical fertilizer. (cf. 2010 BIRU market survey)
Other biogas systems
Outside the IDBP, various local government agencies in Lombok have reportedly installed a few hundred domestic and
communal biogas units. Based on reports from informants and local government staff, the quality of these installations
has generally been quite problematic. Some are apparently still used for cooking, though many have been abandoned.
A 2010 survey in Lombok for Hivos found that most pilot projects from local government did not function optimally and
could not be utilised by households; as a result, “many of the biodigesters stand as monuments.”
Non-users
Among non-users, perceptions of biogas have changed quite radically since a 2010 survey found that 71% of respondents
did not know or understand biogas technology. This survey found that BIRU is now quite widely known among non-users,
who generally perceive installations to be of good quality, in comparison to other local installations. Levels of trust in BIRU
seemed to be quite high. The dominant non-user perception of biogas was that it helps to reduce LPG consumption.
However, in three or four villages, informants from wealth groups 3 & 4 opined that biogas was ‘troublesome’. Biogas is
not widely known for its potential to produce organic fertilizer.
Beneficiary Assessment
@MaxRichter/Sumba/2016

50 HIVOS - LLA GREEN PROSPERITY
Capacity and Willingness to Pay
Capacity to pay
The capacity of livestock farmers in Lombok to pay for biogas is somewhat lower than in South Sulawesi–though of
course, there are many more smallholder cattle farmers in this area, so overall potential is still much higher. Those who
belong to wealth group 1, mainly landless farmers or laborers, may manage 1-2 head of cattle on a profit sharing basis.
This group has typical monthly expenditures of just IDR 1,350,000 per household. Its members report very limited capacity
to pay, but do express interest in making in-kind contributions in labor or in the form of materials like sand. Members of
wealth groups 2 and above–the majority of livestock farmers–do have better capacity to pay. For these groups, typical
monthly household expenditures are upwards of IDR 2 million. However, as noted in the BIRU assessment, the availability
of affordable credit is a key factor in supporting capacity to meet farmer investment costs.
Willingness to pay
Cost savings through LPG substitution are generally perceived by non-users as the major reason to adopt biogas. As in the
surveyed areas in South Sulawesi, LPG dissemination in Lombok has been highly successful, and potential beneficiaries
have easy access to bottled gas, a clean and convenient cooking fuel, at fairly low prices. The household expenditure
analysis shows that for those in wealth group 3, expenditures on gas are about IDR 50,000 per month. Meanwhile, for
those in wealth groups 1 and 2–perhaps 60% of the island’s population–typical monthly expenditures on LPG are IDR
20,000 and IDR 30,000 respectively. For these households, substitution with free firewood is widespread. Periodic higher
prices and gas shortages are a gripe but not a big incentive to switch. Time spent gathering firewood is also not regarded
as a major burden–amounting as it does for individuals to an average of just 20 minutes a day, according to a recent study.
(Wocan, 2015) As a result of the tendency for biogas users to continue to supplement with firewood, the same study
shows that average individual timesavings are just 7 minutes per day. It is worth noting that, cumulatively, labor saving
benefits for users for e.g. lighting fires, cleaning utensils and manure management are very significant, leading to net
average time savings of 1.1 hours per day for women at least. However, these benefits are not on the radar for non-users.
They also do not usually recognize bioslurry use for fertilizer as a potential benefit.
Informant reports on willingness to pay are mixed. In one in three villages in each target district–Lendang Nangke, Bon
Jeruk and Senaru–farmers from wealth groups 2 and above were queuing up to become biogas users under the highly
subsidized sharing mechanism, in which they pay up to around IDR 1.5 million. But in other villages, particularly in Lombok
Timur, many farmers appeared to have an ‘aid mentality’, and were only interested to adopt biogas under full subsidy. A
few farmers from wealth group 3 have proven to be willing to pay significantly more, in the range IDR 4-5 million.
Beneficiary Assessment
51 HIVOS - LLA GREEN PROSPERITY
Potential Beneficiaries
Despite the quite large numbers of livestock in Sumba, significantly more than in Luwu Utara and Luwu Timur, the
technical feasibility of biogas for livestock farmers appears to be much lower in this area. Cattle have been more or less
discounted for biogas due to limited stabling practices, which pose difficulties for dung collection and may be hard to
change. Here, pigs are the main potential source of manure. There are around 250,000 pigs in Sumba–a little under two
for every household. All things being equal, Sumba Tengah stands out as having the highest levels of pig ownership–an
average of four pigs to each household; Sumba Barat Daya appears to be the least potential district, with an average of
less than one pig per household. Subdistricts that stand out for high levels of pig ownership include Umbu Ratu Nggay,
Katikatuna & Katikatuna Selatan (Sumba Tengah) and Laboya Barat (Sumba Barat). Households in the lowest weath group–
an estimated 30% of the population–may keep 2-4 pigs, while those in higher wealth brackets may keep up to six. Profit
sharing arrangements do not seem to be very widespread in Sumba, unlike in the other project areas. Pig rearing practices
are somewhat supportive for biogas, as many are stabled under the home or kept close to the house, though they appear
less promising than for pig farmers in Sulawesi Selatan.
In addition to limitations for biogas due to size of pig holdings, fluctuation in holdings is another limitation, as animals
are used for ceremonial exchange and slaughter. As noted in the 2011 biogas survey for Sumba, water access is also a
somewhat limiting factor for biogas. This previous survey included a rough estimate that about 40 percent of households
in Sumba do not have access to water all the time. Water access appears to be a particular issue in the central and western
parts of the island.
Most rural households depend on subsistence farming of e.g. rice, corn, cassava and sweet potato for their livelihoods;
cash crops such as cashew, coffee, cocoa and candlenut are also grown, but are a less substantial part of the rural economy
than in the other two project areas.
Experience and Perceptions of Biogas
The 2011 Hivos/SNV survey for biogas in Sumba noted that biogas was, “a completely new concept for ordinary
Sumbanese people,” though it noted that people seemed quite receptive to new technology. Since this time, the IDBP has
developed around 500 units on the island. Outside this program, various local government departments have supported
the disseination of somewhere in the region of 100-200 biogas units, mainly individual/domestic, most of them over the
past five years. While more people have been exposed to biogas since the initial survey, researchers noted that knowledge
about the technology remains limited. However, they confirm that farmers appear to be interested, even if they have
somewhat limited information about the technology.
Indonesia Domestic Biogas Program
The IDBP operates in all four target districts in Sumba. However, researchers encountered a few biogas users in only three
of the eight villages visited for this research, in Sumba Timur and Sumba Barat Daya districts. In one of these villages–
Dikera–it is subsequently reported that units branded with the program logo may in fact have been developed outside
of the program by one construction partner that has now been cut. The average cost of installing a digester in Sumba is
higher than in Lombok due to higher materials and operational costs. Currently around 70% of the cost is subsidized by
program and government subsidies. Users contribute 30% of the total cost, primarily through contributions for labor and
operational costs of installation. Such contributions are often made in-kind.
In general, biogas installations appeared to operate well. Men play the most active role in managing biogas, and most
mixed dung every day. Although informants appeared to have good knowledge about how to operate installations,
capacity for maintenance was limited. However, users noted that aftersales services were good, and had good relations
with construction partners. One exception was Dikera village, where it appears that one construction partner, since cut,
may have disseminated BIRU-branded installations off-program, with local government support. Here, informants noted
that a number of digesters had been poorly constructed or broken down. A digester owned by the village head, which
had a broken gas pipe, had been unused for around one year. This contrasted with the experience in other places, where
beneficiaries continued to use biogas for daily cooking needs. A few beneficiaries were enthusiastic bioslurry users, and
testified to its benefits in increasing productivity.
SUMBA
Beneficiary Assessment

52 HIVOS - LLA GREEN PROSPERITY
Other biogas systems
The 2011 Hivos/SNV biogas feasibility study for Sumba noted that since 2007 around 40 high cost biogas plants had been
installed by a variety of NGOs or other actors, fully funded by local government. Local Livestock Departments appeared to
be the main agency involved in biogas development at this time. At the time of the 2011 survey, it was noted that biogas
dissemination lacked participation or ownership, and that none or few of these plants continued to operate. Since this
time, various other local government agencies, including ESDM and BLH have installed limited numbers of fully subsidized
biogas units, focussing primarily in and around urban areas. Dissemination reportedly continues to be affected by problems
with quality and maintenance. Users understand little about maintenance and lack technical support in case of problems.
As a result, many more recent installations have also ceased to function. This has had some negative impact on local
perceptions of biogas.
Non-users
In general, non-users appeared to have quite limited knowledge about biogas, though most still expressed interest in the
technology.
Capacity and Willingness to Pay
Capacity to pay
The 2011 feasibility study for biogas in Sumba notes that the purchasing power of rural Sumbanese seems very low, and
concludes that expecting a financial contribution from the households for installing biogas plants seems far from realistic.
For the poorest farmers, who constitute perhaps 30% of the rural population, biogas is probably not a feasible option due
to limited animal holdings, quite apart from capacity to make cash or in-kind contributions. For those in higher wealth
brackets, cash payment should be an option, particularly with subsidy levels of 70% and low-interest credit or in-kind
contribution plans [refer to HEA]. People in higher wealth brackets have somewhat greater capacity to pay, particularly
at high subsidy levels of around 70% and with contributions in kind, which have been used for dissemination in Sumba.
Capacity to pay may be greater at certain times– e.g. following harvest (e.g. Mente); outside those times can be difficult.
Willingness to pay
Potential beneficiaries may perceive limited financial benefit in fuel substitution. Financial savings are minimal; almost
100% of cooking in rural Sumba uses collected firewood, which is free. This survey did not establish length of time women
and men take to gather firewood, but informants for this exercise did not seem to view firewood collection as a major
burden, since it was generally done in the course of other activities such as returning from the farm, or may be gathered
close to the house. A limited 2015 Sumba market survey does however provides a figure for firewood collection of 1-2
hours per day per individual, which is substantial. Nevertheless, even if substituting for some cooking needs, firewood
usually continues to be used, reducing time saved. In fact, households in Sumba report that they need to use firewood,
since the smoke helps to prevent storage beetle infestation in corn, which is stored in the roof.
Meanwhile, Sumbanese farmers currently expend much less on fertilizer than in the other project areas, and may therefore
perceive limited financial incentive in the substitution of bioslurry. Households in wealth group 1–roughly the bottom
30% of the island’s population by wealth–typically have no expenditures on fertilizer. Even households in wealth group 2,
which includes most of the rural population, typically only spend around IDR 450,000 on fertilizer annually. Manure is also
underutilized, due perhaps in part to difficulties with collection. Distance to farm is an additional disincentive, particularly
in Sumba Timur.
This would seem to make it more challenging to sell biogas in Sumba. On the plus side, however, with high subsidy,
many informants reported willingness to contribute materials toward construction. Non-users–particularly men–were
also receptive to and even interested in the technology, and some may view its use as a sign of greater sophistication
or status. The experience of some ‘visionary’ bioslurry users also suggests that it is possible to gain converts and change
long-standing practices. Conversely, for the relatively small group of well off households, who may have quite large animal
holdings, biogas may not be attractive, since it might–like in other areas–be perceived as troublesome. This group may
also benefit from the labor of other less well off household members to manage cattle, gather firewood, cook and plant
fields, and so may perceive little personal benefit from biogas. These findings seem to more or less tally with the 2011
survey, which notes that, “the interesting image obtained in Sumba is that people who want to pay have no money and
people who have money do not want to pay.”
Beneficiary Assessment

53 HIVOS - LLA GREEN PROSPERITY
MICRO MILLING EQUIPMENT
Overview
The proposed solar PV agro-processing interventions include the dissemination of 50 small mills on a lease-purchase
basis to local operators, to serve household processing needs. Based on feasibility and pilot studies annexed to the MCA-I
proposal, corn mills have been assessed to account for the majority of demand and are the main focus of interventions,
which will include the dissemination of a small number of rice mills.
Corn is a highly important crop for food and animal feed in Sumba. District reports for 2014/15 suggest that about 50,000
ha are used for corn cultivation, and place annual production at around 170,000 tons–equivalent to about 1.2 tons per
household per year. Sumba Barat Daya district is the centre of corn production, producing 65% of the crop, despite
accounting for only about 40% of the island’s population. Production in SBD is roughly two to three times the amount of
corn produced in each of the other districts. Production in the remaining districts is more or less in line with population
figures.
In most households, corn is stored in the rooftop. Here, smoke from woodfires helps to prevent infestation by storage
beetles. Stored corn is generally available for consumption and animal fodder throughout the year. It is peeled and ground
in small quantities daily and often mixed and cooked with rice. Small scale milling services are not locally available in many
areas, and many women must pound corn manually to meet daily household needs, adding significantly to the burden
of domestic labor.
A feasibility study on corn peeling and milling for the MCA-I project notes that through the installation of such agro-
processing equipment, “women will be able to allocate their time for generating income through for example weaving
activities [or for] other productive activities in the field or in their house.” The target is to install 50 solar PV micro-milling
systems in villages whose members spend up to one hour per day grinding corn by hand to make meal. Each mill should
serve an average 50 users, generating overall beneficiary numbers of 2,500 people.
Needs and Constraints
There is no current mapping of corn milling services in Sumba. In all villages visited for this survey there were one or
two small generator operated mills. But even where a mill was located within the same sub-village (dusun), distances to
the mill were sometimes too great to justify the trip. In one village–Cendana Barat–a ‘roving mill’ was operated out of a
modified vehicle, helping to overcome this problem. Observations from the survey suggest that a significant portion of
the population in most villages is not served by milling equipment sufficiently close to the house.
Beneficiary Assessment
@MaxRichter/Sumba/2016

54 HIVOS - LLA GREEN PROSPERITY
Milled corn does not store long, and it is reported that typical amounts milled by machine are in the range of 10-15 kg. As
one background report for a village in SBD annexed to the MCA-I proposal notes, round trip payments of IDR 20,000 for
motorcycle taxi to a corn mill made this service prohibitively expensive. Partner staff assess that people may only travel by
foot to access corn milling services, for a distance of up to one kilometer. This suggests there may be pent up demand for
local milling services.
Assuming demand for local milling services, one reason for current limitations in supply may be that distance to buy diesel
may disincentivise entrepreneurs. One partner noted an impression that there are generally fewer mills as distance from
fuel outlets increases. In addition, financial models developed by the partners suggest that it may take around three years
to recoup initial investment costs of roughly USD 500.
Pounding or milling corn is women’s work. Manual pounding of dried smoked corn is typically done in small batches on a
flat mortar. Informants noted that they may pound 3-5 kilograms of corn every day; this appears to be in line with reports
by program partners, which consider consumption of 0.4 kg of corn a normal amount per adult/day (equating to about 2
kg/day for a normal household) plus 2.5 kg/day used for animal feed. The impression from the survey was that women may
often spend around one hour a day on this activity. This is in line with the figure cited in the project proposal.
Capacity and Willingness to Pay
Financial models developed for the proposed interventions suggest that a household that mills 2kg of corn daily will pay
in the region of IDR 24,000 (USD 1.8) for corn milling services every month. Such payments should be within the means
of a majority of households. In addition, it is apparently a common practice for corn mill operators to accept in-kind
payments, for example a percentage of corn milled may be provided as part payment for the service.
Corn mills seem to be a quite popular intervention among potential beneficiaries, particularly women, as noted in
scoping reports and confirmed during this field survey. For informants in Sumba, corn milling was one of the more
priority interventions, above PV charged lanterns. As one male informant noted, “the stomach comes first.” Informants
in remote Lailunggi village were particularly enthusiastic, noting that this intervention would reduce the daily burden of
pounding corn for women.
Daily timesavings may not be a major reason for interest in using milling service. Assuming, optimistically, that the
round trip plus time spent at the mill averages just 30 minutes, timesavings may equate to half an hour a day. However,
pounding corn is hard work, and it is probably preferable to visit a mill.
For entrepreneurs, the provision of the equipment on a lease purchase basis appears to be a fairly attractive proposition,
compared to the upfront cost of buying a mill. Operating a small corn mill does not appear to be highly profitable
endeavor, however, and it may be that it will be less attractive to operate as a standalone service than if it is integrated
into other livelihood activities (such as operation of a kiosk, provision of other services, or nearby the household).
Targeting
One factor in targeting, noted in the proposal, is that at least the first batch of 25 mills will be deployed in villages where
other RE interventions such as solar PV lighting are being conducted. These interventions fall outside the scope of this
program, but it is noted that this targeting strategy supports feasibility, since it means that operational costs of collecting
fees and servicing may be significantly reduced.
VIA already has a policy to avoid the siting of PV mills in localities that are already served by an existing milling facility;
competition or conflict is not a concern.
While cooperative arrangements may be an option in some cases, it seems likely that supporting the development of
individual entrepreneurial operations will be a much less complex task, and it is expected that this will be the dominant
approach.
The intervention appears to provide a good opportunity to empower women, as ‘energy entrepreneurs’ and as users,
and targets include at least 30% women operators.
Beneficiary Assessment

55 HIVOS - LLA GREEN PROSPERITY
SCHOOL PV SYSTEMS
Overview
There are about 750 elementary schools (SD) in Sumba, just over half of them state run (all figures from Dalam Angka
2014/15 unless otherwise noted). Data gathered by Winrock from district Pendidikan Pemuda & Olahraga agencies from
2014 shows that 646 of these are without electricity. Reported pupil numbers for state elementary schools vary between
sub-districts, but average 170 pupils per school in Sumba Timur and Sumba Tengah, 250 in Sumba Barat and 311 in Sumba
Barat Daya. Only about one third of Sumba’s sub-districts have an average of over 250 pupils per school; the vast majority
of these are in Sumba Barat and Sumba Barat Daya. Only in the latter area are there a few subdistricts in which schools
generally have over 350 pupils.
Sumba also has just over 200 junior high schools, of which about 80% are state run. The average numbers of pupils in a
typical junior high school is in the range 200-250, though numbers vary from as little as 50 in one or two subdistricts to
over 350 in a handful of others. Only about one-quarter of the 44 subdistricts in Sumba have an average of more than 250
pupils per school; these are scattered across the project districts. Junior high school size in Sumba Tengah is particularly
low, averaging just 124 pupils per school.
The average elementary and junior high school is assigned around 15 teachers, with the exception of Sumba Barat Daya,
where there are on average just 5-7 teachers per school. During interviews, informants from the local education agency
in the latter area noted a particular problem with teacher shortages in this district.
Needs and Constraints
The proposal to the MCA-I notes that the dissemination of lanterns through schools is based on, “the conviction that
students that have light by which to study in the evenings will perform better in school and have better livelihoods
throughout their lifetimes.” It may be assumed that school electrification itself shares a similar purpose, to contribute to
improved educational outcomes and improved livelihoods in the longer term.
There are many constraints, material and non-material, in relation to education in Sumba. Poor infrastructure and facilities
impact on the learning environment. The observed physical condition of school buildings and classrooms ranged from
fair to very poor in three schools visited for the fieldwork. Failing infrastructure seems to be a widespread problem, at least
in Sumba Timur, where district statistics show that about half of classrooms are in ‘poor’ or ‘very poor’ condition (Dalam
Angka, 2015; this data was not presented in the reports of other districts).
Facilities are also limited, partly due to lack of electricity. Winrock studies annexed to the MCA-I proposal identify that
about 650 schools in Sumba do not have electricity, and state that this is needed primarily for lighting, A/V equipment,
handphone charging and water pumping; though lighting may be of limited benefit except for teachers staying on school
premises. Winrock staff report that many rural schools have computers, printers, TV, power amplifier and lights supplied
by local government, but that these are unused due to lack of electricity. A teacher in one of the three schools visited
for this study, in Kalembu Kaha, also noted that pumped water was arguably the most important issue in his school to be
resolved by electrification. Small semipermanent generators are too expensive for schools to run. Electricity is not the only
issue, however: a 2010 study by Bappenas/ Unicef in rural Sumba Timur noted pupil complaints broken chairs and having
to fight with classmates to get a seat. Books are also in very limited supply.
Other factors that impact on learning may include limited teacher numbers, teacher quality and teacher absenteeism.
In addition, school children also sometimes face long journeys to school on foot. They may also be heavily engaged in
domestic chores after school including cooking, washing, taking care of younger siblings, fetching animal fodder, water
and firewood, and working on farms (Bappenas/Unicef, 2010). In one study, pupils complained about limited leisure time,
and this–in addition to limited lighting conditions–may affect capacity to study at home (ibid). A baseline study for Sumba
found that only about one-third of under-13s regularly do schoolwork at home (JRI, 2013).
Aspiration, and opportunity, may also be quite significant issues. The sentiment among informants generally appeared
to be that they hoped their children would have a better future, and that lanterns would surely help with this. However,
aspirations for education may be tempered by scepticism about its use. As one informant noted, his father was a farmer,
he is a farmer, and he expects that his children will be as well. Teachers may also place limited priority on professional
Beneficiary Assessment

56 HIVOS - LLA GREEN PROSPERITY
development, though they undoubtedly also face practical challenges in this respect due to poor connectivity and lack of
electricity for lighting or to power computers.
Previous Experiences
Four of the eight villages visited had schools with solar PV installed by Winrock; these included Umamanu, Cendana Barat,
Kalembu Kaha and Dikera villages. Three schools were visited, and discussions were held with a number of informants in
relation to lanterns and schools. However, these were limited due to time constraints, and it was only possible to hold one
focus group meeting with teachers in Kalembu Kaha in SBD.
Even despite poor condition of the school infrastracture in visited schools, the PV systems observed appeared to be
functioning well and were being maintained, with the arrays kept reasonably clean. Most lanterns also appeared to be in
good working condition.
In line with Winrock reports that electricity has improved teaching quality and is used for administration, reporting and
other productive activities, one teacher in Umamamu noted that electrification has improved teaching by enabling her to
print documents such as lesson plans. Hivos staff note that such improvements are commonly reported by teachers. In
addition, Winrock staff note that teachers may lodge in dorms, in houses bordering school facilities, and on rare occasions
in empty classrooms that have been transformed into a dorm. In general, teachers are reported to be very enthusiastic
about electrification, and during the survey, they noted that a significant benefit of electrification was that it enabled them
to study at night. Schools are also able to get small fees through the provision of public services such as charging phones,
laptops and printing.
During discussions, Hivos and Winrock staff noted that raising awareness about how to exploit school PV installations is
important in order to maximize the benefits. Some schools reportedly show more creativity than others in utilizing energy;
one example cited was of two schools that conducted evening classes for pupils prior to the national examination. Some
school staff are said to believe that it is important to ‘save energy’, and this can become an obstacle to maximizing its use.
Teachers may also be uncertain and need guidance about what is ‘right’ and ‘wrong’–for example, they may consider
using televisions is wrong despite the potential for use as an educational tool. For this reason, Winrock proposes to provide
trainings on the proper uses and potential uses for installations.
Capacity and Willingness to Pay
School PV systems
It seems more or less uncontentious that schools will in general be happy to receive support for electrification using solar
PV systems, particularly when they understand that there is a strong focus on servicing and sustainability. ‘Socialization’
is a key issue, however, since there is a general legacy of scepticism around solar PV interventions due previous failed
interventions. One village leader noted that he would be happy if interventions were provided by NGOs, due to concerns
about the quality and servicing local government installations. These seem like popular interventions. A greater issue,
noted above, would appear to be around maximizing the impact of interventions.
Beneficiary Assessment
@MaxRichter/Sumba/2016

57 HIVOS - LLA GREEN PROSPERITY
The general impression is that schools should have good ability to pay. The head of one local education department has
confirmed (to Winrock) that use of School Operational Funds (BOS) to pay for utilities is normal practice, and will not be
a problem in relation to solar PV systems. These funds currently equate to IDR 800,000 per pupil in elementary schools,
IDR 1 million per pupil in junior highs, and IDR 1.2 million in senior high schools. However, one issue that is said to affect
school ability to pay are cases in which schools are ‘attached’ or under the authoritiy of a ‘sekolah induk’, and do not
control the use of BOS funds. The field survey received no information this issue, which was noted by Winrock staff, and
is apparently factored in to school assessments.
School-based lantern dissemination
A more comprehensive discussion of lanterns and their targeting may be found below. Specifically in relation to the
distribution of lanterns through schools, many parents did express positive sentiments about the idea that lanterns would
help their children to study at home. However, potential beneficiaries noted various concerns, including that children may
lose lanterns, that they would drop and break them, or that the lanterns may suffer water damage due to rain. Although
these issues are addressed in the lantern design and intervention model, project partners recognize the need for good
socialization to address such concerns.
School Selection/ Targeting
The intervention model for PV schools in Sumba anticipates an average of 320 students and teachers per school, such
that electrification of 25 schools will benefit 8,000 students and teachers, including 1,000 girls. It is envisaged that
dissemination of 6,000 lanterns through schools will be mainly to families of pupils or to teachers. If all lanterns are
disseminated in this way, an average 240 pupils or teachers per school will need to sign up for one lantern each.
The proposal to the MCA-I notes that since large elementary schools are often stationed close to large junior and senior
high schools, only one type of school would be targeted in order to avoid overlap of potential lantern beneficiaries–though
in fact the targeting process should easily be able to prevent overlap without this stricture. Based on the Winrock reports
annexed to this proposal, it is noted that concerns about security against vandalism or theft appear to be somewhat of a
risk and place constraints on site selection.
The proposal explains that the decision to target elementary schools would have, “the added benefit of encouraging
primary school students, who are assumed to be the most important to educate for community development, to attend
school.” However, improvement to educational experience may be at least as important an issue for junior or senior high
students. These students in fact experience greater burdens; for example, distance to school is likely to be greater for
junior high pupils given the more limited number of schools. In addition, chores at home and on the farm are likely to be
heavier at this age. It may also be assumed that educational benefits for high students are greater, given e.g. the greater
potential for use of computers, AV equipment and printing to contribute to their education. This group is also more likely
to benefit from using lanterns to study, though relatively few children are currently in the habit of doing schoolwork at
home.
A more pragmatic reason for selecting elementary schools is to facilitate lantern dissemination, and to meet beneficiary
numbers. SD pupils attend school for six years, compared to just three years for SMP, and this may provide a more stable
base of lantern users. Average numbers of pupils per school also appear to be a bit lower for junior high than elementary
schools, and since there are many fewer junior high schools overall, it will be more difficult to identify schools with
comparatively large numbers of pupils and teachers. Targeting SMP may therefore pose a greater challenge for meeting
beneficiary targets; it may also make it more difficult to disseminate lanterns, and lead to a less stable user base in the
medium term.
But it is not clear that these are insurmountable problems. Indeed, there may be an upside to greater pupil turnover in
high schools since it may help to reach a larger potential user base for lanterns. The proposal mentions clustering of
schools, and it is possible that if graduates go to a nearby senior high, the user base may be more stable than anticipated.
Meanwhile, assumptions about benefits remain to be tested, and may be greater for SMP pupils. Winrock has already
established a pilot project in an SMP in Kataka, where lanterns are distributed to SD and SMP students. It is recommended
that this project should also deliberately include a number of high schools in order to further develop and test the benefits
of interventions in these schools.
Beneficiary Assessment

58 HIVOS - LLA GREEN PROSPERITY
LANTERNS
Overview
The proposal to the MCA-I notes that many people in rural Sumba live in homes with no lighting or where lighting is
provided by costly and polluted kerosene lamps, resulting in limited opportunities for at-home study and other productive
activities. Under the proposed interventions, Winrock will support the dissemination of 7,000 lanterns that can be charged
at local schools or kiosk charging stations. Of these, most–6,000 units–will be disseminated through the 25 schools
targeted for solar PV electrification; charging stations will be installed in all schools as part of the intervention.
The rationale for this intervention is discussed in the project proposal submitted to MCA-I, which notes that 2013, Sumba
had an electrification ratio of only 25%, a consequence of a dispersed population and the high cost of grid extension. This
lack of electricity limits economic growth, and in particular hinders education and health services, as well as productive
activities after daylight hours, such as handicrafts and tailoring. When lighting is used, it is typically provided by kerosene
lamps that are costly to operate, produce indoor and outdoor pollution, and pose fire hazards.
Needs and Constraints
Many households in Sumba rely on kerosene lamps for lighting. A 2013 baseline survey for the Sumba Iconic Island
program identified that overall 51% of households in Sumba rely on traditional kerosene-fuelled tin lamps for lighting. The
proportion of households that rely on kerosene for lighting is higher in rural areas, where most households lack access to
the grid.
Over recent years, there has been some fluctuation in the level of reliance on kerosene lighting due to the dissemination
of many government-sponsored SEHEN lantern and charging kits, and their subsequent widespread repossession due to
the failure of many households to pay retributions. For example, a VIA report annexed to the proposal relates that nearly
50% of households in the Sumba Tengah district, where approximately three-quarters of households are off-grid, received
SEHEN solar PV lantern or charging stations since 2013 (VIA 2015). This left less than one-fifth (2,000) households without
access to electricity, at least for lighting. However, the vast majority of households defaulted on payments over the first
year of the program, leading to the repossession of around three-quarters of SEHEN systems (most of the remainder could
not be recovered due to resistence from villagers). Following this large-scale repossession, VIA estimates that around 50%
of off-grid households in the district rely on kerosene for lighting.
The lack of lighting and use of traditional kerosene lamps means that a majority of rural households in Sumba lack
adequate lighting for at-home study or other productive activities. In a limited market survey recently conducted for SII,
71% of respondents answered that it was difficult for children to study in the evening due to insufficient lighting (Hivos,
2015). Traditional kerosene lamps are also dirty and polluting, and pose a fire risk.
Previous experiences
Many communities in Sumba have experience of solar PV technologies, in particular through the dissemination of PLN
SEHEN lantern and charging systems and through distribution of a smaller number of Solar Home Systems by various local
government agencies, including by Dinas ESDM.
In all four districts in Sumba, PLN SEHEN and local government-sponsored SHS projects have had some negative impacts,
because they (i) were poor quality, and failed within a relatively short time frame; (ii) lacked provision and/or effective
socialization about technical assistance and access to parts; (iii) lacked effective socialization and enforcement of payment
mechanisms, particularly in the case of the fee-based SEHEN program.
Reports annexed to the MCA-I proposal note that the provision of charging modules to households in the SEHEN program,
which experienced a high rate of defaults, provides a lesson for the design of the proposed lantern interventions (Winrock
2015; VIA 2015). In the proposed project, charging stations will provide services only when fees are paid, ensuring that
problems with defaults can be avoided. The proposed systems for payments, servicing and technical assistance, which
will involve trained service centre staff and operators, also respond to problems affecting previous interventions in the
area. The selection of appliances also takes into consideration issues of quality and durability that have affected previous
interventions.
Beneficiary Assessment

59 HIVOS - LLA GREEN PROSPERITY
Capacity and Willingness to Pay
In the intervention model described by Winrock staff, lanterns will be provided to prospective users prepared to pay a
small deposit of around IDR 50,000. Cost per charge, provided at schools or local kiosks, will be IDR 1,300 (or IDR 1,787
as described in the submitted model). Winrock anticipates that the typical household may charge a lantern 15 times per
month. Typical monthly costs for lantern users will therefore be in the region of IDR 19,500 per month (or IDR 26,805 if a
higher charging rate is applied). Following 300 charges–a period of 20 months based on continuous usage– households
gain ownership of the lantern and charging may be provided at reduced rates.
The household economic analysis conducted for this LLA shows that households in the bottom two wealth groups–the
majority of the rural population–currently pay around IDR 30,000 (USD 2.3) per month for kerosene. This figure seems to
be more or less in line with the results of a limited market survey conducted for the Sumba Iconic Island project in 2015
(Hivos, 2015). Kerosene is mainly used in traditional pelita tin lamps, though many households note that the fuel is used
as a trigger for lighting firewood.
The cost of charging lanterns in the proposed interventions is less than current household expenditures on kerosene for
lighting, even among typical households in the poorest wealth group. Even bearing in mind that some continued use
of kerosene may be anticipated in lantern using households, to provide an additional light source, the required routine
expenditures for lighting appear not far different from current expenditures among the majority of households.
The project partners have interviewed 600+ people in over 60 villages in all four districts of Sumba and asked about the
idea of charging stations, leasing lanterns, price of charging and wiliness to pay. The overall conclusion, which accords
with the above, was that the need for the lanterns is there, and that willingness to pay (in general) is also no issue. However,
research for the LLA also accords with partner findings that there may be issues around the capacity of households to
access cash at all times of year. The survey suggests that this may be an issue for poorer households, particularly around
the start of the year, when seasonal calendars suggest that agricultural labor opportunities are generally most limited.
Cash flow in other households is also affected by the timing of harvests. Nevertheless, as noted above, most households
do currently make routine outlays for kerosene to light their homes, and these appear similar to those anticipated for
lantern charging, suggesting that project implementers will be able to develop payment systems appropriate to the
proposed intervention.
Selection / Targeting
The survey identifies no specific issues in relation to targeting for lanterns. Factors that will reportedly be used for site
selection include, in addition to school size, the balance of information on electricity access, distance from main grid and,
for schools, the presence of educational programs from district education agencies.
Beneficiary Assessment

60 HIVOS - LLA GREEN PROSPERITY
SOLAR KIOSKS
Beginning in late 2013, a series of studies documented difficulties with the SEHEN solar home program due to ineffective
fee collection and poor maintenance program implementation. The same studies determined that remote kiosks with
lantern charging would be a cost effective way to provide lighting to remote villages, and if properly implemented, could
avoid many of the issues experienced under the SEHEN program. The project consortium plans to install 20 remote
solar lantern charging stations in so-called “Solar Kiosks”. Each Solar Charging Kiosk will have 0.3 kW PV that will charge
solar lanterns and hand phones and will be located throughout Sumba. They will lease out or sell 1,000 lanterns. This
activity aims to address these issues and increase access to lighting and electricity for charging cell phones to improve the
livelihoods of 5,000 individuals.
In general, the issues of feasibility for lantern dissemination through remote energy kiosks are covered in the above sections
on lantern dissemination. These conclude that in general, there is sufficient capacity and willingness to pay among the
proposed users, but underline that there may be some challenges in developing payment systems given issues of limited
cash flow at some times of the year. In central Sumba project partner VIA has a solar lantern leasing program running, in
which agents do the “sales and service” and end-users receive complete systems (inclusive the solar panels). This system
is reported to be so far running well, though it has encountered some challenges with payments. The partners note that
payments following harvest may be explored in order to support sustainability. Winrock and VIA are also looking into Pay-
To-Go possibilities following the experiences gained in the telecom sector with “pre-paid” phone cards.
The partners note that a key to success will be a proper awareness campaign, in which payment mechanisms, charging
and operation of lanterns and charging stations are clearly explained to the end-users and kiosk owners. In addition, the
two service centers are expected to play a critical role in supporting sustainability, including through the provision of
maintenance services so that the lanterns will be kept in working condition.
The location of the kiosks might be a challenge in settlements where houses are scattered over a wide area. This would
mean that besides the daily collection of fire wood, getting water and walking to school or farms, the end-users would
have to walk at least twice a week to the lantern charging stations, wait there till the lantern is fully charged (4 hours) and
head back to their houses. In such areas, partners anticipate that it will be best to combine kiosks with a store, a market
place or corn/rice grinding facility. Determining the best set up for kiosks in existing stores, entrepreneurs’ homes, or other
community determined locations will need to be adapted to each region and even on a case by case basis. The proposal
pointed to the set-up of local cooperatives for the charging kiosks, however partners will need to explore the viability of
this approach against other options of working with local entrepreneurial operators.
Beneficiary Assessment

STAKEHOLDER ASSESSMENT

62 HIVOS - LLA GREEN PROSPERITY
The project is aligned with the Indonesian government’s priorities for energy sector development, including reduction of
GHG emissions and the achievement of near universal access, in particular through remote area electrification. Indonesia
is committed to at least 29% reduction in projected GHG emissions by 2030, and targets 25% renewable energy by 2025.
The current administration has also initiated an ambitious drive for near-universal coverage, with a focus on remote rural
areas, primarily in Eastern Indonesia. The potential for RE technologies to serve the energy needs of off-grid users is
quite well recognized, and there is a history of support for the dissemination of such technologies by national and local
governments, and state electricity provider PLN.
The Directorate General for New Renewable Energy and Energy Conservation (DGNREEC), Directorate Bio-Energy, of the
Indonesian Ministry of Energy and Mineral Resources (MEMR) is a key national counterpart for Hivos and its partners for
the Indonesia Domestic Biogas Program (IDBP) and the Sumba Iconic Island (SII) programs. One of the significant roles of
the DGNREEC is that they play an intermediary role, linking Hivos and its partners to provincial and district governments.
Hivos implements the biogas program under an MoU with the DGNREEC, which is currently being extended to the end
of 2018. The DGNREEC chairs the six-monthly IDBP Advisory Committee, which was established in July 2011 with a
mandate to monitor program progress and endorse initiatives. It includes representatives of relevant government agencies,
DGNREEC, civil society and the supporting donors. The Ministry has allocated funding and provided hands on support
for the implementation of activities, including setting up followup meetings with stakeholders in different provinces
promoting the BIRU programme. Hivos has also worked with DGNREEC and a variety of other stakeholders to standardize
biogas installations, for which there is now a registered SNI number. The technical specifications of the BIRU digester have
also been adopted as the model for government projects in current tenders at regional level.
The Ministry for Energy and Mineral Resources DGNREEC is also closely involved in coordination, monitoring and support
for implementation of the SII program. Hivos implements SII under an MoU with DGNREEC. The ministry has also issued
decrees adopting SII as a national program, and specifying the coordination structure for the initiative. Hivos jointly
manages the SII secretariat, which is headed by the director of Miscellaneous Energy within DGNREEC. Three working
groups have also been established for the program, to address policy, implementation, funding and promotion. National
plenary meetings for SII are held twice yearly. These meetings are attended by representatives of all stakeholder groups,
and include district and provincial government representatives. Regional plenary meetings are held one month prior to
these national meetings, and are attended by representatives from local governments, PLN and other stakeholders. The
national government have allocated funds for roughly 200 biogas digesters in Sumba as part of the SII program.
NATIONAL GOVERNMENT
Stakeholder Assessment

63 HIVOS - LLA GREEN PROSPERITY
LOCAL GOVERNMENTS
Provincial and district governments are closely involved in the coordination and governance structures established for the
IDBP and SII programs. The major local counterpart has been local Energy and Mineral Resources agencies. Winrock also
works in close coordination with local education agencies in Sumba for the development of solar PV school and lantern
interventions. Members of other agencies, including local planning agencys are among the regular attendees at local and
national coordination meetings for the Sumba Iconic Island program. Hivos also collaborates with local Agriculture and
Animal Husbandry agencies on the implementation and coordination of the biogas program.
Provincial and district governments in all project areas have allocated funds to support program activities, in particular
to support domestic biogas dissemination through the IDBP. In the first semester of 2015, the provincial governments of
Nusa Tenggara Barat and Sulawesi Selatan made commitments to allocate a total of EUR 295,293 (IDR 4,134,102,908),
enabling an additional 705 farmer households to get access to BIRU digesters in these areas. Two of the nine project
districts are currently providing fund allocations to support biogas dissemination through the IDBP, including Lombok
Utara district, which is supporting the dissemination of 219 biogas units, and Sumba Barat, which has allocated funds for
50 biogas digesters. Members of the district governments in Luwu Utara and Luwu Timur have also expressed interest in
providing financial support for the dissemination of biogas in these relatively new project areas.
During the LLA survey, researchers held meetings with 51 leaders and staff from local government agencies, including
members of district Planning, Energy and Mineral Resources (ESDM), Agriculture/Animal Husbandry, Community
Empowerment and Women’s Empowerment Agencies from eight of the nine target districts. In general, members of
ESDM were well informed about the project, and expressed strong support for the proposed interventions. Members
of other district agencies, including planning agency Bappenas and Agriculture and Livestock Agencies, in general had
more limited knowledge of the biogas and other interventions in their districts. Nevertheless, in general these actors
expressed support, and in Luwu and Sumba in particular, members of the Agriculture/Animal Husbandry Agencies and
local Environment Offices (KLH) expressed sometimes quite strong interest in working more closely with the program.
The strengthening of linkages to such local agencies may be an area that can be developed in the proposed project.
Stakeholder Assessment

64 HIVOS - LLA GREEN PROSPERITY
Through its mandate to develop a market-based and sustainable biogas sector, the IDBP has entered into participation
agreements with 67 Construction Partner Organisations (CPOs), which are groomed to provide high-quality biogas
digesters to cattle farmers interested in investing in biogas. CPOs include private sector entities, (mostly dairy) cooperatives,
NGOs and mason groups. Program staff provide assistance and have an inspection role in order to ensure quality and
continuity in the development of the biogas services in each target region. The development of entrepreneurial actors to
construct and service biogas plants for the domestic market is an essential element of biogas sector development. CPOs
are provided with training and support by the BIRU program, which is intended to improve management capacity and
support them to become independent commercial biogas service providers. There are currently 11 CPOs working with the
IDBP in the nine MCA-I project districts. These include five experienced CPOs in Lombok, where the IDBP has operated
since 2010. There are four CPOs in Sumba, most with two or more years of experience. Two CPOs have been newly
enrolled in the IDBP in Luwu Utara and Luwu Timur since 2016.
CONSTRUCTION PARTNER ORGANIZATIONS
SUMBA ICONIC ISLAND STAKEHOLDERS
The proposed project activities in Sumba are embedded within the multi-year, multi-actor Sumba Iconic Island (SII)
program, which aims to provide 100% renewable energy for the 750,000 inhabitants of Sumba by 2025. Managed in
partnership with the Ministry for Energy and Mineral Resources and local governments, SII seeks to showcase a holistic
and inclusive model for on- and off-grid renewable energy development. Since 2010, SII has supported increase in
electrification on Sumba from 24.5% to 43%, mobilized over EUR 9 million from government and donors, and been widely
profiled in national and international publications. SII engages a very wide range of stakeholders, including investors,
donor agencies, banks, national and local government, PLN, local NGOs and communities, in support of the development
of renewable energy solutions that promote local economic development and improved livelihoods in Sumba. Through
such engagement, the SII platform provides significant opportunities for project activities to leverage funding for related
development activities, including through the mobilization of investor and donor funds, and by supporting the realization
of government investment in renewables in the area.
Stakeholder Assessment
@MaxRichter/Sumba/2016

DEVELOPMENT CONTEXTAND LESSONS LEARNED

66 HIVOS - LLA GREEN PROSPERITY
Program Indonesia Terang (Bright Indonesia Program; PIT) is a centrepiece of the current administration’s strategy to
achieve universal coverage through electrification of remote rural areas. Announced in early 2016, PIT aims to support
increase in the electrification rate from around 85% to 97% by 2019 by bringing electricity from renewable sources to
10,300 villages. Interventions are expected to include home systems and mini-grids, using solar PV, wind, micro-hydro,
biomass and geothermal power. It is anticipated that solar PV will play a major role, including rollout of large numbers
of Solar Home Systems (SHS). On current plans, rollout will initially target over 6,000 villages in six provinces in Eastern
Indonesia, including NTT. Hivos works closely with the Ministry of Energy and Mineral Resources, which oversees the
Terang program. Members of the team responsible for PIT attended meetings and made site visits to Sumba during the
design phase. The current status appears to be that Sumba may not be covered, though it is possible that this may change
as the program is still at a formative stage. Hivos is actively seeking to ensure coordination with PIT, to seek synergies with
SII.
As noted in the stakeholder analysis, provincial and district governments have provided significant support for dissemination
of domestic biogas and solar PV technologies (in Sumba) using both earmarked national and local budget resources. In
Lombok, Sumba, and Sulawesi Selatan, some of these funds have been allocated to support dissemination of domestic
biogas in the IDBP. Local government agencies in all areas have also supported dissemination of biogas outside of the
IDBP, however sustainability of these installations is often quite limited. As noted in the beneficiary assessment, this has
sometimes created negative perceptions of the promoted technologies among potential users. Local governments
and state owned electricity provider PLN have also disseminated significant numbers of SEHEN solar PV lantern and
charging systems in Sumba, as well as smaller numbers of Solar Home Systems. These have however been affected
by similar problems in relation to quality of installations, and limited or no access to servicing, socialization and user
training. High rates of default on retributions have also been experienced in the SEHEN program due to poor management
and socialization of payment systems, leading to repossession of many systems. This has also created a legacy of some
scepticism about the dissemination of solar PV technologies among local communities.
The proposed project is embedded in two larger programs–the Indonesia Domestic Biogas Program (IDBP) and the
Sumba Iconic Island (SII) program. These have well-established systems for governance, coordination and management,
including with national and local governments and other stakeholders, including state owned electricity provider PLN,
investors, credit providers and NGOs. In addition, among the key MCA-I funded projects in these areas for which there are
potential synergies, the MCA-I funded Gading project is of particular relevance. This project, which will operate in Lombok
and Sumba seeks to promote increased utilization of bioslurry through various interventions, including R&D on bioslurry,
training and business development. Close coordination with the Gading project will be required in order to maximize the
benefits of the proposed biogas interventions.
DEVELOPMENT CONTEXT
Development Context and Lessons Learned

67 HIVOS - LLA GREEN PROSPERITY
The Indonesia Domestic Biogas Program (IDBP) was launched in 2009. Developed by Hivos together with SNV, the
program drew extensively on lessons from successful biogas dissemination elsewhere, including from the Nepal Biogas
Support Program (see e.g. Bajgain & Shakya, 2005). These include critical lessons on issues as diverse as technology,
targeting, promotion, dissemination models, subsidy and credit financing, program funding, coordination and other issues.
The IDBP has subsequently constructed 15,000 digesters in nine provinces, and has generated numerous assessments,
studies, reports and evaluations, which document findings and lessons, many of which have been incorporated into the
program. Some key relevant lessons are detailed below.
1. Developing entrepreneurial construction partners and skilled masons. Program reports and evaluations stress the
importance of identifying and developing capable local construction partners and skilled masons, who can develop
leads, ensure construction quality, provide trainings, conduct servicing, and gain community trust–a critical factor to
support further dissemination. In some areas the IDBP has experienced challenges to identify suitable local partners
with local trust and willingness to take an entrepreneurial approach to generate leads and pre-finance construction.
In relation to the proposed project areas, this may be a challenge in Luwu Utara and Luwu Timur, where two
construction partners have been newly signed up for the program in 2016.
2. Access to affordable credit. One of the lessons from the long-running Nepal Biogas Support Program has been the
importance of working with financial institutions that can provide affordable credit to finance biogas purchase by
farmers. This has been reflected in the IDBP, where an internal report notes that the importance of credit availability in
supporting dissemination has been second only to subsidy financing. Around half of digesters disseminated through
the IDBP to date have been financed by credit, with the rest drawing on savings, asset sales or in-kind contributions
to finance purchase. In nine provinces 25 local Lending Partner Organisations (LPOs) are linked to credit providers to
channel loans for potential biogas households since 2010. The programme has established partnerships with biogas
credit providers such as Nestle, Rabobank Foundation, KIVA, and Credit Unions. Especially the KIVA partnership (since
2014) is reaching potential farmer groups who live in remote areas and/or cannot be served by the usual commercial
banking schemes (e.g. South Sulawesi). A Hivos monitoring report in 2015 notes that greater credit availability may
help to unlock demand for biogas.
3. Bioslurry promotion. Maximizing bioslurry utilization is key to maximizing biogas benefits for emissions reduction,
improvement in the local environment and the prosperity of users. The program has been successful in promoting
bislurry use, with 82% of users reporting using bioslurry, although 38% admit to some dumping of slurry, usually
in drains, rivers or lakes–although this practice is no more harmful than the dumping of manure, which is much
decreased among users. (JRI, 2015) While there are efforts to promote bioslurry among users, biogas promotion
initially focussed on the benefits of fuel substitution. A recent program reports notes the lesson that bioslurry benefits
may be used to promote biogas. Demonstration effects are recognized as important for promotion. A 2015 report
on the program cites strong testimony from bioslurry users about increased productivity and pest reduction, and
concludes that, “there is … a great need for farmers to see bioslurry use demonstrated, especially by other farmers in
their social networks, to convince them of its long-term benefits.” (IIED, 2015)
4. Building a trusted brand. This is particularly important in a context where there is a quite long history as well as
ongoing dissemination of poor quality biogas installations by other actors. BIRU is already a quite well established
brand for biogas installation and services in some project areas. In addition to ensuring visibility in everything from
installations to promotion materials and uniforms, an important part of the strategy has been to develop trusted
construction partners and to partner with other trusted intermediaries for promotion. For the latter, the most notable
has been dairy cooperatives in East Java. (IDBP, 2013) In South Sulawesi the program starts from a fairly low base
and will need to focus more heavily on promotion and building trust. Lessons on branding and recognition may be
considered in relation to solar PV interventions in Sumba.
5. Securing government support for scale up. Local and national government agencies in Indonesia have a proven
interest in biogas dissemination. However, the default mode has been to fund handouts, with limited socialization,
training or servicing. This undermines the market, and also creates negative perceptions of biogas when installations
fail. Having demonstrated the effectiveness of the IDBP fixed dome digester and dissemination model, Hivos
has been able to establish agreements with provincial and district governments for the provision of earmarked
national and local funding for dissemination in ways that maintain program quality, service standards, and some
user contributions. This has mitigated the risks of competing with free dissemination, and facilitated more rapid and
widespread dissemination, which has been notably accelerated in areas where greater government support has been
channelled to the program.
LESSONS LEARNED: BIOGAS
Development Context and Lessons Learned

68 HIVOS - LLA GREEN PROSPERITY
Over the past decade or so, there have been a number of small- and large-scale giveaways and efforts to promote paid
services, including for Solar Home Systems (SHS), Super Ekstra Hemat Energi (SEHEN) solar PV lamp systems in Sumba.
These have suffered from a litany of problems, common to similar interventions across the country. A 2012 study estimated
that there was an overall malfunction rate of 50-60% in SHS systems distributed in all Sumba districts at this time, and
recent reports by partners annexed to the MCA-I proposal suggest that SEHEN repossession has reached higher rates in at
least one district (Makambombu, 2012; VIA, 2015). The project is designed based on assessments of weaknesses identified
in such previous interventions. The below provides a short summary of some of the key lessons. Sources include a 2012
study of SHS and SEHEN in Sumba, observations in field studies annexed to the MCA-I proposal for this project, and
briefings with project partners.
1. Quality and service issues. Quality issues have often affected previous dissemination of solar PV installations to
households in Sumba. Components such as batteries and invertors are reported to regularly fail in less than two years.
Previous programs have made limited provision and/or socialization of services for repair and parts replacement.
Drawing on these experiences, the selection of appliances takes into consideration issues of quality and durability
that have affected previous interventions. Partners note that the requirement for users to charge lanterns at a central
charging station in a school or kiosk will facilitate servicing by local service centres and charging station operators.
These actors are an integral part of efforts in the proposed project to ensure proper socialization, user training,
servicing and retribitions collection.
2. Payment systems. Poor socialization and enforcement of payment systems have undermined efforts to introduce
subscription-based solar PV services in Sumba. A 2012 study notes that subscription systems for SEHEN were
negatively affected by, “misperceptions among the community members … due to unclear information.” Influenced
by the previous experience of handouts or one-off payments for SHS, some community members reportedly failed
to understand that they were required to make regular payments. Collection of payments was also irregular and
infrequent, and back payments were sometimes demanded at times of the year when many users did not have
cash flow. Reports annexed to the MCA-I proposal note that the provision of charging modules to households in
the SEHEN program provided an important lesson for the proposed lantern interventions (Winrock 2015; VIA 2015).
In the proposed project, charging stations will provide services only when fees are paid. A VIA report notes that, “by
centralizing all solar panels in one location in the village, and forcing households to come and recharge batteries in a
similar way to how they refill kerosene bottles, this risk [of default] can be better managed.” (VIA, 2015)
3. Socialization and user training. Linked to the above issues have been problems with socialization and training for users.
In previous inteventions, this resulted in lack of knowledge among users about how to access repair and replacement
services (where these were available). Poor socialization also reportedly contributed to problems with defaults. In
addition, a 2012 report on SHS and SEHEN notes that failure to provide user training also sometimes led to misuse or
incorrect operation and maintenance of equipment by users. Project partners report that sometimes simple issues
such as failure to clean solar PV arrays may result in non-functioning or poorly-functioning systems.
LESSONS LEARNED: SOLAR PV, SUMBA
Development Context and Lessons Learned

CHALLENGES, RISKS AND OPPORTUNITIES
70 HIVOS - LLA GREEN PROSPERITY
Overall, the analysis concludes that the proposed interventions are appropriate to the needs and constraints of
beneficiaries, and that if successfully implemented, the probability that the program will have positive outcomes for
individuals, households and communities is high. In general, the project does not carry significant risk of negative impacts
to the environment and natural capital, or to social and livelihoods systems.
Risks for physical/ natural environment
The LLA identifies no additional risks caused by the programme components or activities for the physical and natural
environment additional to those identified in the Environmental and Social Performance Datasheet.
Potential exclusion and elite capture
Capture of project benefits by local elites is not a significant risk for the proposed investments. Support for biogas
dissemination is widely promoted and available based on independent assessment of the suitability of potential users.
Access to solar PV interventions will depend on ability to pay, and these are in general within the means of most households.
Meanwhile, there is likely to be a small field of potential entrepreneurs who may operate kiosks or corn/rice mills in each
project site, and these will be determined based on independent assessment of suitability.
Minor conflict risks
There is some risk that unrelated local conflicts or vandalism may affect activities in a handful of project sites in Sumba.
This is not yet very explicit in the project risk analysis. This survey notes previous experiences in which small-scale village
conflicts or vandalism have affected initiatives in the area, including during the selection of survey locations.
Recommendation
Hivos should actively monitor community-based activities to identify and act on potential risks as early as possible.
Anticipated benefits
In relation to anticipated benefits, it is noted that some specified indirect benefits of the project towards the landscape and
lifescape may emerge only after the project period, or following additional sector-specific interventions.
• First, the availability of lighting in the evening or timesavings generated by interventions may improve quality of life,
but may not rapidly lead to increased time spent on schoolwork, improved educational outcomes, or engagement
in productive activities by users as these are subject to other constraints. Complementary interventions discussed by
project partners, including support for handicrafts activities, trainings for teachers on energy usage, or support for
book drives for schools may however highlight the potential benefits in some locations.
• Second, although the BIRU program currently exceeds its targets for the utilization of bioslurry, there is scope for
intensification of the use of bioslurry. This should be pursued in collaboration with the MCA-I funded GADING project,
which will support intensification of bioslurry utilization through R&D, promotion of bioslurry applications, and
commercialization, including in Lombok and Sumba. In line with lessons outlined in biogas program reports, greater
focus on promoting biogas on the basis of the demonstrated benefits of bioslurry may also help to increase demand
for biogas and promote greater utilization.
ENVIRONMENTAL, SOCIAL AND ECONOMICCHALLENGES AND POTENTIAL
Challenges, Risks, and Opportunities

71 HIVOS - LLA GREEN PROSPERITY
Demand. The survey identifies interest in biogas, in particular among lower- and middle-income households (wealth
groups 2 and 3). However, demand may be limited due to competition from LPG. This is widely available and convenient,
and households in this area have comparatively good ability to pay. As a relatively new project area, there is lower awareness
of biogas and the BIRU program among potential users.
Programmatic challenges. Biogas dissemination in the target districts is at an early stage in comparison to Lombok and
Sumba. There are just two new construction partners in place. The target of 1,300 digesters (the same as for Lombok) may
be more challenging to meet in this area in the short project period.
Recommendations
Despite the promising situation for domestic biogas, the target for dissemination of 1,300 digesters–the same as for
Lombok, and twice the target for Sumba–appears ambitious for a relatively new project area. Intensive stakeholder liaison,
promotion, demonstration of biogas and bioslurry benefits, and capacity building and support for construction partners
will be required. The partners should monitor uptake and issues of competition with LPG, and may consider reallocating a
portion of the target to Lombok or Sumba depending on progress in the first year.
Technical feasibility. The LLA reinforces the assessment of the modest technical potential for biogas in Sumba, including
due to limited stabling practices and issues with water access in some areas. A particular issue is noted in relation to size of
pig holdings, since the survey indicates that only a relatively small proportion of (relatively better off) households in Sumba
have holdings of six pigs or more–the rough minimum required to operate the smallest digester currently disseminated
in the BIRU program.
Demand. Biogas in Sumba competes with firewood, which is free. Non-user households may perceive limited benefits
from substitution, despite timesavings. Meanwhile, at least some degree of firewood use may also continue to be preferred
for other reasons, including to protect stored maize from weevil infestation. Nevertheless, increasing enforcement of local
statutes against cutting of wood in forest areas has anecdotally been a significant push factor for biogas adoption in Sumba
and in other areas, and the benefits of bioslurry are also reported to be a factor in creating interest among potential users.
Programmatic challenges. Remoteness and limited local capacity pose some challenges for quality monitoring in Sumba.
Recommendations
• The target for 600 biogas units in Sumba, compared to 1,300 units each in Lombok and Luwu, already reflects the
more modest assessment of technical feasibility and demand in Sumba. The promotion of a smaller digester size–
such as the 2m3 digester that has been tested by the program–may greatly increase the potential market (reducing
requirements for animal holdings, water and construction cost). Promotion of biogas on the basis of the demonstrated
benefits of bioslurry may also help to address the limited financial incentive to switch from firewood to biogas.
• Ensure that the number of technical and programmatic staff are sufficient not only for implementation and monitoring
visits, but for the softer side of the project, which is about changing perceptions and attitudes, and responding to
queries (about lanterns, about payments, about bioslurry, etc).
LOCALLY CHALLENGING CONDITIONSBiogas Component
Sulawesi Selatan
Sumba
Challenges, Risks, and Opportunities

72 HIVOS - LLA GREEN PROSPERITY
LOCALLY CHALLENGING CONDITIONSPV School / Lantern Component
Payments. Previous failed attempts to disseminate SEHEN solar PV lantern and charging systems in particular highlight
potential issues related to payments. However, in this case, problems were apparently related to weak socialization
and enforcement, leading to high default rates. It should be possible to avoid these on the proposed model, in which
charging facilities can only be accessed based on payment. Project staff also note potential concerns about the capacity
of households to access cash at all times of year. The survey suggests that this may be an issue for poorer households,
particularly around the start of the year, when seasonal calendars suggest that agricultural labor opportunities are generally
most limited. Nevertheless, the survey also finds that households in the bottom two wealth groups typically pay around
IDR 30,000 (USD 2.3) per month currently for kerosene to light their homes. Routine outlays on kerosene appear similar
to those anticipated for lantern charging, and there appears little reason why poorer households may not be able to pay
for this service. Monthly or bi-monthly payments may be easier to administer for the service rather than very frequent per-
charge payments.
Targeting. It is recognized that there are many more elementary than junior and senior high schools, and that a much
larger proportion of these are likely not to be electrified. Nevertheless, it is potentially the case that electrification of junior
and senior high schools may have greater impacts, and it is worth seeing whether this may be the case. Interventions in
high schools may also bring a different set of challenges, and it is worth using this opportunity to develop interventions
that work for this potential market.
Promotion / socialization. The survey identifies that parents and teachers have many questions about lanterns: will they
break if dropped by children; e.g. will they be waterproof to rain; what if the lantern fails; what if we can’t pay, etc. Past
experiences of solar PV technologies may underlie some concerns and scepticism.
Sustainability. The intervention is dependent on the ongoing viability of the proposed local service centres, including for
the sourcing and import of lamps for replacement or expansion. See the below note on service centres.
Recommendations
• Feasibility of routine payments for lantern charging appears sound; monthly or even bi-monthly payments may prove
easiest to administer.
• It is recommended to include some (e.g. 5-10) junior/ senior high schools in the solar PV school electrification
intervention, in addition to elementary schools. Monitoring and evaluation should seek to capture any major
differences in relation to feasibility and outcomes.
• The partners should invest in socialization, and ensure training for all field staff so that they can provide comprehensive
explanations of all the various technical, financial and service elements of interventions, and respond to queries and
areas of concern.
Challenges, Risks, and Opportunities

73 HIVOS - LLA GREEN PROSPERITY
Payments. The proposed corn and rice milling interventions may face similar issues to those described above in relation
to payments for lanterns–i.e. the potential difficulty of charging small ongoing expenses at times at times when cash flow
is low (with large volume grinding not possible). However, it is noted that for corn mills (which account for the majority of
demand and are the main focus of interventions), a household that mills 2kg of corn daily will only pay in the region of IDR
24,000 (USD 1.8) per month. This is a relatively small amount for most households. In addition, costs may also be offset
through in-kind payments.
Targeting. The proposed interventions–corn mill interventions in particular–appear to have good potential to deliver
benefits for women, both as users and as entrepreneurs. While the project already targets to include at least 30% women
entrepreneurs, it may be worth considering a strong presumption in favor of selecting women entrepreneurs, where
possible.
Sustainability. Sustainability will depend on the viability of local commercial agent(s) or service centres to source and
import mills and parts (for replacement or expansion). See below note on service centres.
LOCALLY CHALLENGING CONDITIONSSolar PV Mill Component
Challenges, Risks, and Opportunities
74 HIVOS - LLA GREEN PROSPERITY
LOCALLY CHALLENGING CONDITIONSService Centres / Sustainability
Sustainability. The sustainability of the proposed interventions depends in large measure on the viability of the proposed
service centres, including for maintenance and servicing, equipment and spare parts, management of retributions, and
promotion and marketing. While the financial models annexed to the MCA-I proposal provide a case for the financial
viability of the service centres in the context of the proposed interventions, promoting the scale up and diversification of
renewable energy activities is expected to be an important supporting factor in ensuring commercial viability of the service
centres beyond the project term. It is noted that overall, there does appear to be a good likelihood that the partners will
be able to support scale up and diversification of service centre activities. The project is embedded in the wider multi-
phase Sumba Iconic Island program, which has strong national and local government endorsement, and a track record in
mobilizing government, CSR and donor support.
Recommendation
Actions that may help to promote the commercial viability of the service centres during the project term may include pro-
active efforts to identify and begin marketing services to additional users, including for PV school and lantern interventions.
Efforts to secure financial support from government for replication and scale up may present one of the most important
opportunities for sustainability of many if not all of the proposed interventions. Local and national governments have
proven ready to fund dissemination of biogas and solar PV technologies to support energy access, particularly in remote
areas. The biogas program has already demonstrated that this is an effective way of promoting scale-up, increasing
effectiveness of government funded interventions, and mitigating the potential for competition with free handouts for
often unsustainable interventions.
Challenges, Risks, and Opportunities

75 HIVOS - LLA GREEN PROSPERITY
Due to both the geographically diverse and multi-component nature of this project, responsibility for different tasks for this
Landscape Lifescape Analysis was divided across several teams. The first team was comprised of partner staff and external
consultants, completing field research in three districts in Lombok and two districts in Sulawesi. The second team was
comprised of Hivos and partner staff, and external consultants, completing research in all four districts of Sumba island.
The third team provided external support to the above two teams in the form of research design, reading and review of
secondary literature, guidance of the data compilation and analysis process, report writing, map preparation, and logistical
support.
Field research took place at various times in April and May, 2016.
Research methods followed a structured pattern which was replicated in most districts. Initial meetings were held with key
district level authorities and key informants with relevant commercial interests and relevant knowledge and experience. 23
villages in 9 districts were selected for field research based on a balance of various parameters of interest – existing facilities
(e.g. biogas), potential locations for the project, inland, coastal, high and low lands, remoteness and close proximity to
urban centres.
In each village a series of separate meetings were held with various stakeholders and key informants taking place
over a half day period – meetings with community and village leaders (formal and informal), representatives of local
women’s group, existing users (i.e. biogas users), teachers. On the following day, another half day period was used to
interview representatives of households from different wealth groups, as described and identified the previous day by
community leaders. Matters of asset ownership, wealth determinants, seasonality, production, income, expenditure
patterns, commodity prices and many other topics were discussed in a systematic way in every location. Semi-structured,
participatory techniques were used to interview all of the above focus groups, with women’s meetings interviewed by a
female researcher. To supplement interviews and discussions, ground truthing and observation to confirm, correct and
deepen findings. Ad hoc interviews were also held with local shop owners, mill owners, people in fields, etc.
* District government informants included leaders and staff from a number of agencies including Planning, Energy and Mineral Resources, Agriculture/Animal Husbandry, Community Empowerment and Women’s Empowerment Agencies.
Informants in villages were fairly evenly split between women and men, and included 296 men and 269 women. This
included participants in women only FGDs, which were held in all villages visited in order to ensure that the views of
women were adequately heard. A total of 114 women participated in these FGDs.
ANNEX 1 METHODOLOGY
Project Area DistrictNo. of Village
Visited
No. Local Leader
Informant
No. of Local Village
Informant
No. of Local GOVT
InformantTotal
Lombok
Lombok Utara 3 8 62 10 80
Lombok Tengah 3 9 75 6 90
Lombok Timur 3 8 62 2 72
SulselLuwu Utara 3 9 58 9 76
Luwu Timur 2 14 50 4 78
Sumba
SBD 2 11 34 6 51
Sumba Barat 1 10 28 0 38
Sumba Tengah 2 12 44 9 65
Sumba Timur 3 26 45 5 76
Total 23 107 458 51 616
Table A.1.1. LLA Informant Log

76 HIVOS - LLA GREEN PROSPERITY
Kabupaten Kecamatan Desa BiruExisting PV
SchoolProspective PV
School
Lombok Utara
Kayangan Salut 250 - -
Gangga Benteg 40 - -
Bayan Senaru 66 - -
Jonggat Bon Jeruk 60 - -
Lombok Tengah
Praya Barat Setanggor 70 - -
Pujut Pengengat 50+ - -
Pringgabaya Teko 40+
Lombok Timur
Labuhan Haji Tirtanadi 50+ - -
Masbagik Lendang Nangka 88 - -
Mapedecceng Uraso 5 - -
Luwu UtaraBone Bone Muktisari 17 - -
Sukamaju Tulungsari 5 - -
Luwu Timur
Mangkutana Margolembo 8 - -
Tomini Purwosari 0 - -
Burau Benteng 2 - -
Sumba Barat DayaWewewa Timur Dikira BIRU PV-s 0
Kota Tambolaka Kalembu Kah (Dusun: Kadekap) 0 PV-s 0
Sumba Barat Lamboya Kabukarudi 0 0 0
Sumba TengahMamboro Cendana Barat 0 PV-s PV-c(100)
Mamboro Susu Wendewa 0 0 0
Sumba Timur
Lewa Tidahu Umamanu 0
Pinu Pahar Lailunggi BIRU 0 0
Umalulu Wanga BIRU 0 0
Table A.1.2. LLA Research Villages And Current Status Of Interventions

77 HIVOS - LLA GREEN PROSPERITY
ANNEX 2SEASONAL CALENDARS
Luwu Utara / Luwu Timur
Month 4 5 6 7 8 9 10 11 12 1 2 3
Seasons
Rainy 6 6 6 1 0 0 0 0 1 6 6 6
Dry 0 0 0 5 6 6 6 6 5 0 0 0
Corn
Plant 0 0 2 1 1 1 1 0 1 0 2 0
Harvest 1 1 1 0 1 2 0 2 0 1 0 0
Padi sawah
Plant 1 0 0 0 4 2 1 0 0 1 5 2
Harvest 0 3 3 1 1 0 0 3 3 1 1 0
Sayur - sayuran
Plant 4 4 4 4 4 4 4 4 4 4 4 4
Harvest 4 4 4 4 4 4 4 4 4 4 4 4
Kelapa Harvest 0 0 4 0 0 4 0 0 4 0 1 3
Kelapa sawit Harvest 4 4 4 4 4 4 4 4 4 4 4 4
Kakao Harvest 1 2 1 1 1 3 0 0 0 0 0 0
Jengkol Harvest 0 0 1 0 0 0 0 1 0 0 0 1
Tukang / kuli
bangunan1 0 0 0 1 2 2 1 0 0 0 1
* based on seasonal calendars developed with informants in six villages

78 HIVOS - LLA GREEN PROSPERITY
Month 4 5 6 7 8 9 10 11 12 1 2 3
SeasonsRainy 4 2 0 0 0 0 0 0 4 4 4 4
Dry 0 1 4 4 4 4 4 4 0 0 0 0
JagungPlant 1 0 1 0 1 1 0 0 1 2 0 1
Harvest 1 2 0 1 1 0 0 1 2 0 0 1
Padi sawahPlant 1 3 2 1 1 1 0 0 5 0 2 0
Harvest 3 2 1 1 1 3 2 2 0 0 0 3
Kacang-kacanganPlant 1 3 0 0 0 0 0 0 0 1 0 1
Harvest 1 0 0 1 3 0 0 0 0 0 0 0
Ubi-UbianPlant 0 0 0 0 1 1 1 1 1 0 0 0
Harvest 1 0 0 0 0 0 0 0 1 1 1 1
Jambu Mente 0 0 0 0 1 2 2 0 0 0 0 0
Kelapa/Pisang 0 0 2 0 0 2 0 0 2 0 0 2
Kopi 0 0 1 1 1 1 0 0 0 0 0 0
Kakao 0 1 1 1 1 1 1 0 0 0 0 0
Tembakau Plant 1 1
Harvest 1 2
Durian 0 0 0 0 0 0 0 0 0 0 1 1
Buah-buahan 1 1 1 1 1 1 1 1 1 1 1 1
SemangkaPlant 1
Harvest 1
Cabe Plant 1 1 1 1
Harvest 1 1 2 2 1 1 1 2
Bawang merahPlant 1 1
Harvest 1 1
TomatPlant 2 1
Harvest 1 2 2 2 2 2 2
KolPlant 1 1
Harvest 1 1
Tambang pasir 1 0 0 0 0 0 0 0 1 1 1 1
Pengirik 1 1 1 1 1 1 1 1 1 1 1 1
* based on seasonal calendars developed with informants in six villages
Lombok

79 HIVOS - LLA GREEN PROSPERITY
Month 4 5 6 7 8 9 10 11 12 1 2 3
SeasonsRainy 0 0 0 0 0 0 1 3 4 4 3 3
Dry 4 4 4 4 4 4 3 1 0 0 0 0
Land preparation 0 0 1 4 7 5 1 0 0 0 0 0
Jagung Plant 0 0 0 0 0 2 3 4 5 0 0 0
Harvest 2 1 0 0 0 0 0 0 1 2 3 5
Padi Sawah Plant 0 0 0 0 0 0 0 0 2 3 2 0
Harvest 0 4 3 0 0 0 0 0 0 0 0 0
Padi Ladang Plant 0 0 0 0 0 1 2 4 4 0 0 0
Harvest 4 2 0 0 0 0 0 0 0 1 2 2
Kacang2an Plant 0 0 0 0 0 0 1 3 4 1 1 1
Harvest 3 2 0 0 0 0 0 0 1 0 1 2
Ubi-Ubian Plant 0 0 0 0 0 2 3 4 5 0 0 0
Harvest 0 0 2 5 6 3 0 0 0 0 0 0
Jagung Rote Plant 0 0 0 0 0 0 1 2 1 0 0 0
Harvest 0 0 0 1 1 1 0 0 0 0 0 0
Jambu Mente 0 0 1 1 2 5 5 4 2 0 0 0
Other
Tanaman hortikultural 1 1 1 1 1 1 0 0 0 0 0 0
Kelapa/Kopra 1 2 2 1 1 1 1 1 1 1 1 1
Kopi 0 1 1 1 1 0 0 0 0 0 0 0
Kakao 0 1 1 0 0 0 0 0 0 0 0 0
Cengkeh 0 0 0 1 1 0 0 0 0 0 0 0
Pinang 1 1 0 0 0 0 0 0 0 0 0 0
Kemiri 0 0 1 1 2 2 1 1 0 0 0 0
Produksi & jual garam 0 0 1 1 1 1 1 0 0 0 0 0
Melaut 1 1 1 1 1 1 1 1 1 1 1 1
Social Cultural expenditures 1 1 2 1 2 3 4 3 3 2 2 1
Sumba
* based on seasonal calendars developed with informants in six villages

80 HIVOS - LLA GREEN PROSPERITY
ANNEX 3SELECT BIBLIOGRAPHY & REFERENCES
Astawa, B. (2004) Finding Common Ground in Rinjani, Lombok, Indonesia: Towards Improved Governance, Conflict
Resolution, and Institutional Reform
Bachtiar, P.P. (2011): Migration Outflow and Remittance Patterns in Indonesia: National as well as Subnational
Perspectives. Published in: Philippine Journal of Development , Vol. 38, No. 1-2b (2011): pp. 27-55.
Badan Pusat Statistik (BPS), Dalam Angka & Statistik Daerah (Sumba Timur, 2015; Sumba Barat 2015; Sumba Tengah,
2014; Sumba Barat Daya, 2015; Lombok Utara, 2015; Lombok Timur, 2015; Lombok Tengah, 2015; Luwu Utara, 2015;
Luwu Timur, 2015)
Badan Pusat Statistik (BPS) (2014) Human Development Index 2014
Bajgain, S. & I.S. Shakya (2005), The Nepal Biogas Support Program: A Successful Model of Public Private Partnership For
Rural Household Energy Supply. DGIS, SNV & BSP-N. Kathmandu: Nepal.
Bennett L.R. (2005) Women, Islam and Modernity - Single women, sexuality and reproductive health in contemporary
Indonesia. New York: Routledge Curzon, 2005.
Castlerock Consulting (2014) Scaling Up Renewable Energy Access in Eastern Indonesia, Final Mid-Term Report
Davidson J.S. and Henley, D, eds (2007) The Revival of Tradition in Indonesian Politics: The deployment of adat from
colonialism to indigenism, London and New York: Routledge.
Entec (2012) Small scale hydro power for grid generation on Sumba Island, Indonesia, Initial site assessment report
Hivos (2010a) Indonesia Domestic Biogas Program (IDBP) Market Survey Report Lombok, May 2010, compiled by I.G.
Suarja
Hivos (2010b) Indonesia Domestic Biogas Programme (IDBP) Market Survey South Sulawesi, June 2010, compiled by
Suharman (MCAI annex A.2.2.4)
Hivos–SNV Netherlands Development Organisation (2011) Feasibility of Biogas in Sumba, prepared by S. Bajgain
Hivos–JRI Research (2013) Socio-Economic Baseline Survey (Sumba Iconic island) prepared for Hivos by JRI Research,
February 2013 (MCAI annex A.1.1.4)
Hivos (2014) Biogas User Survey 2014, Executive summary
Hivos-JRI Research (2015a) Biogas User Survey, February 2015, prepared for Hivos by JRI Research March 2015
Hivos (2015b) Iconic Island Multi-actor initiative case study
Hivos (2015c) Brief of Sumba Iconic Island Market Survey August 2015 by Hivos (MCAI annex A.1.1.6)
Hivos-MCAI Partnership Grant, final narrative proposal (2015) revised version dated 15 Dec 2015, including Risk
assessment matrix M.1; Environmental and social performance datasheet N.1; Project gender & social integration plan I.1
81 HIVOS - LLA GREEN PROSPERITY
P-GSIP; Annex A.1.1.1 SII Renewable Energy Financial Model; annexed studies cited separately in this section.
Lambooy, T, and van’t Foort, S (2013) Sumba Iconic Island: A case study on establishing a community-public-private
partnership for providing renewable energy in CSR in Indonesia: Legislative developments and case studies, KONpress,
Indonesia
Lundry C (2009) Separatism and state cohesion in eastern Indonesia. Arizona State University Ph.D. dissertation, www.
papuaweb.org version.
Maria, R (2012) Socio- economic and gender baseline study for the Iconic Island, research paper, JRI Research & Hivos,
2012
IOM (2010) International Migration and Migrant Workers' Remittances in Indonesia, Findings of Baseline Surveys of
Migrant Remitters and Remittance Beneficiary Households
Klock, J. (2008). Historic Hydrologic Landscape Modification and Human Adaptation in Central Lombok, Indonesia from
1894 to the Present. Geology 522
Klock, J. and T. Sjah (2011) "Farmer Water Management Strategies for Dry Season Water Shortages in Central Lombok,
Indonesia," Natural Resources, Vol. 2 No. 2, 2011, pp. 114-124.
Kopernik (2012) Agents of technology, agents of change, Impact assessment report
Millennium Challenge Account–Indonesia (MCA-I) East Luwu Rapid District Readiness Assessment (RDRA) for
participation in MCA-Indonesia’s Green Prosperity Project, prepared by: CDM International Inc. (CDM Smith) and Hatfield
Consultants Partnership
Millennium Challenge Account–Indonesia (MCA-I) North Luwu Rapid District Readiness Assessment (RDRA) for
participation in MCA-Indonesia’s Green Prosperity Project, prepared by: CDM International Inc. (CDM Smith) and Hatfield
Consultants Partnership
Montgomery, R., Rohandi & Rilus Kinseng (2010) Farm Risk Reduction Assessment for Nusa Tenggara Islands, Indonesia,
London School of Economics Asia Research Centre Working Paper No. 31, July 2010
Montgomery, Roger (2015) Will no one plant a tree in Indonesia, London School of Economics Asia Research Centre
Working Paper No. 69, November 2015
Mulyoutami, E., Martini, E., Khususiyah, N., Suyanto, I. (2013). Gender, livelihood and land in South and Southeast
Sulawesi. ICRAF Working paper No. 158. International Council for Research in Agroforestry (ICRAF), Bogor.
Patrick I., Marshall G, Ambarawati IGAA and Abdurrahman M (2010) Social capital and cattle marketing chains in Bali and
Lombok, Indonesia. ACIAR Technical Reports No. 74.
Ritter, R, (2011) Sumba Iconic Island Project: Scoping Mission on Off-Grid Electrification, report, Energy & Development &
Hivos (MCAI annex A.1.1.3)
Russell-Smith, J., Siliwoloe Djoeroemana, Josef Maan, Petrus P (2006) Rural Livelihoods and Burning Practices in
Savanna Landscapes of Nusa Tenggara Timur, Eastern Indonesia
Sutaryono, Y. A., Dahlanuddin, S. Hasan and Mastur (2012) Climate Change Adaptation of Smallholder Livestock Farmers
in West Nusa Tenggara Province Indonesia
Veen, van der W (2011) Sumba all renewable iconic island study: Grid connected electricity generation final report, KEMA
Nederland B.V., 2011

82 HIVOS - LLA GREEN PROSPERITY
Vel J.A.C. (1994), The Uma-economy: indigenous economics and development work in Lawonda, Sumba (Eastern
Indonesia) (PhD thesis). Wageningen.
Vel J.A.C. (2007), Creating a new district in West Sumba. In: Schulte Nordholt H., Klinken G. van (Eds.) Renegotiating
Boundaries: Local politics in post-Suharto Indonesia. Leiden: KITLV Press. 91-120.
Vel J.A.C. (2008), Uma politics: an ethnography of democratization in West Sumba, Indonesia, 1986-2006. Leiden: KITLV
Press.
Vel J.A.C. & Makambombu S. (2010), Access to Agrarian Justice in Sumba, Eastern Indonesia, Law, Social Justice and
Global Development Journal 15(1).
Village Infrastructure Angels–Hivos (2015) Pilot Installation of Village Energy System in Central Sumba, Final report,
prepared by Stewart Craine for Hivos, July 2015 (MCAI Annex A.1.4.3)
Vorley, B., Porras, I and Amrein, A (2015) The Indonesia Domestic Biogas Programme: can carbon financing promote
sustainable agriculture? IIED and Hivos.
Winrock International (2010) Fuel independent renewable energy ‘iconic island’. Preliminary resource assessment Sumba
& Buru Islands, 2010
Winrock International (2011) Baseline report Fuel Independent Renewable Energy “Iconic Island”Sumba: Baseline report
2011 (MCAI annex A.1.1.5.)
Winrock International (2014a) Assessment of Corn Mill Machine Powered by Photovoltaic Modules at Kendautana,
Southwest Sumba (MCAI Annex A.1.6.3)
Winrock International–Hivos (2014b) The PV School Electrification Projects (Phase II) in Sumba, Nusa Tenggara Timur
Province, Indonesia (MCAI Annex A.1.2.2)
Winrock International–Hivos (2015a) Field Report of Corn Milling: Agriculture situation and opportunities and
implentation plan Kadaghu Tana, Southwest Sumba, East Nusa Tenggara (MCAI Annex A.1.6.4)
Winrock International–Hivos (2015b) MCA-I Feasibility Study: PV Kiosk Charging Station Systems in Sumba, June 2015
(MCAI Annex A.1.4.1)
Winrock International–Hivos (2015c) MCA-I Feasibility Study: PV System for Elementary School Appliances and Lantern
Charging in Sumba, June 2015 (MCAI Annex A.1.2.1)
Winrock International (2015d) PV Charging Kiosk Site Visit Report, June 2015 (MCAI Annex A.1.4.2)
Winrock International (2015e) PV Corn Milling Site Visit Report Sumba Nusa Tenggara Timur, June 2015 (MCAI Annex
A.1.6.2)
Winrock International–Hivos (2015f) MCA-I Feasibility Study: PV Corn Peeling and Milling System in Sumba, July 2015
(MCAI Annex A.1.6.1)
Wocan (2015) Monitoring and results report: women’s time savings from Indonesia Domestic Biogas Program (IDBP)
World Food Program (2015) Food security and vulnerability atlas of Indonesia 2015
World Food Program (2016) The Impact of Drought on Households in Four Provinces in Eastern Indonesia

83 HIVOS - LLA GREEN PROSPERITY

84 HIVOS - LLA GREEN PROSPERITY
Untuk Informasi Hubungi:
Hivos
Jl. Kemang Selatan XII No. 1Jakarta Selatan 12560
T: +62 21 7892 489