landscape - quailcount.org implementation... · landscape comprised predominantly of high priority...
TRANSCRIPT

NBCI Coordinated Implementation Program
FOCAL AREA
LANDSCAPE
REGION
NBCI 2.0

NBCI Coordinated Implementation Program
Morgan, J.J., Duren, K., and Dailey, T.V.
Version 1.1March 2016Published by National Bobwhite Conservation Initiative and available in digital format at http://www.bringbackbobwhites.orgThis work is partially supported by Wildlife Restoration Funds. The University of Tennessee, National Bobwhite Conservation Initiative274 Ellington Plant Science BuildingKnoxville, TN 37996-4563 Recommended citation. Morgan, J. J., K. Duren, and T.V. Dailey. 2016. NBCI Coordinated Implementation Program v1.1. Addendum, The National Bobwhite Conservation Initiative: A range-wide plan for recovering bobwhites. National Bobwhite Technical Committee Technical Publication, ver. 2.0. Knoxville, TN.

UPDATESThis document is considered a living document. As such, updates will be made periodical based on feedback from partners participating in the Coordinated Implementation Program. The following are updates that have been made since the original document was published.
2016:• Table of contents added along with hot links to sections of the document.• Hot links were added to Appendix A.• Improved format and fixed mistakes in Appendix A.• The limit to the number of bird species that can be recorded during the spring bird population survey was removed.• The distance between monitoring points for the spring (500 m) and fall (1000 m) bird population monitoring was corrected in Sidebar 9.
• The habitat monitoring datasheet was updated (Sidebar 11 and Appendix B).• The Spatial replications row in Table 2 was changed to “Determined by desired effects size and precision. A suggested starting point is to sample enough points to represent a minimum of 20% of the area.
• The minimum size of protective cover was corrected from a 10 ft. diameter circle to a 10 ft. radius circle.• Replaced all instances of “focus” with “focal”.• Replaced all instances of “Coordinate Implementation Plan” with “Coordinated Implementation Program”.• Converted units in meters to yards.

Table of Contents1. Introduction ______________________________________________________________3
Figure 1. The Strategic Habitat Conservation (SHC) process diagram 3
2. Conservation Planning and Implementation Strategies _____________________________4
Tiered Deliverey 4
Sidebar #1: Example and Background for Focal Area Minimum Size and Composition 4
Sidebar #2: Focal Tiers Structure and Prioritization 5
Sidebar #3: 100% Working Lands (often private lands): Pros and Cons 6
Sidebar #4: 100% Non-working Lands (often public lands): Pros and Cons 6
Harvest 7
Sidebar #5: Mixed Lands: Pros and Cons 7
Domesticated Bobwhites 8
3. Monitoring _______________________________________________________________8
Sidebar #6: Strategic Habitat Conservation and the NBCI 8
Monitoring NBCI Focal and Reference Areas 9
Sidebar #7: Coordinated versus Standardized Monitoring 9
Bird Population Monitoring 10
Sidebar #8: Top two dominant land cover classes for each Bird Conservation Region within the range of bobwhite from the 2006 National Land cover Dataset 10
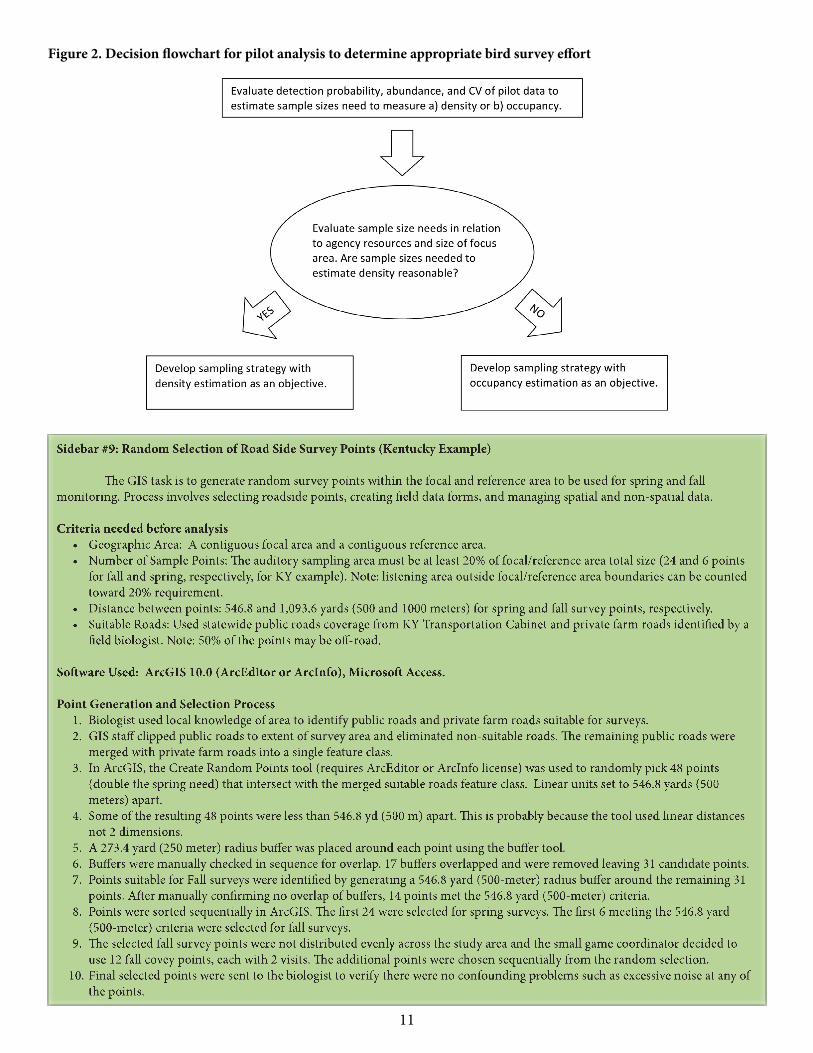
Figure 2. Decision flowchart for pilot analysis to determine appropriate bird survey effort 11
Sidebar #9: Random Selection of Road Side Survey Points (Kentucky Example) 11
Focal area goals 12
Habitat Monitoring 12
Sidebar #10 Creation of Field Data Form – Kentucky Example 12
Monitoring Practice Implementation 16
Sidebar #11 Example of a Habitat Point Map 17
Harvest Monitoring 18
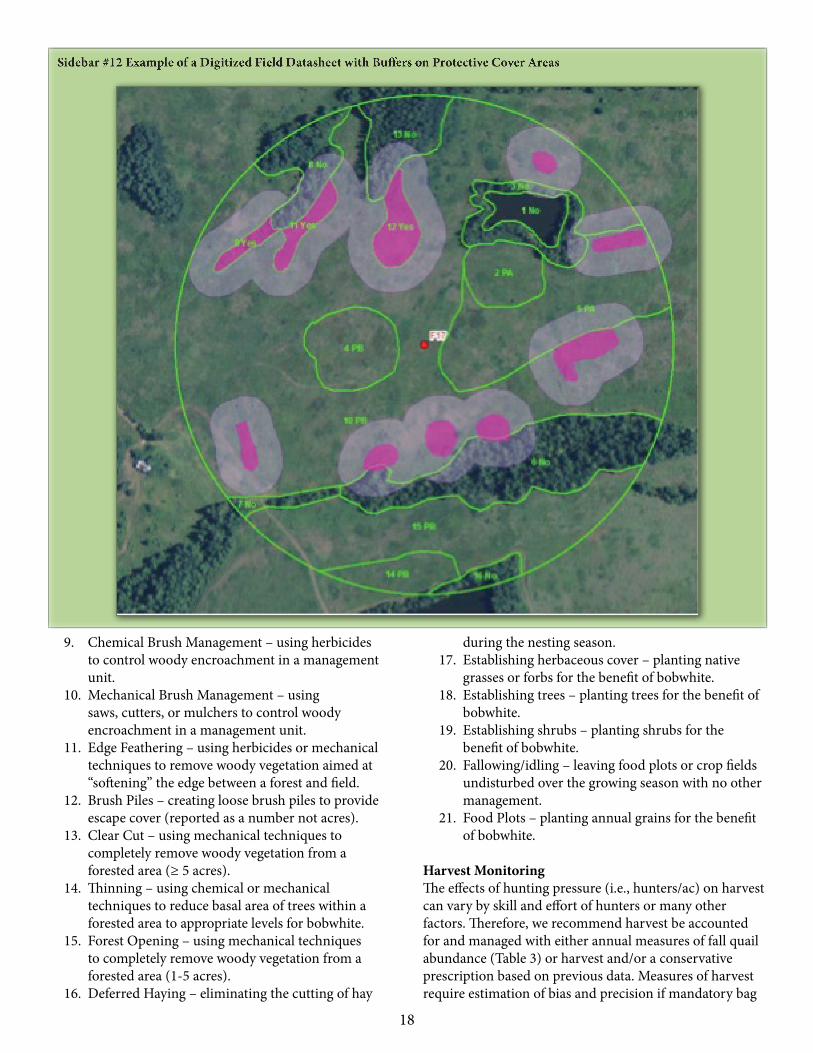
Sidebar #12 Example of a Digitized Field Datasheet with Buffers on Protective Cover Areas 18
Weather Monitoring 19
Domesticated Bird Monitoring 19
Data Management and Analysis 19
Program Assessment 20

Monitoring NBCI Regions and Landscapes: 20
4. Process Used to Develop the NBCI Coordinated Implementation Program ______________ 20
5. Periodic Updates of this Coordinated Implementation Program ______________________ 22
6. Conclusion ______________________________________________________________ 22
Literature Cited ____________________________________________________________ 23
Sidebar #13 Staff and Resource Needs 23
Appendix A. NBCI Focal Area Habitat Classification System __________________________ 26
Appendix B. Example datasheets for bird and habitat monitoring ______________________ 36
Bird datasheet example 1 36
Bird datasheet example 2 37
Habitat Monitoring Datasheet Example 38
Appendix C. _______________________________________________________________ 39

3
1. Introduction
Northern bobwhite restoration has challenged state fish and wildlife agencies for decades. Efforts aimed at increasing bobwhite numbers date back to the early 20th century (Stoddard 1931). In 1996, the Southeast Quail Study Group (currently the National Bobwhite Technical Committee (NBTC)) coalesced to share knowledge of individual state efforts to restore bobwhites. The group’s publication of the original National Bobwhite Conservation Initiative (NBCI) signaled the first multistate attempt at coordinating restoration of bobwhite quail across a substantial portion of their former range (Dimmick et al. 2002).
The NBCI was intended to foster development of individual state-based implementation or “step-down” plans. The plans were envisioned to translate Bird Conservation Region (BCR) habitat and bobwhite abundance goals to specific manageable areas within a state’s geography. Tight budgets, limited personnel and variable state agency commitment, combined with a strategic concept too unfamiliar to typical bobwhite management, resulted in few state implementation plans. Ultimately, the task of implementing NBCI at the state level was just too big a challenge in some instances.
The NBCI revision (NBCI 2.0, The National Bobwhite Technical Committee 2011; 2012; Terhune et al. 2012) greatly improved conservation planning for northern bobwhite across the species’ range. Thanks to the development and use of a Biologist Ranking Index (BRI) key enhancements included: 1) spatially explicit bobwhite density goals; 2) prioritized areas for bobwhite restoration; and 3) adoption of the Strategic Habitat Conservation (SHC) philosophy of learning through management and monitoring (Fig. 1).
The BRI was comprised of standardized input from >600 professional biologists through state-based workshops. They ranked the restoration potential across the species’ range by classifying 6,400-acre landscapes (i.e., pixels) to recover bobwhite populations. While ranking these areas, biologists also identified major threats and opportunities for habitat management.
Following the ranking of landscapes, NBCI 2.0 identified spatially-explicit bobwhite population density goals for each state (NBCI 2.0, Table 1, pages 47-49). State biologists as-signed two values: current bobwhite density (to describe conditions prior to prescribed management) and managed bobwhite density
(the NBCI population restoration goal). These densities are based on biologists’ expert knowledge and they are subject to revision as learning through monitoring oc-curs. By design, the BRI established “opportunity regions” that filled a critical planning void in the absence of state produced implementation or step-down plans. States no longer had to create an independent prioritization process for assessing conservation delivery potential for bobwhite.
A single bobwhite restoration layer served as an ideal platform for a range-wide, tiered conservation planning and implementation structure. The expert-based estimates of current bobwhite densities and managed density potential could be directly evaluated at multiple landscape scales across state lines. Periodic assessment of these hypotheses allows for an iterative process to assess near (5-year) and longer-term (10-year) successes of targeted habitat management.
While NBCI 2.0 prioritizes where bobwhite restorations should take place, states do not currently have the resources to reach target densities across all the high and medium restoration potential regions of the BRI. The NBCI Coordinated Implementation Program provides the framework for large-scale habitat management programs for bobwhite using a tiered approach to landscape planning and action. This scalable approach may assist landscape-scale restoration in states where resources and opportunities are currently limiting.
Most importantly, the NBCI Coordinated Implementation Program (CIP) establishes a range-wide restoration roadmap founded by collaboration with clear targets and accountability. The program demands monitoring that will be used to measure success and foster learning among states. Over a decade has passed since the publication of the NBCI, this program will inspire hope for the future. It will attract funding from public and private sources. Bobwhite-centric non-profits will have a clear purpose of where investments must be made and a renewed opportunity to rally grassroots support. Finally, the
Figure 1. The Strategic Habitat Conservation (SHC) process diagram

4
program will begin a new era for the NBTC, one fueled by collaborative, on-the-ground action.
2. Conservation Planning and Implementation Strategies
The vision of coordinated NBCI implementation is established through a tiered delivery approach. The focal tiers are designed to shrink the near-term targets for bobwhite restoration to reduce investments and risk to palatable levels while optimizing chances for near-term successes. For the first time, a single range-wide standard for bobwhite restoration will be established. Through voluntary coordination, the NBCI partners can produce powerful evidence supporting the habitat-based bobwhite restoration approach via reasonable investments by each partner. The partnership will build the NBCI brand to represent accountability, transparency and scientific rigor, creating attractive research opportunities across the bobwhite range.
Tiered DelivereyThe tiered delivery approach is founded on three layers. They are from smallest to largest in size and are as follows: focal areas, focal landscapes and focal regions.
1) NBCI Focal Area(s) – A contiguous, targeted area designed to increase the probability of achieving NBCI managed bobwhite densities (i.e., huntable populations) through strategic habitat management efforts in the
near-term (5 year benchmark, 10 year goal). NBCI focal areas ideally would be nested within a Focal Landscape and Focal Region. NBCI focal areas should be at least the minimum area needed to sustain a bobwhite population through time, regardless of landscape context. We hypothesize that this minimum area requirement after prescribed habitat management can be met if:
• The focal area has at least 1,500 acres of quail habitat (Appendix A), and
• The focal area is at least 25% quail habitat (Sidebar 1).
2) NBCI Focal Landscape(s) – A spatially defined landscape comprised predominantly of high priority ranking for bobwhite restoration through the NBCI BRI process. A focal landscape ideally would be nested within a focal region and contain a focal area.
3) NBCI Focal Region(s) – A spatially defined geographic region (e.g., soil & water district, cluster of counties, etc.) comprised predominantly of high and medium priority ranking for bobwhite restoration through the NBCI 2.0 BRI process. It would ideally contain 1 or more focal landscapes and focal areas.
States and conservation partners should begin with a focal area and build a focal landscape and region around it (Sidebar #2). This bottom-up approach focuses restoration efforts and resources in the near-term while establishing an opportunity for growth in the long-term. The BRI provides the framework for development of focal tiers by
Sidebar #1: Example and Background for Focal Area Minimum Size and Composition Examples: Assuming 100% planned quail habitat, the minimum size a focal area can be is 1,500 acres. However, if a focal area has only 25% quail habitat it would need to be 6,000 acres to reach the 1,500- acre minimum. Conversely, a larger 20,000-acre focal area would meet the requirements with 5,000 acres of quail habitat after management. Justification: The 1,500 acre minimum is a hypothesis based on the bobwhite movement study of Terhune et al. (2010) and the minimum viable bobwhite population work of Guthery et al. (2002). Guthery et al. (2000) estimated the minimum area required to sustain a bobwhite population for 100 years, with a 95% probability of success. Minimum viable populations (MVP) size are the result of the interaction of the effects of population growth (the species’ reproductive potential, e.g., breeding age, fecundity) and population depressors that are natural (weather, predation, old age, disease, accidents, etc.) and man-made (harvest). The minimum area needed to sustain the MVP then related to fall bobwhite densities. A population subject to winter catastrophes (i.e., more northerly latitudes, snow, ice, cold) and 40% harvest (maximum recommended by NBCI) would require a beginning fall population of 400 bobwhites to be sustainable. If that population would be subject to both summer and winter catastrophe then the beginning fall population should be 800 (Guthery et al. 2000). Many sates listed a managed density goal of around 3 acres per quail. Given this density and a MVP of 400-800 birds, the minimum amount of habitat needed would be 1,200-2,400. This matches closely with the estimate of 1,000 acres minimum needed to restore bobwhite populations in Georgia (Terhune et al. 2010). The 25% habitat cutoff is based on Swift and Hannon’s (2010) review of studies on critical thresholds for habitat loss. A critical threshold occurs when populations decline more rapidly at low levels of habitat in the landscape. The authors found critical threshold values can vary by species and landscape. However, many of the studies that looked at prevalence of a species had a minimum threshold between 20-30%. It is possible that less habitat can support viable populations of bobwhite. However, we relied on the best available science to set standards in the planning phase of this document. If subsequent monitoring reveals our minimum size is too small or too large the standards can be adjusted.

5
prioritizing landscapes within a state. Opportunity for habitat restoration can be related to a host of factors, i.e., landscape context, land ownership patterns, willing landowners, equipment, manpower, or conservation programs. Careful consideration for conservation delivery when selecting focal tiers is paramount for minimizing risk and maximizing the chance for success.
Bobwhite habitat can come in the name of countless
other conservation efforts. Therefore, it is important to take advantage of existing conservation initiatives. This is an excellent strategy to accelerate habitat development, expand resources, establish myriad partnerships, and accelerate momentum. Ideal places to start are Joint Ventures, State Technical Committees, or other established conservation partnerships (e.g., America’s Longleaf Initiative, Shortleaf Initiative, Nature Conservancy Priority Areas, game bird non-profits). Military bases are also great opportunities because they often manage for open land
to facilitate training and have directives for conservation, particularly for threatened and endangered species. Be open-minded and consider non-traditional partners such as those interested in invasive weed management or water quality improvement.
Motivation and excitement for managing bobwhite habitat can drive habitat implementation within focal tiers. Therefore, when evaluating potential areas for developing as focal tiers, use motivation of landowners, biologists, land managers, or other partners as ranking criteria. Include agency leadership (commissioners and administrators) and elected officials to leverage funding and manpower. The best technique to gauge and foster motivation is involving stakeholders from the project’s inception. This concept is not limited to private

6
lands. State agency personnel on public areas will also be empowered by being included in the focal tiers selection/delineation process. Never underestimate the value of highly motivated field personnel or landowners. Consider outside-the-box ideas such as a Conservation Celebration (e.g., party) and festivals, outreach and media campaigns.
A sense of ownership and competition can also be power-ful tools in successful focal tiers. Host planning meetings and involve key partners and personnel to develop a team that will energize conservation delivery. Work together on an outreach and media campaign. The following is a potential list of stakeholders to consider when establishing NBCI Focal Tiers:
• Landowners• State and local USDA offices• Field staff• Agency administrators• Non-government conservation partners• Political figures• Landowners cooperatives/organizations• Habitat teams/contractors• Corporate sponsors – an opportunity for habitat
teams
The property type is an important consideration when selecting a focal area. The following three scenarios are expected for property type composition with quail focal areas:
1) 100% Working Lands - Working lands are properties (often privately owned) where agriculture or forest production is the primary driver of management decisions. Examples include croplands, pasture lands, forest plantations, etc. (Sidebar 3)
2) 100% Non-working Lands - Conservation lands are properties where agriculture and forest production are not the primary drivers of management decisions. Examples include state wildlife areas, national wildlife refuges, military bases, utility/public easements, etc. (Sidebar 4)
3) Mixed Lands- A focal area containing working lands and non-working lands. This scenario often uses non-working land as a “core” area. (Sidebar 5)
Conservation land management alone cannot restore bobwhite, and many will refute success stories as “unrealistic.” Working lands focal areas however, can prove bobwhite restoration is possible across the range. A mix of working and conservation lands is also a viable option.
Ideally, every state would have at least one working lands NBCI focal area. Private land focal areas pose
unique challenges. Access, lack of technical expertise and equipment, and a lack of collaboration among neighbors are just a fraction of the hurdles. But, there are opportunities.
The Farm Bill has a long history as a catalyst for change on the private, working landscape. Consider the impact of Conservation Reserve Enhancement Program (CREP) in many states. Great work has occurred at state technical committees to localize habitat, and the Working Lands for

7
Wildlife Initiative is another potential source for funding. Many states have collaborative Farm Bill biologists and others have found ways to further incentivize conservation programs through payments from non-governmental organizations. Targeted marketing alone can help concentrate conservation practices. Prescribed burn associations and landowner cooperatives already exist in some areas to facilitate habitat delivery.
Understanding landowners’ interests and values can save time and money, and minimize risk of failure. Consider a human dimensions survey to help pinpoint the location for the best focal tiers and help guide a conservation delivery strategy (Dailey et al. 2004, Dailey 2009). Work can easily be done for bobwhite in the name of water quality, deer, turkey, songbirds, butterflies or ecosystem restoration and management. Learn what landowners care about so the pitch and programs can be customized.
Ultimately, think “big picture” when selecting focal tiers. How will a nested focal area lead to expansion of the habitat restoration practices beyond the focal area to the focal landscape and eventually across the focal region? How will one set of focal tiers lead to another? What impact will one set of focal tiers have over another? Consider prevailing land use … croplands, pasturelands, rangelands, and mine lands … and prioritize which would have the greatest impact in the state. In the long run, it may be prudent to have representatives in each category.
Other bobwhite-specific factors can influence focal tier success. Bobwhites are an avidly hunted species, which
can yield positive and negative outcomes. The passion to conserve bobwhite is often most fervently driven by those that hunt them. It also serves as a critical funding mechanism and economic engine for conservation. Hunting can also pose some challenges. Risk of localized overharvest could limit population response to habitat management, and the infusion of liberated, domesticated bobwhite can influence monitoring and pose risks to wild birds. These risks can be managed through well-planned focal tier implementation and outreach efforts.
Harvest NBCI 2.0 explicitly identifies management of hunter harvest of bobwhites as a factor that needs to be considered (Brennan 2011) in the context of achieving NBCI managed quail density goals: “…if hunting pressure is excessive and is not restricted, excessive harvest may result in lower bobwhite populations or hinder bobwhite response to new management actions.” (National Bobwhite Technical Committee 2011, p. 138; hereafter referenced as NBTC 2011).
A comprehensive review of bobwhite harvest research and management can be found in Sands (2010). Similar to other factors not directly related to habitat (e.g., weather, domesticated bobwhites) that can reduce survival of bobwhites, over-harvest can lead to erroneous conclusions about the effectiveness of the NBCI Focal Areas. Management of harvest is a cornerstone of NBCI Focal Areas because it is within managers’ control. The harvest objective for focal areas should be that harvest does not reduce long-term annual bobwhite population density, hereafter called ‘safe’ harvest. We define harvest rate as the proportion of fall bobwhite population that is taken by hunters, where ‘take’ includes quail wounded but not retrieved, assumed to be 20% of the retrieved harvest if area-specific data are not available.
The recommended safe harvest rate on both focal and reference areas is 20-40%, increasing with latitude and decreasing with days between harvest and the breeding season (i.e., harvest occurring in February or March requires lowering safe harvest level). If no other data exists, a conservative hunting pressure prescription can be managed for based on the following guidance: for southern latitudes <1.6 hunters/100 ac (Rolland et al. 2010 estimated <4 hunters/km2 for public land managed for bobwhites), and for northern latitudes 2.9 hunters/100 ac (Dailey 1997 estimated 2.9 hunters/100 acres resulted in harvest rate of 35% of fall population for public land managed for bobwhites). Extrapolated to typical NBCI focal area scales, safe hunting pressure prescriptions are 97 and 174 hunters/6,000 acres, South and North, respectively.

8
Harvest strategies for focal landscapes and regions should be evaluated as learning takes place at the focal area level.
Domesticated BobwhitesUse of domesticated bobwhites is widespread, owing to traditional recreation such as field trials, and to declining huntable wild bobwhite populations. Domesticated bobwhites have virtually replaced wild bobwhite hunting in some states, particularly in the eastern United States (NBCI 2011). In these states, interest in restoration of wild bobwhites is strongly and positively related to recreational use of domesticated bobwhites. However, there are a wide variety of potential detrimental effects on wild bobwhite populations from released domesticated bobwhites. Concerns include disease transmission, higher depredation, lower nest success and reduced genetic vigor (Roseberry et al. 1987, Hurst et al. 1993, DeVos and Speake 1995, Fies et al. 2000, Sisson et al. 2000, Perez et al. 2002, Hutchins and Hernandez 2003, Evans et al. 2009, Gerhold et al. 2012, Palmer et al. 2012, Thackston et al. 2012).
Furthermore, domesticated bobwhite that call (whistle) during population abundance sampling periods (fall or breeding season) can lead to biased estimates of wild bobwhite abundance. Focal areas should ideally have no domesticated bobwhite releases. In working land environments, banned bobwhite release may be unrealistic, so monitoring and efforts to minimize release through information and outreach should be employed. Recommendations for focal landscapes and regions should also be evaluated as learning takes place through focal areas.
3. Monitoring
One of the greatest challenges in the management
of resident game species is coordinating monitoring programs across state lines. Existing long-term state monitoring programs are difficult to abandon and interstate collaboration towards identical procedures and protocols can be onerous. However, the bobwhite community has already implemented a tremendously effective coordinated monitoring program through CP-33 (a 14-state partnership, Burger et al. 2006). The time has come to build on that success.
The NBCI defines success by the degree to which bobwhite populations achieve target densities, but it is equally important to understand why target densities are or are not reached. Therefore, NBCI 2.0 emphasizes the importance of SHC (Sidebar #6). It “provides a framework for setting and achieving conservation objectives at multiple scales, based on the best available information, data, and ecological models” (National Ecological Assessment Team 2006). SHC is an iterative process of planning, implementation, and learning. The NBTC and its member states have done the first step of the cycle through the BRI, but we must now incorporate conservation delivery supported by monitoring and research. Additionally, monitoring must track if the planned actions were accomplished and if the accomplishments resulted in the expected outcomes.
Monitoring is the feedback loop for learning. So, monitoring has to be reasonably science-based and defensible. A defensible monitoring program has objectives that:
• link to management goals and conservation actions• estimate metrics with sampling methods that permit
unbiased and statistically powerful results• minimize cost and logistical problems• ensure program continuity despite changes in
personnel, technology, and objectives; and• make monitoring results available to a variety of
http://www.fws.gov/landscape-conservation/index.html

9
partnersWhile some states are currently monitoring focal areas, the methods used vary widely. As a result, comparisons across state boundaries are difficult. Standardized and coordinated monitoring (Sidebar #7) would allow pooling of data across state boundaries, improving and accelerating the learning process of SHC. Faster learning and greater confidence in outcomes may increase financial and public support for the bobwhite habitat management paradigm. Knowledge gained from understanding habitat and bobwhite density response can calibrate expectations with management effort and lead to more cost effective management efforts.
Coordinated monitoring also fulfills the need for transparency in state reporting of bobwhite management accomplishments. The idea of transparency was first advanced by the ‘Tracking Bobwhite Restoration Success’ ad hoc committee (Restoration Success committee) in the report provided for the 2009 Southeast Quail Study Group annual meeting. They stated that “credibility is the key to keeping and increasing agency and citizen support for habitat management efforts.” The Restoration Success committee’s approach was not implemented, because, in part, an agreement on a method of measuring bobwhite abundance could not be reached.
A coordinated effort to monitor bobwhite across state boundaries could inform the adaptive management process and improve probability of successful recovery in the long-term across the bobwhite range. Understanding bobwhite densities within focal areas (and unmanaged reference areas) is a critical component to the NBCI revision. It is the only means to demonstrate programmatic outcomes (i.e., population recovery) with respect to programmatic outputs (i.e., habitat acres).
In addition, combining results from multiple states can increase the confidence that the relationship between habitat and bobwhite population responses is general across the range and not specific to an individual focal area (Morrison 2012). Therefore, standardization, and, if possible, coordination of monitoring across focal areas is a monumental first step toward improving evaluation processes across the bobwhite range. It will represent an institutional and cultural shift in resident game bird management, fostering assessment of NBCI successes and re-direction of NBCI recovery efforts, if necessary.
Monitoring NBCI Focal and Reference AreasThe foundation of the focal tiers concept is a coordinated monitoring program at the focal area level. Success stories across the range will serve as a catalyst for greater motivation and investment in the focal landscapes and
regions over time. However, not all focal areas will see strong responses. Responses could be limited by extrinsic (i.e., weather, landscape context) or intrinsic (very low bobwhite population) factors.
Therefore, reference areas are an integral component of the NBCI Focal Area Program. They are intended to serve as a “safety net” should bobwhite population response be less than anticipated. Reference areas provide a point of comparison (via trend data) to illustrate the value of habitat despite a shortfall in attaining target bobwhite
densities.
A reference area should be representative of the BCR that contains the focal area, but without concentrated bobwhite habitat management. Ideal reference areas represent the landscape’s “business as usual” and no special emphasis should influence the area. Guidance for selection and status of focal areas and reference areas include the following principles:
• Must be within ±10% of the 2 dominant land covers (measured by level II National Land cover Data www.mrlc.gov/index.php) of the eco-region (Sidebar #8);
• Exposed to similar weather conditions as the focal area;
• Should have at least a medium ranking in the BRI;• Should be within 10% of the focal area size and the
minimum is set by space needed for sampling;• Should be at least 2 times the median bobwhite

10
dispersal distance for the region (derived from the literature) away from the focal area. Justification can also be provided that ensures independence of the areas (e.g., natural barriers);
• A reference area can be used for more than one focal area as long as the above requirements are still met.
Bird Population MonitoringMonitoring populations to evaluate landscape-level effects of management prescriptions is limited by resource availability. Ideally, monitoring programs would include measures of abundance (e.g., density) and measures of vital rates (demographic rates for survival and productivity). Density measures can be used to indicate “how much habitat is needed” and population trends, while vital rates can answer the “why” questions that help to understand the overall ecosystem processes. Density measures are usually less resource intensive and can be implemented at much larger extents than measures of vital rates.
Below we provide several options for monitoring programs in ranked order and a recommended minimum level of commitment for all states. Option number 1 is ideal. Option 2 is recommended and option 3 is a minimum recommendation. One to two years of pilot data should be collected to determine the metric (Figure 2) for sampling and to identify monitoring intensity through a power analysis. The required sample size can be estimated from
the pilot data using the formula from Buckland et al. (2001 pg. 245):1. Density (Spring and Fall with control) with population dynamics:
a. Is there a relationship between habitat management and bobwhite productivity, survival, etc.?
ANDb. Is there a relationship between habitat
management and density?i. Monitor treatment and reference areas in springii. Monitor treatment and reference areas in fall
2. Density (Spring and Fall with reference
area) without population dynamics:Is there a relationship between habitat management and density?
i. Monitor treatment and reference areas in springii. Monitor treatment and reference areas in fall
3. Density (Spring with reference, Fall without reference area) without population dynamics:
a. Is there a relationship between habitat management and density?
i. Monitor treatment and reference areas in springii. Monitor treatment areas only in fall
Bird Conservation Region (BCR) Dominant Land cover Types Percent of BCRPrairie Potholes (11) Cultivated Crops 56%
Grassland/Herbaceous 23%Lower Great Lakes/ St. Lawrence Plain (13) Deciduous Forest 28%
Pasture/Hay 19%Badlands and Prairies (17) Grassland/Herbaceous 62%
Scrub/Shrub 14%Shortgrass Prairie (18) Grassland/Herbaceous 48%
Cultivated Crops 29%Central Mixed Grass Prairie (19) Grassland/Herbaceous 44%
Cultivated Crops 33%Edwards Plateau (20) Scrub/Shrub 58%
Evergreen Forest 18%Oaks and Prairie (21) Grassland/Herbaceous 30%
Pasture/Hay 19%Eastern Tallgrass Prairie (22) Cultivated Crops 52%
Pasture/Hay 16%Prairie Hardwood Transition (23) Cultivated Crops 36%
Deciduous Forest 20%Central Hardwoods (24) Deciduous Forest 45%
Pasture/Hay 25%West Gulf Coastal Plain/Ouachitas (25) Evergreen Forest 27%
Pasture/Hay 15%Mississippi Alluvial Valley (26) Cultivated Crops 54%
Woody Wetlands 22%Southeastern Coastal Plain (27) Evergreen Forest 22%
Woody Wetlands 17%Appalachian Mountains (28) Deciduous Forest 58%
Pasture/Hay 13%Piedmont (29) Deciduous Forest 34%
Pasture/Hay 18%New England/Mid-Atlantic Coast (30) Deciduous Forest 23%
Woody Wetlands 12%Peninsular Florida (31) Woody Wetlands 27%
Emergent Herbaceous Wetlands 14%Chihuahuan Desert (35) Scrub/Shrub 85%
Grassland/Herbaceous 7%Tamaulipan Brushlands (36) Scrub/Shrub 52%
Grassland/Herbaceous 18%Gulf Coastal Prairie (37) Cultivated Crops 20%
Emergent Herbaceous Wetlands 19%
11
Figure 2. Decision flowchart for pilot analysis to determine appropriate bird survey effort

12
ORb. Is there a relationship between habitat management
and occupancy? (Occupancy to be used if abundance is too low to calculate density)
i. Monitor treatment and reference areas in spring
Fall monitoring is logistically more difficult than spring monitoring, because of the number of points that can be monitored per person in one day (1 point/person/day in fall vs. >10 points/person/day in spring). However, fall populations are the basis for NBCI population objectives and should be monitored in treatment areas where density can be calculated.
The tables below outline the criteria for establishing bird monitoring in an NBCI Focal and Reference Area. Table 1 sets the basis for standardized monitoring, whereas Table 2 and 3 establish a coordinated monitoring program fostering a more robust dataset for future analyses across state lines. The objective of the monitoring effort is to measure bird density and habitat changes over time. The establishment of monitoring points for bird monitoring will also serve as the sampling location for measuring habitat. At a minimum, bird density changes will be compared with habitat change to test the NBCI’s habitat-centric approach for restoring northern bobwhite.
FOCAL AREA GOALS 1. Achieve 50% of the NBCI managed bobwhite density
goal (NBTC 2011) in <5 years and 100% by ten years. For areas measuring occupancy, achieve the ability to measure density in <5 years and 50% of managed bobwhite density goal in 10 years.
2. Achieve 100% of the quail habitat target (minimum of 1,500 acres) in <5 years and maintain that habitat until year 10.
Habitat MonitoringHabitat monitoring on focal areas and reference areas serves three purposes: 1) assess progress toward planned quail habitat goals on focal areas; 2) compare the change in planned quail habitat on focal areas and reference areas and the relationship of these changes to bobwhite population changes; and 3) to compare the relationship of changes in habitat types to bobwhite population changes.
A two-part process will be used for the habitat monitoring. The first is cover mapping the focal and reference areas at years 1, 5, and 10. The cover map will be used for habitat configuration analysis, using software programs such as Fragstats, and for planning habitat management. The second is a habitat survey at each bird survey point. The habitat survey will occur between the average last frost-free day in spring and the average first frost date in fall.

13
!"#$%&'( )#"*+"'+!"#$%&'()*+"#, -'.&+,)*/0"%)"+,")"'1),'.&+,)+,*,+,'0,)"+,"2))3,0/##,'1,1)4"#$%&'()&'.,'4&.5)
46/7%1)0/8,+)9:;)/*)*/0"%)"+,"<)/+)*/%%/=)>70?%"'1)@9::AB2C,"47+,4)/*)+,*,+,'0,
3,*,+,'0,)4&.,4)#"'1"./+5)*/+)4$+&'(<)$+,*,++,1)*/+)*"%%2))3,*,+,'0,)"+,"4<)=6,')4"#$%,1<)46/7%1)6"8,).6,)4"#,)4"#$%&'(),**/+.)"4)*/0"%)"+,"4)@,2(2<)4"#,)'7#D,+)/*)$/&'.4<)4"#,)'7#D,+)/*)8&4&.4)=&.6&')4,"4/'B2))!"#$%&'()+,*,+,'0,)"'1).+,".#,'.)@*/0"%)"+,"4B)4&.,4)46/7%1)D,)=&.6&')E)1"54)./)#&'&#&F,).,#$/+"%)8"+&"D&%&.52)G1,"%%5<)$+,H#"'"(,#,'.)47+8,54)46/7%1)"%4/)D,)0/'170.,1)./)$+/8&1,)")D"4,%&',),4.&#".,)&*)/.6,+)+,0,'.)1".")4/7+0,4)"+,)'/.)"8"&%"D%,2
I/&'.J).+"'4,0.)$%"0,#,'.
3"'1/#)4,%,0.&/')/*)$/&'.4)@!&1,D"+)9B<).+"'4,0.4<),.02<).6+/7(6/7.).6,),'.&+,)*/0"%)"'1)+,*,+,'0,)"+,"42)I/&'.4)46/7%1)D,)$%"0,1)/')+/"142)K/=,8,+<)4/#,)$/&'.4)@7$)./)L:;B)#"5)D,)$%"0,1)/**)+/"1)./)0/#$"+,)$/$7%".&/'),4.&#".,4)D,.=,,')/**)"'1)/')+/"1)$/&'.42
M,#$/+"%)+,$%&0".&/')"#/'()5,"+4
N''7"%%5)@&2,2<)1/)'/.)4?&$)5,"+4B2)
I/&'.)$%"0,#,'.)/8,+).&#,
!.".&0)*/+)L)5,"+4)"'1).6,')+,H,8"%7".,2
O'&.)/*)#,"47+, P,'4&.5)@/007$"'05)&')"+,"4)=&.6).//)*,=)1,.,0.&/'4)./),4.&#".,)1,'4&.5B2M,#$/+"%)+,$%&0".&/')=&.6&')4,"4/'
!$+&'(Q)N.)%,"4.).=/R)S"%%Q)/',)&')6&(6,+)1,'4&.5)"+,"4<).=/)/+)#/+,)&')%/=,+)1,'4&.5)"+,"42)I/=,+)"'"%54&4)&1,"%)./)1,.,0.)")+,4$/'4,)L:;)"'1)A::;)/*)."+(,.)@S&(7+,)9B2
-**,0.)4&F, N.)%,"4.)L:;)/*)T>UG)#"'"(,1)1,'4&.5)(/"%)&')L)5,"+42)!.".&4.&0"%)#,"47+,4)/*)$+,0&4&/'
N00,$."D%,)%,8,%4)/*)$+,0&4&/')*/+)1,'4&.5),4.&#".,4)46/7%1)D,)1,8,%/$,1)74&'()$+,%&#&'"+5)1".")@V9:;)U/,**&0&,'.)/*)W"+&".&/')")."+(,.B2
P,.,0.&/')$+/D"D&%&.5
C74.)D,),4.&#".,1)./)"00/7'.)*/+)&#$,+*,0.)1,.,0.&/')/*)0/7'.42
U/8"+&".,4 K"D&.".)#"'"(,1<)=,".6,+<)6"+8,4.<)%"'1)0/8,+<)6"D&.".)&'1,X2U/8"+&".,4)*/+),4.&#".&'()1,.,0.&/')$+/D"D&%&.5
Y&'1<)'/&4,<)=,".6,+<)D"+/#,.+&0)$+,447+,<)/D4,+8,+)GP2)
N447#$.&/'4 N447#&'()6&(6,+)1,'4&.5)&4)"')&'1&0"./+)/*)Z7"%&.5)6"D&.".2))S/+)#,.6/1)"447#$.&/'4<)4,,)+,.+,".)/D[,0.&8,)\]2
Table 1. Standardized focal area monitoring criteria to measure density for the focal and reference area. The standards also permit estimation of the percent of area occupied (occupancy) for focal and reference areas with low populations.

14
!""#$%&"' ('")*+*,*-.!"#$%&'!%()*+ ,#%%-.+/')%()*+0'-"#.+/'12%'3%(4'5(66.+/'3%#.*-'7*#'8*892.1%)'.+'12%'(#%(:'8"1'(6)*'
5*+).-%#.+/'*12%#')3%5.%)'*7'.+1%#%)1;<%+/12'*7')"#$%&'3%#.*- =33#*>.?(1%6&'('@'9%%4'9.+-*9:'5%+1%#%-'*+'3%(4'*7'5(66.+/;!3%5.%)'?%()"#%-
H.+"1%)'(1'('3*.+1 I'?.+"1%)'9.12'*+%'?.+"1%'.+1%#$(6);!1(#1'(+-')1*3'1.?% J(67'2*"#'8%7*#%')"+#.)%'"+1.6'K'2*"#)'(71%#')"+#.)%0'#%5*#-')1(#1'1.?%'7*#'%(52'
3*.+1;L8)%#$(1.*+) B%5*#-'(51"(6'6*5(1.*+'*7'7.#)1'-%1%51.*+'*7'1(#/%1'8.#-)'").+/'MN6%11%#')3%5.%)'5*-%'
*+'(%#.(6'?(3)'9.12'-.)1(+5%'5#*))2(.#)'3#.+1%-'7*#'/".-%)'.+1*'(33#*3#.(1%'ON?.+"1%'.+1%#$(60'6*5(1.*+)'1*'8%'%+1%#%-'.+1*'PQ!;''E!.-%8(#'10G
H.+.?"?'-.)1(+5%'8%19%%+'3*.+1)
I46.8 yd (50R'?)'E,"546(+-'SRROG;
T*.+1'5*"+1'#(-.") 273.4 yd (SIR'?)')3#.+/'E5(;'MU'(5#%)G'!3(1.(6'#%36.5(1.*+'E+"?8%#'*7'3*.+1)G
V%1%#?.+%-'8&'-%).#%-'%77%51').W%'(+-'3#%5.).*+;'A suggested starting point is to sample enough points to represent a minimum of 20% of the area.''
B(-.") Y+6.?.1%-'.+'12%'7.%6-:'6.4%6&'1#"+5(1%'(1'273.4 yd (SIR'?)'7*#'(+(6&).);Z%?3*#(6'#%36.5(1.*+'9.12.+')%()*+
B%5*??%+-'S'9%%4)'1*'.?3#*$%'52(+5%)'*7'5(31"#.+/'12%'3%(4;
L#-%#'*7'$.).1.+/'3*.+1) B%$%#)%'#*"1%)'7*#'%(52'#%3%1.1.*+;
Northern bobwhite and any priority species within the state or Bird Conservation Region.
Table 2. Spring NBCI coordinated monitoring protocol (Distance Removal Method), attributes and methodologies.

15
!""#$%&"' ('")*+*,*-.!"#$%&'!%()*+ ,(--./%+012'*3')"#$%&'4%#5*6 744#*859(1%-&'(':;<'=%%>'=5+6*=?'@%+1%#%6'*+'@(--5+0'4%(>?'A"1'1%#95+(1%6'4#5*#'
1*'2"+15+0.''B1'5)'#%@*99%+6%6')(94-5+0'A%05+'%(#-&'5+'12%')%()*+'1*'9(8595C%'*44*#1"+51&'1*'@*--%@1'6(1('"+6%#'A%)1'=%(12%#'@*+6515*+).
D5+"1%)'(1'('4*5+1 EF'95+"1%).!1(#1'(+6')1*4'159% EF'95+"1%)'A%3*#%')"+#5)%'"+15-')"+#5)%.G(--5+0'H"(5-'*A)%#$(15*+) I%@*#6'(@1"(-'-*@(15*+'(+6'159%'*3'35#)1'6%1%@15*+'*3'@*$%&)'J=512'"+5H"%'+"9A%#K'
*+'(%#5(-'9(4)'=512'@#*))2(5#)'4#5+1%6'3*#'0"56%)?'1*'A%'%+1%#%6'5+1*'LB!.'G(--5+0' H"(5-'4%#@%5$%6'1*'A%'M32.8 yd (NO'9)'(4(#1'(#%'@-())535%6'()'MP'@*$%&.'Q%'@*+)%#$(15$%' =2%+'6%@565+0'=2%12%#'*#'+*1'12%#%'5)'MP'@(--5+0'@*$%&'5+'('R)9(--S'(#%(.
,-")2%6'H"(5-'*A)%#$(15*+) I%@*99%+6%6'12(1'MPO'@*$%&)'A%'3-")2%6'1*'@*"+1'+"9A%#'*3'5+65$56"(-)'4%#'@*$%&'3*#'@(-@"-(15*+'*3'H"(5-'4%#'(@#%?'$%#)")'@*$%&)'4%#'(@#%?'(+6'1*'-%(#+'*A)%#$%#'(@@"#(@&'5+'56%+153&5+0'-*@(15*+)'*3'@(--5+0'H"(5-.
D5+59"9'65)1(+@%'A%1=%%+'4*5+1)
1,093.6 yd (P?OOO'9)'JQ"@>-(+6'TOOPK.
U*5+1'@*"+1'#(65") 546.8 yd (FOO'9)'JV%--%+6*#3'%1'(-.'TOOE?'!%5-%#'%1'(-.'TOOFK.',*#'4-(@5+0'4*5nts '3*#'A*12')4#5+0' (+6'3(--'@*"+1)W'#(+6*9-&'@2**)%'3(--'4*5+1)'35#)1?')2#5+>'6*=n '#(65")'(+6'12%+'@2**)%'#%9(5+5+0')4#5+0'4*5+1).
X"9A%#'*3'4*5+1)'1*')(94-%'(+6'*A)%#$(15*+)'4%#'4*5+1
Y%1%#95+%6'A&'6%)5#%6'%33%@1')5C%'(+6'4#%@5)5*+.'V512*"1'45-*1'6(1('(')1(#15+0'+"9A%#'=*"-6'A%'%+*"02'4*5+1)'1*')"#$%&'(1'-%()1'TOZ'*3'3*@(-'(#%(.'L5$%+'TOZ')(94-5+0'(+6'('3*@(-'(#%('*3'(1'-%()1'P?FOO'(@#%)'J(A*"1'<?'FOO;9')(94-5+0'@5#@-%)K?'#%@*99%+6%6'+"9A%#'*3')(94-5+0'4*5+1)'5+'3(--'5)'(1'-%()1'T.'G*--%@1'6(1('3#*9'%(@2'*3'12%)%'4*5+1)'MP'159%.
[#6%#'*3'$5)515+0'4*5+1) I(+6*95C%'*#6%#'*3'$5)51)'53'+*1'$5)515+0'(--'4*5+1)'5+'*+%'6(&.X*5)%'-%$%- O?P?T?N'+*5)%'5+6%8'()'@*$(#5(1%.V%(12%# I%@*99%+6%6'1*'($*56')(94-5+0'53'@-*"6'@*$%#'M\FZ'*#'Q%("3*#1'=5+6'5+6%8'ME.'B3'
4*5+1)'(#%'*+-&'$5)51%6'*+@%'JP'#%4-5@(15*+K?'51'5)'#%@*99%+6%6'A%)1'=%(12%#'@*+6515*+)'A%')*"021?'5.%.?')1(A-%'*#'#5)5+0'A(#*9%1#5@'4#%))"#%?'@-%(#')>&'(+6'=5+6')4%%6']T'JQ%("3*#1K.
^5)"(-_'("651*#&'6%1%@15*+ 7"651*#&'*+-&.`-%@1#*+5@'@*$%&'@(--) I%@*99%+6%6'*+-&'(31%#'P'@*94-%1%'#%4-5@(15*+.[A)%#$%# `(@2'=512'('"+5H"%'56%+1535%#'*#'3"--'+(9%).'I%@*99%+6%6W'(++"(-'1#(5+5+0'3*#'(--'
*A)%#$%#).'[+%'*#'9*#%'*A)%#$%#'4%#'4*5+1.Y%1%@15*+'4#*A(A5-51& D")1'A%'%)159(1%6'1*'(@@*"+1'3*#'594%#3%@1'6%1%@15*+'*3'@(--5+0'H"(5-.G*$(#5(1%) a(A51(1'9(+(0%6?'=%(12%#?'2(#$%)1?'-(+6'@*$%#?'2(A51(1'5+6%8.G*$(#5(1%)'3*#'%)159(15+0'6%1%@15*+'4#*A(A5-51&
Q(#*9%1#5@'4#%))"#%'(1'OPOO'(+6'O\OO'2*"#)b'=5+6;Q%("3*#1')@(-%b'4%#@%+1'@-*"6'@*$%#b'+*5)%'-%$%-'(+6'*A)%#$%#'BY.'
7))"9415*+) c'[Ad%@1)'*+'12%'4*5+1'(#%'6%1%@1%6'=512'@%#1(5+1&bc'[Ad%@1)'(#%'6%1%@1%6'(1'12%5#'5+515(-'-*@(15*+b'(+6c'D%()"#%9%+1)'(#%'%8(@1'JQ"@>-(+6'%1'(-.'TOOPK.
Table 3. Fall NBCI coordinated monitoring protocol (Covey Point Count) attributes and methodologies.

16
The habitat survey will produce a more detailed estimate of habitat types for the focal and reference areas. There are three frequencies at which the habitat survey can be done:
• Best- Annual Survey• Good- Survey every other year• Minimum- Survey at years 1,5, and 10
We developed a habitat classification system (Appendix A) and data sheet that should be used for the habitat surveys and the cover mapping. The data sheet asks for values to characteristics considered important for bobwhite habitat. These values can then be used to determine if a habitat patch is considered quail habitat according to the classification system. The classification system is considered an a priori model of quail habitat. Future analysis will help inform the accuracy of the model and help improve the classification system.
Habitat surveys should record the lowest habitat type category for all habitat patches within 273.4 yd. (250 m.) from the bird sampling point. Habitat survey mapping (sidebar #11 of example point map) is conducted with a recent (within the last five years,) high resolution, aerial photograph (≤2 m-resolution) printed on standard letter paper. The minimum size patch that should be delimited is 1,076.4 yd2 (900 m2), which is a 32.8 yd by 32.8 yd (30m by 30m) square. Each delineated polygon should be numbered and characterized using the habitat data sheet (Appendix B for example datasheet). Special focus is afforded to protective cover mapping (sidebar #11 of example point map). Protective cover is defined as vegetation that provides year-round overhead protection from predators and inclement weather. The composition of protective cover can vary by region and habitat but should be a minimum of 314 sq. ft., which is approximately a 10-foot radius circle or a 10 ft. X 31 ft. rectangle. Field maps should be digitized in ArcGIS (sidebar #12 example image). State-specific training should be conducted before any individual conducts a habitat survey in every survey year.
Two options exist for determining the habitat type for the surveys. They are:
• Gold—An observer will visually group habitat types from a distance and then verify the habitat classification by walking through each grouping of habitat types.
• Silver—An observer will identify habitat classification from a few points within the 250 m radius of the bird sampling point. The area is not walked. This method is likely the only level that can be achieved from roadside surveys.
The primary difference between the cover mapping and
the habitat surveys is the level of detail within the habitat classification systems that can be achieved. Cover mapping should be performed using a high-resolution aerial photograph (≤2.2 yd (2 m)-resolution) at a 1:8,000 scale. The minimum patch size delimited for cover mapping is the same as the habitat survey. Habitat for the cover maps should be done to the lowest habitat type category possible within the classification system. For example, within the open habitat types it may only be possible to distinguish crop from herbaceous and shrub, but not grass dominant from forb dominant.
Monitoring Practice ImplementationA primary tenet of the NBCI Focal Area Program is to demonstrate the relationship of bobwhite density with available habitat. Habitat can be manipulated through a multitude of practices. Although it is unlikely that focal area data will be robust enough to tie bird response to specific practices, monitoring practices within a focal area can help generate cost estimates for quail restoration and serve as a measure of conservation effort. The tracking of practices within focal areas will be required annually as a component of the NBCI Annual Inventory. Ideally, practices would be spatially explicit to avoid double counting of acres managed. A bobwhite management practice is defined as an activity that a state fish and wildlife agency would be willing to pay a landowner to implement for the benefit of bobwhite. The following is a list of practices that would require tracking in acres:
1. Herbaceous Chemical Control – using herbicides to control unwanted non-woody vegetation including invasive exotic control and setting back succession.
2. Growing-Season Fire – using a controlled burn during the growing season to thin grass, promote forbs, control woody plants, or reduce litter, among others.
3. Dormant-Season Fire – using a controlled burn during the dormant season to promote grass, control woody plants, create bare ground, or reduce litter, among others.
4. Partial Disking – using a disk to create at least 80% bare ground in a contiguous patch or block (> ¼ acre) within a field or by breaking the field into strips.
5. Whole-Field Disking – using a disk to create at least 80% bare ground across an entire field.
6. Patch-Burn Grazing – using annual, rotational controlled burning to manipulate livestock grazing pressure across a management unit.
7. Rotational Grazing – using fencing and animal movement to systematically direct livestock grazing pressure across a management unit.
8. Deferred Grazing – removing livestock from a management unit during the nesting period.

17
H H
H
HH
W
W
WW
W
18
9. Chemical Brush Management – using herbicides to control woody encroachment in a management unit.
10. Mechanical Brush Management – using saws, cutters, or mulchers to control woody encroachment in a management unit.
11. Edge Feathering – using herbicides or mechanical techniques to remove woody vegetation aimed at “softening” the edge between a forest and field.
12. Brush Piles – creating loose brush piles to provide escape cover (reported as a number not acres).
13. Clear Cut – using mechanical techniques to completely remove woody vegetation from a forested area (≥ 5 acres).
14. Thinning – using chemical or mechanical techniques to reduce basal area of trees within a forested area to appropriate levels for bobwhite.
15. Forest Opening – using mechanical techniques to completely remove woody vegetation from a forested area (1-5 acres).
16. Deferred Haying – eliminating the cutting of hay
during the nesting season.17. Establishing herbaceous cover – planting native
grasses or forbs for the benefit of bobwhite.18. Establishing trees – planting trees for the benefit of
bobwhite.19. Establishing shrubs – planting shrubs for the
benefit of bobwhite.20. Fallowing/idling – leaving food plots or crop fields
undisturbed over the growing season with no other management.
21. Food Plots – planting annual grains for the benefit of bobwhite.
Harvest MonitoringThe effects of hunting pressure (i.e., hunters/ac) on harvest can vary by skill and effort of hunters or many other factors. Therefore, we recommend harvest be accounted for and managed with either annual measures of fall quail abundance (Table 3) or harvest and/or a conservative prescription based on previous data. Measures of harvest require estimation of bias and precision if mandatory bag
19
checks are not conducted. The minimum recommended approach for harvest is to collect data annually and/or to use outreach to inform hunters and landowners of appropriate harvest rates and the importance of reporting bobwhite harvest.
Measuring or estimating harvest is a common practice in wildlife management. As a result there are numerous methods for collecting this data. Below is a list of recommended methods for estimating harvest ordered by reliability. However, the most reliable method may not be appropriate for all situations, so advantages and drawbacks are discussed.
• Trained check station operator with mandatory check-in: This provides the most reliable and informative data, but may not be feasible for focal or reference areas with a large portion of private land. Self-reporting can be unreliable (unreported bag) on areas where a fixed number of birds can be harvested throughout season (i.e., season closes when number is met),
• Trained bag checker with timed systematic sampling schedule and volunteer response: bag checker sets up and/or searches convenient locations (roads, parking lots, residences, etc.).
• Mandatory self-reporting, daily or periodic (weekly, monthly or end-of-season). Requires special permits and enforcement, (e.g., eligibility for future hunts, etc.). This is common practice for deer and wild turkey.
• Voluntary daily self-reporting via survey cards (lacks enforcement mechanism). This low-cost approach can be unreliable, with some hunters exaggerating their effectiveness, and others under-reporting harvest because they are secretive or they know reported bag affects closure of hunting season. This approach has some merit as an index of harvest, but little value as an unbiased estimator, unless bias is measured and understood.
• Voluntary post-season questionnaire via telephone, Internet or mail. This approach is even more unreliable, mixing exaggeration with memory recall, but at least the motivation to under-report is not an issue.
Weather MonitoringExtreme weather events are unpredictable and can significantly impact bobwhite populations across their range. These events have the potential to negate population gains associated with habitat change on a focal area. Therefore, when a strong relationship does not exist between habitat and bobwhite population, it is recommended to explore the relationship of populations to weather. Currently, the National Oceanic and Atmospheric
Administration (NOAA) monitors weather at over 8,000 weather stations nationwide. The following weather factors are most likely to have the greatest effect on bobwhite populations and can be monitored using NOAA data (other weather related factors may be important as well).
1. Excessive Rainfall 2. Snow/ Ice Coverage3. Temperature
• Over winter Low• Summer High
4. Drought
Domesticated Bird MonitoringWe strongly recommend selecting NBCI focal and reference areas where domesticated bobwhites can be prohibited for the 10-year life of the program, and secondarily where there is little or no history of domesticated bobwhite releases. Additionally, release of domesticated bobwhite should be prohibited in an adjacent 1-mile wide buffer. With the realization these restrictions may not be feasible, we also recommend developing a system for documenting the possible existence of domesticated bobwhites including what, when, where, how many, and fate. Documentation will include purpose of possession, location (geo-referenced and mailing address), dates and number present or released, and fate of released bobwhites (i.e., of number released how many were killed?). Documentation can be done by enforced regulations and record-keeping or annual questionnaires to landowners. In areas that wildlife agencies do not have direct control of the release of domesticated bobwhites we also recommend the following steps:• Outreach to inform landowners of the problems
associated with domesticated bobwhites, and that eliminating these birds as soon as possible after release is desirable;
• The release of domesticated bobwhites should be timed so as not to bias abundance monitoring in fall or breeding season (i.e., avoid 8-weeks prior to/during monitoring);
• Released birds should be inspected by a veterinarian for general health condition;
• Released birds should be banded with metal leg bands prior to release.
Data Management and AnalysisData management is essential to any research or monitoring project. It becomes more difficult as the number of partners and amount of data collected increases. A database management subcommittee has been formed to deal with this issue. It is expected that this subcommittee will find a near-term solution for entering

20
and storing focal area monitoring program data. A long-term solution will later be identified that allows all NBCI data to be stored and accessed. When the data storage solutions have been identified they will also provide recommendations on data analysis. Ideally, this would be part of the data storage system.
Program AssessmentThe NBCI Focal Tiers program is voluntary program for NBCI partners. However, the standards outlined in this document must be met to be considered as part of the program. Therefore, a committee composed of NBCI staff and NBTC state quail coordinators should be formed to evaluate the success of the program. This committee should review if proposed focal areas meet the criteria outlined in this document and can be an official NBCI Focal Area. They should also set criteria for maintaining the NBCI brand. Suggested criteria for maintaining the NBCI brand include collecting and submitting bird and habitat monitoring data and actively conducting habitat management that benefits bobwhite.
In addition, the committee should conduct a performance evaluation of each focal area in years 1, 5 and 10 after establishment. The purpose of this second review is to provide feedback on how the focal area is progressing towards its goal and provide suggestions on how to improve their program. The annual NBCI inventory will be used to facilitate data exchange, monitor progress, and ensure the project meets program standards. A grading system should be implemented to assess annual performance and create a sense of competition across the bobwhite range. Focal areas with the best reviews will be recognized at the annual NBTC Conference.
Monitoring NBCI Regions and Landscapes:Currently, monitoring is not required within NBCI Focal Regions and Landscapes. Existing statewide bobwhite surveys and other regional surveys such as the North American Breeding Bird Survey could be used to monitor these areas. Developing a survey specific to these areas in the future would be beneficial. It is recommended that if a new survey is developed it should be coordinated across state boundaries so data from multiple states can easily be combined. We also recommend following a similar approach for developing these surveys as was taken for the focal area monitoring protocols.
4. Process Used to Develop the NBCI Coordinated Implementation Program
The National Bobwhite Technical Committee Steering Committee believed that the viability of range-wide bobwhite conservation depended upon documenting the
validity of NBCI’s habitat-based strategy in the near-term (5-10 years). They asserted that the concentration of effort and resources by states and partners into well-designed focal areas optimizes the ability to produce and document improvement.
To address this need, the NBTC Research Subcommittee nominated John Morgan (KDFWR) to chair an ad hoc Monitoring Subcommittee that was fully formed at the 2011 NBTC Conference in Tallahassee, FL. Under Chairman Morgan, ad hoc Monitoring Subcommittee active members included Laurel Barnhill (United States Fish and Wildlife Service [USFWS]), Tom Dailey (NBCI), Steve DeMaso (Gulf Coast Joint Venture), Ken Duren (Ohio Division of Wildlife [ODW]), Kristine Evans (formerly Mississippi State University [MSU], now USFWS), Jay Howell (Virginia Department of Game and Inland Fisheries), James Martin (MSU), Nathan Stricker (ODW), and Theron Terhune (Tall Timbers Research Station).
A primary tenet of the committee’s charge was to be inclusive. The result was a committee with a diversity of perspectives that sought opportunities to gain information and opinions from state bobwhite coordinators first, and, subsequently, the broader conservation community. Tom Dailey, NBCI Science Coordinator, conducted an inventory of current bobwhite monitoring programs as a component of the annual State of the Bobwhite report (NBCI 2012). The survey collected opinions regarding monitoring at multiple spatial scales, standardized and coordinated monitoring, and leadership and field staff support for monitoring. The result was a strong desire for focal area monitoring, a willingness to conduct standardized or coordinated monitoring, and support of collaborating with the NBCI (Appendix C).
With this information, the ad hoc committee began preparation for a retreat aimed to draft an NBCI monitoring program at the focal area level. To further understand on-going focal area monitoring projects, Tom Dailey, Ken Duren, and Chair Morgan interviewed state quail coordinators leading focal area monitoring efforts and incorporated that information into the retreat discussions. Innumerable hours of planning via conference call were used to maximize efficiency during the retreat. Each talking point was outlined including facilitation approach and time investment.
The focal area monitoring retreat was May 14-16, 2012 at Shaker Village of Pleasant Hill in Kentucky. Chairman Morgan, Tom Dailey, Billy Dukes (South Carolina Department of Natural Resources), Ken Duren, Kristine Evans, Jim Giocomo (Oaks and Prairies Joint Venture), Jay

21
Howell, and Theron Terhune participated in the retreat, and then-NBCI Agriculture Policy Coordinator Bridget Collins served as facilitator. The following six steps were agreed upon by retreat participants to draft a monitoring plan:
1. Articulate the relationship between Focal Areas and range-wide bobwhite conservation.
2. Create a rough definition of a “Focal Area.”3. Draft a conceptual framework for standardization
and options for focal area evaluation4. Write two coordinated (spring and fall) monitoring
protocols.5. Develop the concept of a centralized data
management and decision support structure.6. Create a review process for the draft monitoring
program.
All six steps were completed during this retreat. However, participants also developed a list of other essential steps that were needed but could not be finished in during the meeting. This included:
1. Focal area design and implementation issues.2. Developing a standardized habitat survey.3. Measuring harvest.4. How to deal with domesticated bobwhite.
The first draft of the NBCI focal area monitoring was completed based on this meeting. This draft was reviewed by the full ad hoc Monitoring Subcommittee, the Research Subcommittee, and the NBTC steering committee prior to the 2012 NBTC meeting in Abilene, TX. The majority of 2012 NBTC Quail Coordinators Meeting was devoted to discussing the States’ ideas and recommendations on the focal area concept, design, implementation, and draft monitoring protocol. Brief opening remarks and presentations were followed by a much longer period during which state quail coordinators and other state biologists were able to discuss focal areas and monitoring in facilitated break-out groups (roughly 5 states/group) and report-back sessions. Each group appointed a representative for a conference committee. The appointees convened with 2 representatives from the research subcommittee to edit the monitoring draft. Changes made to the program through the conference committee process were reported at the business meeting.
The business meeting also served as the first introduction of the focal tiers concept. Reggie Thackston, Georgia Department of Natural Resources, presented the focal tiers paradigm created for Georgia’s bobwhite recovery plan. The conservation planning approach was openly discussed during the meeting and the steering committee requested it be considered as a component of the focal area program. A revised draft was completed with changes from the
conference committee representatives and was approved by the NBCI Management Board in September.
A second retreat was organized through extensive conference calls to work on unfinished tasks from the first retreat and to clarify unresolved issues after the review process in Abilene. The most daunting task for the second retreat was the development of a habitat monitoring protocol. New participants were appointed through their NBTC resource subcommittees (forestry, grasslands, and agricultural policy) to diversify expertise for the task. Care was taken so participants represented states from the north, south, east and western portions of bobwhite range
The second planning meeting for NBCI focal area monitoring was also held at Shaker Village of Pleasant Hill in Harrodsburg, KY from Nov. 13- 16, 2012. The meeting was a day longer than the first retreat given the longer task list, and feedback from the first retreat for exceptionally long working days. Chairman Morgan, Tom Dailey, Ken Duren, Jim Giocomo (Oaks and Prairies JV), Jay Howell, Bill White (MO), Bob Gates (OSU), Todd Boegenschutz (IA), Jena Donnell (OK), James Tomberlin (GA), Robert Glennon (NRCS), and Larry Heggemann (Central Hardwoods JV) participated in the retreat. Brittney Viers (KY) and Ben Robinson (KY) also helped with facilitation and note taking.
The main subjects covered during this meeting included:1. Redefining “useable space;”2. Providing clarification on how to deal with
domesticated bobwhites; 3. Clarifying attributes of the reference areas;4. Further outlining how focal area monitoring fits
within the strategic habitat conservation (SHC) model;
5. Providing guidance on developing and implementing the ideal focal area;
6. Providing recommendations for why and how to monitor habitat change;
7. Tracking conservation implementation;8. Monitoring weather;9. The importance of managing and monitoring
harvest;10. Review of the focal tiers concept as a component of
the focal area program.
During the second retreat, participants realized there was not enough representation for rangeland habitats. To offset this weakness, state quail coordinators from Nebraska, Kansas, Oklahoma, and Texas were the first group of people to review the report from the retreat. Their comments were used to modify the habitat classification system. The report was then sent to the NBTC Steering

22
Committee and to each NBTC subcommittee for review. The steering committee discussed and accepted the focal tiers concept with input from the monitoring committee in February.
Also during the meeting, participants realized the habitat monitoring protocol should be tested prior to the NBTC meeting in Roanoke, VA. Missouri, Iowa, Georgia, Virginia, and Kentucky agreed to test the protocol during the summer of 2013 (NBCI 2013, pgs. 22-23). Focal area and reference areas were selected and monitoring points were established. States piloted bird and habitat monitoring, and tabulated manpower and expertise required to implement the focal area program (Sidebar #14).
The state quail coordinators’ meeting was again used for review during the 2013 NBTC meeting in Roanoke, VA. The meeting followed the outline used in 2012. Presentations were given explaining the decisions made at the retreat. Pilot states also gave brief presentations on how the habitat monitoring worked for them. State coordinators had the opportunity to provide input through facilitated break out groups (approximately 5 states/group). A conference committee was reconvened where changes were vetted. The research subcommittee also played a significant role in editing the focal area program. Changes were presented during the NBTC business meeting and the steering committee accepted the focal tier program as a whole at the end of the Roanoke meeting.
5. Periodic Updates of this Coordinated Implementation Program
The Ad Hoc Monitoring Subcommittee, the NBTC Steering Committee and all involved in developing this program acknowledge that this NBCI Coordinated Implementation Program is a work in progress. Getting this first full draft completed and approved is a milestone in bobwhite conservation, but the NBTC recognizes that this plan will need to be re-assessed periodically in light of new information resulting from implementation experiences across numerous states.
6. Conclusion
The evolution of the NBCI is naturally moving towards collaborative plan implementation across the bobwhite range. The BRI and the State of the Bobwhite Report demonstrate the NBTC’s unity and strength. Without coordinated implementation and evaluation, stagnation
of the NBCI 2.0 could result in a loss of momentum and risk the range-wide bobwhite conservation movement as a whole. Coordinated monitoring across state lines has been one of the greatest challenges of bird conservation (with the exception of waterfowl). The bobwhite community has the infrastructure and has voiced their support for this next step. The time is now to set a new standard.
Focal tiers are the next major step towards implementing the SHC process by coordinating conservation delivery and monitoring among 25 state agencies and conservation partners. Across the 25 NBCI states there is tremendous variability in the biological capacity for bobwhite, the cultural interest in bobwhite, and the institutional capacity for habitat restoration. The only way we can find unity, initially, is in a narrowly focused approach. Regardless of focal area size, feedback from monitoring, and research in some cases, will improve the effectiveness of conservation delivery and outcome.
The key to success on all fronts is partner engagement. Establishing and implementing focal areas within focal tiers should be an open, inclusive process. This program is proof that facilitated forums can yield solutions for difficult and complex challenges. The years ahead will represent a radical shift in the NBTC culture, shifting from one that was focused more on planning and national policy to one that focuses on nationally coordinated, state-based plan implementation. It will also solidify the ideology of SHC within the constructs of bobwhite restoration.
Finally, this implementation and monitoring program is a beginning. The focal tiers concept identifies focal landscapes and regions. To achieve the full vision of the NBCI 2.0, the NBTC must continue to collaborate towards expanded habitat conservation at larger landscape contexts supported by coordinated monitoring. New leaders and engaged team members must build on this collaborative foundation. Together, the NBTC can set a new standard for 21st Century natural resource conservation across state lines.

23
Literature Cited
Brennan, L.A. 2011. A Biological Basis for the National Bobwhite Conservation Initiative: northern bobwhite habitat and population ecology. Pages 6-26 in Palmer, W.E., T.M. Terhune, and D.F. McKenzie, eds. The National Bobwhite Conservation Initiative: A range-wide plan for recovering bobwhites. National Bobwhite Technical Committee Technical Publication, ver. 2.0, Knoxville, TN.
Buckland, S.T., D.R. Anderson, K.P. Burnham, J.L. Laake, D.L. Borchers, and L.Thomas. 2001. Introduction to Distance Sampling. Oxford University Press, Oxford. 432 pp.
Dailey, T.V. 1997. Quail Population Ecology. Final Report W-13-R-51. Missouri Department of Conservation. Columbia, Missouri.
Dailey, T. V. 2009. Use of human dimensions information
as a tool for selecting large-scale quail restoration areas. Pages 185-192 in L. W. Burger, Jr., ed. Managing working lands for northern bobwhite quail: The USDA-NRCS Bobwhite Restoration Project. 209 pages.
Daley, S. S., D. T. Cobb, P. T. Bromley, and C. E. Sorenson. 2004. Landowner attitudes regarding wildlife management on private land in North Carolina. Wildlife Society Bulletin 32:209-219.
DeVos, T. and D. W. Speake. 1995. Effects of releasing pen raised northern bobwhites n survival rates of wild populations of northern bobwhites. Wildlife Society Bulletin 23:267--273.
Dimmick, R.W., M.J. Gudlin, and D.F. McKenzie. 2002. The northern bobwhite conservation initiative. Miscellaneous publication of the Southeastern Association of Fish and Wildlife Agencies, South Carolina. 96 pp.
Evans K.O., M.D. Smith, L.W. Burger, Jr., R. J. Chambers, A.E. Houston, and R. Carlisle. 2009. Release of

24
pen-reared bobwhites: potential consequences to the genetic integrity of resident wild populations. Pages 121--133 in S.B. Cederbaum, B.C. Faircloth, T.M. Terhune, J.J. Thompson, J.P. Carroll, eds. Gamebird 2006: Quail VI and Perdix XII. 31 May--4 June 2006. Warnell School of Forestry and Natural Resources, Athens, GA.
Evans, K.O., L.W. Burger, Jr., C.S. Oedekoven, M.D. Smith, S.K. Riffell, S.T. Buckland. 2013. Multi-region response to conservation buffers targeted for northern bobwhite. Journal of Wildlife Management 77:716-725.
Farnsworth, G. L., K. H. Pollock, J. D. Nichols, T. R. Simons, J. E. Hines, and J. R. Sauer. 2002. A removal model for estimating detection probabilities from point-count surveys. Auk 119:414-425.
Fies, M. L., J. E. Fischer, and D. E. Steffen. 2000. Survival of game farm, f1 wild progeny, and wild relocated northern bobwhites using two release methods. Proceedings of the Annual Conference of the Southeastern Association of Fish and Wildlife Agencies 54:350--364.
Gerhold, R. W., L. R. McDougald, and R. B. Beckstead. 2012. Construction of species-specific PCR primers for detection of coccidia parasites in captive-reared northern bobwhites. Proceedings of the National Quail Symposium 7:107.
Guthery, F.S. 2000. On bobwhites. Texas A&M University Press. College Station. 213 pp.
Guthery, F. S., M. J. Peterson, and R. R. George. 2000. Viability of northern bobwhite populations. Journal of Wildlife Management 64:646-662.
Hurst, G. A., W. R. Davidson, T. Devos, E. L. Kozicky, and A. D. Peoples. 1993. Strategic plan for quail management and research in the United States: Issues and strategies: Releases of pen-raised quail. Pages 178–179 in K. Church and T. Dailey, editors. Quail III: National Quail Symposium. Kansas Department of Wildlife and Parks, Pratt, KS.
Hutchins, A. R., and F. Hernandez. 2003. Effects of pen-raised northern bobwhite introductions on wild bobwhites in south Texas. Proceedings of the Annual Conference of the Southeastern Association of Fish and Wildlife Agencies 57:181–191.
Knutson, M.G., N.P. Danz, T.W. Sutherland, and B.R. Gray. 2008. Landbird monitoring protocol for the U.S. Fish and Wildlife Service, Midwest and Northeast Regions, Version 1. Biological Monitoring Team Technical Report BMT-2008-01. U.S. Fish and Wildlife Service, La Crosse, WI. 25 pages + 11 Standard Operating Procedures.
Morrison, M. L. 2012. The habitat sampling and analysis paradigm has limited value in animal conservation: A prequel. Journal of Wildlife Management 76:438-450.
National Bobwhite Conservation Initiative. 2011. T. V. Dailey, D. F. McKenzie, D. E. Figert and J. G. Doty. State of the Bobwhite 2011 Report: Grassland Conservation at a Crossroads. National Bobwhite Technical Committee Technical Publication, Knoxville, TN. 37 pages.
National Bobwhite Conservation Initiative. 2013. D.F. McKenzie, T.V. Dailey, K.M. Puckett, K.A. Brazil, M.W. Black, and J.G. Doty. NBCI’s Bobwhite Almanac, State of the Bobwhite 2013. National Bobwhite Technical Committee Technical Publication, Knoxville, TN. 46 pages.
National Bobwhite Conservation Initiative. 2012. D.F. McKenzie, T.V. Dailey, K.M. Puckett and J.G. Doty. NBCI’s Bobwhite Almanac, State of the Bobwhite 2012. National Bobwhite Technical Committee Technical Publication, Knoxville, TN. 48 pages.
National Bobwhite Technical Committee. 2012. W.E. Palmer, T.M. Terhune, T.V. Dailey, D.F. McKenzie, and J. Doty, eds. Executive Summary: National Bobwhite Conservation Initiative, NBCI 2.0…the unified strategy to restore wild quail. Proceedings of the National Quail Symposium 7:370-380.
Palmer, W. E., S. D. Wellendorf, L. A. Brennan, W. R. Davidson, and F. E. Kellogg. 2002. Hunting success and northern bobwhite density on Tall Timbers Research Station: 1970–2001. Proceedings of the National Quail Symposium 5:213–216.
Perez, R.M., D. E. Wilson, and K.D. Gruen. 2002. Survival and flight characteristics of captive-reared and wild northern bobwhite in South Texas. Pages 81-85 in S.J. DeMaso, W.P. Kuvlesky, Jr., F. Hernandez and M.E. Berger, eds. Quail V: Proceedings of the

25
Fifth National Quail Symposium. Texas Parks and Wildlife Department, Austin, TX.
Pollock, K.H., C.T. Moore, W.R. Davidson, F.E. Kellogg, and G.L. Doster. 1989. Survival rates of bobwhite quail based on band recovery analyses. Journal of Wildlife Management 53:1-6.
Rolland, V., J. A. Hostetler, T. C. Hines, H. F. Percival, and M. K. Oli. 2010. Impact of harvest on survival of a heavily hunted game bird population. Wildlife Research 37:392−400.
Roseberry, J. L., D. L. Ellsworth, and W. D. Klimstra. 1987. Comparative post release behavior and survival of wild, semi wild, and game farm bobwhites. Wildlife Society Bulletin 15:449 455.
Sands, J. P. 2010. Testing sustained-yield harvest theory to regulate northern bobwhite hunting. Dissertation. Texas A&M University-Kingsville, Kingsville, USA.
Seiler, T., R. D. Drobney, and T. V. Dailey. 2005. Observer group accuracy in plotting locations of northern bobwhites when using fall covey calls, in Everson, A. C., Wong, K. C., Miller, D. A., and Galvez, J. I., Proceedings of the Annual Conference of the Southeastern Association of Fish and Wildlife Agencies. 59:57-65.
S. J. Hannon. 2010 Critical thresholds associated with habitat loss: a review of the concepts, evidence, and applications. Biological Reviews 83:35-53.
Sisson, D. C., D. W. Speake, and H. L. Stribling. 2000. Survival of northern bobwhites on areas with and without liberated bobwhites. Pages 92– 94 in L. Brennan, W. Palmer, L. W. Burger, Jr., and T. Pruden, eds. Quail IV: Proceedings of the Fourth National Quail Symposium. Tall Timbers Research Station, Tallahassee, FL, USA.
Stoddard, H. L. 1931. The bobwhite quail: its habits, preservation and increase. Charles Scribner’s Sons, New York, NY. 559 pp.
Terhune, T. M., D. C. Sisson, W. E. Palmer, B. C. Faircloth, H. L. Stribling, and J. P. Carroll. 2010. Translocation to a fragmented landscape: survival, movement, and site fidelity of Northern Bobwhites. Ecological Applications 20: 1040-52.
Terhune, T. M., T. V. Dailey, D. M. McKenzie, and W. E. Palmer. 2012. A tool to bring back bobwhites:
Biologists create a conservation planning tool to rescue wild quail. The Wildlife Professional 6:64-66.
Thackston, R. E., D. C. Sisson, T. L. Crouch, D. L. Baxley, and B. A. Robinson. 2012. Hunter harvest of pen-reared northern bobwhites released from the Surrogator®. Proceedings of the National Quail Symposium 7:72-76.
The National Bobwhite Technical Committee. 2011. Palmer, W.E., T.M. Terhune, and D.F. McKenzie (eds). The National Bobwhite Conservation Initiative: A range-wide plan for re- covering bobwhites. National Bobwhite Technical Committee Technical Publication, ver. 2.0, Knoxville, TN.
USFWS. 2008. Strategic habitat conservation handbook: a guide to implementing the technical elements of strategic habitat conservation (Version 1.0). Report from the national technical assistance team. USFWS, Washington, D.C. 22pp.
Wellendorf, S. D., W. E. Palmer, and P. T. Bromley. 2004. Estimating calling rates of northern bobwhite coveys and measuring abundance. Journal of Wildlife Management 68:672-682.

26
Appendix A. NBCI Focal Area Habitat Classification System
1000. Crop
10000. Open 30000. Other
1000. Deciduous 2000. Coniferous 3000. Mix (at least 33% of each)2000. Herbaceous (<33% woody cover)
3000. Shrub/Woody Cover
(>33% woody cover, vegetation height <12 ft)
20000. Forest (>10% Canopy coverage
& vegetation height >12 ft tall)
See page A2See page A3
See page A5
See page A7 See page A11 See page A15
A1
Purpose, directions, and definitions for the Habitat Classification System1. The NBCI Focal Area Habitat Classification System is an attempt to standardize what constitutes bobwhite habitat across the range through the NBCI Focal
Area Program. The system focuses on vegetative structure from the perspective of the bobwhite. It characterizes vegetation in layers starting from the treetops and working down to the bare soil level. The classification system is aimed at a seasonal technician that is locally trained to conduct an in-field assessment.
2. Beginning at the top, add the value of each split to the value of the splits above it to get the unique ID number for each habitat type. For example a crop field within 164 ft. (50 m.) of other habitat would have the number 11100, while a crop field more than 164 ft. (50 m.) from other habitat would have the value 11200.
3. Quail habitat is marked with a check mark while habitat not considered planned quail habitat is marked with a null symbol.4. Protective cover is vegetation that provides year round overhead protection from predators and inclement weather.5. Bare ground is an estimate of exposed soil that may or may not be under vegetation (consider quail chick mobility).6. Appropriate access is less than 164 ft. (50 m.) from protective cover.
See page A2See page A3
See page A4
See page A5 See page A7 See page A9
Appendix A. NBCI Focal Area Habitat Classification System

27
100. Appropriate access1 to other bobwhite habitat2
200. With out appropriate access1 to other bobwhite habitat2
1000. Crop
10000. Open 30000. Other
1000. Deciduous 2000. Coniferous 3000. Mix (at least 33% of each)2000. Herbaceous (<33% woody cover)
3000. Shrub (>33% woody cover,
vegetation height <12 ft)
20000. Forest (>10% Canopy coverage
& vegetation height >12 ft tall)
1. See page A1 for definition of appropriate access 2. See page A1 for definition of protective cover.
A2
✓

28
100. Grass 200. Mix of at least 33% each of grass and forbs 300. Forbs
0.2. Not appropriate access1 to protective cover2
1. 0-25% bare ground 2. 25-75% bare ground 3. >75% bare ground
10. vegetation height maintained >8 in for >50% of the year
20. vegetation height maintained <8 in for >50% of the year
0.1. Appropriate access1 to protective cover2
1. See page A1 for definition of appropriate access2. See page A1 for definition of protective cover.
A3
✓
1000. Crop
10000. Open 30000. Other
1000. Deciduous 2000. Coniferous 3000. Mix (at least 33% of each)2000. Herbaceous
(<33% woody cover)3000. Shrub/Woody Cover (>33%
woody cover, vegetation height <12 ft)
20000. Forest (>10% Canopy coverage & vegetation height >12 ft tall)
10. At least 3 species of forbs present 20. <3 species of forbs present
2. <50 of forb cover acts as
protective cover
1. >50% of forb cover acts as
protective cover
0.02. Not appropriate access1 to protective cover2
0.1. 0-25% bare ground 0.2. 25-75% bare ground 0.3. >75% bare ground
1. vegetation height maintained >8 in for
>50% of the year
2. vegetation height maintained <8 in for
>50% of the year
0.01. Appropriate access1 to protective cover2
0.1. vegetation height maintained >8 in for
>50% of the year
0.2. vegetation height maintained <8 in for
>50% of the year
0.002. Not adjacent to other planned quail habitat that is not protective cover
0.01. 0-25% bare ground 0.02. 25-75% bare ground 0.03. >75% bare ground
0.001. Adjacent to other planned quail habitat that
is not protective cover✓
✓

29
200. >50% Shrub cover100. 33-50% Shrub cover
1. Adjacent to other planned quail habitat
2. Not adjacent to other planned quail habitat
A4
✓
10. Grass 20. Mix of at least 33% each of grass and forbs 30. Forbs
0.02. Not appropriate access1 to protective cover2
0.1. 0-25% bare ground 0.2. 25-75% bare ground 0.3. >75% bare ground
1. vegetation height maintained >8 in for >50% of the year
2. vegetation height maintained <8 in for >50% of the year
0.01. Appropriate access1 to protective cover2✓
1. At least 3 species of forbs present 2. <3 species of forbs present
0.2. <50 of forb cover acts as
protective cover
0.1. >50% of forb cover acts as
protective cover
0.002. Not appropriate access1 to protective cover2
0.01. 0-25% bare ground 0.02. 25-75% bare ground 0.03. >75% bare ground
0.1. vegetation height maintained >8 in for
>50% of the year
0.2. vegetation height maintained <8 in for
>50% of the year
0.001. Appropriate access1 to protective cover2
0.01. vegetation height maintained >8 in for
>50% of the year
0.02. vegetation height maintained <8 in for
>50% of the year
0.0002. Not adjacent to other planned quail habitat that is not protective cover
0.001. 0-25% bare ground 0.002. 25-75% bare ground 0.003. >75% bare ground
0.0001. Adjacent to other planned quail habitat that
is not protective cover✓
✓
1000. Crop
10000. Open 30000. Other
1000. Deciduous 2000. Coniferous 3000. Mix (at least 33% of each)2000. Herbaceous
(<33% woody cover)3000. Shrub/Woody Cover (>33%
woody cover, vegetation height <12 ft)
20000. Forest (>10% Canopy coverage & vegetation height >12 ft tall)
10. >50% of shrub cover with stem density concentrated
near the ground
10. <50% of shrub cover with stem density concentrated
near the ground
1. See page A1 for definition of appropriate access2. See page A1 for definition of protective cover.

30
100. >50% canopy cover 200. <50% canopy cover
10. Herbaceous Understroy(<33% woody cover)
20. Shrub/ Woody Understory (>33% woody cover, vegetation height <12 ft)
A5
1. See page A1 for definition of appropriate access2. See page A1 for definition of protective cover.
See page A6
1000. Crop
10000. Open 30000. Other
1000. Deciduous 2000. Coniferous 3000. Mix (at least 33% of each)2000. Herbaceous
(<33% woody cover)3000. Shrub/Woody Cover (>33%
woody cover, vegetation height <12 ft)
20000. Forest (>10% Canopy coverage & vegetation height >12 ft tall)
1. Grass 2. Mix of at least 33% each of grass and forbs 3. Forbs
0.002. Not appropriate access1 to protective cover2
0.01. 0-25% bare ground 0.02. 25-75% bare ground 0.03. >75% bare ground
0.1. vegetation height maintained >8 in for >50% of the year
0.2. vegetation height maintained <8 in for >50% of the year
0.001. Appropriate access1 to protective cover2✓
0.1. At least 3 species of forbs present 0.2. <3 species of forbs present
0.02. <50 of forb cover acts as
protective cover
0.01. >50% of forb cover acts as
protective cover
0.0002. Not appropriate access1 to protective cover2
0.001. 0-25% bare ground 0.002. 25-75% bare ground 0.003. >75% bare ground
0.01. vegetation height maintained >8
in for >50% of the year
0.02. vegetation height maintained <8 in for
>50% of the year
0.0001. Appropriate access1 to protective cover2
0.001. vegetation height maintained >8 in for
>50% of the year
0.002. vegetation height maintained <8 in for
>50% of the year
0.00002. Not adjacent to other planned quail habitat that is not protective cover
0.0001. 0-25% bare ground 0.0002. 25-75% bare ground 0.0003. >75% bare ground
0.00001. Adjacent to other planned quail habitat that
is not protective cover✓
✓
See page A6
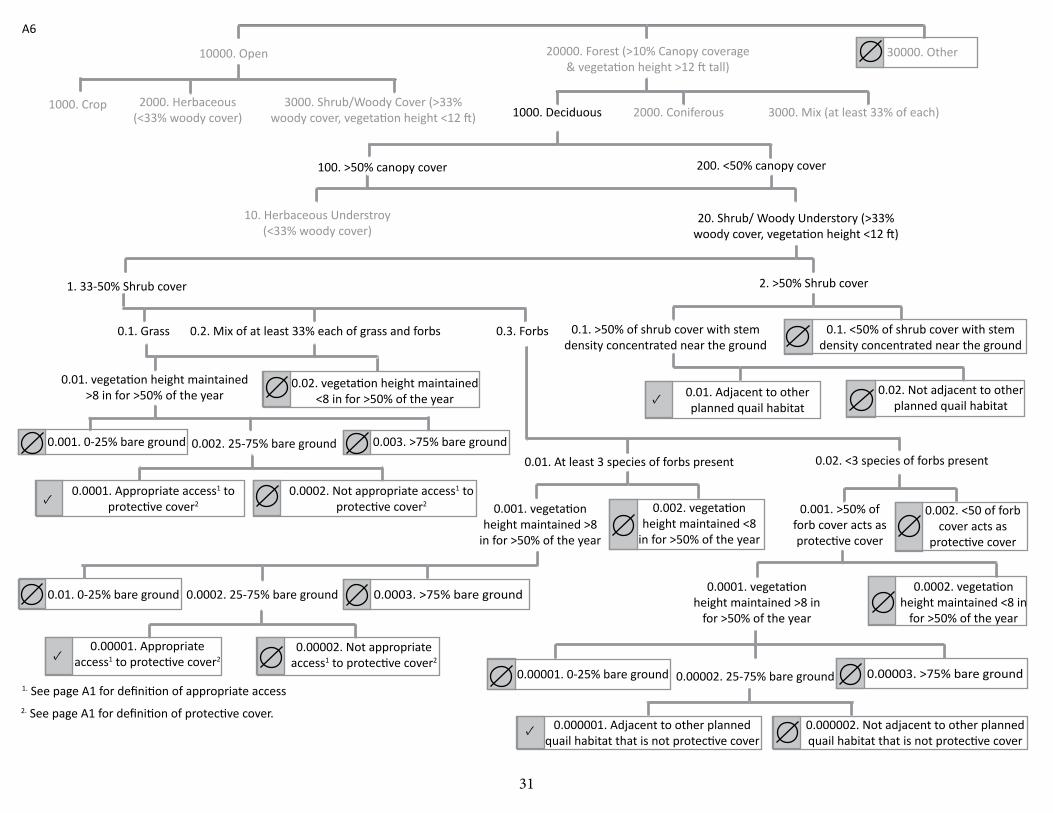
31
100. >50% canopy cover 200. <50% canopy cover
10. Herbaceous Understroy(<33% woody cover)
20. Shrub/ Woody Understory (>33% woody cover, vegetation height <12 ft)
A6
1000. Crop
10000. Open 30000. Other
1000. Deciduous 2000. Coniferous 3000. Mix (at least 33% of each)2000. Herbaceous
(<33% woody cover)3000. Shrub/Woody Cover (>33%
woody cover, vegetation height <12 ft)
20000. Forest (>10% Canopy coverage & vegetation height >12 ft tall)
2. >50% Shrub cover1. 33-50% Shrub cover
0.01. Adjacent to other planned quail habitat
0.02. Not adjacent to other planned quail habitat✓
0.1. Grass 0.2. Mix of at least 33% each of grass and forbs 0.3. Forbs
0.0002. Not appropriate access1 to protective cover2
0.001. 0-25% bare ground 0.002. 25-75% bare ground 0.003. >75% bare ground
0.01. vegetation height maintained >8 in for >50% of the year
0.02. vegetation height maintained <8 in for >50% of the year
0.0001. Appropriate access1 to protective cover2✓
0.01. At least 3 species of forbs present 0.02. <3 species of forbs present
0.002. <50 of forb cover acts as
protective cover
0.001. >50% of forb cover acts as protective cover
0.00002. Not appropriate access1 to protective cover2
0.01. 0-25% bare ground 0.0002. 25-75% bare ground 0.0003. >75% bare ground
0.001. vegetation height maintained >8
in for >50% of the year
0.002. vegetation height maintained <8
in for >50% of the year
0.00001. Appropriate access1 to protective cover2
0.0001. vegetation height maintained >8 in
for >50% of the year
0.0002. vegetation height maintained <8 in
for >50% of the year
0.000002. Not adjacent to other planned quail habitat that is not protective cover
0.00001. 0-25% bare ground 0.00002. 25-75% bare ground 0.00003. >75% bare ground
0.000001. Adjacent to other planned quail habitat that is not protective cover
✓
✓
0.1. >50% of shrub cover with stem density concentrated near the ground
0.1. <50% of shrub cover with stem density concentrated near the ground
1. See page A1 for definition of appropriate access2. See page A1 for definition of protective cover.

32
100. >50% canopy cover 200. <50% canopy cover
10. Herbaceous Understroy(<33% woody cover)
20. Shrub/ Woody Understory (>33% woody cover, vegetation height <12 ft)
A7
1. See page A1 for definition of appropriate access2. See page A1 for definition of protective cover.
See page A8
1000. Crop
10000. Open 30000. Other
1000. Deciduous 2000. Coniferous 3000. Mix (at least 33% of each)2000. Herbaceous
(<33% woody cover)3000. Shrub/Woody Cover (>33%
woody cover, vegetation height <12 ft)
20000. Forest (>10% Canopy coverage & vegetation height >12 ft tall)
1. Grass 2. Mix of at least 33% each of grass and forbs 3. Forbs
0.002. Not appropriate access1 to protective cover2
0.01. 0-25% bare ground 0.02. 25-75% bare ground 0.03. >75% bare ground
0.1. vegetation height maintained >8 in for >50% of the year
0.2. vegetation height maintained <8 in for >50% of the year
0.001. Appropriate access1 to protective cover2✓
0.1. At least 3 species of forbs present 0.2. <3 species of forbs present
0.02. <50 of forb cover acts as
protective cover
0.01. >50% of forb cover acts as
protective cover
0.0002. Not appropriate access1 to protective cover2
0.001. 0-25% bare ground 0.002. 25-75% bare ground 0.003. >75% bare ground
0.01. vegetation height maintained >8
in for >50% of the year
0.02. vegetation height maintained <8 in for
>50% of the year
0.0001. Appropriate access1 to protective cover2
0.001. vegetation height maintained >8 in for
>50% of the year
0.002. vegetation height maintained <8 in for
>50% of the year
0.00002. Not adjacent to other planned quail habitat that is not protective cover
0.0001. 0-25% bare ground 0.0002. 25-75% bare ground 0.0003. >75% bare ground
0.00001. Adjacent to other planned quail habitat that
is not protective cover✓
✓
See page A8

33
100. >50% canopy cover 200. <50% canopy cover
10. Herbaceous Understroy(<33% woody cover)
20. Shrub/ Woody Understory (>33% woody cover, vegetation height <12 ft)
A8
1000. Crop
10000. Open 30000. Other
1000. Deciduous 2000. Coniferous 3000. Mix (at least 33% of each)2000. Herbaceous
(<33% woody cover)3000. Shrub/Woody Cover (>33%
woody cover, vegetation height <12 ft)
20000. Forest (>10% Canopy coverage & vegetation height >12 ft tall)
2. >50% Shrub cover1. 33-50% Shrub cover
0.01. Adjacent to other planned quail habitat
0.02. Not adjacent to other planned quail habitat✓
0.1. Grass 0.2. Mix of at least 33% each of grass and forbs 0.3. Forbs
0.0002. Not appropriate access1 to protective cover2
0.001. 0-25% bare ground 0.002. 25-75% bare ground 0.003. >75% bare ground
0.01. vegetation height maintained >8 in for >50% of the year
0.02. vegetation height maintained <8 in for >50% of the year
0.0001. Appropriate access1 to protective cover2✓
0.01. At least 3 species of forbs present 0.02. <3 species of forbs present
0.002. <50 of forb cover acts as
protective cover
0.001. >50% of forb cover acts as protective cover
0.00002. Not appropriate access1 to protective cover2
0.01. 0-25% bare ground 0.0002. 25-75% bare ground 0.0003. >75% bare ground
0.001. vegetation height maintained >8
in for >50% of the year
0.002. vegetation height maintained <8
in for >50% of the year
0.00001. Appropriate access1 to protective cover2
0.0001. vegetation height maintained >8 in
for >50% of the year
0.0002. vegetation height maintained <8 in
for >50% of the year
0.000002. Not adjacent to other planned quail habitat that is not protective cover
0.00001. 0-25% bare ground 0.00002. 25-75% bare ground 0.00003. >75% bare ground
0.000001. Adjacent to other planned quail habitat that is not protective cover
✓
✓
0.1. >50% of shrub cover with stem density concentrated near the ground
0.1. <50% of shrub cover with stem density concentrated near the ground
1. See page A1 for definition of appropriate access2. See page A1 for definition of protective cover.

34
100. >50% canopy cover 200. <50% canopy cover
10. Herbaceous Understroy(<33% woody cover)
20. Shrub/ Woody Understory (>33% woody cover, vegetation height <12 ft)
A9
1. See page A1 for definition of appropriate access2. See page A1 for definition of protective cover.
See page A10
1000. Crop
10000. Open 30000. Other
1000. Deciduous 2000. Coniferous 3000. Mix (at least 33% of each)2000. Herbaceous
(<33% woody cover)3000. Shrub/Woody Cover (>33%
woody cover, vegetation height <12 ft)
20000. Forest (>10% Canopy coverage & vegetation height >12 ft tall)
1. Grass 2. Mix of at least 33% each of grass and forbs 3. Forbs
0.002. Not appropriate access1 to protective cover2
0.01. 0-25% bare ground 0.02. 25-75% bare ground 0.03. >75% bare ground
0.1. vegetation height maintained >8 in for >50% of the year
0.2. vegetation height maintained <8 in for >50% of the year
0.001. Appropriate access1 to protective cover2✓
0.1. At least 3 species of forbs present 0.2. <3 species of forbs present
0.02. <50 of forb cover acts as
protective cover
0.01. >50% of forb cover acts as
protective cover
0.0002. Not appropriate access1 to protective cover2
0.001. 0-25% bare ground 0.002. 25-75% bare ground 0.003. >75% bare ground
0.01. vegetation height maintained >8
in for >50% of the year
0.02. vegetation height maintained <8 in for
>50% of the year
0.0001. Appropriate access1 to protective cover2
0.001. vegetation height maintained >8 in for
>50% of the year
0.002. vegetation height maintained <8 in for
>50% of the year
0.00002. Not adjacent to other planned quail habitat that is not protective cover
0.0001. 0-25% bare ground 0.0002. 25-75% bare ground 0.0003. >75% bare ground
0.00001. Adjacent to other planned quail habitat that
is not protective cover✓
✓
See page A10

35
100. >50% canopy cover 200. <50% canopy cover
10. Herbaceous Understroy(<33% woody cover)
20. Shrub/ Woody Understory (>33% woody cover, vegetation height <12 ft)
A10
1000. Crop
10000. Open 30000. Other
1000. Deciduous 2000. Coniferous 3000. Mix (at least 33% of each)2000. Herbaceous
(<33% woody cover)3000. Shrub/Woody Cover (>33%
woody cover, vegetation height <12 ft)
20000. Forest (>10% Canopy coverage & vegetation height >12 ft tall)
2. >50% Shrub cover1. 33-50% Shrub cover
0.01. Adjacent to other planned quail habitat
0.02. Not adjacent to other planned quail habitat✓
0.1. Grass 0.2. Mix of at least 33% each of grass and forbs 0.3. Forbs
0.0002. Not appropriate access1 to protective cover2
0.001. 0-25% bare ground 0.002. 25-75% bare ground 0.003. >75% bare ground
0.01. vegetation height maintained >8 in for >50% of the year
0.02. vegetation height maintained <8 in for >50% of the year
0.0001. Appropriate access1 to protective cover2✓
0.01. At least 3 species of forbs present 0.02. <3 species of forbs present
0.002. <50 of forb cover acts as
protective cover
0.001. >50% of forb cover acts as protective cover
0.00002. Not appropriate access1 to protective cover2
0.01. 0-25% bare ground 0.0002. 25-75% bare ground 0.0003. >75% bare ground
0.001. vegetation height maintained >8
in for >50% of the year
0.002. vegetation height maintained <8
in for >50% of the year
0.00001. Appropriate access1 to protective cover2
0.0001. vegetation height maintained >8 in
for >50% of the year
0.0002. vegetation height maintained <8 in
for >50% of the year
0.000002. Not adjacent to other planned quail habitat that is not protective cover
0.00001. 0-25% bare ground 0.00002. 25-75% bare ground 0.00003. >75% bare ground
0.000001. Adjacent to other planned quail habitat that is not protective cover
✓
✓
0.1. >50% of shrub cover with stem density concentrated near the ground
0.1. <50% of shrub cover with stem density concentrated near the ground
1. See page A1 for definition of appropriate access2. See page A1 for definition of protective cover.

36
Appendix B. Example datasheets for bird and habitat monitoringBird datasheet example 1

37
Bird datasheet example 2

38
Point ID: Date: Observer:NBCI CIP Habitat Monitoring Datasheet
Patch Number:
Is this developed land or non-habitat?
Crop fi elds
Crop Type
What % of fi eld has standing crop residue in spring?
Perrenial Cover
What is the % canopy of vegetati on > 12ft . tall?
Sum = 100% of canopy
What % of the canopy are deciduous trees?
What % of the canopy are coniferous trees?
What is the % of shrub cover in the understory?
What % of the shrub cover has high stems densiti es near the ground?
What is the % grass cover in the understory?
What is the % forb cover in the understory?
What is the % forb cover can act as protecti ve cover?
How many forb species were counted?
What is the % of bareground including underneath vegetati on?
Is the herbaceous vegetati on height > 8 in for ≥ 50% of the year?
Do you think this patch is quail habitat?
NOTES:
Habitat Monitoring Datasheet Example
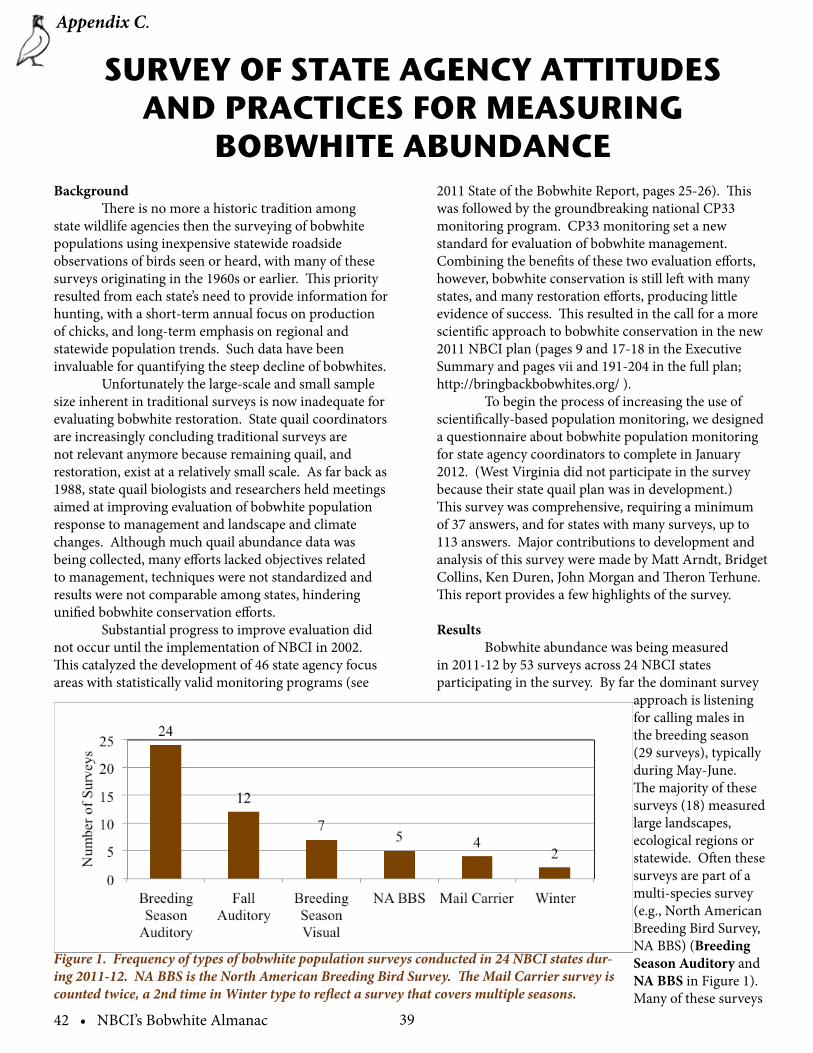
3942 • NBCI’s Bobwhite Almanac
Background There is no more a historic tradition among state wildlife agencies then the surveying of bobwhite populations using inexpensive statewide roadside observations of birds seen or heard, with many of these surveys originating in the 1960s or earlier. This priority resulted from each state’s need to provide information for hunting, with a short-term annual focus on production of chicks, and long-term emphasis on regional and statewide population trends. Such data have been invaluable for quantifying the steep decline of bobwhites. Unfortunately the large-scale and small sample size inherent in traditional surveys is now inadequate for evaluating bobwhite restoration. State quail coordinators are increasingly concluding traditional surveys are not relevant anymore because remaining quail, and restoration, exist at a relatively small scale. As far back as 1988, state quail biologists and researchers held meetings aimed at improving evaluation of bobwhite population response to management and landscape and climate changes. Although much quail abundance data was being collected, many efforts lacked objectives related to management, techniques were not standardized and results were not comparable among states, hindering unified bobwhite conservation efforts. Substantial progress to improve evaluation did not occur until the implementation of NBCI in 2002. This catalyzed the development of 46 state agency focus areas with statistically valid monitoring programs (see
2011 State of the Bobwhite Report, pages 25-26). This was followed by the groundbreaking national CP33 monitoring program. CP33 monitoring set a new standard for evaluation of bobwhite management. Combining the benefits of these two evaluation efforts, however, bobwhite conservation is still left with many states, and many restoration efforts, producing little evidence of success. This resulted in the call for a more scientific approach to bobwhite conservation in the new 2011 NBCI plan (pages 9 and 17-18 in the Executive Summary and pages vii and 191-204 in the full plan; http://bringbackbobwhites.org/ ). To begin the process of increasing the use of scientifically-based population monitoring, we designed a questionnaire about bobwhite population monitoring for state agency coordinators to complete in January 2012. (West Virginia did not participate in the survey because their state quail plan was in development.) This survey was comprehensive, requiring a minimum of 37 answers, and for states with many surveys, up to 113 answers. Major contributions to development and analysis of this survey were made by Matt Arndt, Bridget Collins, Ken Duren, John Morgan and Theron Terhune. This report provides a few highlights of the survey.
Results Bobwhite abundance was being measured in 2011-12 by 53 surveys across 24 NBCI states participating in the survey. By far the dominant survey
approach is listening for calling males in the breeding season (29 surveys), typically during May-June. The majority of these surveys (18) measured large landscapes, ecological regions or statewide. Often these surveys are part of a multi-species survey (e.g., North American Breeding Bird Survey, NA BBS) (Breeding Season Auditory and NA BBS in Figure 1). Many of these surveys
SURVEY OF STATE AGENCY ATTITUDESAND PRACTICES FOR MEASURING
BOBWHITE ABUNDANCE
Figure 1. Frequency of types of bobwhite population surveys conducted in 24 NBCI states dur-ing 2011-12. NA BBS is the North American Breeding Bird Survey. The Mail Carrier survey is counted twice, a 2nd time in Winter type to reflect a survey that covers multiple seasons.
Appendix C.

40 State of the Bobwhite 2012 • 43
provide a long-term index of abundance, with the BBS beginning in 1966. Across the survey states, when asked if NA BBS bobwhite data are used for management purposes, answers were 21% yes, 33% somewhat and 46% no. We used the BBS for the 2011 State of the Bobwhite Report (pgs. 1-2), showing a steep, long-term decline for bobwhites, 3.75% per year since 1966. Eleven surveys involve observations of adults and/or chicks seen, with 4 of these being conducted very inexpensively by rural mail carriers and 7 categorized as Breeding Season Visual with more detailed protocol (Figure 1). One state reported using the annual Christmas Bird Count, a winter index of bobwhite abundance, for tracking bobwhite population trends, and one state’s mail carrier survey includes observations in October and January. Because of the large-scale nature of the above approaches, observations are typically made along roadsides, and the observations are often not adjusted for factors that affect whether or not a nearby bird was actually seen or heard, such as height of vegetation, topography and observer ability. The inference, or true meaning, of these surveys is carefully worded, e.g., “this is an index of male quail heard along roadsides during June and does not necessarily reflect the abundance of quail, nor the abundance of male bobwhites across the landscape”. Further, these estimates typically lack a measure of precision, making any comparison across time and space difficult at best. In a recent example of the weakness of these large-scale surveys, Texas Parks and Wildlife Commission decided against using such data for making decisions about hunting regulations. Despite these shortcomings, indices have done a good job of identifying major changes in abundance, and because of their long-term nature (the majority of these surveys are >40 years old) biologists are able to better understand effects of long-term climate and landscape change on bobwhites. However, the monitoring survey and state reports revealed that some states are now questioning some of these values,
partly because quail abundance is so low that the index approaches are not detecting the positive changes that do occur. Unfortunately, this is because positive habitat change has occurred at a relatively small scale, hundreds or thousands of acres: “we no longer have a statewide population” (Missouri, North Carolina). As an alternative to large-scale approaches, many states have turned to measurement of coveys calling in the fall, classified as Fall Auditory (12 surveys, Figure 1). In most cases, this is providing population density, estimated as coveys per acre, typically on restoration focal areas where quail are a management priority. Much research has focused on behavior of calling fall coveys during the past decade (Tall Timbers) and it has become a popular approach for measuring bobwhite response to management on smaller (<5,000 acres) landscapes, while simultaneously providing information most pertinent to quail hunting. Because researchers have documented average calling rates in some parts of the country, biologists in these regions are able to estimate abundance of quail, versus other techniques that are limited to abundance of calling quail, e.g., Breeding Season Auditory. The weakness of the Fall Auditory approach is that each observer can only measure one location per day, whereas during spring each observer can measure 10 or more locations per day. Thus, preference for the Breeding Season Auditory approach increases as the size of the monitoring area increases. Unfortunately for hunters, there is not a common range-wide technique for predicting fall hunting prospects based on abundance of males during the breeding season.
Figure 2. State coordinators’ indication of potential major changes in surveys based on geographic scale.

4144 • NBCI’s Bobwhite Almanac
Many of the Spring and Fall Auditory surveys reported by states provide higher quality measurements of quail abundance by following scientific design principles (e.g., randomly selected listening stations), and a more meaningful population measure is estimated, quail per acre. Quail-per-acre estimates typically can be compared from year-to-year and from place-to-place across the bobwhite range, whereas population indices are much less comparable. Combining the different values of long-term, large-scale surveys, and recent focused surveys, coordinators indicated in the survey that both ends of the spectrum are important (Figure 2). Coordinators believe the majority of their statewide surveys (17) will not change, but that change is likely for focus area surveys, e.g., they are willing to invest more at this scale. As indicated earlier, both the 2002 and 2011 versions of NBCI called for a more scientific approach to bobwhite conservation. According to the monitoring survey, coordinators are supportive of monitoring efforts: of 24 coordinator responses to a question about the priority of monitoring quail abundance, 17 indicated it was very important, 6 chose somewhat important and one coordinator was neutral. Also, recent history shows that monitoring on smaller areas, focus areas, is more scientifically based. In this regard, coordinators indicated they are much more willing to lead high quality monitoring (density) programs as the size of the
monitoring area decreases, with a strong preference for focus areas (Figure 3).
Conclusion This survey is just one part of a concerted effort to improve the effectiveness of bobwhite conservation. Although state coordinators’ responses were generally supportive of the concepts of science-based evaluation, they also indicated a dire need for more resources (funding, labor, technical assistance, etc.) to get the job done. As illustrated in the 2011 State of the Bobwhite Report, previous and current focused monitoring efforts ranged from excellent to non-existent. A tenet of attitude surveys is that responses are hypothetical, and not necessarily a good predictor of future behavior. In order for the good intentions expressed in this survey to become reality, bobwhite enthusiasts—agency administrators, non-government organizations, field biologists, coordinators, hunters and landowners—have to make evaluation a high priority.
Figure 3. State coordinators’ willingness to lead bobwhite density monitoring during fall and breeding season at the geographic scales of focus area, sub-state (e.g., ecological region), county and statewide.