landfill site suitability analysis for non-toxic solid...
TRANSCRIPT

Agustin B. Graterole Page 1 8/19/2008
The University of Akron Department of Geography and Planning
Landfill Site Suitability Analysis for Non-toxic Solid Waste in Puerto Rico
- A GIS Approach-
Agustín B. Graterole Applications in GIS and Cartography

Agustin B. Graterole Page 2 8/19/2008
INDEX
1. Introduction 3
2. Objective 4
3. Study Area 5
4. Methods and Analysis 7
a) Exclusion Areas Map 7
b) Site Suitability Model 10
i. Surface to Ground Water, Rivers and Streams, and Lakes 11
ii. Lineament Zones 16
iii. Land Use/Cover 17
iv. Slope 18
v. Urban Areas 19
5. Results/Conclusion 21
6. References 25
Agustin B. Graterole Page 3 8/19/2008
Introduction
One of the most challenging environmental issues for the island of Puerto Rico is the
management of non-toxic solid waste. With an increasingly dense population and a current shortage
of places to dispose non-toxic solid waste properly, the island faces a huge environmental problem.
During the early industrial development of Puerto Rico (1950’s), sub-standard and clandestine
landfills were created. These landfills failed to meet the Environmental Protection Agency’s (EPA)
standards in terms of structural quality and appropriate location. One negative effect was the
pollution of superficial and ground water resources on surrounding areas. Since 1994, the EPA
ordered the closure of 34 out of the 62 landfills that were in operation. Most of the 28 landfills that
were left are expected to close by 2018 and it is estimated that the disposal capacity of current
landfills will be less than the amount of waste that will be generated (Vicenty 2004). Although
policies such as recycling, reduction and reusing are expected to be implemented at a larger scale,
disposal of the remaining non-toxic solid waste in landfills is still going to be necessary to meet future
demands.
Agustin B. Graterole Page 4 8/19/2008
Objective
The objective of this research is to determine and analyze suitable areas for the location of landfills in
Puerto Rico with the use of Geographic Information Systems software. Criteria for their localization
will be:
Low environmental impact.
Low human health impact.
The final objective is to identify areas large enough for disposing the quantity of non-toxic solid waste
that will be generated in the future.

Agustin B. Graterole Page 5 8/19/2008
Study Area
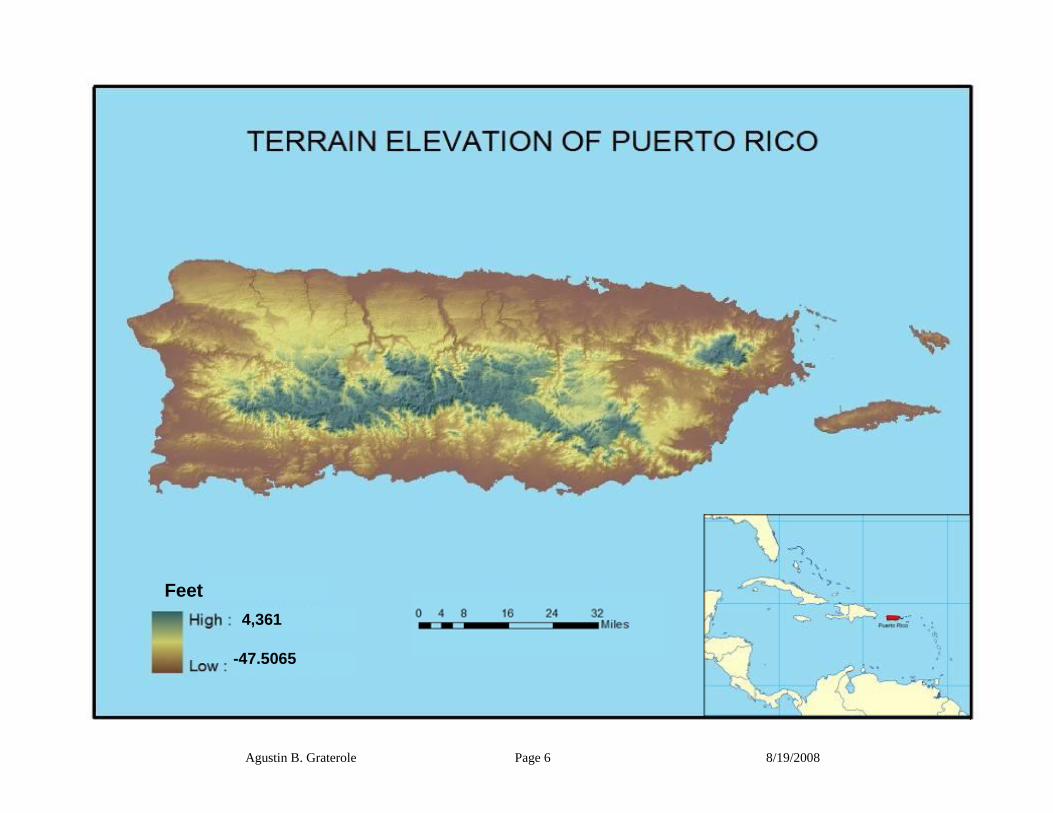
The study area for this research is the island of Puerto Rico. Puerto Rico is located in the
Caribbean at 18 15 N and 66 30 W. It is composed of the main island and other smaller islands, some
of them are part of the 78 municipios like Vieques and Culebra. However, for the nature of this
research, the study area will be the main island which is composed by 76 municipios. Puerto Rico as a
whole has a total area of 3,515 square miles (9,104 sq/km). The maximum length from east to west is
111 miles (178 km) and the maximum width from north to south is 40 miles (64 km). The main island
is mostly mountainous with large coastal areas on the north and south. It has an extensive inner
mountain range called "La Cordillera Central" (The Central Range). Up to 75% of the mainland is
mountainous with it highest peak reaching 4, 390 feet (1,338 m), called Cerro de Punta. Steep slopes
and streams dominate large amounts of the mainland territory which causes difficulty for the
appropriate location of non-toxic solid waste landfills. The large valley type coastal areas to the north
and south of the island make up only 25% of the mainland. A significantly large portion of this area
on the north is made of karsts limestone rocks which are permeable to water and pollutants. The
karstic region of Puerto Rico which is one of the biggest in the earth is on top of numerous aquifers
used by the population to extract water.
Agustin B. Graterole Page 6 8/19/2008
Feet
-47.5065
4,361
Agustin B. Graterole Page 7 8/19/2008
Methods and Analysis
This research is divided into two sections:
I. Development of Exclusion Areas map
II. Creation of a Site Suitability Model based map
Exclusion Areas
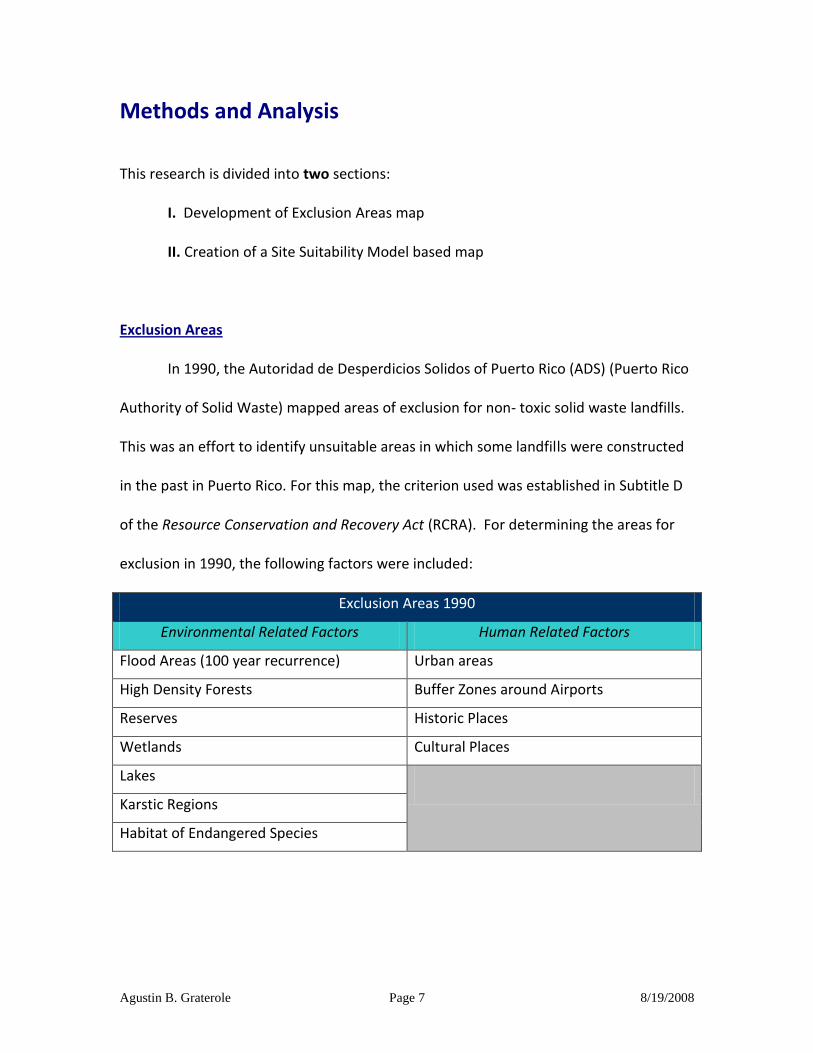
In 1990, the Autoridad de Desperdicios Solidos of Puerto Rico (ADS) (Puerto Rico
Authority of Solid Waste) mapped areas of exclusion for non- toxic solid waste landfills.
This was an effort to identify unsuitable areas in which some landfills were constructed
in the past in Puerto Rico. For this map, the criterion used was established in Subtitle D
of the Resource Conservation and Recovery Act (RCRA). For determining the areas for
exclusion in 1990, the following factors were included:
Exclusion Areas 1990
Environmental Related Factors Human Related Factors
Flood Areas (100 year recurrence) Urban areas
High Density Forests Buffer Zones around Airports
Reserves Historic Places
Wetlands Cultural Places
Lakes
Karstic Regions
Habitat of Endangered Species

Agustin B. Graterole Page 8 8/19/2008
A map which would determine unsuitable places for the location of non-toxic
solid waste landfills in Puerto Rico was reconstructed for the purpose of this research.
This map is named Exclusion Areas 2008. It was developed using a wide range of data
sets and previously used criteria from the RCRA. However, other new and updated
criteria were added, making it more comprehensive and updated than the 1990 version.
This new maps development was facilitated by using Geographic Information Systems
(GIS) procedures such as digitizing, uniting layers, creation of new feature data layers,
geo-processing techniques such as buffers and overlay, and Spatial Analyst tools like
Slope. Both raster and vector data layer formats were utilized.
The following factors were added to the Exclusion Areas map:
Exclusion Areas 2008 (Current Research)
Environmental Related Factors Human Related Factors
Steep slopes ( >20 degrees) Urban Areas (2000)
Mineral Formation Areas Public Areas
Lineament zones Leisure/Recreational Areas
Main Aquifers Cultivated Agricultural Land
Rivers and Streams Mining Areas
Medium Density Forests Principal Roads

Agustin B. Graterole Page 9 8/19/2008
Map: 2008 Exclusion Areas Map

Agustin B. Graterole Page 10 8/19/2008
Site Suitability Model
Places that are outside the Exclusions Areas map will be considered for identifying suitable
locations for non-toxic solid waste landfills. Since these residual areas vary in degree of suitability for
locating landfills, a Site Suitability Model was created to identify the most ideal places. An example of
degree of suitability is proximity to water resources and/or type of land cover in different areas. The
following six factors and their criteria were applied for the model:
Site Suitability Model
Factor Criteria
1. Surface to Ground Water Depth from Surface and Ground Water
2. Rivers and Streams Proximity to Rivers and Streams
3. Lakes Proximity to Lakes
4. Lineament Zones Proximity to Lineament Zones
5. Slope Steepness of Slope
6. Land Use/Cover Type of Land Use and Land Cover
7. Urban Areas Proximity to Urban Areas of 2000
Agustin B. Graterole Page 11 8/19/2008
Surface to Ground Water, Rivers and Streams, and Lakes
A negative impact that non-toxic solid waste landfills pose to the environment is the
contamination of surrounding water resources. A leachate is a liquid that drains or 'leaches' from a
landfill. Leachates vary widely in composition regarding the age of the landfill and the type of waste
that it contains. It can usually contain both dissolved and suspended material. This pollutant can travel
downward through the ground toward aquifers and/or to bodies of water like lakes and rivers. Past
landfills that were constructed in Puerto Rico caused this significant environmental impact on the
island’s water resources.
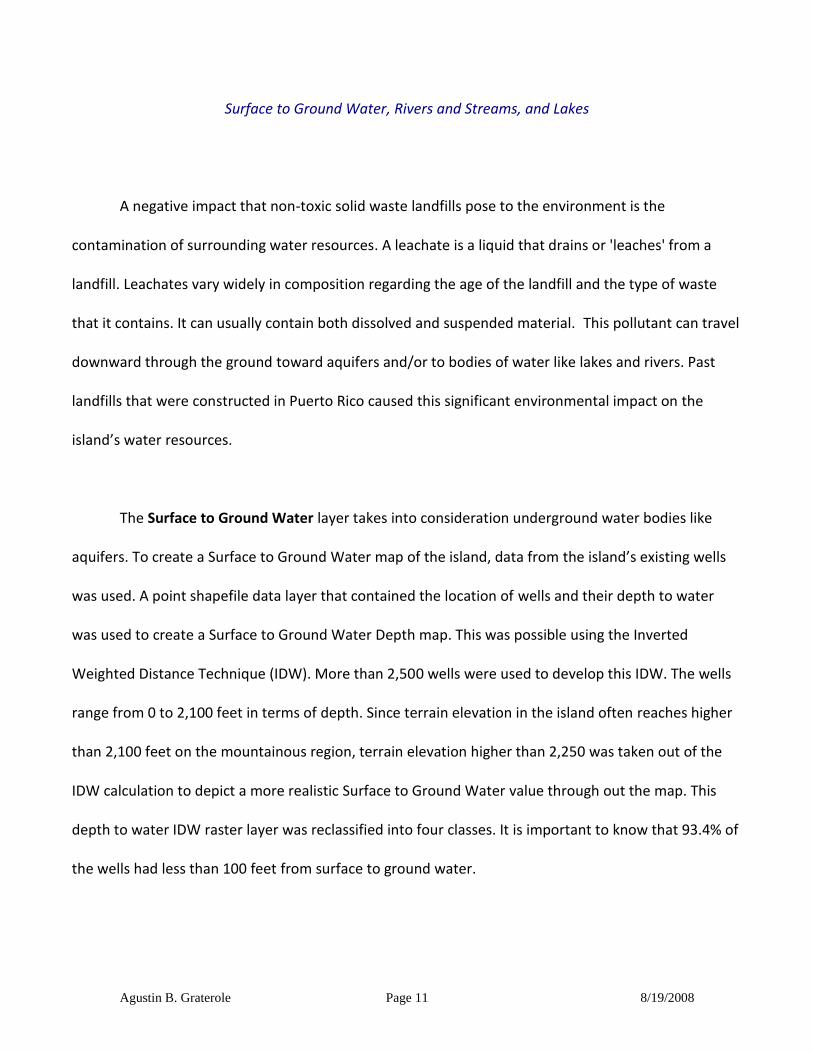
The Surface to Ground Water layer takes into consideration underground water bodies like
aquifers. To create a Surface to Ground Water map of the island, data from the island’s existing wells
was used. A point shapefile data layer that contained the location of wells and their depth to water
was used to create a Surface to Ground Water Depth map. This was possible using the Inverted
Weighted Distance Technique (IDW). More than 2,500 wells were used to develop this IDW. The wells
range from 0 to 2,100 feet in terms of depth. Since terrain elevation in the island often reaches higher
than 2,100 feet on the mountainous region, terrain elevation higher than 2,250 was taken out of the
IDW calculation to depict a more realistic Surface to Ground Water value through out the map. This
depth to water IDW raster layer was reclassified into four classes. It is important to know that 93.4% of
the wells had less than 100 feet from surface to ground water.
Agustin B. Graterole Page 12 8/19/2008
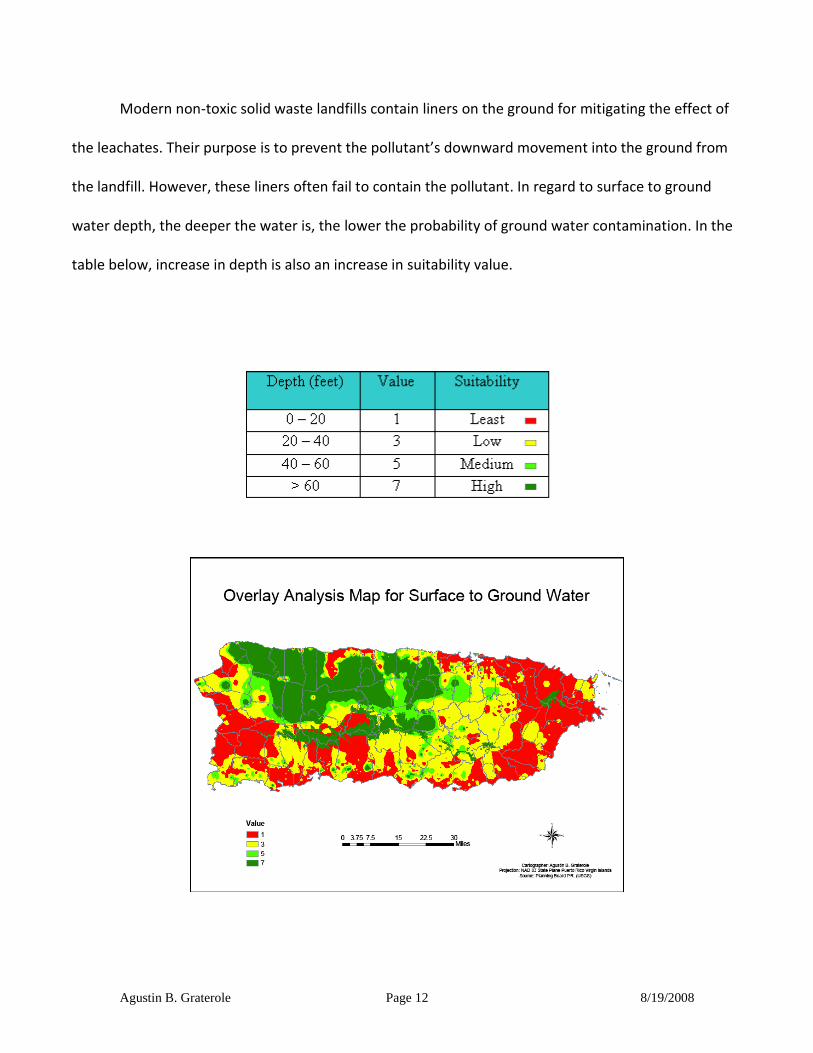
Modern non-toxic solid waste landfills contain liners on the ground for mitigating the effect of
the leachates. Their purpose is to prevent the pollutant’s downward movement into the ground from
the landfill. However, these liners often fail to contain the pollutant. In regard to surface to ground
water depth, the deeper the water is, the lower the probability of ground water contamination. In the
table below, increase in depth is also an increase in suitability value.
Agustin B. Graterole Page 13 8/19/2008
Puerto Rico is covered with vast amounts of rivers and streams. These originate on the center
of the island because of the topography on the Central Range region. The quantity and complexity of
elevated areas plus the considerable amount of rainfall in the Central Range region, produces a great
variety of streams that are evenly spread around the island’s territory. This topography also permitted
the creation of artificial lakes. Suitable locations for landfills are scarce because of these vast amounts
of water bodies, especially rivers and streams.
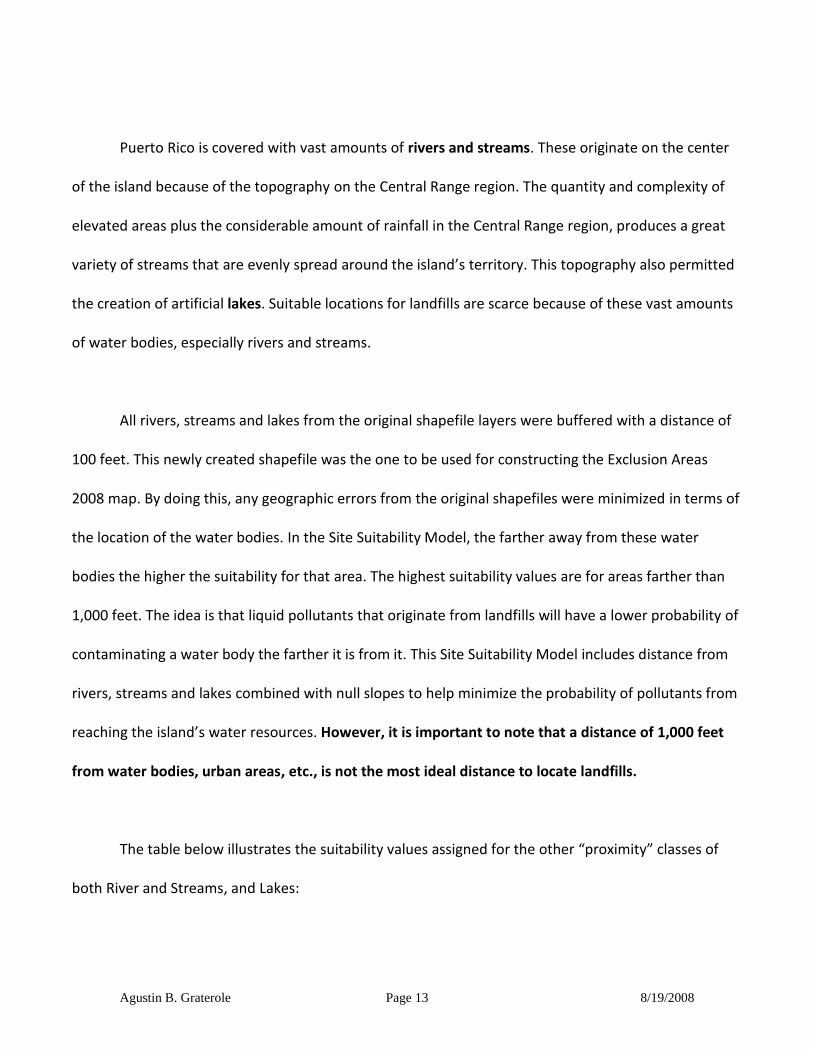
All rivers, streams and lakes from the original shapefile layers were buffered with a distance of
100 feet. This newly created shapefile was the one to be used for constructing the Exclusion Areas
2008 map. By doing this, any geographic errors from the original shapefiles were minimized in terms of
the location of the water bodies. In the Site Suitability Model, the farther away from these water
bodies the higher the suitability for that area. The highest suitability values are for areas farther than
1,000 feet. The idea is that liquid pollutants that originate from landfills will have a lower probability of
contaminating a water body the farther it is from it. This Site Suitability Model includes distance from
rivers, streams and lakes combined with null slopes to help minimize the probability of pollutants from
reaching the island’s water resources. However, it is important to note that a distance of 1,000 feet
from water bodies, urban areas, etc., is not the most ideal distance to locate landfills.
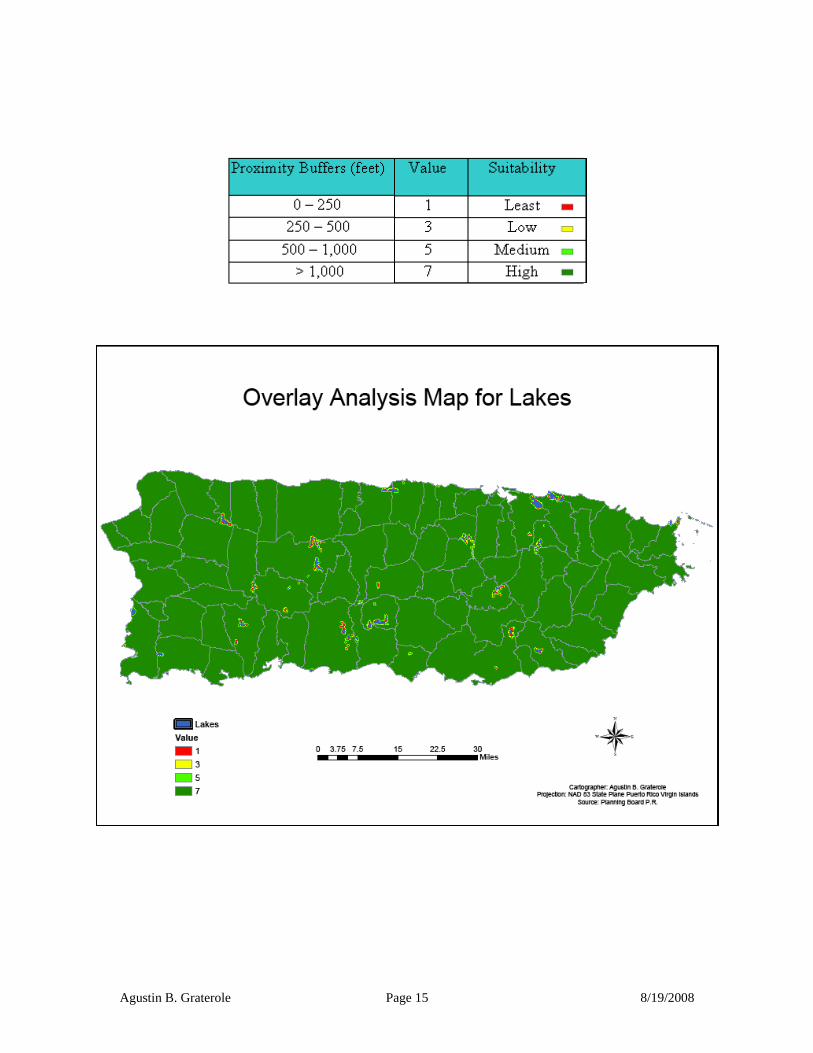
The table below illustrates the suitability values assigned for the other “proximity” classes of
both River and Streams, and Lakes:

Agustin B. Graterole Page 14 8/19/2008
Agustin B. Graterole Page 15 8/19/2008
Agustin B. Graterole Page 16 8/19/2008
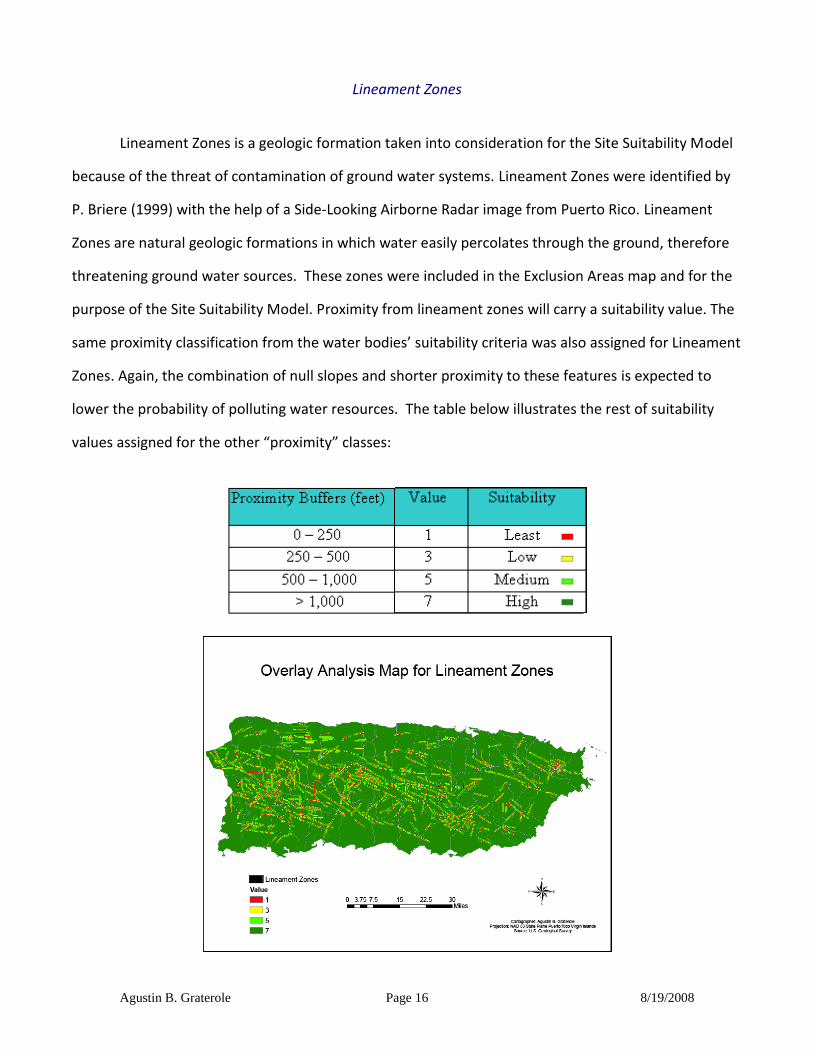
Lineament Zones
Lineament Zones is a geologic formation taken into consideration for the Site Suitability Model
because of the threat of contamination of ground water systems. Lineament Zones were identified by
P. Briere (1999) with the help of a Side-Looking Airborne Radar image from Puerto Rico. Lineament
Zones are natural geologic formations in which water easily percolates through the ground, therefore
threatening ground water sources. These zones were included in the Exclusion Areas map and for the
purpose of the Site Suitability Model. Proximity from lineament zones will carry a suitability value. The
same proximity classification from the water bodies’ suitability criteria was also assigned for Lineament
Zones. Again, the combination of null slopes and shorter proximity to these features is expected to
lower the probability of polluting water resources. The table below illustrates the rest of suitability
values assigned for the other “proximity” classes:
Agustin B. Graterole Page 17 8/19/2008
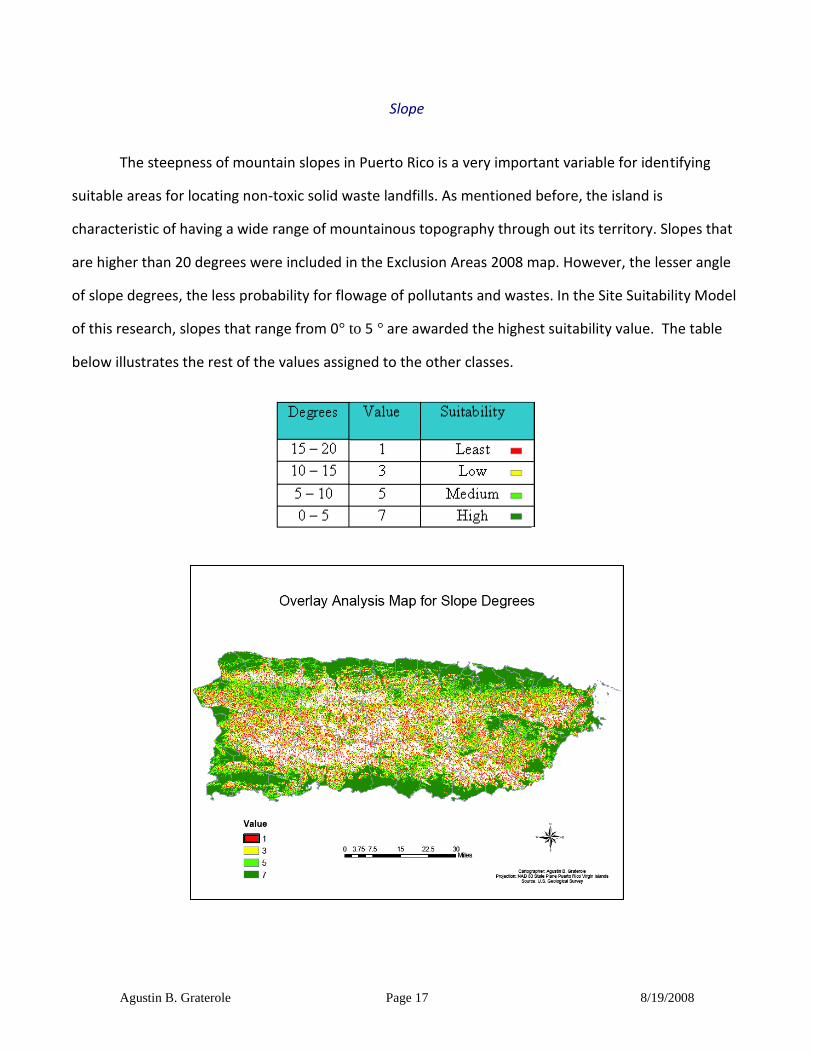
Slope
The steepness of mountain slopes in Puerto Rico is a very important variable for identifying
suitable areas for locating non-toxic solid waste landfills. As mentioned before, the island is
characteristic of having a wide range of mountainous topography through out its territory. Slopes that
are higher than 20 degrees were included in the Exclusion Areas 2008 map. However, the lesser angle
of slope degrees, the less probability for flowage of pollutants and wastes. In the Site Suitability Model
of this research, slopes that range from 0° to 5 ° are awarded the highest suitability value. The table
below illustrates the rest of the values assigned to the other classes.

Agustin B. Graterole Page 18 8/19/2008
Land Use/Cover
Raster layers were reclassified to assign a value for the suitability of these types of land use and
land cover. I assign the highest suitability value for Bushes and Shrubs land cover that doesn’t even
have agricultural value. The least suitability value was assigned for past agricultural lands that now are
inactive. It is important to note that all forested areas, national parks, etc, were included on the
Exclusion Areas Map 2008.

Agustin B. Graterole Page 19 8/19/2008
Urban Areas
Landfills are often known for emitting undesirable odors, specially affecting humans. Due to the
nature of landfills, the creation of these odors is difficult to mitigate. This happens even more if the
management of the landfill is not properly addressed for things such as the covering of wastes with dirt
on a daily basis. People often protest for the construction of landfills in close proximity of populated
areas. The urban areas layer used in this research gives a good idea of the location of populated areas
in Puerto Rico for the year 2000. The higher the distance the landfill is from these areas, the higher the
suitability. In the table below, values for suitability are assigned to urban areas proximity.

Agustin B. Graterole Page 20 8/19/2008
The Site Suitability Model was finalized with the application of an overlay analysis (Figure 1). It
consisted in using the “Plus” tool from raster “Math” tool applications for all the six previously
mentioned raster layers (Water Table, Rivers and Streams, Lakes, Lineament Zones, Slope, Land
Use/Cover and Urban Areas). Each individual raster layer contained values of 1, 3, 5, and 7. These
values where summed between each individual raster layers. As a result, the areas that are
represented with a higher total value will be the most suitable for the location of landfills.
Figure 1: Overlay Example Using “Plus” tool
Layers:
Resulting Layer

Agustin B. Graterole Page 21 8/19/2008
Results/Conclusions
The values that resulted from the overlay analysis ranged from 11 to 49. These values were
classified into the following four equal interval classes: 11 – 20.5, 20.5 – 30, 30 – 39.5, and 39.5 – 49.
The class with the highest value defined the areas with the highest suitability. The class with the lowest
value defined the areas with least suitability. (All resulting maps are shown on the following pages)
The island of Puerto Rico is known for its scarce amount of terrain for properly locating non-
toxic solid waste landfills. The Exclusion Areas 2008 and Site Suitability Model based maps of this
project illustrates this fact. The created Exclusion Areas 2008 map covers about 75% of the total area
of the island. Unsuitable places for the location of landfills because of high impact on environmental,
human health and activities are pretty evenly spread through out the island. However, the highest
valued suitable areas based from the Suitability Model analysis did discover some large enough
terrains which could be explored. Most of these are located on the southern portion of the island.
Further analysis for the viability of these places in terms of transportation and economics will be
needed.
*Due to the nature of the GIS compiled data utilized in this research, field studies are going to be necessary to corroborate results and address errors of geographic precision.

Agustin B. Graterole Page 22 8/19/2008
Map: Results of Site Suitability Model for the entire island w/o areas of exclusion.
Site Suitability Model for Landfills

Agustin B. Graterole Page 23 8/19/2008
Map: Combination of Site Suitability Model and Exclusion Areas 2008 map as mask.

Agustin B. Graterole Page 24 8/19/2008
Map: Combination of Site Suitability Model’s places of highest value and Exclusion Areas 2008 map as mask.
Agustin B. Graterole Page 25 8/19/2008
References
Vive la Geografia de Puerto Rico (2003), Angel David Cruz Baez, Carlos Guilbe and Adolfo R. Lopez. Editorial Cordillera.
Population Geography (2002), Gary L. Peters and Robert P. Larkin. Kendall/Hunt Publishing
Company.
Atlas de Puerto Rico (1997), Angel David Cruz Baez and Thomas D. Boswell. Published by the Cuban American National Council, Inc.
Soils (2007), Randall J. Shaetzl and Sharon Anderson. Cambridge University Press. GIS Based Solutions for Waste Disposals, SM Ramasamy, C J Kumanan, K Palanivel of Centre for
Remote Sensing, Bharathidasan University, Khajamalai Campus, Tiruchirappalli. GISdevelopment.net.
Autoridad de Desperdicios Solidos, http://www.ads.gobierno.pr/portada.html.
A New Approach to Landfill Site Selection in Ireland Using GIS Technology, Valerie Cummins,
Vicki O’Donnell, Alistair Allen, Joe Donnelly, Sotirios. Koukoulas, Coastal Resources Centre, Environment Research Institute, University College Cork, Ireland. Cork County Council, County Hall, Cork, Ireland.