land use regulations in new hampshire use regulations in new hampshire prepared for new hampshire...
TRANSCRIPT

Land Use Regulations in New Hampshire
Prepared for New Hampshire Public Policy Alliance for Housing,
Home Builders and Remodelers Association of New Hampshire
and New Hampshire Housing Finance Authority
Prepared by
Gallagher, Callahan & Gartrell, P.C. Augusta Boston Concord
800-528-1181 gcglaw.com
January, 2007
2
Acknowledgements
This report’s principal authors and researchers, Dr. Lisa Shapiro, Chief Economist, and Heidi Kroll, Market and Policy Analyst, would like to sincerely thank the many individuals at the New Hampshire Public Policy Alliance for Housing, the Home Builders and Remodelers Association of New Hampshire, and the New Hampshire Housing Finance Authority who contributed to this study.
In addition, we would also like to sincerely thank the professionals at Gallagher,
Callahan, and Gartrell, P.C., who contributed to this study. Attorney Ari Pollack served as legal advisor; Attorneys Erik Newman and Peter Cline conducted survey research; Janet Benson, Hannah Kelly, Lauri Main and Sandy Rolph designed and maintained the database and assisted with data analyses and report creation; and Susan Paschell served as report editor.
Report Citation Information included in this report or related land use regulation data should be cited in
the following way: “’Land Use Regulations in New Hampshire,’ prepared for the New Hampshire Public Policy Alliance for Housing, Home Builders and Remodelers Association of New Hampshire, and New Hampshire Housing Financing Authority by Gallagher, Callahan & Gartrell, P.C., January, 2007.” After the first reference, subsequent references may refer to “’Land Use Regulations in New Hampshire,’ January, 2007”.
3
Table of Contents Executive Summary 1. Summary 2. Introduction and Background 3. Key Survey Results and Analyses I. Introduction and Background 1. Purpose of the Study 2. Study Methodology
a. Survey Data Collection b. Survey Questions c. Survey Communities
II. Descriptions and Statistics on the Study Area III. Survey Results and Analyses 1. Minimum Lot Size Requirements 2. Accessory Dwelling Units 3. Cluster Zoning and Density Bonuses 4. Other Innovative Zoning 5. Growth Management Ordinances (GMOs) 6. Impact Fees IV. Summary V. Appendices 1. Survey questions 2. Key Survey Assumptions and Approaches 3. “Growth Rates by LMA, Community, LMA’s City, LMA’s Towns, Survey Area, and New Hampshire” 4. Bibliography List of Tables and Charts Section II. Descriptions and Statistics on the Study Area
Table: Survey Area Chart: Population in the Survey LMAs Chart: Jobs in the Survey LMAs Chart: Housing Units and Building Permits in the Survey LMAs Chart: Population and Housing Unit Average Annual Growth Chart: Housing Unit Average Annual Growth by Type of Housing Unit Chart: Median House Sale Price Average Annual Growth Chart: Total Covered Employment Average Annual Growth, 4th Qtr. 2002 – 4th Qtr. 2005

4
Section III. Survey Results and Analyses
Table: Average Minimum and Average Smallest Minimum Lot Size Requirements Table: Average Smallest Minimum Lot Size Requirements for Single Family Units Table: Average Smallest Minimum Lot Size Requirements for Two-Family Units Table: Average Smallest Minimum Lot Size Requirements for Three-Family Units Table: Average Smallest Minimum Lot Size Requirements for Three-Family Units for
55+ Chart: Survey Area Population in Communities with Cluster Zoning Chart: Population in Communities with Cluster Zoning, by LMA Chart: Communities with Cluster Zoning that Give an Opportunity for a Density Bonus,
by Housing Type Chart: Population in Communities with Density Bonuses, by LMA Table: Average Smallest Minimum Lot Size Requirements per Unit in Communities
With and Without a Density Bonus Table: Communities and Population by GMO Type Chart: Survey Area Population in Communities with GMOs Chart: Population in Communities with GMOs, by LMA Table: Growth Rates in GMO versus Non-GMO Communities Table: Average Smallest Minimum Lot Size Requirements per Unit in Communities
With and Without a GMO Table: GMO Communities with and without a Density Bonus Table: Communities that Collect Impact Fees
5
Executive Summary 1. Summary
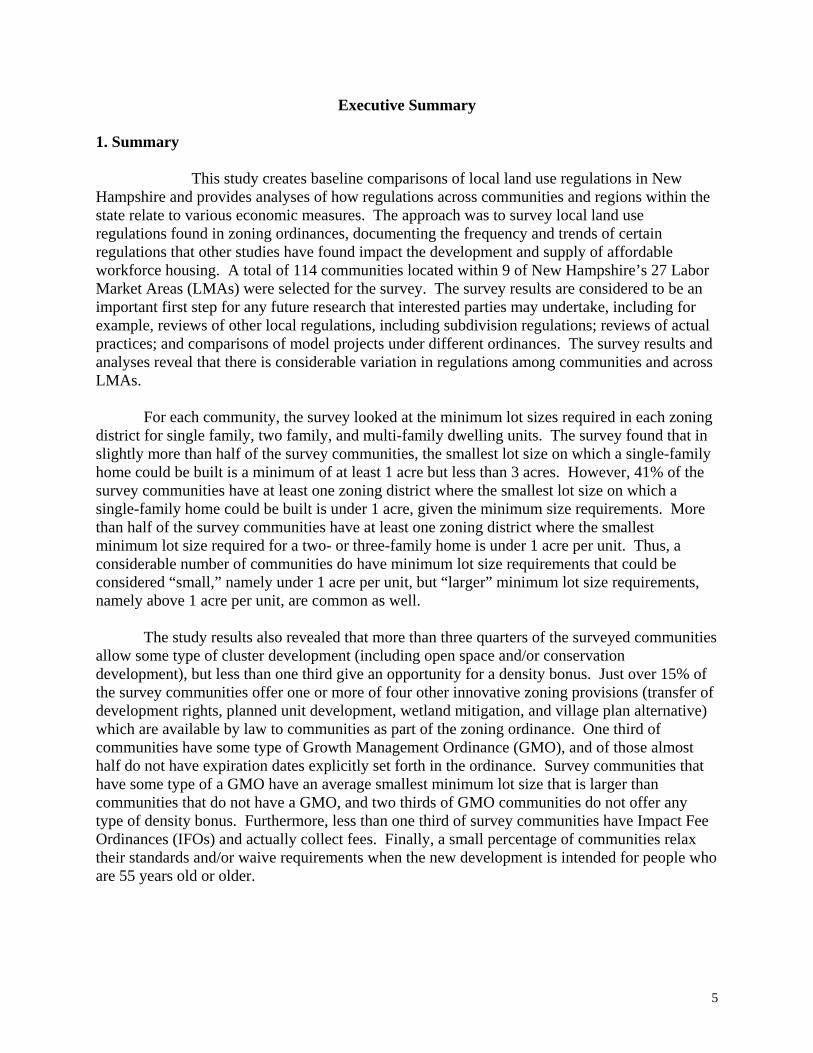
This study creates baseline comparisons of local land use regulations in New Hampshire and provides analyses of how regulations across communities and regions within the state relate to various economic measures. The approach was to survey local land use regulations found in zoning ordinances, documenting the frequency and trends of certain regulations that other studies have found impact the development and supply of affordable workforce housing. A total of 114 communities located within 9 of New Hampshire’s 27 Labor Market Areas (LMAs) were selected for the survey. The survey results are considered to be an important first step for any future research that interested parties may undertake, including for example, reviews of other local regulations, including subdivision regulations; reviews of actual practices; and comparisons of model projects under different ordinances. The survey results and analyses reveal that there is considerable variation in regulations among communities and across LMAs.
For each community, the survey looked at the minimum lot sizes required in each zoning district for single family, two family, and multi-family dwelling units. The survey found that in slightly more than half of the survey communities, the smallest lot size on which a single-family home could be built is a minimum of at least 1 acre but less than 3 acres. However, 41% of the survey communities have at least one zoning district where the smallest lot size on which a single-family home could be built is under 1 acre, given the minimum size requirements. More than half of the survey communities have at least one zoning district where the smallest minimum lot size required for a two- or three-family home is under 1 acre per unit. Thus, a considerable number of communities do have minimum lot size requirements that could be considered “small,” namely under 1 acre per unit, but “larger” minimum lot size requirements, namely above 1 acre per unit, are common as well. The study results also revealed that more than three quarters of the surveyed communities allow some type of cluster development (including open space and/or conservation development), but less than one third give an opportunity for a density bonus. Just over 15% of the survey communities offer one or more of four other innovative zoning provisions (transfer of development rights, planned unit development, wetland mitigation, and village plan alternative) which are available by law to communities as part of the zoning ordinance. One third of communities have some type of Growth Management Ordinance (GMO), and of those almost half do not have expiration dates explicitly set forth in the ordinance. Survey communities that have some type of a GMO have an average smallest minimum lot size that is larger than communities that do not have a GMO, and two thirds of GMO communities do not offer any type of density bonus. Furthermore, less than one third of survey communities have Impact Fee Ordinances (IFOs) and actually collect fees. Finally, a small percentage of communities relax their standards and/or waive requirements when the new development is intended for people who are 55 years old or older.

6
2. Introduction and Background
Over the last several years, the lack of affordable workforce housing has received extensive press coverage in New Hampshire, and interested parties have come together in the context of conferences, forums, coalitions and committees at the local, regional, and statewide level to discuss the issue and begin to work on possible solutions. In light of the state’s projected population and economic growth, potential increases in interest rates, and community concerns, the lack of affordable workforce housing is likely to remain a pressing problem until targeted solutions can be designed and effectively implemented.
New Hampshire’s lack of affordable workforce housing is well supported by data, research, and anecdotal evidence. Leaders, advocates, and associations have identified the lack of workforce housing as a serious threat to the state’s economy and demographic diversity. Governor Lynch has described the need for more affordable housing as an unsolved issue, and the problem is one that the New Hampshire Workforce Housing Council (WHC) has been working diligently to address. Opinion polls conducted by the New Hampshire Business and Industry Association (BIA) show that the lack of affordable workforce housing is a growing concern for its members: it was ranked #1 in 2006 and #6 in 2005. And just recently, a Legislative Study Committee on Affordable Housing / Living in New Hampshire found that the State should take a leadership role in ensuring that there is an adequate and balanced supply of affordable workforce housing.
Economic research confirms that there is good reason to be concerned. One study
estimated that a tight workforce housing market will cost New Hampshire annually up to 2,800 fewer jobs, up to $253 million in lost Gross State Product, and up to $33 million less in State and local revenues. Demographic research shows that New Hampshire is losing its young people and its entry level workers, and that a lack of affordable workforce housing is a contributing factor. The state’s future economic growth will depend on keeping younger, educated workers from leaving New Hampshire.
Recent studies in other states and nationwide point to the significant role of local land use
regulations as having an impact on the development of affordable workforce housing. These include traditional zoning provisions such as minimum lot sizes and density requirements, as well as alternative or “innovative” provisions such as cluster zoning, density bonuses, caps on building permits, phasing requirements, and impact fees.
This study’s approach was to survey local land use regulations found in zoning ordinances for factors that other studies have found impact the development and supply of affordable workforce housing. The purpose of reviewing the zoning ordinances was to create baseline comparisons of local land use regulations in New Hampshire. The survey results are considered to be an important first step for any future research that interested parties may undertake, including for example, reviews of other local regulations, including subdivision regulations; reviews of actual practices; and comparisons of model projects under different ordinances.
7
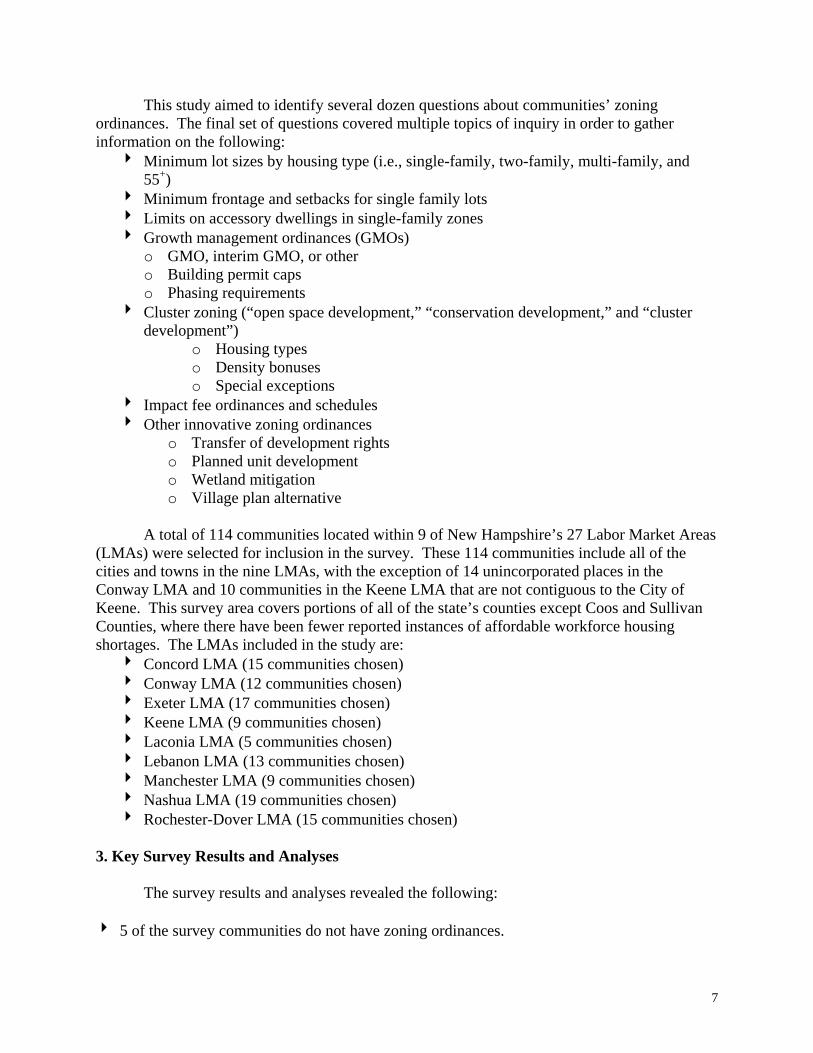
This study aimed to identify several dozen questions about communities’ zoning ordinances. The final set of questions covered multiple topics of inquiry in order to gather information on the following: 4 Minimum lot sizes by housing type (i.e., single-family, two-family, multi-family, and
55+) 4 Minimum frontage and setbacks for single family lots 4 Limits on accessory dwellings in single-family zones 4 Growth management ordinances (GMOs)
o GMO, interim GMO, or other o Building permit caps o Phasing requirements
4 Cluster zoning (“open space development,” “conservation development,” and “cluster development”)
o Housing types o Density bonuses o Special exceptions
4 Impact fee ordinances and schedules 4 Other innovative zoning ordinances
o Transfer of development rights o Planned unit development o Wetland mitigation o Village plan alternative
A total of 114 communities located within 9 of New Hampshire’s 27 Labor Market Areas
(LMAs) were selected for inclusion in the survey. These 114 communities include all of the cities and towns in the nine LMAs, with the exception of 14 unincorporated places in the Conway LMA and 10 communities in the Keene LMA that are not contiguous to the City of Keene. This survey area covers portions of all of the state’s counties except Coos and Sullivan Counties, where there have been fewer reported instances of affordable workforce housing shortages. The LMAs included in the study are: 4 Concord LMA (15 communities chosen) 4 Conway LMA (12 communities chosen) 4 Exeter LMA (17 communities chosen) 4 Keene LMA (9 communities chosen) 4 Laconia LMA (5 communities chosen) 4 Lebanon LMA (13 communities chosen) 4 Manchester LMA (9 communities chosen) 4 Nashua LMA (19 communities chosen) 4 Rochester-Dover LMA (15 communities chosen)
3. Key Survey Results and Analyses
The survey results and analyses revealed the following: 4 5 of the survey communities do not have zoning ordinances.
8
4 Looking first at the residential lot size requirements in all zoning districts throughout the
survey area, the survey found that the average lot size requirement across all zoning districts that allow single family units is a minimum of 2.06 acres, compared to a minimum of 1.24 acres per unit for all zoning districts that allow two-family dwelling units and 1.01 acres per unit for all zoning districts that allow three-family dwelling units.
4 Focusing next only on each community’s zoning district that allows the smallest residential
lot size, the survey found that the smallest minimum lot size for single family units averages 1.09 acres, while it averages 0.83 acres per unit for two-family dwellings and 0.79 acres per unit for three-family dwellings.
4 In slightly more than half of the survey communities, the smallest lot size on which a single-
family home could be built is a minimum of at least 1 acre but less than 3 acres. On the other hand, 41% of the survey communities have at least one zoning district where the smallest minimum lot size required for a single-family home is less than 1 acre. In fact, a third of the survey communities have a second single family district with a minimum lot size requirement also under 1 acre.
4 More than half of the survey communities have at least one zoning district where the smallest
minimum lot size required for a two- or three-family home is less than 1 acre per unit. Approximately one third of the survey communities have a smallest minimum lot size requirement for a two-family home that is at least 1 acre but less than 3 acres per unit, while less than one fifth of the survey communities have a smallest minimum lot size requirement for a three-family home that is at least 1 acre but less than 3 acres per unit.
4 Only about one third of the survey communities allow accessory dwelling units to be
occupied by a non-family member. 4 More than three quarters of the surveyed communities allow some type of cluster
development (including open space and/or conservation development), and more than nine out of ten people in the survey area are located in communities that allow cluster development. Single-family cluster housing is permitted more often than two-family cluster housing, and both are permitted more often than multi-family cluster housing.
4 Despite the high prevalence of cluster zoning, less than one third of surveyed communities
give an opportunity for a density bonus. A little more than one third of the survey population lives in these communities.
4 There is considerable variation across LMAs in terms of whether or not communities that
allow cluster zoning offer the opportunity for a density bonus. Anywhere from 0% to 56% of an LMA’s communities offer the opportunity for a density bonus, and anywhere from 0% to 83% of an LMA’s population lives in communities offering the opportunity for a density bonus. This wide variation exists even when the analysis excludes the survey area’s cities, where populations are greater, and simply looks at the remaining towns in each LMA.
9
4 Just over 15% of the survey communities offer one or more of four innovative zoning provisions (transfer of development rights, planned unit development, wetland mitigation, and village plan alternative) that are available by law to communities as part of the zoning ordinance. Planned unit development was the most common of these.
4 37 communities have some type of Growth Management Ordinance1 (GMO), and 20 of them
include both building permit caps and phasing requirements. Almost half of the communities with GMOs do not have expiration dates explicitly set forth in the ordinance, and of the 20 that do, expiration dates range from Town Meeting in 2007 to Town Meeting in 2011.
4 Less populated communities are more likely to have some type of a GMO. This is evidenced
by the fact that nearly one third of surveyed communities have adopted some type of GMO but only about one quarter of the survey population lives in these communities.
4 73% of the population that lives in communities with GMOs is concentrated in the Concord
and Nashua LMAs. In comparison, 41% of the survey population lives in these 2 LMAs. 4 Growth rates in population, housing units, and jobs have been higher in communities that
have some type of GMO than in communities that do not. Population grew by approximately 8% between 2000 and 2005 in GMO communities, versus 5% in those without; total housing units grew between 2000 and 2005 by roughly 11% in GMO communities, versus 8% in those without; and total jobs grew between the 4th quarter of 2002 and the 4th quarter of 2005 by about 4%, versus 3% in those without.
4 Some communities with GMOs do not offer the opportunity for density bonuses in cluster
zoning. Of the 37 communities with GMOs, only 12 offer cluster zoning with some type of density bonus. Two-thirds of the population living in GMO communities lives in communities that do not offer the opportunity for some type of density bonus.
4 Survey communities that have some type of a GMO have an average smallest minimum lot
size that is larger than communities that do not have a GMO. This is true for single, two-, and three-family dwellings, as well as all housing types combined, for which GMO communities require, on average, nearly one quarter of an acre more per unit than non-GMO communities.
4 31 survey communities have Impact Fee Ordinances (IFOs) and actually collect fees, and 21
of these are located in either the Exeter or Nashua LMAs.
1 Communities may adopt a GMO (RSA 674:22), an interim GMO (RSA 674:23), or simply a building cap or phasing requirement, which is referred to in this study as “other” GMO. This survey recorded information on all three types of GMOs, i.e., “permanent,” interim, and other. This study’s use of the word “permanent” in the context of GMOs is purely for the purpose of contrasting GMOs that have been adopted pursuant to RSA 674:22 to those that have been adopted pursuant to RSA 674:23.
10
4 More than half of the survey area’s estimated population (516,367 people), housing units (206,057 units), and jobs (277,353) in 2005 is located in communities that currently collect impact fees.
4 More than one third of communities that have GMOs also collect impact fees. 4 Communities that currently collect impact fees had slightly slower rates of growth in housing
units between 2004 and 2005 than other communities. 4 Some communities impose fewer restrictions on housing for people who are 55 years old or
older (“55+”). For example, 5% of survey communities exempt elderly housing development from their GMOs. Five percent of survey communities also only allow one or more type of cluster housing if it is for 55+ developments, and 4% restrict density bonuses to 55+ cluster housing. Four out of 10 communities that require a special exception for cluster development waive that requirement for 55+ housing developments. The average smallest minimum lot size for three-family units for 55+ housing is 0.88 acres per unit.
11
I. Introduction and Background 1. Purpose of the Study
Over the last several years, the lack of affordable workforce housing has received extensive press coverage in New Hampshire, and interested parties have come together in the context of conferences, forums, coalitions and committees at the local, regional, and statewide levels to discuss the issue and begin to work on possible solutions. In light of the state’s projected population and economic growth, potential increases in interest rates, and community concerns, the lack of affordable workforce housing is likely to remain a pressing problem until targeted solutions can be designed and effectively implemented.
New Hampshire’s lack of affordable workforce housing is well supported by data,
research, and anecdotal evidence, and the problem is widely recognized by a broad range of private, public, and governmental entities throughout the state. Leaders, advocates, and associations have identified the lack of affordable workforce housing as a serious threat to the state’s economy and demographic diversity. Governor John Lynch recently attended a meeting with the state’s business leaders and the Department of Resources and Economic Development, during which he described the need for more affordable housing as an unsolved issue and asked for insight on what the state could do to make it easier for businesses to grow and prosper in New Hampshire.2 The problem is one that the New Hampshire Workforce Housing Council (WHC) has been working diligently to address. WHC is a statewide organization that “promotes ways to increase and diversify the supply of housing so employers will view our state as an attractive place to live and work.”3 The Council’s broad-based membership coordinates and supports local, regional, and statewide efforts that encourage a range of housing options to meet the needs of the State’s workforce.
Just recently, a Legislative Study Committee on Affordable Housing / Living in New
Hampshire issued its report. The Committee found that current residential development patterns often limit the availability of more affordable workforce housing and that the State should take a leadership role in ensuring that there is an adequate and balanced supply of affordable workforce housing. The report indicates that this could include improved technical assistance to local governments on housing-related matters.4
At least one opinion poll provides evidence that concern over the lack of affordable
workforce housing is widespread. During the summers of 2005 and 2006, the New Hampshire Business and Industry Association (BIA) conducted a series of roundtable discussions, at which attendees identified and prioritized threats to the “New Hampshire Advantage.” A month after completing each set of roundtables, the BIA conducted a survey in which association members were asked to rank the threats identified during the roundtables. In 2005, improving the availability and affordability of workforce housing was ranked #6. Just one year later, in 2006,
2 “Business Leaders Gather to Focus on Region’s Economic Future,” Karen Spiller, Nashua Telegraph, 7/29/06. 3 http://www.workforcehousingnh.com/ 4 “A Report by The Committee to Study Affordable Housing / Living in New Hampshire, SB 190 (Chapter 210, Laws of 2006,” October 31, 2006.

12
the threat was ranked #1. New Hampshire’s employers clearly see the high cost and low supply of workforce housing as one of the biggest problems that they and their employees face.
Economic research confirms that there is good reason to be concerned: the lack of
affordable workforce housing does have an impact on the New Hampshire economy. A study sponsored by the New Hampshire Workforce Housing Council estimated that a tight workforce housing market will cost New Hampshire annually up to 2,800 fewer jobs, up to $253 million in lost Gross State Product, and up to $33 million less in State and local revenues. The study found that the results should “encourage the design and implementation of regulatory policies to meet the needs of those who are employed here and those who hope to become members of New Hampshire’s workforce.”5
Demographic research shows that New Hampshire is losing its young people and its entry level workers, and the lack of affordable workforce housing is playing a substantial role. Economic forecaster Ross Gittell has “cautioned that an aging population, a lack of affordable housing, and an ever-tightening labor market could dilute the state’s fundamental business climate advantages.”6 He has indicated that New Hampshire has a shrinking and aging work force and that its economic growth will depend on keeping younger educated workers from leaving the state. Peter Francese, director of demographic forecasts for the New England Economic Partnership, agrees that “the key to the state’s continued economic growth is to provide affordable housing for young people with children.” Mr. Francese points to local measures, such as property tax breaks for the elderly and a preference for age-restricted housing, that discourage the construction of affordable housing and lead to the outflow of working age residents. According to Mr. Francese, the most significant out-migration is occurring in the 25 to 44 year age group, which impacts the availability of workers needed to grow the economy.7
Recent studies point to the significant role of local land use regulations as having
potentially positive or negative impacts on the development of affordable workforce housing. In 2003, a land use regulation survey was conducted of local governments in the country’s 50 largest metropolitan areas, including the Boston area (southern New Hampshire and north eastern Massachusetts) as part of the survey’s Northeast region.8 The survey found that “basic land use regulations like zoning and comprehensive planning dominate the regulatory landscape” in the U.S. (at 10). Impact fees were found to be another common tool for residential land use regulation, and their use in New Hampshire suburbs outside of Boston was found to be as common as their national average use. The survey also found that in the New Hampshire suburbs 84% of jurisdictions have low density zoning, 79% would bar the survey’s hypothetical apartment development (namely 40 units of two story apartments on a five acre lot), and 14% use caps (at 23). The survey concludes that the New Hampshire suburbs outside of Boston are places with a very high incidence of exclusionary land use (at 13).
5 “Housing New Hampshire’s Workforce,” Prepared for the New Hampshire Workforce Housing Council by Dr. Lisa Shapiro, 3/28/05. 6 “Economic Crossroads Not Far Ahead,” Michael McCord, Portsmouth Herald, 11/8/06. 7 “Economist Warns NH Could Lose its Economic Advantage,” Jerry Miller, Union Leader, 5/3/06. 8 “Land Use Regulations in the Nation’s 50 Largest Metropolitan Areas,” The Brookings Institution, Pendall et al., 2006
13
Other studies have focused on specific states. In Massachusetts, researchers conducted a 2½ year study that attempted to quantify the relationship between housing prices and local regulations for 187 communities in the eastern part of the state. The data were used to test the relationship between regulations and housing prices and found a high and significant relationship for factors including minimum lot size and housing density.9 The study found that one additional acre in the minimum lot size was associated with between an 11.5 and 13.8 percent increase in housing prices, depending on what factors were controlled for (at iv). It also found that as minimum lot size increases by one acre, the share of homes that qualify as affordable (30% of income) drops by 8 to 20 percent (at iv).
This level of study, data and extensive press coverage suggests that there is a strong need
to investigate the local regulations in New Hampshire communities that have been found in other states to encourage or discourage the development of affordable workforce housing. Specifically, there is a need for baseline comparisons of local regulations, as well as analyses of how regulations across communities and regions within the state relate to various economic measures. The purpose of this study is to provide data on over 100 communities in New Hampshire, documenting the frequency and trends of local land use regulations.
2. Study Methodology Survey Data Collection
The study’s approach was to survey local land use regulations found in zoning ordinances for factors that other studies have found impact the development and supply of affordable workforce housing. The purpose of reviewing the zoning ordinances was to create baseline comparisons of local land use regulations in New Hampshire. The survey results are considered to be an important first step for any future research that interested parties may undertake, including for example, reviews of other local regulations, including subdivision regulations; reviews of actual practices; and comparisons of model projects under different ordinances.
Zoning ordinances play an important role in defining the character of a community.
These ordinances include regulations related to things such as, but not limited to: 4 the division of the municipality into districts to regulate and segregate various land uses
and/or building types in potentially different ways between districts 4 the orientation and dimensions of streets, lots and buildings (e.g., minimum lot sizes and
setbacks, and maximum building heights) 4 the use of certain types of land to preserve and/or protect the environment
The purposes of zoning ordinances are set forth in New Hampshire law (RSA 674:17),
and they must be adopted in accordance with a prescriptive set of legal procedures (RSA 674:18.). Typically, a zoning ordinance cannot apply to existing structures or to the existing use of any building. Rather, it typically applies to new structures and new uses of existing buildings when the new use is substantially different from the prior one. 9 “Regulation and the Rise of Housing Prices in Greater Boston,” Pioneer Institute for Public Policy Research, Glaeser, Edward L., et al., 2006.
14
Each locality chosen for the survey was contacted by phone to ensure that accurate, up-
to-date zoning ordinances were collected for the survey. Community representatives were very responsive and helpful – without their assistance, this survey would not have been possible. The survey data were collected by a team of researchers who reviewed the most up-to-date zoning ordinances for each of the target communities, filled in answers to the survey questions, and entered the results into a database. Additional community level data such as population, jobs, housing units, and building permits were also collected and added to the database.
Survey Questions
This study aimed to identify numerous questions about communities’ zoning ordinances, the answers to which would develop key data points on local land use regulations in a representative sample of New Hampshire. A complete list of these questions can be found in Appendix 1. The development of the questions was based on, among other issues: 4 New Hampshire-specific studies, reports and data on regulations and on affordable
workforce housing supply 4 the results of out-of-state studies in terms of which regulations had the largest impacts on
affordable housing supply 4 New Hampshire state laws and court decisions’ requirements 4 practitioners’ experiences 4 suitability for empirical analysis 4 suitability for a standard set of assumptions and minimal judgment 4 suitability for potential future research by interested parties
During the drafting of the survey questions, input was sought from project advisors,
including planners, developers, housing advocates, economists, and lawyers. The questions were tested on a few communities and fine-tuned. The final set of questions covered multiple topics of inquiry in order to gather information on the following: 4 Minimum lot sizes by housing type (i.e., single-family, two-family, multi-family, and
55+) 4 Minimum frontage and setbacks for single family lots 4 Limits on accessory dwelling units in single-family zones 4 Growth management ordinances (GMOs)
o GMO, interim GMO, or other10 o Building permit caps o Phasing requirements
10 Communities may adopt a GMO (RSA 674:22), an interim GMO (RSA 674:23), or simply a building cap or phasing requirement, which is referred to in this study as “other” GMO. This survey recorded information on all three types of GMOs, i.e., “permanent,” interim, and other. This study’s use of the word “permanent” in the context of GMOs is purely for the purpose of contrasting GMOs that have been adopted pursuant to RSA 674:22 to those that have been adopted pursuant to RSA 674:23.
15
4 Cluster zoning (“open space development,” “conservation development,” and “cluster
development”) o Housing types o Density bonuses o Special exceptions
4 Impact fee ordinances and schedules 4 Other innovative zoning ordinances
o Transfer of development rights o Planned unit development o Wetland mitigation o Village plan alternative
In order to complete the survey for each community in a way that would yield
meaningful results, it was necessary to make certain simplifying assumptions and to streamline reporting of certain types of data. Appendix 2 provides a summary of key assumptions and approaches that were employed when each target community was surveyed. Survey Communities
The methodology used to select communities to survey was based on choosing geographical areas with common elements in order to minimize explanatory variables other than the data being collected within each area. The communities that were chosen were selected from areas with:
• common economic and institutional elements (e.g., job conditions, labor markets, counties, regional planning commissions)
• reported instances of affordable workforce housing shortages
This approach resulted in the selection of 114 target communities located within nine Labor Market Areas (LMAs). An LMA is a group of communities that forms “an economically integrated region within which workers can readily change jobs without changing their place of residence”11. The LMAs used in this survey are consistent with those defined by the U.S. Census Bureau in the 2000 Census. The survey area covers portions of all of the state’s counties except Coos and Sullivan Counties, where there have been fewer reported instances of workforce housing shortages. The selection of LMAs and communities was reviewed and approved by study advisors. Additional demographic and economic information on the survey area is provided in Section II of this report.
11 “Economic Conditions in New Hampshire, March 2005,” New Hampshire Economic and Labor Market Information Bureau, Volume 105, Number 03.
16
II. Descriptions and Statistics on the Study Area Nine of New Hampshire’s 27 Labor Market Areas (LMAs) were selected as the study area. These LMAs are consistent with those defined in the 2000 Census. The LMAs included in the study are:
Concord LMA (15 communities chosen) Conway LMA (12 communities chosen) Exeter LMA (17 communities chosen) Keene LMA (9 communities chosen) Laconia LMA (5 communities chosen) Lebanon LMA (13 communities chosen) Manchester LMA (9 communities chosen) Nashua LMA (19 communities chosen) Rochester-Dover LMA (15 communities chosen)
Within these LMAs, 114 communities were chosen for inclusion in the survey. A
complete list of these communities can be found in Appendix 3. These 114 communities include all of the cities and towns in the nine LMAs, with the exception of 14 unincorporated places in the Conway LMA and 10 communities in the Keene LMA that are not contiguous to the City of Keene. These places were excluded in order to keep the survey sample size more manageable.
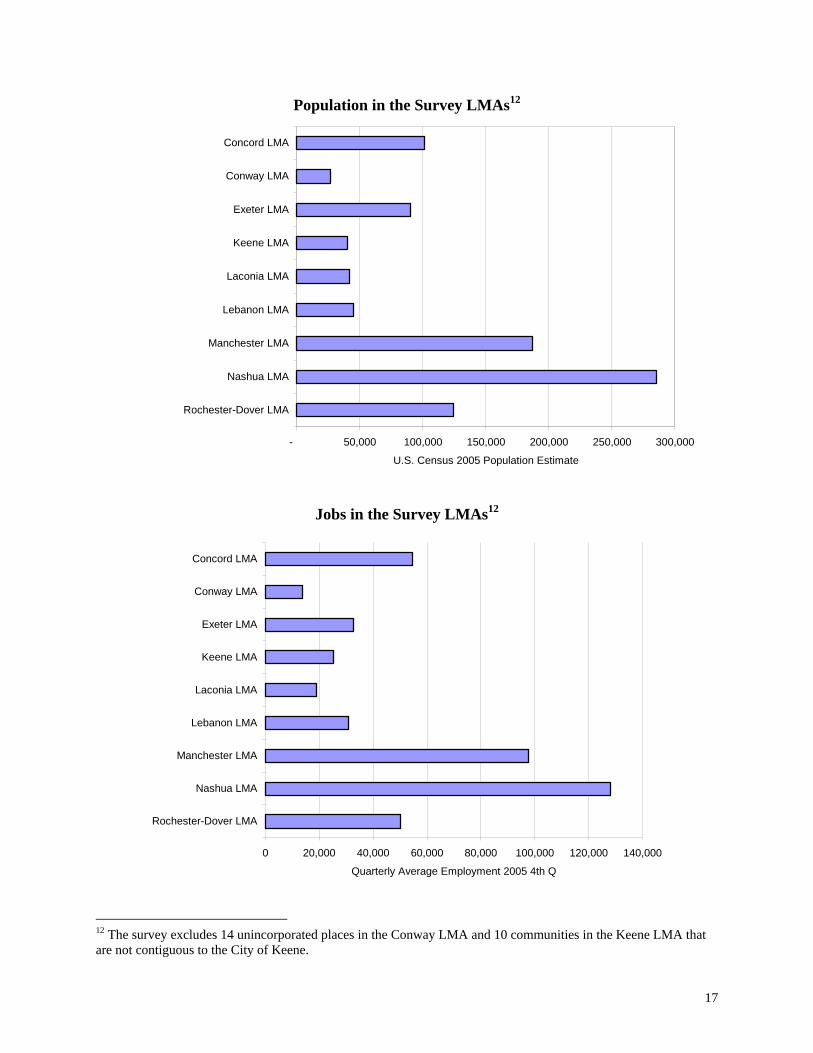
The 114 communities have an estimated population of approximately 942,062, or roughly
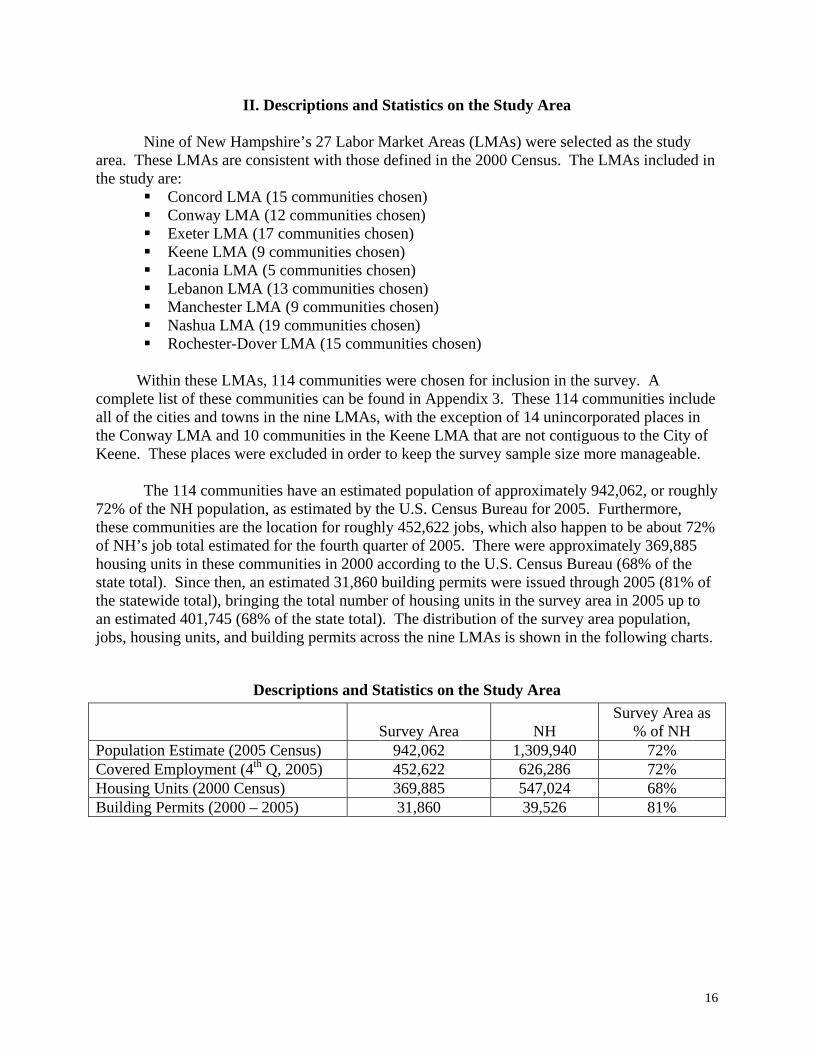
72% of the NH population, as estimated by the U.S. Census Bureau for 2005. Furthermore, these communities are the location for roughly 452,622 jobs, which also happen to be about 72% of NH’s job total estimated for the fourth quarter of 2005. There were approximately 369,885 housing units in these communities in 2000 according to the U.S. Census Bureau (68% of the state total). Since then, an estimated 31,860 building permits were issued through 2005 (81% of the statewide total), bringing the total number of housing units in the survey area in 2005 up to an estimated 401,745 (68% of the state total). The distribution of the survey area population, jobs, housing units, and building permits across the nine LMAs is shown in the following charts.
Descriptions and Statistics on the Study Area
Survey Area NH Survey Area as
% of NH Population Estimate (2005 Census) 942,062 1,309,940 72% Covered Employment (4th Q, 2005) 452,622 626,286 72% Housing Units (2000 Census) 369,885 547,024 68% Building Permits (2000 – 2005) 31,860 39,526 81%
17
Population in the Survey LMAs12
- 50,000 100,000 150,000 200,000 250,000 300,000
Rochester-Dover LMA
Nashua LMA
Manchester LMA
Lebanon LMA
Laconia LMA
Keene LMA
Exeter LMA
Conway LMA
Concord LMA
U.S. Census 2005 Population Estimate
Jobs in the Survey LMAs12
0 20,000 40,000 60,000 80,000 100,000 120,000 140,000
Rochester-Dover LMA
Nashua LMA
Manchester LMA
Lebanon LMA
Laconia LMA
Keene LMA
Exeter LMA
Conway LMA
Concord LMA
Quarterly Average Employment 2005 4th Q
12 The survey excludes 14 unincorporated places in the Conway LMA and 10 communities in the Keene LMA that are not contiguous to the City of Keene.
18
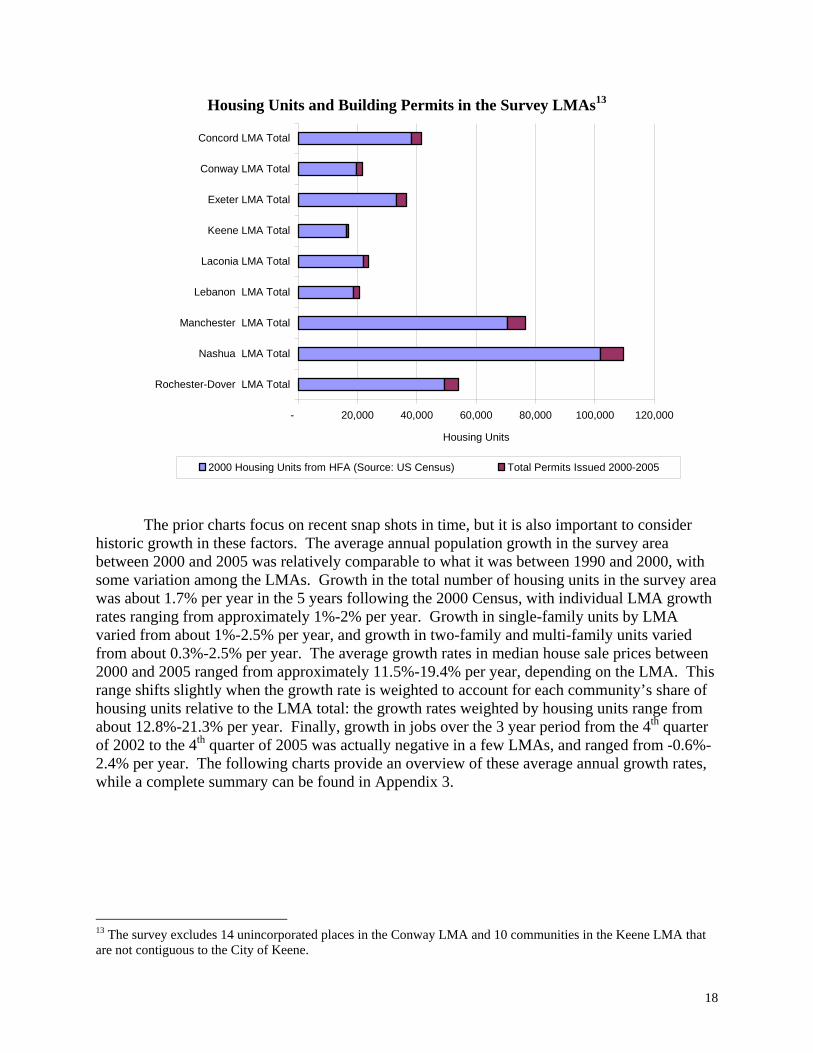
Housing Units and Building Permits in the Survey LMAs13
- 20,000 40,000 60,000 80,000 100,000 120,000
Rochester-Dover LMA Total
Nashua LMA Total
Manchester LMA Total
Lebanon LMA Total
Laconia LMA Total
Keene LMA Total
Exeter LMA Total
Conway LMA Total
Concord LMA Total
Housing Units
2000 Housing Units from HFA (Source: US Census) Total Permits Issued 2000-2005
The prior charts focus on recent snap shots in time, but it is also important to consider
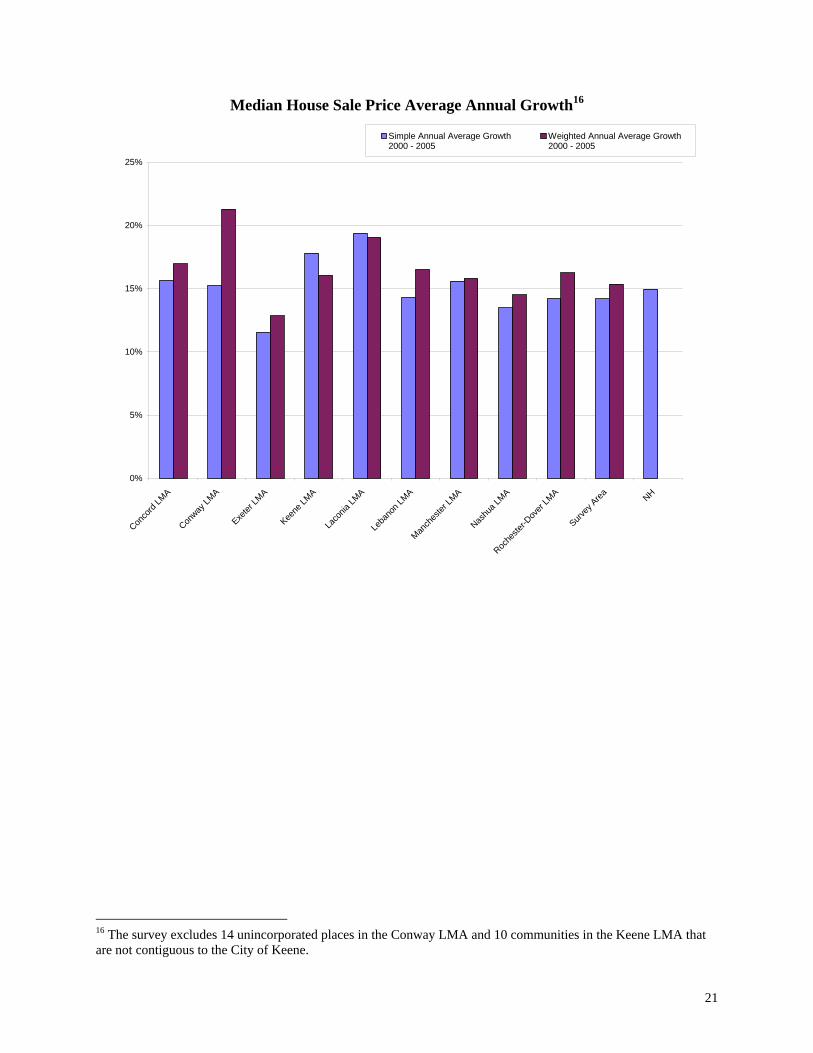
historic growth in these factors. The average annual population growth in the survey area between 2000 and 2005 was relatively comparable to what it was between 1990 and 2000, with some variation among the LMAs. Growth in the total number of housing units in the survey area was about 1.7% per year in the 5 years following the 2000 Census, with individual LMA growth rates ranging from approximately 1%-2% per year. Growth in single-family units by LMA varied from about 1%-2.5% per year, and growth in two-family and multi-family units varied from about 0.3%-2.5% per year. The average growth rates in median house sale prices between 2000 and 2005 ranged from approximately 11.5%-19.4% per year, depending on the LMA. This range shifts slightly when the growth rate is weighted to account for each community’s share of housing units relative to the LMA total: the growth rates weighted by housing units range from about 12.8%-21.3% per year. Finally, growth in jobs over the 3 year period from the 4th quarter of 2002 to the 4th quarter of 2005 was actually negative in a few LMAs, and ranged from -0.6%-2.4% per year. The following charts provide an overview of these average annual growth rates, while a complete summary can be found in Appendix 3.
13 The survey excludes 14 unincorporated places in the Conway LMA and 10 communities in the Keene LMA that are not contiguous to the City of Keene.

19
Population and Housing Unit Average Annual Growth14
0.0%
0.5%
1.0%
1.5%
2.0%
2.5%
Conco
rd LM
A
Conway
LMA
Exeter
LMA
Keene
LMA
Laco
nia LM
A
Leba
non L
MA
Manch
ester
LMA
Nashu
a LMA
Roche
ster-D
over
LMA
Survey
Area NH
Population Growth1990 - 2000
Population Growth2000 - 2005
Total Housing Unit Growth2000 - 2005
14 The survey excludes 14 unincorporated places in the Conway LMA and 10 communities in the Keene LMA that are not contiguous to the City of Keene.

20
Housing Unit Average Annual Growth by Type of Housing Unit15
0.0%
0.5%
1.0%
1.5%
2.0%
2.5%
3.0%
Conco
rd LM
A
Conway
LMA
Exeter
LMA
Keene
LMA
Laco
nia LM
A
Leba
non L
MA
Manch
ester
LMA
Nashu
a LMA
Roche
ster-D
over
LMA
Survey
Area NH
Single Family2000 - 2005
Two-Family and Multi Family2000 - 2005
Mobile Home2000 - 2005
15 The survey excludes 14 unincorporated places in the Conway LMA and 10 communities in the Keene LMA that are not contiguous to the City of Keene.
21
Median House Sale Price Average Annual Growth16
0%
5%
10%
15%
20%
25%
Conco
rd LM
A
Conway
LMA
Exeter
LMA
Keene
LMA
Laco
nia LM
A
Leba
non L
MA
Manch
ester
LMA
Nashu
a LMA
Roche
ster-D
over
LMA
Survey
Area NH
Simple Annual Average Growth2000 - 2005
Weighted Annual Average Growth2000 - 2005
16 The survey excludes 14 unincorporated places in the Conway LMA and 10 communities in the Keene LMA that are not contiguous to the City of Keene.

22
Total Covered Employment Average Annual Growth, 4th Qtr. 2002 – 4th Qtr. 200517
-1.0%
-0.5%
0.0%
0.5%
1.0%
1.5%
2.0%
2.5%
3.0%
Conco
rd LM
A
Conway
LMA
Exeter
LMA
Keene
LMA
Laco
nia LM
A
Leba
non L
MA
Manch
ester
LMA
Nashu
a LMA
Roche
ster-D
over
LMA
Survey
Area NH
17 The survey excludes 14 unincorporated places in the Conway LMA and 10 communities in the Keene LMA that are not contiguous to the City of Keene.

23
III. Survey Results and Analyses
The survey results and analyses reveal that there is considerable variation in land use regulations among communities and across LMAs, but that the surveyed zoning ordinances do share some common features that other studies have associated with both positive and negative impacts on the supply of affordable workforce housing.
As a threshold finding, 5 of the 114 survey communities do not have zoning ordinances.
Seventy-four posted their current zoning ordinances online, while another 9 of them had outdated zoning ordinances posted online. The remaining 26 do not post their zoning ordinances on the internet. 1. Minimum Lot Sizes Requirements
The minimum lot size requirements set forth in a community’s zoning ordinance play an important role in defining the character of the community as a whole, as well as its individual zoning districts. For each community, this survey recorded the minimum lot sizes required in each district for single family, two family, and multi-family dwelling units. It is important to recognize that zoning ordinances differ in terms of whether their stated minimum lot sizes are expressed in total land area or some portion of that area, sometimes referred to in terms such as “useable area,” “buildable area,” “contiguous dry lot,” or “upland”. These terms reflect the exclusion of one or more type of land from the total area, including but not necessarily limited to: slopes of varying degrees; waterways; wetlands; floodplains; poorly drained soils; and land within highway or utility rights of way. The survey recorded minimum lot size requirements as set forth in each ordinance, regardless of the type of land area and regardless of any additional conditions or requirements that may dictate the location and/or footprint of a building on the lot. Looking first at the residential lot size requirements in all zoning districts throughout the survey area, the survey found that the average lot size requirement across all zoning districts that allow single family units is a minimum of 2.06 acres, compared to a minimum of 1.24 acres per unit for two-family dwelling units and 1.01 acres per unit for three-family dwelling units. These averages simply reflect a rough approximation of minimum requirements in the survey area, due to the methodology employed. Using single family units as an example, the average minimum lot size requirement reported above starts by calculating a community’s simple average single family minimum lot size based on the requirement in each district where single family dwellings are permitted. Some communities may only have one district where single family units are allowed, others may have ten. Regardless, a simple average is calculated. Once this exercise has been performed for each community in the survey, then a simple average is taken of all the community simple averages. Rather than looking at the average minimum lot size required in all zoning districts throughout the survey area, another analysis narrows the focus to the one zoning district in each community that allows for the smallest lot size for single family dwellings, and similarly two family and multi-family dwellings. The survey found that, on average, the smallest minimum lot size requirement for single family units is 1.09 acres, while it is 0.83 acres per unit for two-family dwellings, and 0.79 acres per unit for three-family dwellings.
24
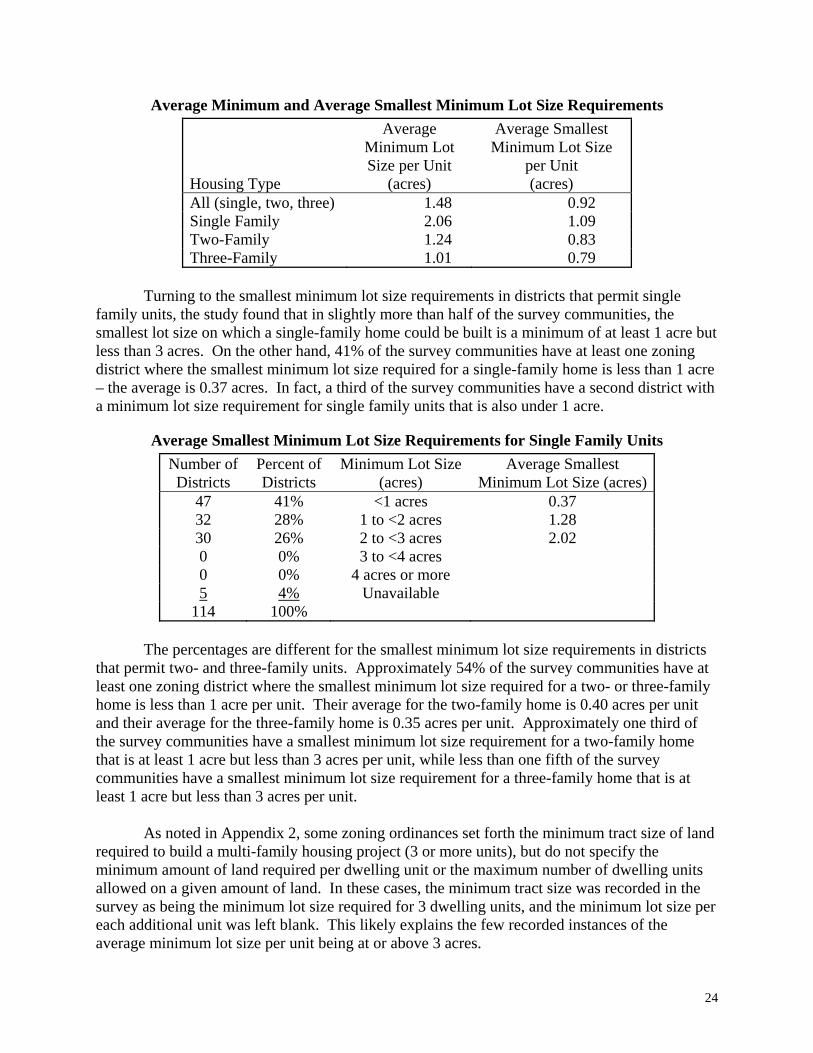
Average Minimum and Average Smallest Minimum Lot Size Requirements
Housing Type
Average Minimum Lot Size per Unit
(acres)
Average Smallest Minimum Lot Size
per Unit (acres)
All (single, two, three) 1.48 0.92 Single Family 2.06 1.09 Two-Family 1.24 0.83 Three-Family 1.01 0.79
Turning to the smallest minimum lot size requirements in districts that permit single
family units, the study found that in slightly more than half of the survey communities, the smallest lot size on which a single-family home could be built is a minimum of at least 1 acre but less than 3 acres. On the other hand, 41% of the survey communities have at least one zoning district where the smallest minimum lot size required for a single-family home is less than 1 acre – the average is 0.37 acres. In fact, a third of the survey communities have a second district with a minimum lot size requirement for single family units that is also under 1 acre.
Average Smallest Minimum Lot Size Requirements for Single Family Units Number of Districts
Percent of Districts
Minimum Lot Size(acres)
Average Smallest Minimum Lot Size (acres)
47 41% <1 acres 0.37 32 28% 1 to <2 acres 1.28 30 26% 2 to <3 acres 2.02 0 0% 3 to <4 acres 0 0% 4 acres or more 5 4% Unavailable
114 100%
The percentages are different for the smallest minimum lot size requirements in districts that permit two- and three-family units. Approximately 54% of the survey communities have at least one zoning district where the smallest minimum lot size required for a two- or three-family home is less than 1 acre per unit. Their average for the two-family home is 0.40 acres per unit and their average for the three-family home is 0.35 acres per unit. Approximately one third of the survey communities have a smallest minimum lot size requirement for a two-family home that is at least 1 acre but less than 3 acres per unit, while less than one fifth of the survey communities have a smallest minimum lot size requirement for a three-family home that is at least 1 acre but less than 3 acres per unit.
As noted in Appendix 2, some zoning ordinances set forth the minimum tract size of land
required to build a multi-family housing project (3 or more units), but do not specify the minimum amount of land required per dwelling unit or the maximum number of dwelling units allowed on a given amount of land. In these cases, the minimum tract size was recorded in the survey as being the minimum lot size required for 3 dwelling units, and the minimum lot size per each additional unit was left blank. This likely explains the few recorded instances of the average minimum lot size per unit being at or above 3 acres.

25
Average Smallest Minimum Lot Size Requirements for Two-Family Units
Number of Districts
Percent of
Districts
Minimum Lot Size
(acres)
Average Smallest Minimum Lot Size per Unit
(acres) 62 54% <1 acres 0.40 23 20% 1 to <2 acres 1.21 13 11% 2 to <3 acres 2.04 1 1% 3 to <4 acres 3.00 0 0% 4 acres or more
15 13% Unavailable 114 100%
Average Smallest Minimum Lot Size Requirements for Three-Family Units
Number of Districts
Percent of
Districts
Minimum Lot Size
(acres)
Average Smallest Minimum Lot Size per Unit
(acres) 61 54% <1 acres 0.35 11 10% 1 to <2 acres 1.36 9 8% 2 to <3 acres 2.07 2 2% 3 to <4 acres 3.17 1 1% 4 acres or more 5.00
30 26% Unavailable 114 100%
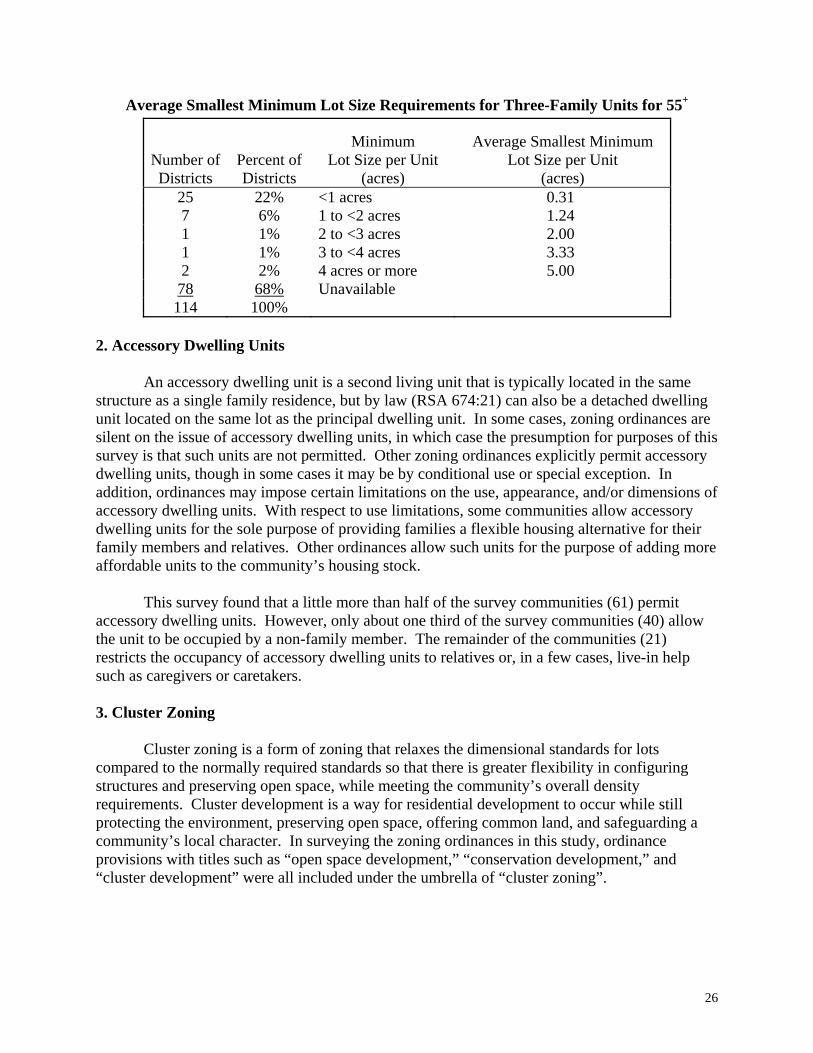
The smallest minimum lot size for three-family dwelling units for 55+ housing averages
0.88 acres per unit. The majority of communities that have specific minimum lot size requirements for 55+ housing require less than 1 acre per unit, with the average for this majority being 0.31 acres per unit. As noted in Appendix 2, some zoning ordinances set forth the minimum tract size of land required to build a multi-family housing project, such as one for 55+ housing, but do not specify the minimum amount of land required per dwelling unit or the maximum number of dwelling units allowed on a given amount of land. In these cases, the minimum tract size was recorded in the survey as being the minimum lot size required for 3 dwelling units, and the minimum lot size per each additional unit was left blank. This likely explains the few recorded instances of the average minimum lot size per unit being at or above 3 acres.
26
Average Smallest Minimum Lot Size Requirements for Three-Family Units for 55+
Number of Districts
Percent of Districts
Minimum Lot Size per Unit
(acres)
Average Smallest Minimum Lot Size per Unit
(acres) 25 22% <1 acres 0.31 7 6% 1 to <2 acres 1.24 1 1% 2 to <3 acres 2.00 1 1% 3 to <4 acres 3.33 2 2% 4 acres or more 5.00 78 68% Unavailable 114 100%
2. Accessory Dwelling Units
An accessory dwelling unit is a second living unit that is typically located in the same structure as a single family residence, but by law (RSA 674:21) can also be a detached dwelling unit located on the same lot as the principal dwelling unit. In some cases, zoning ordinances are silent on the issue of accessory dwelling units, in which case the presumption for purposes of this survey is that such units are not permitted. Other zoning ordinances explicitly permit accessory dwelling units, though in some cases it may be by conditional use or special exception. In addition, ordinances may impose certain limitations on the use, appearance, and/or dimensions of accessory dwelling units. With respect to use limitations, some communities allow accessory dwelling units for the sole purpose of providing families a flexible housing alternative for their family members and relatives. Other ordinances allow such units for the purpose of adding more affordable units to the community’s housing stock.
This survey found that a little more than half of the survey communities (61) permit
accessory dwelling units. However, only about one third of the survey communities (40) allow the unit to be occupied by a non-family member. The remainder of the communities (21) restricts the occupancy of accessory dwelling units to relatives or, in a few cases, live-in help such as caregivers or caretakers. 3. Cluster Zoning
Cluster zoning is a form of zoning that relaxes the dimensional standards for lots compared to the normally required standards so that there is greater flexibility in configuring structures and preserving open space, while meeting the community’s overall density requirements. Cluster development is a way for residential development to occur while still protecting the environment, preserving open space, offering common land, and safeguarding a community’s local character. In surveying the zoning ordinances in this study, ordinance provisions with titles such as “open space development,” “conservation development,” and “cluster development” were all included under the umbrella of “cluster zoning”.
27
Homes in cluster developments are generally configured on smaller lots that do not meet the community’s traditional lot size, road frontage, and setback requirements. The design of a cluster development may reduce the costs of site development and, from the perspective of the developer, may increase the profitability of individual plots in comparison to traditional subdivisions. However, the housing density, namely the total number of homes that can be built on a given parcel of land, is not necessarily allowed to increase over that which is allowed by the traditional regulations. In fact, a cluster zoning ordinance may simply allow for the same number of homes to be clustered on a portion of the land, so that the other portion remains undeveloped.
Alternatively, a cluster zoning ordinance may provide developers with the opportunity to
earn a density bonus. A density bonus grants a developer additional housing unit density beyond that which is normally permitted, in exchange for more open space, recreational facilities, affordable housing, etc. The word “opportunity” is emphasized here because any particular proposed cluster development may or may not actually meet the density bonus requirements set forth in a community’s zoning ordinance, and the developer may or may not be allowed to build more dwelling units than traditional regulations would permit. The survey data only speak to the issue of whether or not a density bonus opportunity exists. For any given project, a developer must weigh the costs and benefits of a cluster development against those of a traditional subdivision, taking into consideration whether the opportunity for a density bonus even exists and, if so, whether the bonus will actually be granted.
More than three quarters of the surveyed communities (88) allow some type of cluster development. This varies by housing type: 4 77% (88 communities) allow single-family cluster housing 4 61% (70 communities) allow two-family cluster housing 4 54% (62 communities) allow multi-family cluster housing 4 5% (6 communities) restrict one or more types of cluster housing to 55+ developments
Ninety-three percent of the survey population (880,000 people) is in communities that
allow cluster development. Most communities that allow some type of cluster development (single-, two-, and/or multi-family housing) do not require a special exception; only 10 communities do. Interestingly, 4 of these 10 communities waive the special exception requirement for housing developments designated as 55+. Cluster zoning varies by LMA. Two thirds of the population in communities without cluster zoning is located in the Conway, Exeter, and Rochester-Dover LMAs.

28
Survey Area Population in Communities with Cluster Zoning
62,062
7%
880,000
93%
With Cluster Zoning
Without Cluster Zoning
29
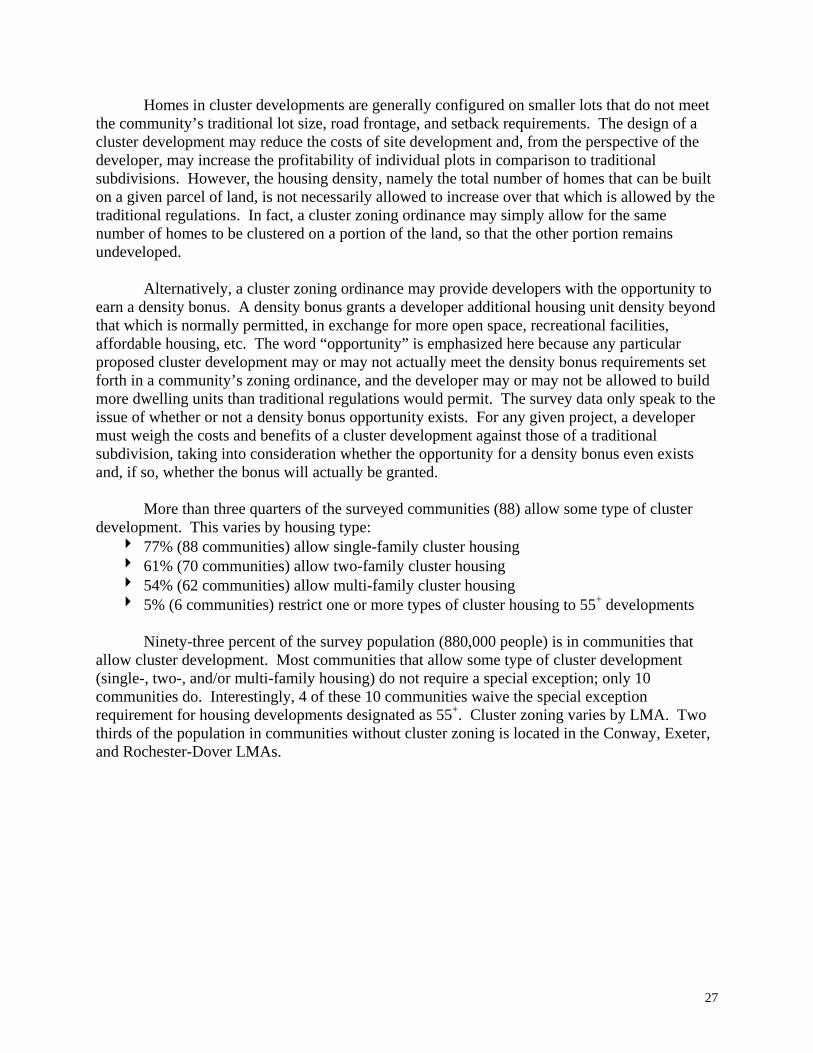
Population in Communities with Cluster Zoning, by LMA18
-
50,000
100,000
150,000
200,000
250,000
300,000
Conco
rd LM
A
Conway
LMA
Exeter
LMA
Keene
LMA
Laco
nia LM
A
Leba
non L
MA
Manch
ester
LMA
Nashu
a LMA
Roche
ster-D
over
LMA
U.S
. Cen
sus
2005
Pop
ulat
ion
Est
imat
es
With Cluster Zoning Without Cluster Zoning
Less than one third (30%) of surveyed communities give an opportunity for a density bonus. Again, this varies by housing type, and this percentage is only slightly higher (39%) when taken as a percent of those communities that allow cluster development: 4 29% (33 communities) offer single-family density bonus 4 25% (28 communities) offer two-family density bonus 4 21% (24 communities) offer multi-family density bonus 4 4% (5 communities) restrict density bonuses to 55+ cluster housing
18 The survey excludes 14 unincorporated places in the Conway LMA and 10 communities in the Keene LMA that are not contiguous to the City of Keene.
30
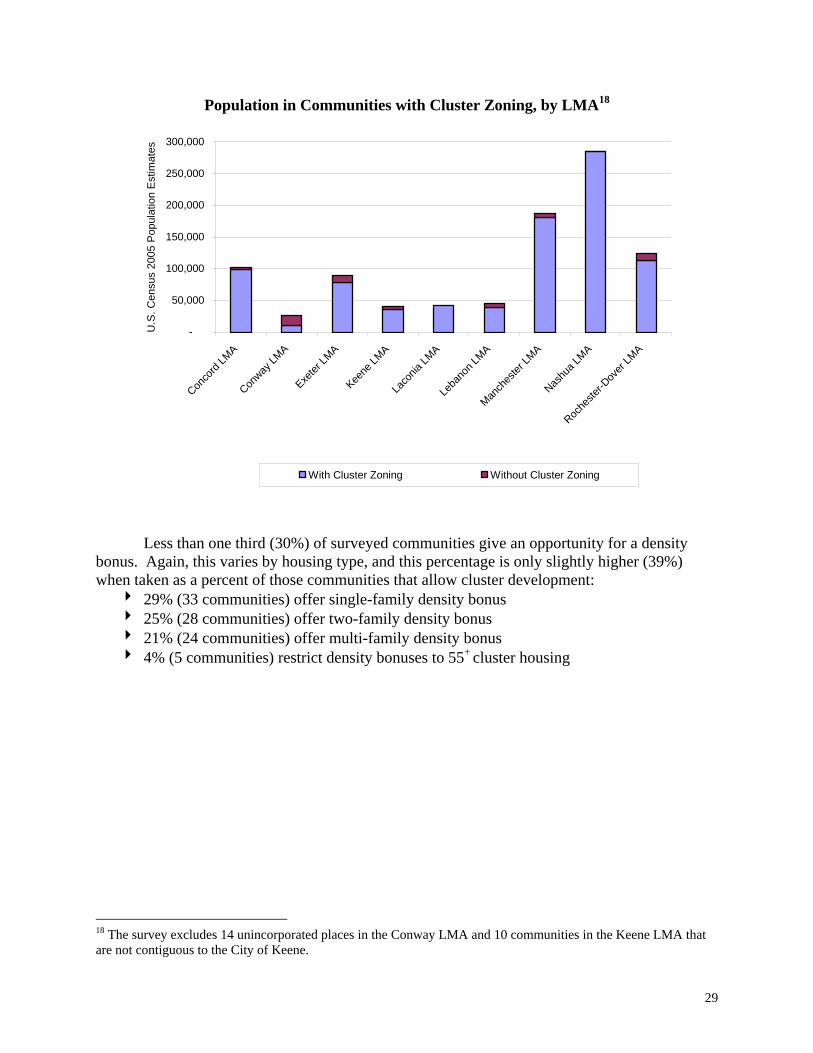
Communities with Cluster Zoning that Give an Opportunity for a Density Bonus, by Housing Type
33 28 24
55
4238
0
10
20
30
40
50
60
70
80
90
100
Single-Family Two-Family Multi-Family
Num
ber o
f Sur
vey
Com
mun
ities
Communities that Offer a Density Bonus Communities that Do Not Offer a Density Bonus
88
70
62
There is considerable variation across LMAs in terms of whether or not communities that allow cluster zoning offer the opportunity for a density bonus. Anywhere from 0% to 56% of an LMA’s communities may offer the opportunity for a density bonus. This range becomes even greater when population is taken into account: anywhere from 0% to 83% of an LMA’s population may live in communities offering the opportunity for a density bonus. This wide variation exists even when the analysis excludes cities in the survey area and simply looks at the remaining towns in each LMA that do or don’t offer density bonuses in the context of cluster zoning.
31
Population in Communities with Density Bonuses, by LMA19
-
50,000
100,000
150,000
200,000
250,000
300,000
Conco
rd LM
A
Conway
LMA
Exeter
LMA
Keene
LMA
Laco
nia LM
A
Leba
non L
MA
Manch
ester
LMA
Nashu
a LMA
Roche
ster-D
over
LMA
U.S
. Cen
sus
2005
Pop
ulat
ion
Est
imat
es
With Density Bonus Without Density Bonus
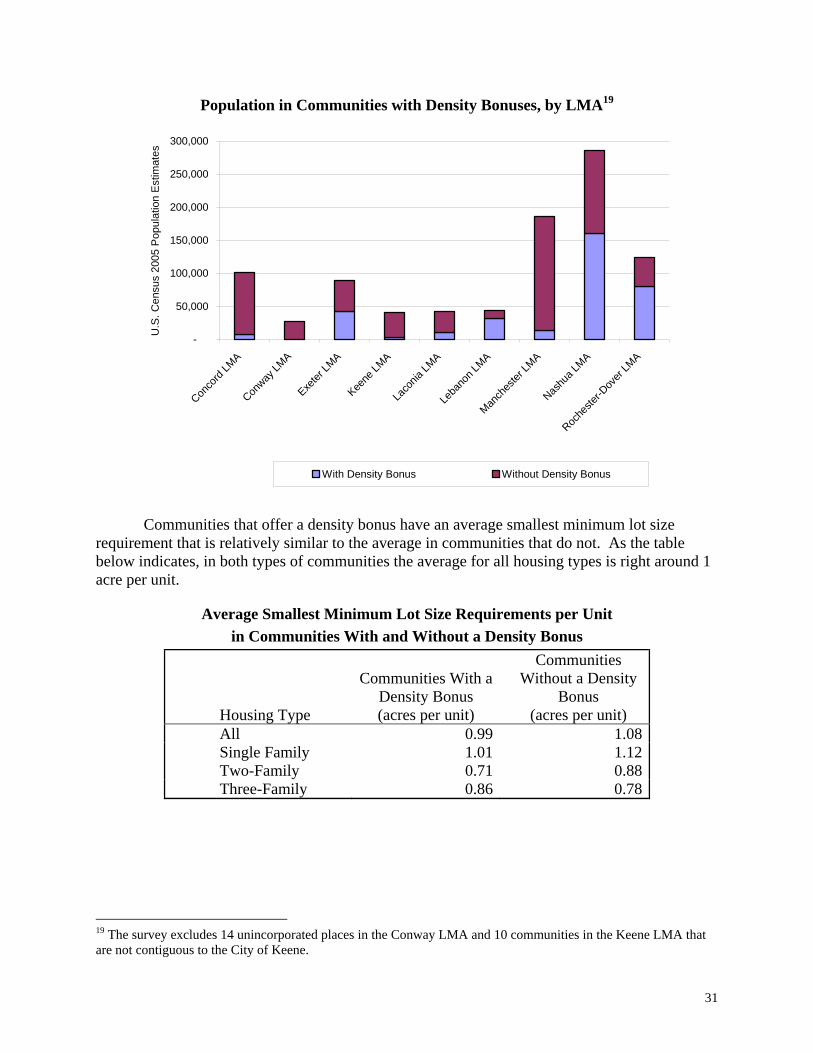
Communities that offer a density bonus have an average smallest minimum lot size
requirement that is relatively similar to the average in communities that do not. As the table below indicates, in both types of communities the average for all housing types is right around 1 acre per unit.
Average Smallest Minimum Lot Size Requirements per Unit in Communities With and Without a Density Bonus
Housing Type
Communities With a Density Bonus (acres per unit)
Communities Without a Density
Bonus (acres per unit)
All 0.99 1.08 Single Family 1.01 1.12 Two-Family 0.71 0.88 Three-Family 0.86 0.78
19 The survey excludes 14 unincorporated places in the Conway LMA and 10 communities in the Keene LMA that are not contiguous to the City of Keene.
32
4. Other Innovative Zoning The survey recorded the existence of four types of “other innovative” zoning provisions available by law to communities as part of the zoning ordinance: transfer of development rights, planned unit development, wetland mitigation, and village plan alternative. Only 19 of the survey communities, or a little more than 15%, offer one or more of these innovative zoning provisions, and planned unit development was the most common of these, offered by 15 survey communities. 5. Growth Management Ordinances (GMOs)
Growth management ordinances (GMOs) regulate and control the timing of development. This can be accomplished using one or both of the following approaches. The first is to impose a cap on the number of building permits a community issues on an annual basis. The second is to impose phasing requirements, or distribution limitations on building permits, such that no one person or entity can be allocated more than a specified percentage or number of building permits per year. In the case of subdivisions, the phasing requirements may be tied to the overall size of the development and may extend over a period of many years.
Pursuant to New Hampshire statutes, communities may adopt a GMO (RSA 674:22), an
interim GMO (RSA 674:23), or simply a building cap or phasing requirement, which is referred to in this study as “other” GMO. A GMO adopted pursuant to RSA 674:22 must be based on a growth management process that balances community development needs and considers regional development needs. In order for a community to adopt such a GMO, it must first adopt a master plan and a capital improvement program. However, if a community does not meet these requirements but finds that there are “unusual circumstances requiring prompt attention,” the law allows it to adopt an interim GMO in accordance with the provisions of RSA 674:23. By law, an interim GMO expires one year after its adoption or earlier if an earlier date is specified in the ordinance or if a GMO pursuant to RSA 674:22 is adopted during the year. This survey recorded information on all three types of GMOs, i.e., “permanent,” interim, and other. This study’s use of the word “permanent” in the context of GMOs is purely for the purpose of contrasting GMOs that have been adopted pursuant to RSA 674:22 to those that have been adopted pursuant to RSA 674:23.
The survey found that 37 communities have some type of GMO: 22 are permanent, 3 are interim, and 12 are other. Furthermore, 20 of these include both building permit caps and phasing requirements, while 8 only include building permit caps and 9 only include phase requirements. Six GMO communities exempt elderly housing development. Almost half (17) of the 37 communities with GMOs do not have expiration dates explicitly set forth in the ordinance, and of the 20 that do, the 3 with interim GMOs are required to do so as part of the interim regulations. The expiration dates for the 20 GMOs range from Town Meeting in 2007 to Town Meeting in 2011.
Less populated survey communities are more likely to have some type of a GMO. This is
evidenced by the fact that nearly one third of surveyed communities have adopted some type of GMO but only about one quarter of the survey population lives in communities with a GMO.

33
Communities and Population by GMO Type
GMO Type
Total Number of
Communities
Communities as % of
Survey Area Population in Communities
Population as % of
Survey Area
Permanent 22 19% 182,250 19%
Interim 3 3% 16,467 2%
Other 12 11% 55,811 6%
Total 37 32% 254,528 27%
New Hampshire’s Office of Energy & Planning (OEP) maintains a list of communities with GMOs (as of 3/14/06), including 14 that are not in the survey area – their population totals 76,163 people. Thus, based on the survey and OEP’s information, it appears that about 25% of the state’s population is located in communities with GMOs.
Survey Area Population in Communities with GMOs
687,534
73%
254,528
27%
With GMO Without GMO
Seventy-three percent of the survey population that lives in communities with some type
of GMO is concentrated in the Concord and Nashua LMAs. In comparison, 41% of the survey population lives in these 2 LMAs.

34
Population in Communities with GMOs, by LMA20
-
50,000
100,000
150,000
200,000
250,000
300,000
Conco
rd LM
A
Conway
LMA
Exeter
LMA
Keene
LMA
Laco
nia LM
A
Leba
non L
MA
Manch
ester
LMA
Nashu
a LMA
Roche
ster-D
over
LMA
U.S
. Cen
sus
2005
Pop
ulat
ion
Est
imat
es
With GMO Without GMO
Growth rates in population, housing units, and jobs have been higher in communities that
have some type of GMO than in communities that do not. Population grew by approximately 8% between 2000 and 2005 in GMO communities, versus 5% in those without; total housing units grew between 2000 and 2005 by roughly 11% in GMO communities, versus 8% in those without; and total jobs grew between the 4th quarter of 2002 and the 4th quarter of 2005 by about 4%, versus 3% in those without.
Growth Rates in GMO versus Non-GMO Communities
Population Growth
2000-2005
Total Housing Unit Growth
2000-2005 Total Job Growth
4th Q 2002 - 4th Q 2005
GMO Communities 8% 11% 4%
non-GMO Communities 5% 8% 3%
The causes and effects of these growth rates in GMO communities warrant further investigation. The GMO enactment dates were only available for 20 of the communities with GMOs, and this survey found that the dates range from March 1992 to September 2006, with 5 of them having been enacted before 2000. For those communities that have had a GMO in place for several years, the GMO could be keeping growth at lower rates than would otherwise be the 20 The survey excludes 14 unincorporated places in the Conway LMA and 10 communities in the Keene LMA that are not contiguous to the City of Keene.

35
case. However, an additional issue to explore beyond the rate of growth in GMO communities is the type of growth, specifically whether or not the new development occurring in GMO communities is affordable. For example, are the phasing requirements in GMOs diminishing the economies of scale in subdivisions? In addition, what role are minimum lot size requirements playing? This study found that survey communities that have some type of a GMO have an average smallest minimum lot size that is larger than communities that do not have a GMO. This is true for single, two-, and three-family dwellings, as well as all housing types combined, for which GMO communities require, on average, nearly one quarter of an acre more per unit than non-GMO communities.
Average Smallest Minimum Lot Size Requirements per Unit in Communities With and Without a GMO
Housing Type
Communities With a GMO (acres)
Communities Without a GMO (acres)
All 1.20 0.98 Single Family 1.28 0.99 Two-Family 1.04 0.72 Three-Family 0.86 0.76
Furthermore, some communities with GMOs do not offer the opportunity for density
bonuses in the context of cluster zoning. Of the 37 communities with GMOs, only 12 offer cluster zoning with some type of density bonus, which means that two-thirds of the population (166,784) that live in GMO communities live in areas that do not offer the opportunity for a density bonus. Eighteen GMO communities allow cluster zoning but do not provide any opportunity for a density bonus, and another 7 do not allow cluster zoning at all. In sum, the phasing requirements, minimum lot size requirements, and density bonus opportunities in GMO communities may shed additional light on the type of growth that is occurring.
GMO Communities with and without a Density Bonus
Count Population
Without a Density Bonus 25 68% 166,784 66%
With a Density Bonus 12 32% 87,744 34%
Total 37 100% 254,528 100% 6. Impact Fees
Impact fees are defined by New Hampshire law (RSA 674:21) as fees or assessments that are imposed on new development to help meet the needs it creates for new or improved capital facilities in the community. Such facilities include, but are not limited to, those related to water, sewer, trash, roads, schools, recreation, and safety. Impact fees are, on the one hand, an important way for growth to pay its “fair share,” but the fees can also be an additional factor that may impede the construction of affordable housing, depending on the size of the fees.

36
Communities that have impact fee ordinances (IFOs) may or may not actually adopt fee schedules and collect the fees. In these cases, even though a community has the authority to collect fees, it chooses not to exercise that authority, and the practical effect is the same as in a community without an IFO: fees are not collected from new development. The survey found that exactly half of the survey communities (57) have impact fee ordinances included in their zoning ordinances. All 57 apply to residential development and follow the requirements of the NH law in terms of including refund provisions, collecting the fees for specified purposes, and not collecting the fees for the community’s general fund.
Of the 57 IFO communities, a little more than half (31) have fee schedules by which they collect fees. Twenty-one of the 31 communities that collect impact fees are located in either the Exeter or Nashua LMAs. By contrast, the Conway and Keene LMAs have no survey communities with IFOs. More than half of the survey area’s estimated population (516,367 people), housing units (206,057 units), and jobs (277,353) in 2005 are located in communities that have IFOs and collect fees, with more than two thirds of these people, homes, and jobs concentrated in either the Manchester or Nashua LMAs.
The survey found that more than one third of communities that have GMOs (14 out of 37) also collect impact fees. It also found that communities that currently collect impact fees had slightly slower rates of growth in housing units between 2004 and 2005 (1.1%) than communities that don’t collect fees (1.4%) and communities that don’t have IFOs (1.7%). This finding does not necessarily mean that there is a cause and effect, but simply a potential correlation.
Communities that Collect Impact Fees
Community
Count Population
(2005) Jobs
(4th Q 2005) Growth in Housing Units
(2004 - 2005)
Collect
Impact Fees Collect
Impact Fees Collect Impact
Fees No IFO
IFO but No Fees
Collect Impact Fees
Concord LMA 4 57,920 45,374 1.9% 1.1% 0.8% Conway LMA 0 0 0 2.1% - - Exeter LMA 11 61,132 22,388 2.3% 1.9% 1.5% Keene LMA 0 0 0 0.7% - - Laconia LMA 0 0 0 2.1% 1.4% - Lebanon LMA 0 0 0 1.5% 1.6% - Manchester LMA 4 161,389 93,311 2.1% 0.9% 0.9% Nashua LMA 10 194,400 93,434 0.7% 1.0% 1.3% Rochester-Dover LMA 2 41,526 22,846 2.7% 1.6% 0.7% Total 31 516,367 277,353 1.7% 1.4% 1.1%

37
IV. Summary This study’s approach was to survey local land use regulations found in zoning ordinances, documenting the frequency and trends of certain regulations that other studies have found impact the development and supply of affordable workforce housing. A total of 114 communities located within 9 of New Hampshire’s 27 Labor Market Areas (LMAs) were selected for the survey. The survey results are considered to be an important first step for any future research that interested parties may undertake, including for example, reviews of other local regulations, including subdivision regulations; reviews of actual practices; and comparisons of model projects under different ordinances. The survey results and analyses reveal that there is considerable variation in regulations among communities and across LMAs.
For each community, the survey looked at the minimum lot sizes required in each zoning district for single family, two family, and multi-family dwelling units. The survey found that in slightly more than half of the survey communities, the smallest lot size on which a single-family home could be built is a minimum of at least 1 acre but less than 3 acres. However, 41% of the survey communities have at least one zoning district where the smallest lot size on which a single-family home could be built is under 1 acre, given the minimum requirements. More than half of the survey communities have at least one zoning district where the smallest minimum lot size required for a two- or three-family home is under 1 acre per unit. Thus, a considerable number of communities do have minimum lot size requirements that could be considered “small,” namely under 1 acre per unit, but “larger” minimum lot size requirements, namely above 1 acre per unit, are common as well. The study results also revealed that more than three quarters of the surveyed communities allow some type of cluster development (including open space and/or conservation development), but less than one third give an opportunity for a density bonus. Just over 15% of the survey communities offer one or more of four other innovative zoning provisions (transfer of development rights, planned unit development, wetland mitigation, and village plan alternative) which are available by law to communities as part of the zoning ordinance. One third of communities have some type of Growth Management Ordinance (GMO), and of those almost half do not have expiration dates explicitly set forth in the ordinance. Survey communities that have some type of a GMO have an average smallest minimum lot size that is larger than communities that do not have a GMO, and two thirds of GMO communities do not offer any type of density bonus. Furthermore, less than one third of survey communities have Impact Fee Ordinances (IFOs) and actually collect fees. Finally, a small percentage of communities relax their standards and/or waive requirements when the new development is intended for people who are 55 years old or older.

38
Appendix 1 Survey Questions
GENERAL
1. Has the municipality adopted a zoning ordinance? 2. If yes, has a copy of the current zoning ordinance been obtained? 3. If yes, was a copy of the current zoning ordinance obtained from the Web? 4. If no, was it because the zoning ordinance on the Web was outdated, or because the
municipality doesn’t post ordinances on the Web? 5. Has the municipality adopted a Growth Management Ordinance (GMO)? 6. If yes, has a copy of the current GMO been obtained? 7. Has the municipality adopted an Impact Fee Ordinance (IFO)? 8. If yes, has a copy of the current IFO been obtained? 9. If the municipality has an IFO, does it actually collect fees? 10. If yes, has a copy of the current IFO schedule been obtained? 11. Has the status of all documents obtained been verified with the municipality?
CLUSTER ZONING 12. Does this municipality permit cluster zoning of single family housing units? 13. If yes, is cluster zoning of single family housing units only allowed for those 55 years old
and over? 14. Is a special exception required for cluster zoning of single family housing units? 15. If yes, is a special exception required for cluster zoning of single family housing units for
those 55 years old and over? 16. Does the municipality offer a density bonus for cluster zoning of single family housing units? 17. If yes, does the density bonus for cluster zoning of single family housing units apply only to
those 55 years old and over? 18. Does this municipality permit cluster zoning of two family housing units? 19. If yes, is cluster zoning of two family housing units only allowed for those 55 years old and
over? 20. Is a special exception required for cluster zoning of two family housing units? 21. If yes, is a special exception required for cluster zoning of two family housing units for those
55 years old and over? 22. Does the municipality offer a density bonus for cluster zoning of two family housing units? 23. If yes, does the density bonus for cluster zoning of two family housing units apply only to
those 55 years old and over? 24. Does this municipality permit cluster zoning of multi-family housing units? 25. If yes, is cluster zoning of multi-family housing units only allowed for those 55 years old and
over? 26. Is a special exception required for cluster zoning of multi-family housing units? 27. If yes, is a special exception required for cluster zoning of multi-family housing units for
those 55 years old and over? 28. Does the municipality offer a density bonus for cluster zoning of multi-family housing units? 29. If yes, does the density bonus for cluster zoning of multi-family housing units apply only to
those 55 years old and over?
39
OTHER INNOVATIVE ZONING 30. Is transfer of development rights in the zoning ordinance? 31. Is planned unit development in the zoning ordinance? 32. Is wetland mitigation in the zoning ordinance? 33. Is Village Plan Alternative in the zoning ordinance? 34. Are there any other innovative zoning ordinances? 35. If yes, describe them.
MINIMUM LOT SIZE REQUIREMENTS 36. What are the names of all the zoning districts in the municipality that allow single family
dwelling units? 37. What are the names of all the zoning districts in the municipality that allow two family
dwelling units? 38. What are the names of all the zoning districts in the municipality that allow multi-family
dwelling units? 39. For each list of answers to the three questions above, list the following information, if
applicable, as it relates to single family, two family, and/or multi-family dwelling units: a. Are full municipal utilities provided (i.e., yes, no, or not applicable)? b. For single family and two family dwelling units, what is the flat minimum lot
size? c. For multi-family dwelling units, what is the base minimum lot size for a specified
number of dwelling units (e.g., 3, 4, etc.)? d. For multi-family dwelling units where the minimum lot size per additional unit is
the same for each unit greater than 3 dwelling units, what is the per-additional-unit minimum lot size?
e. For three-family dwelling units restricted to persons 55 years old and over, what is the base minimum lot size if it is different from the non-55 years old and over minimum lot size?
f. For single family, two family, multi-family, and 55 years old and over multi-family dwelling units, is a special exception required?
40. What is the name of the zoning district that appears to be the municipality’s “principal” residential zoning district for single family homes?
41. What is the front setback requirement for lots in the principal residential zoning district for single family homes?
42. From what point is the front setback measured in the principal residential zoning district for single family homes?
43. What is the side setback requirement for lots in the principal residential zoning district for single family homes?
44. What is the rear setback requirement for lots in the principal residential zoning district for single family homes?
45. What is the minimum road frontage requirement for lots in the principal residential zoning district for single family homes?
40
ACCESSORY DWELLING UNITS
46. Are accessory dwelling units allowed in the principal residential zoning district for single family homes?
47. If yes, are accessory dwellings restricted to relatives of the homeowner only? 48. If the answer to the previous question is “no,” are there any restrictions that prevent renting
accessory dwelling units to third parties?
GROWTH MANAGEMENT ORDINANCES 49. Is the GMO interim, permanent or other? 50. What date was the GMO enacted? 51. Does the GMO have an expiration date? 52. If yes, what is the GMO expiration date? 53. If the municipality has a permanent GMO, are there any provisions to reassess the need for a
GMO prior to expiration? 54. If yes, briefly describe the reassessment provisions for the permanent GMO. 55. Does the GMO include a cap on the number of building permits? 56. If yes, briefly describe the building permit cap. 57. If yes, is the maximum building permit cap at the discretion of the Planning Board? 58. Does the GMO include a phasing requirement? 59. If yes, briefly describe the phasing requirement. 60. If yes, is the phasing requirement at the discretion of the Planning Board? 61. To what types of property does the GMO apply: Residential? Commercial? Subdivisions?
Other? (Describe) 62. Are there exceptions in the GMO for low- or moderate-income housing? 63. If yes, briefly describe. 64. Are there any other residential exceptions in the GMO? 65. If yes, briefly describe.
IMPACT FEE ORDINANCES 66. Does the IFO apply to residential property? 67. Are impact fees collected for a specified purpose? 68. Are impact fees refundable after a certain date or event? 69. Are impact fees collected for the general fund?

41
Appendix 2 Key Survey Assumptions and Approaches
In order to complete the survey for each community in a way that would yield
meaningful results on local land use regulations, it was necessary to make certain simplifying assumptions and to streamline reporting of certain types of data. Below is a summary of key assumptions and approaches that were employed when each target community was surveyed.21 Materials Reviewed: To answer survey questions, only zoning ordinances were reviewed, as opposed to subdivision or site plan regulations. Age-Restricted Housing: For the purposes of this study, age-restricted housing means housing intended for people who are at least 55 years old, including housing that requires residents to be at least 62 years old. Frontage Requirements: The minimum road frontage requirements recorded in the survey are for just one of a community’s single-family residential districts. The researcher was required to exercise educated judgment in choosing this district, and typically tried to choose one that appeared to be generally reflective of the community’s character. Furthermore, the minimum road frontage requirements recorded in the survey are for typical situations and do not reflect exceptions such as those made for cul-de-sacs or lots that are provided access to a public road by a deeded private right-of-way. Setback Requirements: Again, the minimum setback requirements recorded in the survey are for just one of a community’s single-family residential districts. The researcher was required to exercise judgment in choosing this district, and typically tried to choose one that appeared to be generally reflective of the community’s character. Furthermore, community zoning ordinances differ in terms of whether front setback requirements are measured from the front lot line / edge of the right-of-way or the center line of the right-of-way. In some cases, ordinances do not specify. Regardless, the requirement set forth in the ordinance was recorded in the survey, along with the point of reference (e.g., lot line) if it was specified. The minimum front setback requirements recorded in the survey are for typical situations and do not reflect exceptions such as those made for properties located on major highways. Accessory Dwelling Units: An accessory dwelling unit is a second living unit that is typically located in the same structure as a single family residence, but by law (RSA 674:21) can also be a detached dwelling unit located on the same lot as the principal dwelling unit. Accessory dwelling units that are permitted by conditional use or special exception, or permitted subject to certain conditions spelled out in the ordinance, were considered to be permitted. If a zoning ordinance was silent on the issue of accessory dwelling units, such units were assumed not to be permitted.
21 This is not intended to be an exhaustive and comprehensive summary of every assumption necessary to complete the 114 surveys.
42
Cluster Zoning: Cluster zoning relaxes dimensional standards for lots, so there is greater flexibility in configuring structures and preserving open space, while meeting the community’s overall density requirements. In surveying the zoning ordinances, provisions with titles such as “open space development,” “conservation development,” and “cluster development” were all included under the umbrella of “cluster zoning.” Density Bonuses: Density bonuses grant developers additional housing unit density beyond that which is normally permitted, in exchange for more open space, recreational facilities, affordable housing, etc., in the context of cluster zoning. The existence of a density bonus was recorded in the survey in cases where the ordinance appeared to provide the opportunity to build more dwelling units on a parcel of land than traditional development regulations would permit. The survey data does not speak to the issue of whether or not a density bonus would be available on a case by case basis. Growth Management Ordinances (GMOs): GMOs impose caps on building permits and/or phasing requirements per New Hampshire RSA 674:22 (permanent), RSA 674:23 (interim), or other statutory authority. The survey records detailed information on all three types of GMOs: permanent, interim, and other. Phase requirements that were recorded in the survey include distribution limitations on building permits, for example when a person or entity cannot be allocated more than a specified percentage or number of building permits per calendar year. Minimum Lot Sizes – General: Community zoning ordinances differ in terms of whether their stated minimum lot sizes are expressed in total land area or some portion of that area, sometimes referred to using terms such as “useable area,” “buildable area,” “contiguous dry lot,” or “upland”. These terms reflect the exclusion of one or more types of land from the total area, including but not necessarily limited to: slopes of varying degrees; waterways; wetlands; floodplains; poorly drained soils; and land within highway or utility rights of way. The survey records minimum lot sizes as set forth in each ordinance, regardless of the type of land area and regardless of any additional conditions or requirements that may dictate the location and / or footprint of a building on the lot. Some communities have different minimum lot size requirements depending on whether or not the dwelling will use municipal sewer and/or water when those services are offered. In the survey, a “yes” to “full municipal utilities” means that the dwelling will use all of the municipal utilities that are offered (whether the community offers both sewer and water or just one of these services) and a “no” means that none of the offered services will be used. The survey did not record lot size requirements for those circumstances in which the community offers both sewer and water but the dwelling unit will only use one of those services. Minimum Lot Sizes – Multi-Family Housing: The type and extent of information related to the minimum lot size requirements for multi-family housing (defined as 3 or more dwelling units) varies significantly across zoning ordinances. Consequently, the database contains a mix of types of minimum lot sizes, as well as blanks where minimum lot sizes could not be determined.
43
For example, some ordinances set forth the minimum tract size of land required to build a multi-family housing project, but do not specify the minimum amount of land required per dwelling unit or the maximum number of dwelling units allowed on a given amount of land. In these cases, the minimum tract size was recorded in the survey as being the minimum lot size required for 3 dwelling units, and the minimum lot size per each additional unit was left blank. As another example, some communities vary the minimum lot size per dwelling unit based on the number of bedrooms in each unit within the multi-family development. Data recorded in the survey only captures the requirements for two-bedroom units. As yet another example, some ordinances only allow multi-family housing if it is a conversion from some other type of housing or use. This was recorded in the survey as allowing multi-family housing, and the minimum lot size requirements for a conversion were recorded if provided. In cases where an ordinance set forth different minimum lot size requirements for a conversion versus a newly constructed multi-family project, the survey only captured the requirements for new construction. A final example is when multi-family housing is only permitted by a special exception or is subject to regulations that are not set forth in the zoning ordinance. In these cases, information in the ordinance related to the minimum lot size requirements tended to be limited, and data on the minimum lot size requirements could not be entered for the survey. Minimum Lot Sizes – Age-Restricted Housing: In community districts that have different minimum lot size requirements for age-restricted housing versus non-age-restricted housing, the survey recorded the requirements for a 3-unit building, with the intent of comparing the requirements to those for non-age-restricted 3-unit buildings. The same challenges noted above for multi-family minimum lot size requirements also apply to minimum lot size requirements for age-restricted housing.
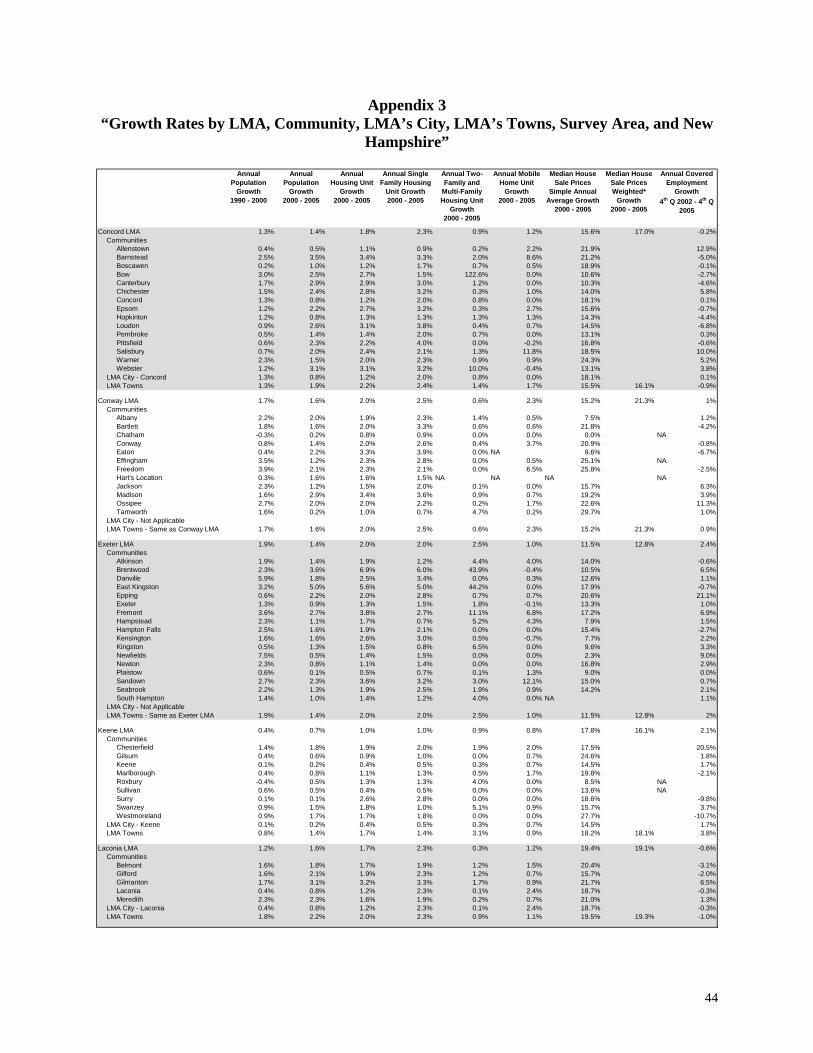
44
Appendix 3 “Growth Rates by LMA, Community, LMA’s City, LMA’s Towns, Survey Area, and New
Hampshire”
Annual Population
Growth1990 - 2000
Annual Population
Growth2000 - 2005
Annual Housing Unit
Growth2000 - 2005
Annual Single Family Housing
Unit Growth2000 - 2005
Annual Two-Family and
Multi-Family Housing Unit
Growth2000 - 2005
Annual Mobile Home Unit
Growth2000 - 2005
Median House Sale Prices
Simple Annual Average Growth
2000 - 2005
Median House Sale Prices Weighted*
Growth2000 - 2005
Annual Covered Employment
Growth4th Q 2002 - 4th Q
2005
Concord LMA 1.3% 1.4% 1.8% 2.3% 0.9% 1.2% 15.6% 17.0% -0.2%Communities
Allenstown 0.4% 0.5% 1.1% 0.9% 0.2% 2.2% 21.9% 12.9%Barnstead 2.5% 3.5% 3.4% 3.3% 2.0% 8.6% 21.2% -5.0%Boscawen 0.2% 1.0% 1.2% 1.7% 0.7% 0.5% 18.9% -0.1%Bow 3.0% 2.5% 2.7% 1.5% 122.6% 0.0% 10.6% -2.7%Canterbury 1.7% 2.9% 2.9% 3.0% 1.2% 0.0% 10.3% -4.6%Chichester 1.5% 2.4% 2.8% 3.2% 0.3% 1.0% 14.0% 5.8%Concord 1.3% 0.8% 1.2% 2.0% 0.8% 0.0% 18.1% 0.1%Epsom 1.2% 2.2% 2.7% 3.2% 0.3% 2.7% 15.6% -0.7%Hopkinton 1.2% 0.8% 1.3% 1.3% 1.3% 1.3% 14.3% -4.4%Loudon 0.9% 2.6% 3.1% 3.8% 0.4% 0.7% 14.5% -6.8%Pembroke 0.5% 1.4% 1.4% 2.0% 0.7% 0.0% 13.1% 0.3%Pittsfield 0.6% 2.3% 2.2% 4.0% 0.0% -0.2% 16.8% -0.6%Salisbury 0.7% 2.0% 2.4% 2.1% 1.3% 11.8% 18.5% 10.0%Warner 2.3% 1.5% 2.0% 2.3% 0.9% 0.9% 24.3% 5.2%Webster 1.2% 3.1% 3.1% 3.2% 10.0% -0.4% 13.1% 3.8%
LMA City - Concord 1.3% 0.8% 1.2% 2.0% 0.8% 0.0% 18.1% 0.1%LMA Towns 1.3% 1.9% 2.2% 2.4% 1.4% 1.7% 15.5% 16.1% -0.9%
Conway LMA 1.7% 1.6% 2.0% 2.5% 0.6% 2.3% 15.2% 21.3% 1%Communities
Albany 2.2% 2.0% 1.9% 2.3% 1.4% 0.5% 7.5% 1.2%Bartlett 1.8% 1.6% 2.0% 3.3% 0.6% 0.6% 21.8% -4.2%Chatham -0.3% 0.2% 0.8% 0.9% 0.0% 0.0% 0.0% NAConway 0.8% 1.4% 2.0% 2.6% 0.4% 3.7% 20.9% -0.8%Eaton 0.4% 2.2% 3.3% 3.9% 0.0% NA 9.6% -6.7%Effingham 3.5% 1.2% 2.3% 2.8% 0.0% 0.5% 25.1% NAFreedom 3.9% 2.1% 2.3% 2.1% 0.0% 6.5% 25.8% -2.5%Hart's Location 0.3% 1.6% 1.6% 1.5% NA NA NA NAJackson 2.3% 1.2% 1.5% 2.0% 0.1% 0.0% 15.7% 6.3%Madison 1.6% 2.9% 3.4% 3.6% 0.9% 0.7% 19.2% 3.9%Ossipee 2.7% 2.0% 2.0% 2.2% 0.2% 1.7% 22.6% 11.3%Tamworth 1.6% 0.2% 1.0% 0.7% 4.7% 0.2% 29.7% 1.0%
LMA City - Not Applicable LMA Towns - Same as Conway LMA 1.7% 1.6% 2.0% 2.5% 0.6% 2.3% 15.2% 21.3% 0.9%
Exeter LMA 1.9% 1.4% 2.0% 2.0% 2.5% 1.0% 11.5% 12.8% 2.4%Communities
Atkinson 1.9% 1.4% 1.9% 1.2% 4.4% 4.0% 14.0% -0.6%Brentwood 2.3% 3.6% 6.9% 6.0% 43.9% -0.4% 10.5% 6.5%Danville 5.9% 1.8% 2.5% 3.4% 0.0% 0.3% 12.6% 1.1%East Kingston 3.2% 5.0% 5.6% 5.0% 44.2% 0.0% 17.9% -0.7%Epping 0.6% 2.2% 2.0% 2.8% 0.7% 0.7% 20.6% 21.1%Exeter 1.3% 0.9% 1.3% 1.5% 1.8% -0.1% 13.3% 1.0%Fremont 3.6% 2.7% 3.8% 2.7% 11.1% 6.8% 17.2% 6.9%Hampstead 2.3% 1.1% 1.7% 0.7% 5.2% 4.3% 7.9% 1.5%Hampton Falls 2.5% 1.6% 1.9% 2.1% 0.0% 0.0% 15.4% -2.7%Kensington 1.6% 1.6% 2.6% 3.0% 0.5% -0.7% 7.7% 2.2%Kingston 0.5% 1.3% 1.5% 0.8% 6.5% 0.0% 9.6% 3.3%Newfields 7.5% 0.5% 1.4% 1.5% 0.0% 0.0% 2.3% 9.0%Newton 2.3% 0.8% 1.1% 1.4% 0.0% 0.0% 16.8% 2.9%Plaistow 0.6% 0.1% 0.5% 0.7% 0.1% 1.3% 9.0% 0.0%Sandown 2.7% 2.3% 3.6% 3.2% 3.0% 12.1% 15.0% 0.7%Seabrook 2.2% 1.3% 1.9% 2.5% 1.9% 0.9% 14.2% 2.1%South Hampton 1.4% 1.0% 1.4% 1.2% 4.0% 0.0% NA 1.1%
LMA City - Not Applicable LMA Towns - Same as Exeter LMA 1.9% 1.4% 2.0% 2.0% 2.5% 1.0% 11.5% 12.8% 2%
Keene LMA 0.4% 0.7% 1.0% 1.0% 0.9% 0.8% 17.8% 16.1% 2.1%Communities
Chesterfield 1.4% 1.8% 1.9% 2.0% 1.9% 2.0% 17.5% 20.5%Gilsum 0.4% 0.6% 0.9% 1.0% 0.0% 0.7% 24.6% 1.8%Keene 0.1% 0.2% 0.4% 0.5% 0.3% 0.7% 14.5% 1.7%Marlborough 0.4% 0.8% 1.1% 1.3% 0.5% 1.7% 19.8% -2.1%Roxbury -0.4% 0.5% 1.3% 1.3% 4.0% 0.0% 8.5% NASullivan 0.6% 0.5% 0.4% 0.5% 0.0% 0.0% 13.6% NASurry 0.1% 0.1% 2.6% 2.8% 0.0% 0.0% 18.6% -9.8%Swanzey 0.9% 1.5% 1.8% 1.0% 5.1% 0.9% 15.7% 3.7%Westmoreland 0.9% 1.7% 1.7% 1.8% 0.0% 0.0% 27.7% -10.7%
LMA City - Keene 0.1% 0.2% 0.4% 0.5% 0.3% 0.7% 14.5% 1.7%LMA Towns 0.8% 1.4% 1.7% 1.4% 3.1% 0.9% 18.2% 18.1% 3.8%
Laconia LMA 1.2% 1.6% 1.7% 2.3% 0.3% 1.2% 19.4% 19.1% -0.6%Communities
Belmont 1.6% 1.8% 1.7% 1.9% 1.2% 1.5% 20.4% -3.1%Gilford 1.6% 2.1% 1.9% 2.3% 1.2% 0.7% 15.7% -2.0%Gilmanton 1.7% 3.1% 3.2% 3.3% 1.7% 0.9% 21.7% 6.5%Laconia 0.4% 0.8% 1.2% 2.3% 0.1% 2.4% 18.7% -0.3%Meredith 2.3% 2.3% 1.6% 1.9% 0.2% 0.7% 21.0% 1.3%
LMA City - Laconia 0.4% 0.8% 1.2% 2.3% 0.1% 2.4% 18.7% -0.3%LMA Towns 1.8% 2.2% 2.0% 2.3% 0.9% 1.1% 19.5% 19.3% -1.0%
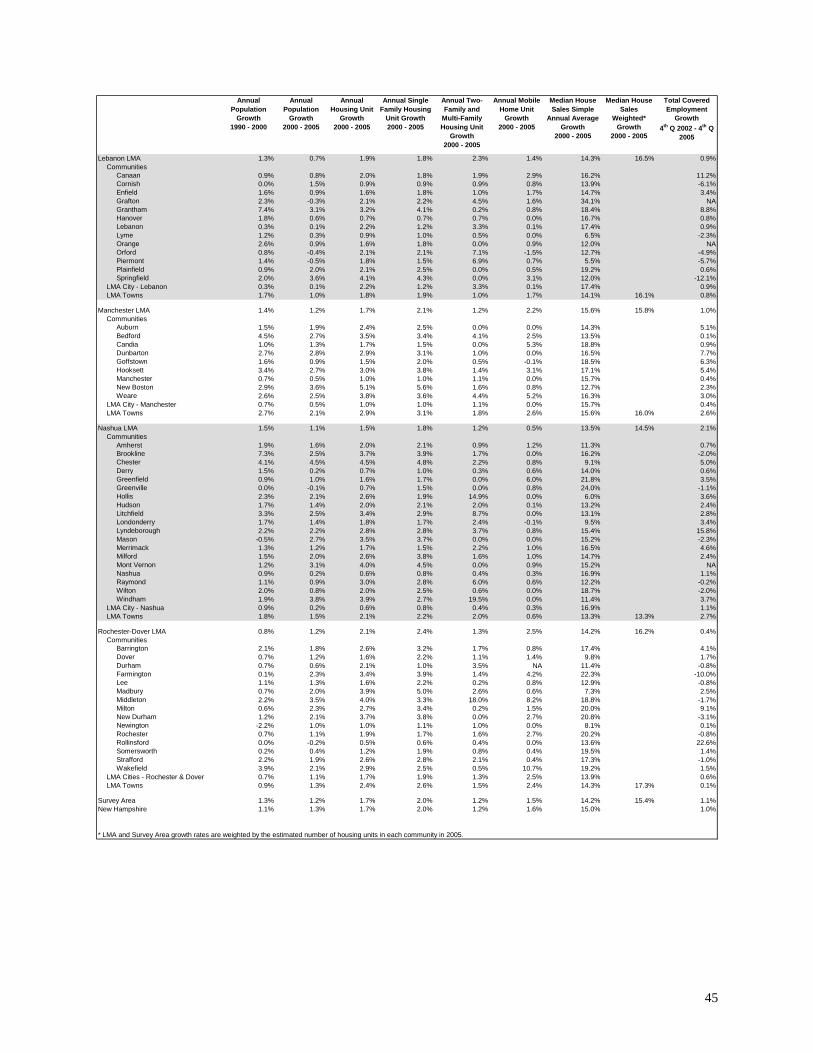
45
Annual Population
Growth1990 - 2000
Annual Population
Growth2000 - 2005
Annual Housing Unit
Growth2000 - 2005
Annual Single Family Housing
Unit Growth2000 - 2005
Annual Two-Family and
Multi-Family Housing Unit
Growth2000 - 2005
Annual Mobile Home Unit
Growth2000 - 2005
Median House Sales Simple
Annual Average Growth
2000 - 2005
Median House Sales
Weighted* Growth
2000 - 2005
Total Covered Employment
Growth4th Q 2002 - 4th Q
2005
Lebanon LMA 1.3% 0.7% 1.9% 1.8% 2.3% 1.4% 14.3% 16.5% 0.9%Communities
Canaan 0.9% 0.8% 2.0% 1.8% 1.9% 2.9% 16.2% 11.2%Cornish 0.0% 1.5% 0.9% 0.9% 0.9% 0.8% 13.9% -6.1%Enfield 1.6% 0.9% 1.6% 1.8% 1.0% 1.7% 14.7% 3.4%Grafton 2.3% -0.3% 2.1% 2.2% 4.5% 1.6% 34.1% NAGrantham 7.4% 3.1% 3.2% 4.1% 0.2% 0.8% 18.4% 8.8%Hanover 1.8% 0.6% 0.7% 0.7% 0.7% 0.0% 16.7% 0.8%Lebanon 0.3% 0.1% 2.2% 1.2% 3.3% 0.1% 17.4% 0.9%Lyme 1.2% 0.3% 0.9% 1.0% 0.5% 0.0% 6.5% -2.3%Orange 2.6% 0.9% 1.6% 1.8% 0.0% 0.9% 12.0% NAOrford 0.8% -0.4% 2.1% 2.1% 7.1% -1.5% 12.7% -4.9%Piermont 1.4% -0.5% 1.8% 1.5% 6.9% 0.7% 5.5% -5.7%Plainfield 0.9% 2.0% 2.1% 2.5% 0.0% 0.5% 19.2% 0.6%Springfield 2.0% 3.6% 4.1% 4.3% 0.0% 3.1% 12.0% -12.1%
LMA City - Lebanon 0.3% 0.1% 2.2% 1.2% 3.3% 0.1% 17.4% 0.9%LMA Towns 1.7% 1.0% 1.8% 1.9% 1.0% 1.7% 14.1% 16.1% 0.8%
Manchester LMA 1.4% 1.2% 1.7% 2.1% 1.2% 2.2% 15.6% 15.8% 1.0%Communities
Auburn 1.5% 1.9% 2.4% 2.5% 0.0% 0.0% 14.3% 5.1%Bedford 4.5% 2.7% 3.5% 3.4% 4.1% 2.5% 13.5% 0.1%Candia 1.0% 1.3% 1.7% 1.5% 0.0% 5.3% 18.8% 0.9%Dunbarton 2.7% 2.8% 2.9% 3.1% 1.0% 0.0% 16.5% 7.7%Goffstown 1.6% 0.9% 1.5% 2.0% 0.5% -0.1% 18.5% 6.3%Hooksett 3.4% 2.7% 3.0% 3.8% 1.4% 3.1% 17.1% 5.4%Manchester 0.7% 0.5% 1.0% 1.0% 1.1% 0.0% 15.7% 0.4%New Boston 2.9% 3.6% 5.1% 5.6% 1.6% 0.8% 12.7% 2.3%Weare 2.6% 2.5% 3.8% 3.6% 4.4% 5.2% 16.3% 3.0%
LMA City - Manchester 0.7% 0.5% 1.0% 1.0% 1.1% 0.0% 15.7% 0.4%LMA Towns 2.7% 2.1% 2.9% 3.1% 1.8% 2.6% 15.6% 16.0% 2.6%
Nashua LMA 1.5% 1.1% 1.5% 1.8% 1.2% 0.5% 13.5% 14.5% 2.1%Communities
Amherst 1.9% 1.6% 2.0% 2.1% 0.9% 1.2% 11.3% 0.7%Brookline 7.3% 2.5% 3.7% 3.9% 1.7% 0.0% 16.2% -2.0%Chester 4.1% 4.5% 4.5% 4.8% 2.2% 0.8% 9.1% 5.0%Derry 1.5% 0.2% 0.7% 1.0% 0.3% 0.6% 14.0% 0.6%Greenfield 0.9% 1.0% 1.6% 1.7% 0.0% 6.0% 21.8% 3.5%Greenville 0.0% -0.1% 0.7% 1.5% 0.0% 0.8% 24.0% -1.1%Hollis 2.3% 2.1% 2.6% 1.9% 14.9% 0.0% 6.0% 3.6%Hudson 1.7% 1.4% 2.0% 2.1% 2.0% 0.1% 13.2% 2.4%Litchfield 3.3% 2.5% 3.4% 2.9% 8.7% 0.0% 13.1% 2.8%Londonderry 1.7% 1.4% 1.8% 1.7% 2.4% -0.1% 9.5% 3.4%Lyndeborough 2.2% 2.2% 2.8% 2.8% 3.7% 0.8% 15.4% 15.8%Mason -0.5% 2.7% 3.5% 3.7% 0.0% 0.0% 15.2% -2.3%Merrimack 1.3% 1.2% 1.7% 1.5% 2.2% 1.0% 16.5% 4.6%Milford 1.5% 2.0% 2.6% 3.8% 1.6% 1.0% 14.7% 2.4%Mont Vernon 1.2% 3.1% 4.0% 4.5% 0.0% 0.9% 15.2% NANashua 0.9% 0.2% 0.6% 0.8% 0.4% 0.3% 16.9% 1.1%Raymond 1.1% 0.9% 3.0% 2.8% 6.0% 0.6% 12.2% -0.2%Wilton 2.0% 0.8% 2.0% 2.5% 0.6% 0.0% 18.7% -2.0%Windham 1.9% 3.8% 3.9% 2.7% 19.5% 0.0% 11.4% 3.7%
LMA City - Nashua 0.9% 0.2% 0.6% 0.8% 0.4% 0.3% 16.9% 1.1%LMA Towns 1.8% 1.5% 2.1% 2.2% 2.0% 0.6% 13.3% 13.3% 2.7%
Rochester-Dover LMA 0.8% 1.2% 2.1% 2.4% 1.3% 2.5% 14.2% 16.2% 0.4%Communities
Barrington 2.1% 1.8% 2.6% 3.2% 1.7% 0.8% 17.4% 4.1%Dover 0.7% 1.2% 1.6% 2.2% 1.1% 1.4% 9.8% 1.7%Durham 0.7% 0.6% 2.1% 1.0% 3.5% NA 11.4% -0.8%Farmington 0.1% 2.3% 3.4% 3.9% 1.4% 4.2% 22.3% -10.0%Lee 1.1% 1.3% 1.6% 2.2% 0.2% 0.8% 12.9% -0.8%Madbury 0.7% 2.0% 3.9% 5.0% 2.6% 0.6% 7.3% 2.5%Middleton 2.2% 3.5% 4.0% 3.3% 18.0% 8.2% 18.8% -1.7%Milton 0.6% 2.3% 2.7% 3.4% 0.2% 1.5% 20.0% 9.1%New Durham 1.2% 2.1% 3.7% 3.8% 0.0% 2.7% 20.8% -3.1%Newington -2.2% 1.0% 1.0% 1.1% 1.0% 0.0% 8.1% 0.1%Rochester 0.7% 1.1% 1.9% 1.7% 1.6% 2.7% 20.2% -0.8%Rollinsford 0.0% -0.2% 0.5% 0.6% 0.4% 0.0% 13.6% 22.6%Somersworth 0.2% 0.4% 1.2% 1.9% 0.8% 0.4% 19.5% 1.4%Strafford 2.2% 1.9% 2.6% 2.8% 2.1% 0.4% 17.3% -1.0%Wakefield 3.9% 2.1% 2.9% 2.5% 0.5% 10.7% 19.2% 1.5%
LMA Cities - Rochester & Dover 0.7% 1.1% 1.7% 1.9% 1.3% 2.5% 13.9% 0.6%LMA Towns 0.9% 1.3% 2.4% 2.6% 1.5% 2.4% 14.3% 17.3% 0.1%
Survey Area 1.3% 1.2% 1.7% 2.0% 1.2% 1.5% 14.2% 15.4% 1.1%New Hampshire 1.1% 1.3% 1.7% 2.0% 1.2% 1.6% 15.0% 1.0%
* LMA and Survey Area growth rates are weighted by the estimated number of housing units in each community in 2005.
46
Appendix 4 Bibliography
Alicia Sasser, Bo Zhao & Darcy Rollins (Overview by Robert Tannenwald), "The Lack of Affordable Housing in New England: How Big a Problem? Why Is It Growing? What Are We Doing About It?," New England Public Policy Center at the Federal Reserve Bank of Boston, Working Paper 06-1 Bob Sanders, "As Housing Market Cools, Foreclosure Rate Rises," New Hampshire Business Review, September 1, 2006 Center for Business & Economic Research, "Economic Impacts of The New Hampshire Housing Finance Authority Mortgage Revenue Bond Programs - Preliminary Assessment Report," August 1999 "Commute Costs Hurt Low-Income Families," USA Today, Moneyline, October 12, 2006 David Frydman, "Presentation to the Committee to Study Affordable Housing in NH," September 11, 2006 “Economic Conditions in New Hampshire, March 2005,” New Hampshire Economic and Labor Market Information Bureau, Volume 5, Number 03. Edward Glaeser, "The Economic Impact of Restricting Housing Supply," Rappaport Institute for Greater Boston, Policy Briefs, PB-2006-3, May 2006 Edward Glaeser, Jenney Schuetz & Bryce Ward, "Regulation and the Rise of Housing Prices in Greater Boston," Cambridge: Rappaport Institute for Greater Boston, Harvard University, and Boston: Pioneer Institute for Public Policy Research, January 5, 2006 Frank Nitkiewicz, "Interest Rates, Housing and the Economy; An Update," Federal Home Loan Bank Boston, Agency Revenue Briefing before the Senate Ways & Means Committee, October 19, 2006 Jerry Miller, “Economist Warns NH Could Lose its Economic Advantage,” Union Leader, May 3, 2006. Karen Spiller, “Business Leaders Gather to Focus on Region’s Economic Future,” Nashua Telegraph, July 29, 2006. Kendall Buck, "What Factors Drive New Hampshire's Housing Industry," NH Builder, October 13, 2006 Lisa K. Shapiro, Ph.D., "Housing New Hampshire's Workforce," March 28, 2005
Lisa Shapiro, Richard England, Patricia Lynch; "The Economic Impacts of the New
47
Hampshire Housing Finance Authority Tax Exempt Bond Programs," August 2000
"Local Regs Hammer Affordable Housing, Study Finds," Nation's Building News, http://www.nahb.org/news_details.aspx?newsID=1929 Michael McCord, “Economic Crossroads Not Far Ahead,” Portsmouth Herald, November 8, 2006. Nashua Regional Planning Commission, "Region-Wide Buildout Impact Analysis," NRPC Places, Volume 7, Issue 4, November 2005 Nashua Regional Planning Commission, "Region-Wide Buildout Impact Analysis," October 24, 2005 NH Growth & Development Roundtable, "Fact Sheet on the Need and Impacts of Growth and Development in NH, September 11, 2006 "NH Housing Prices Cooling Off," New Hampshire Union Leader, Sept. 6, 2006 Rolf Pendall, Robert Puentes & Jonathan Martin, "From Traditional to Reformed: A Review of the Land Use Regulations in the Nation's 50 Largest Metropolitan Areas," The Brookings Institution, Metropolitan Policy Program, August 2006 Russ Thibeault, "Economic and Real Estate Review," October 2006 SB 190, Chapter 210, Laws of 2006, Affordable Housing Study Committee, "A Very Preliminary View," September 7, 2006 Society for the Protection of New Hampshire Forests, "New Hampshire's Changing Landscape," 2005 Southern New Hampshire Planning Commission, "A Summary of Adopted Growth Management Ordinances," July 2005