land use policy - james cook university rahman et al 2016.pdf · land use policy 58 (2016) ... this...
TRANSCRIPT

Ta
STa
b
c
d
e
a
ARRAA
KDCTIE
1
m22tden
ob
lTe
h0
Land Use Policy 58 (2016) 152–164
Contents lists available at ScienceDirect
Land Use Policy
jo ur nal ho me pag e: www.elsev ier .com/ locate / landusepol
owards productive landscapes: Trade-offs in tree-cover and incomecross a matrix of smallholder agricultural land-use systems
yed Ajijur Rahmana,b,c,∗, Terry Sunderlandc,d, Mrigesh Kshatriyac, James M Roshetkoe,im Pagellab, John R. Healeyb
Department of Food and Resource Economics, Section of Environment and Natural Resources, University of Copenhagen, 1958 Frederiksberg, DenmarkSchool of Environment, Natural Resources and Geography, Bangor University, Bangor LL57 2UW, United KingdomCenter for International Forestry Research (CIFOR), Bogor, West Java 16115, IndonesiaCollege of Marine and Environmental Sciences, James Cook University, Cairns, QLD 4878, AustraliaWorld Agroforestry Centre (ICRAF), Bogor, West Java 16115, Indonesia
r t i c l e i n f o
rticle history:eceived 5 April 2016eceived in revised form 23 June 2016ccepted 1 July 2016vailable online 27 July 2016
eywords:eforestationrop productionree planting
a b s t r a c t
One of the main causes of tropical forest loss is conversion to agriculture, which is constantly increasingas a dominant land cover in the tropics. The loss of forests greatly affects biodiversity and ecosystemservices. This paper assesses the economic return from increasing tree cover in agricultural landscapesin two tropical locations, West Java, Indonesia and eastern Bangladesh. Agroforestry systems are com-pared with subsistence seasonal food-crop-based agricultural systems. Data were collected through rapidrural appraisal, field observation, focus groups and semi-structured interviews of farm households. Theinclusion of agroforestry tree crops in seasonal agriculture improved the systems’ overall economic per-formance (net present value), even when it reduced understorey crop production. However, seasonalagriculture has higher income per unit of land area used for crop cultivation compared with the tree
ncomecosystem services
establishment and development phase of agroforestry farms. Thus, there is a trade-off between short-term loss of agricultural income and longer-term economic gain from planting trees in farmland. Forresource-poor farmers to implement this change, institutional support is needed to improve their knowl-edge and skills with this unfamiliar form of land management, sufficient capital for the initial investment,and an increase in the security of land tenure.
© 2016 The Authors. Published by Elsevier Ltd. This is an open access article under the CC BY license
. Introduction
Throughout the past century, tropical forests have declinedainly due to land conversion (Laurance, 2007; Lambin et al.,
003), and continue to be lost at alarming rates (Davidar et al.,010). Although recent conservation efforts may have slowed downhe speed of deforestation, every year the area of tropical forest
ecreases by an estimated 12.3 million ha (FAO, 2010).1 With anstimated two billion extra people expected on the planet in theext 25 years, primarily in tropical areas, forests and their biodi-∗ Corresponding author at: Department of Food and Resource Economics, Sectionf Environment and Natural Resources, University of Copenhagen, 1958 Frederiks-erg, Denmark.
E-mail address: [email protected] (S.A. Rahman).1 In Asia a recent net increase in forest cover has been reported at the regional
evel due to large-scale successful afforestation efforts in China, India, Viet Nam, andhailand. However, these ‘planted forests’ are inferior for providing the full range ofcosystem services (Roshetko, 2013; Xu, 2011).
ttp://dx.doi.org/10.1016/j.landusepol.2016.07.003264-8377/© 2016 The Authors. Published by Elsevier Ltd. This is an open access article u
(http://creativecommons.org/licenses/by/4.0/).
versity face an increasingly uncertain future (Beenhouwer et al.,2013). Although the underlying causes and the drivers of agents’forest clearing behaviour are complex (Babigumira et al., 2014), itis widely found that one of the main immediate causes of forestconversion in the tropics is to provide land for subsistence or com-mercial agriculture (Babigumira et al., 2014; Hosonuma et al., 2012;Hersperger et al., 2010; Angelsen and Kaimowitz, 1999). Further-more, with the scale and impact of agriculture constantly rising,and emerging as a dominant land cover in the tropics, forest bio-diversity and ecosystem services will be increasingly affected bythe agricultural landscape matrix (Perfecto and Vandermeer, 2008;Scherr and McNeely, 2008).
Food production and biodiversity conservation are not nec-essarily mutually exclusive, and there is no simple relationshipbetween the biodiversity and crop yield of an area of farmed land
(Beenhouwer et al., 2013). Rural land use challenges in the trop-ics also include environmental degradation on fragile agriculturallands (Rahman and Rahman, 2011), including a decrease in soilfertility experienced by farmers (Snelder and Lasco, 2008). Evi-nder the CC BY license (http://creativecommons.org/licenses/by/4.0/).

Use Po
dye2paDwsptpIeweLebfaRMflac(
ts22aeeoittibJpsstWalipit
taaIts
n
culture. The main agricultural crops (upland rice, paddy rice, and adiversity of vegetables and fruit) are mainly cultivated in agricul-tural fields year-round. In all the studied villages, forest products
3 In the Indonesian study site rainfall occurs throughout the year, but based on
S.A. Rahman et al. / Land
ence from a number of studies indicates declining growth ofields under intensive cropping even on some of the better lands,.g. the Indo-Gangetic plains (Vira et al., 2015; FAO, 2011; ILEIA,000). In response, tropical agroforestry systems have been pro-osed as a mechanism for sustaining both biodiversity and itsssociated ecosystem services in food production areas (Steffan-ewenter et al., 2007; Schroth et al., 2004), by increasing tree cover,hile maintaining food production. The importance of agroforestry
ystems in generating ecosystem services such as enhanced foodroduction, carbon sequestration, watershed functions (stabiliza-ion of stream flow, minimization of sediment load) and soilrotection is being increasingly recognized (Lasco et al., 2014;
dol et al., 2011; Jose, 2009; Roshetko et al., 2007a,b; Alavalapatit al., 2004). Tree components also produce important products, e.g.ood, fruits, latex, resins etc., that provide extra income to farm-
rs and help alleviate poverty (Tscharntke et al., 2011; Snelder andasco, 2008; McNeely and Schroth, 2006). The economic return,specially net present value (NPV), internal rate of return (IRR),enefit-cost ratio (B/C), return-to-land and return-to-labor of agro-orestry has been found to be much higher than from seasonalgricultural systems in many locations (Roshetko et al., 2013;ahman et al., 2008, 2007; Rasul and Thapa, 2006; Alavalapati andercer, 2004; Elevitch and Wilkinson, 2000). This is especially so
or marginal farmlands where agricultural crop production is noonger biophysically or economically viable (Roshetko et al., 2008),nd may become incompatible with the sustainable developmentoncept with its major focus on ‘people-centered’ developmentSnelder and Lasco, 2008).
Many ecological and economic studies have been conducted onhe effect of land-use change, and management at the landscapecale, on ecosystem services (e.g. Grossman, 2015; Labriere et al.,015; Ango et al., 2014; Baral et al., 2014; Vaast and Somarriba,014; Jose, 2009; Steffan-Dewenter et al., 2007). However, only
few (Wood et al., 2016; Sinare and Gordon, 2015; Tremblayt al., 2015) have focused on the simultaneous delivery of differ-nt agro-ecosystem services (including especially the maintenancef food provisioning) under scenarios of increasing tree plantingn smallholder land use systems, and none of these carried outheir research in Asia (see also Snelder and Lasco, 2008). Thus,his study seeks to fill this gap by assessing the trade-offs betweenncome and tree cover when incorporating trees into food-crop-ased agricultural systems in two tropical Asian locations, Westava, Indonesia and eastern Bangladesh. Our analysis comparesrovisioning ecosystem services provided by agroforestry with sea-onal food crop farming, practiced in either swidden or permanentystems. Expansion of these subsistence systems is a major con-ributing factor to forest loss and environmental degradation in
est Java (EST, 2015; Galudra et al., 2008). Similarly, upland slash-nd-burn swidden agriculture, which is the dominant economicand use (Rahman et al., 2014), is a leading cause of deforestationn eastern Bangladesh. Hence, the two locations represent a com-lementary pair of examples for our analysis targeting the effect of
ncreasing tree cultivation, and thus tree cover, in the dominant2
ype of Asian tropical agricultural landscapes.This study will provide new information on the contribution
hat can be made to the income of seasonal food crop farmers bydopting agroforestry practices, specifically through production of
wider range of food and timber provisioning ecosystem services.t will meet the need for more detailed research resulting in quan-
itative data from different locations on a range of agroforestryystems compared with alternative farming practices, which is cru-2 In the tropical rural Asian landscapes, agriculture is the dominant type of eco-omic land use (Babigumira et al., 2014).
licy 58 (2016) 152–164 153
cial evidence to better inform land use and farming policy anddevelopment practice (Snelder and Lasco, 2008; FAO, 2006).
2. Materials and methods
2.1. Study site
This research was conducted in Gunung Salak valley, BogorDistrict, West Java, Indonesia and Khagrachhari district, easternBangladesh.
The research site in Indonesia lies between 6◦ 32′ 11.31” Sand 6◦ 40′ 08.94” S latitudes and between 106◦ 46′ 12.04” Eand 106◦ 47′ 27.42” E longitudes. The climate is equatorial withtwo distinct seasons,3 i.e. relatively dry (April–October) and rainy(November–March). The region is more humid and rainy than mostparts of West Java. Given the proximity of large active volcanoes,the area is considered highly seismic (Badan Pusat Statistik, 2013;Wiharto et al., 2008) leading to highly fertile volcanic soils (Table 1).Field data were collected from three purposively selected4 sam-ple villages: Kp. Cangkrang, Sukaluyu and Tamansari, which arelocated in the northern Gunung Salak valley. The latter two vil-lages contain a mixture of households practicing each of the twoland use systems that form the major comparison of this study:subsistence seasonal swidden farming and agroforestry. The firstvillage is located in a different part of the watershed, most of itsstudied households carry out a different farming system (perma-nent monoculture farming) and it is included in this study as anoutgroup comparison. The total population in this area is approxi-mately 10,200 people spread across 1600 households. Villages havepoor infrastructure, and household incomes are mainly based onagricultural and forest products, sold in local and district markets,in addition to wage labor and retailing (Badan Pusat Statistik, 2013).
The research site in Bangladesh is part of the Chittangong HillTracts, the only extensive forested hilly area in Bangladesh, whichlies in the eastern part of the country between 21◦ 11′ 55.27” Nand 23◦ 41′ 32.47” N latitudes and between 91◦ 51′ 53.64” E and92◦ 40′ 31.77” E longitudes. The area has three distinct seasons,i.e. hot and humid summer (March–June), cool and rainy monsoon(June–October) and cool and dry winter (October–March) (BBS,2014). Mean annual rainfall is higher than the Indonesian studysite, and soils were also highly fertile (Table 1). Field data werecollected from two purposively selected sample villages,5 Mai TwiPara and Chondro Keron Karbari Para, with a total population ofapproximately 750, in 135 households. These two villages havepoor infrastructure, and household incomes are mainly based onthe sale of agricultural and forest products in local and district mar-kets, with wage labor providing additional household income. Theyboth include a mixture of households practicing each of the twoland use systems that form the major comparison of this study:subsistence seasonal swidden farming and agroforestry.
In both research sites, agriculture is mainly a subsistence prac-tice, conducted by small-scale farmers and deeply rooted in their
its intensity two seasons are recognized, with heavy rainfall demarcating the rainyseason.
4 The villages were selected based on stratification by watershed location and hav-ing the largest sample size of farm households that practice its associated land usesystem, i.e. in the lower watershed permanent monoculture (Kp. Cangkrang), and inthe middle (Sukaluyu) and upper (Tamansari) watershed swidden and agroforestry.
5 The area consists of hills, and the two villages were selected as those with thelargest sample size of farm households that practice the farming systems beingcompared in this study, i.e. swidden and agroforestry.

154 S.A. Rahman et al. / Land Use Policy 58 (2016) 152–164
Table 1Basic characteristics of the research sites.
Characteristics Indonesia Bangladesh
Average precipitation (mm/year) 1700 2540Average relative humidity (%) 70 66Average temperature (◦ C) 26 24Soil Highly fertile derived from volcanic and sedimentary rocks Highly fertile of variable depth above broken shale or
sandstone as well as mottled sandMain economic activities Agricultural and forest products, wage labor and retailing Agricultural and forest products, wage laborMain source of forest products Natural forest Natural and secondary forestForest products collected Firewood, rattan, bamboo, fruits, vegetables Firewood, timber, bamboo, rattan, wild fruits, vegetablesAgricultural markets Village and district Village and districtLocal land use Household dwelling units, home gardens, agricultural
fields and forestsHousehold dwelling units, home gardens, agriculturalfields and forests
nity d
D l., 200
(dmmmpsrsarfp
2
ouApvk
aclfcaal
taai
si
l
p
oefi
waite) approximation to the degrees of freedom (df) was usedto determine the p-value. ANOVA was used to test differences
Land tenure State de jure owner. Private and commu
ata Source: BBS (2014), BBS (2013), Badan Pusat Statistik (2013) and Wiharto et a
FPs) are collected from nearby forests. Farmers practicing swid-en prepare new areas of land using the traditional slash-and-burnethod to cultivate predominantly the food crops upland rice,aize and vegetables. They rotate crop cultivation between fields toaintain soil fertility by leaving land fallow for 2–4 years. Farmers
racticing permanent monoculture agriculture in the Indonesianite grow single seasonal crops (predominantly upland rice, paddyice, maize, vegetables or spices). Some farmers have replaceduch traditional crops with high-value cash crops, e.g. taro, bananand papaya. In both research sites, some farmers have adopted aange of agroforestry systems (e.g. fruit tree, timber tree or mixedruit-timber), where trees are grown together with seasonal anderennial crops.
.2. Data collection
Primary data of the basic socioeconomic and geographical statef the research sites were collected by rapid rural appraisals (RRA)sing village mapping and key informant interviews (FAO, 2015;ngelsen et al., 2011). Key informant interviews and village map-ing sessions were conducted (one in each village) by involving theillage head and three farmers, selected purposively based on theirnowledge about the village and surrounding areas.
Five focus group discussion (FGD) sessions (one in each village6)nd field observations were used to identify the types of localultivation systems and their products. The village heads andocal farmer representative groups (consisting of eight to twelvearmers7) were present in the FGD sessions. Field observations werearried out in fifty-five farm locations identified during the RRAsnd FGDs. Several pictures of local cultivation systems were taken,8
nd relevant information was noted with the assistance of expertocal informants.9
Semi-structured interviews were conducted to collect informa-
ion on farm products and their values, land area and allocation,nd other basic characteristics of the farm household, i.e. familynd labor force size, age and education of the family members,ncome, expenditure, savings and interest in tree-based farming.6 One semi-structured questionnaire interview (village survey, consisting of aet of questions regarding basic information about the village, e.g. demographic,nfrastructure, land use) was also conducted during the FGD.
7 Farmers in each group were purposively selected based on their knowledge ofocal cultivation systems.
8 Pictures were taken as visual supporting evidence to aid data analysis and inter-retation by characterising the structure of each specific cultivation system.9 One person from each research site (country), who had considerable knowledge
f local land use systems, products, markets and institutions, was employed as anxpert local informant. These informants were present during the whole period ofeldwork, and helped check the validity of information obtained.
e facto user.20 State de jure owner. Private and community de facto user.21
8; Local Agricultural Office; RRA and village survey in this study.
In Indonesia 20 permanent monoculture,10 20 swidden and 20agroforestry farmers were interviewed; and in Bangladesh11 40swidden and 21 agroforestry farmers were interviewed. Due tothe variation in structure and management practices of the farmsin each area, purposive sampling was used to identify householdsthat were practicing a well-managed12 form of each of the con-trasted farming systems.13 We estimate that in the Indonesianstudy villages they represent 20%, 40% and 30% of the perma-nent monoculture, swidden and agroforestry farming populationsrespectively. In the Bangladesh study villages they represent about50% and 60% of the swidden and agroforestry farming populationsrespectively. The questionnaire that guided the interviews wasrefined and finalized with the help of the expert local informantsand during FGD sessions to make sure that the questions elicitedthe information required. The product value of crops was calculatedwith the key informant farmers during the interview based on thetotal production in the most recent season/year.
The primary data (i.e. local farm production and its marketvalue) collected from the research sites were cross-checked withdata gathered from local state agriculture and forestry offices, andthe ICRAF Southeast Asian Regional office and CIFOR headquarters(both located in Bogor, Indonesia).
2.3. Data analysis
Descriptive statistics were used to compare characteristics (age,education, family size, farm size, yearly income and expenditure)of the different farmer groups.14 The size of farms and proportionof land used for different categories of land use were comparedamongst the farmer groups. To compare two farmer groups, atwo-sample un-paired Student’s t-test (t) was calculated, withthe assumption of unequal variance, and the Welch (or Satterth-
amongst three farmer groups, with F-statistics reported as F (a, b),
10 In this research, permanent monoculture refers to growing a single crop at giventimes of the year in a rotational system in the same area without abandoning theland.
11 In the Bangladesh research site permanent monoculture is rarely practiced, withinsufficient farmers in the studied villages to provide an adequate sample, thus itwas not included in the study.
12 For example, some farmers started agroforestry farming but after a few yearsgave up planting the understorey, for various reasons (e.g. lack of managementinterest or capital). Thus, many agroforestry farms were converted to simple treeorchards, and we have excluded these from our sample.
13 Each of these farmer groups as a whole cultivates plots of land under differentforms of farming (agroforestry, swidden, permanent monoculture). Therefore, eachgroup was selected on the basis of their dominant form of farming practice.
14 Descriptive statistics are abbreviated: M = mean, SD = standard deviation andN = sample size.

Use Po
wrsW
acp(atsocd(apittmelAdiiv
3
stmtgichsmfhIiltBs
uft(
yA
rp
Ut
permanent monoculture crop, being cultivated by 80% of farmers.Among swidden farmers, maize and upland rice are most popular.On agroforestry farms, the most common crops are the annuals cas-
19 The ‘other’ land use type includes fallows, wetlands and ponds. ‘Homestead’refers to a farmhouse surrounded by carefully managed, planted and naturallygrown plants, e.g. fruits, vegetables and ornamentals.
20 In the Indonesian study site, the national government is the owner of the land.
S.A. Rahman et al. / Land
here a and b are between and within group degrees of freedomespectively. All analyses were performed in the R environment fortatistical computing (version R 2.15.0) (R Core Team, 2015) in a
indows platform.Net present value (NPV) was calculated to assess the over-
ll economic performance of crop production under mixed treerops versus the non-agroforestry farming systems (swidden andermanent monoculture) on the basis of a 30-year time periodRahman et al., 2007, 2014; Arun, 2013) and a 10% discount rates it is an appropriate rate to match the banking system local tohe research site (Rahman et al., 2007, 2014).15 Sensitivity analy-is was also conducted on variation in yields, as the combinationf tree species may affect understorey crop production. Means areompared (independent sample t-test using SPSS V 22) to assess theifferent factors that may affect the decisions of non-agroforestryswidden and permanent monoculture) farmers to choose to adoptgroforestry tree-based farming, by determining the conditionalrobability that a farmer will adopt given a set of independent
nfluencing factors, i.e. land area, family size, income, age, educa-ion, and credit availability (Rahman et al., 2012). Our hypothesis ishat, with less land available for permanent cultivation, farmers are
ore inclined to practice seasonal cultivation, e.g. swidden. Farm-rs with larger family size, lower family income, who are older, andess-educated are also more closely aligned to seasonal cultivation.vailable credit helps to enable the adoption of agroforestry. Theependent variable in our case is binary which takes the value ‘1′
f a non-agroforestry farmer wants to practice agroforestry and ‘0′
f otherwise. The definition and expected signs of the explanatoryariables and the results are described in Table 7.
. Results
In both study sites, agroforestry farmers are younger thanwidden farmers (Table 2). In addition, in the Indonesian case,he farmers in the lower watershed village practicing permanent
onoculture were of comparable age to the swidden farmers inhe two villages higher in the watershed. All the Indonesian farmerroups have roughly the same educational qualifications, whereasn Bangladesh the agroforestry farmers have higher levels of edu-ation than the swidden farmers. In both areas all respondents andousehold heads were male. The average household labor forceize is 1.2, 1.4 and 1.5 for agroforestry, swidden and permanentonoculture farmers in Indonesia, and 1.6 for both the agro-
orestry and swidden farmers in Bangladesh. Agroforestry farmersave higher annual income than swidden farmers in both areas.
n Indonesia, the permanent monoculture farmers have higherncome than the others. The savings of Indonesian farmers areower than Bangladeshi farmers. They do not differ much amongsthe farming groups in Indonesia, however agroforestry farmers inangladesh have double the amount of savings (US$ 481.14) ofwidden farmers (US$ 240.69).
Each of the farmer groups as a whole cultivates plots of landnder different forms of farming. The total farm size of agroforestry
armers is significantly larger (M = 3.7 ha, SD = 2.8, N = 21) thanhat of swidden farmers (M = 2.2 ha, SD = 2.2, N = 40) in Bangladesht = 2.28, df = 24.59, p-value = 0.03) (Fig. 1). In Indonesia, farm size15 Further details of the NPV calculation are given in Appendix 1, including theearly cash flow results for selected cultivation systems in the research sites inppendix 1, Table A1.
16 During the FGDs farmers reported that in the swidden system there is a farmingisk, which is associated with crop failure, landslides, and land grabbing by moreowerful actors.17 As indicated by their daily income being less than US$1.25 per person. TheS$1.25 level at 2005 purchasing power parity is essentially set the same way by
he World Bank as the original US$1 per day poverty line (World Bank, 2015).
licy 58 (2016) 152–164 155
also differs between the groups [F (2.57) = 6.4, p = 0.003], with swid-den and agroforestry farms in the middle and upper watershedvillages being significantly larger than the permanent monoculturefarms in the lower watershed village. However, there was no signif-icant difference in farm size between the swidden and agroforestryfarmers (t = 0.8, df = 20.6, p-value = 0.38).
The proportion of the total land area of the interviewed agro-forestry farmers that they use for agroforestry systems (M = 61%,SD = 32%, N = 41) is significantly higher than that the swidden farm-ers use for swidden systems (M = 47%, SD = 21%, N = 60) (t = 2.37,df = 63.1, p-value = 0.02). The allocation of land to ‘other land uses’follows a similar pattern for the two groups of farmers (Fig. 2).
The agroforestry farmers tend to cultivate a single plot of land. InIndonesia, on average the agroforestry farmers allocate 88% of theirland to the single largest plot, whereas in Bangladesh it is only 58%of their land (Fig. 3). This indicates that the land of the Bangladeshiagroforestry farmers tends to be divided into more plots with agreater diversity of plot sizes. In contrast, for the swidden farmersthere is less difference between the two countries in the divisionof their land between plots of different sizes; in both cases the pro-portion of their land that is allocated to their largest plot varieswidely amongst farmers. This is because there is a tendency tospread the farming risk16 across many smaller plots. In contrast,the vast majority of permanent monoculture farmers allocated avery high proportion of their land to their single largest plot (onaverage 91%).
In the Indonesia study site, the agroforestry farmers earn anaverage income of US$382 per hectare of land that they allo-cate to agroforestry (Table 3). This is 1.7 times higher than theincome of swidden farmers per hectare of land allocated to swidden(US$226). However, the average income of the permanent mono-culture farmers located lower in the watershed, who allocated100% of their mean 0.20 ha of land to this use, was much higher(US$2990 ha−1). In contrast, in Bangladesh the swidden farmers hada higher income per area of land used for swidden (US$610 ha−1)than the agroforestry farmers had per area of agroforestry land(US$441 ha−1). In Bangladesh the two groups of farmers allocateda similar proportion of their land (ca. 30%) to their dominant landuse (agroforestry and swidden respectively), whereas in Indonesiaagroforestry farmers allocated 87% of their land to this use, butswidden farmers allocated a lower proportion (60%) of their landto swidden.
Farmers in our study sites spread their production over a widediversity of crops (Fig. 4). In Indonesia, yam is the most common
Individuals and communities have land use and transfer rights. Individuals and com-munities have no formal rights to state forest land but, with government agreement,people can collect NTFP.
21 In the Bangladesh study site, the national government is the owner of the land.Individuals and communities have the right to use the land, but no transfer rights.Individuals and communities have no formal rights to state forest land but, withgovernment agreement, people can collect NTFP.
22 The level of annual income from products harvested from different farming sys-tems was based on farmers’ reports of their income during the single most recentproduction year. However, for most of the agroforestry farmers this underestimatedtheir potential future income as the timber trees in their agroforests had yet to reachharvestable maturity and in some cases fruit trees had yet to grow to maturity andachieve maximum fruit yield. Since tree species have a longer juvenile period com-pared with other agricultural crops such as rice and maize that mature within a fewmonths, income from agroforestry systems will be much lower during the years oftheir establishment phase.

156 S.A. Rahman et al. / Land Use Policy 58 (2016) 152–164
Table 2Basic characteristics of the farm households.
Characteristics Indonesia Bangladesh
AF (n = 20) SW (n = 20) PM (n = 20) AF (n = 21) SW (n = 40)
Age of household head 53 60 59 42 45Education of household head (year of schooling) 5.0 5.1 4.8 6.0 3.7Sex of household head Male (100%) Male (100%) Male (100%) Male (100%) Male (100%)Family size 6.7 4.7 4.9 4.7 4.8Labour force (age 15-59) 1.2 1.4 1.5 1.6 1.6Distance to the village center (minutes of walking) 23.5 12.8 12.9 5.7 8.2Distance to the edge of nearest forest (minutes of walking) 10.6 24.0 9.2 21.3 16.9Total land area (ha) 0.98 0.77 0.26 3.72 2.22Total annual income (US$) 2015 1207 2497 1380 1076Total annual expenditure (US$) 1454 1114 2109 1397 1069Total savings in a bank/ credit association (US$) 126 172 168 481 241Total outstanding debit (US$) 8.50 7.50 9.50 177.01 182.56
Note: AF = Agroforestry farmer, SW = Swidden farmer, PM = Permanent monoculture farmer. US$ 1 = 10,000 Indonesian Rupiah (IDR) or 78 Bangladeshi Taka (BDT).
Fig. 1. Boxplot showing total farm size (ha) amongst the different farmer groups. For each box the horizontal center line shows the median of the distribution, the top andbottom edges of the box show the 75% (Q3) and 25% (Q1) quartiles respectively, and the top and bottom ends of the whiskers are defined as the first data point within thelimits defined by Q3+(1.5*IQR) and Q1-(1.5*IQR) respectively, where IQR is the inter-quartile range (the box height).
Table 3Farm households’ allocation of their land area (ha) to different farming systems and the annual income (US$) from total production on each.22
Indonesia Bangladesh
Land use system Land area and income share Agroforestryfarmer
Swidden farmer Permanentmonoculturefarmer
Agroforestryfarmer
Swidden farmer
Agroforestry land Area (ha) and proportion oftotal land (%, in brackets)
0.85(86.73)
0.00 0.00 1.07(28.76)
0.00
Income (US$) and share of totalfarm income (%, in brackets)
324.55(66.11)
n/a n/a 472.20(45.13)
n/a
Swidden land Area (ha) and proportion oftotal land (%, in brackets)
0.00 0.46(59.74)
0.00 0.00 0.71(31.98)
Income (US$) and share of totalfarm income (%, in brackets)
n/a 104.00(29.21)
n/a n/a 433.34(67.32)
Permanent monoculture land Area (ha) and proportion oftotal land (%, in brackets)
0.11(11.22)
0.29(37.66)
0.20(76.92)
0.92(24.73)
0.51(22.97)
Income (US$) and share of totalfarm income (%, in brackets)
166.35(33.89)
252.00(70.79)
598.08(100)
574.12(54.87)
210.38(32.68)
Total Total farm income (US$) andshare of total householdincome (%, in brackets)
490.90(24.36)
356.00(29.49)
598.08(23.95)
1046.32(75.80)
643.72(59.81)

S.A. Rahman et al. / Land Use Policy 58 (2016) 152–164 157
Fig. 2. The proportion of their total land area used for various forms of farming amongst the different farmer groups.19 The square, diamond and circle symbols show themean values and the ends of the vertical lines show ±1 standard deviation.
Fig. 3. Comparison amongst farmer groups in the probability of their largest plot occupying different proportions of their land area. Kernel density plots showing theconcentration of observations as a density function against the percentage of their land area occupied by their largest plot for the farmers in each group (agroforestry,swidden and permanent monoculture). The kernel density estimation model used to generate each curve fixes its integral as 1 across the modelled range from 33% to 100% ofland area. The probability between two x-values is the area under the curve between those two points. The Kernel density analysis was carried out using R, version R 2.15.0.

158 S.A. Rahman et al. / Land Use Policy 58 (2016) 152–164
Fig. 4. The percentage of farmers cultivating each type of subsistence crop (a, Indonesia swidden and permanent monoculture; b, Bangladesh swidden; c, Indonesiaagroforestry; d, Bangladesh agroforestry).
Table 4Income from main agricultural crops (US$ ha−1), when grown in open fields.23
Crop and cultivationperiod
Indonesia Bangladesh
Mean NPV Mean NPV
Upland rice (3 months) 1,282.90 12,093.79 1,140.00 10,747.00Maize (4 months) 1,213.90 11,443.33 1520.00 14,329.00Yam (4 months) 1,531.40 14,436.38 n/a n/aCassava (8 months) 1,134.40 10,693.89 n/a n/aPeanut (4.5 months) 1,191.40 11,231.23 n/a n/aSoybean (3 months) 300.00 2,828.07 n/a n/aSesame (3 months) n/a n/a 902.50 8,508.00Turmeric (10 months) n/a n/a 2,422.50 22,837.00Cucumber (4 months) n/a n/a 2,066.25 19,478.00
n
D view,
statdffiaati
adt
Banana (10 months) n/a
ata sources: focus group discussion, farm level semi-structure questionnaire inter
ava and yam, followed by the fruit trees durian and nutmeg andhe timber trees teak and white jabon. In Bangladesh, turmeric, ricend banana are the most widely cultivated field crops, mangiumhe dominant timber tree, and mango, jackfruit and lychee theominant fruit trees for agroforestry farmers. The surveyed agro-orestry farmers in Indonesia do not grow rice in their agroforestryelds, but in separate non-agroforestry fields. The average incomend net present value (NPV, on the basis of a 30-year time period
nd 10% discount rate) of the main agricultural crops grown inhe swidden and permanent monoculture systems is presentedn Table 4. Among the crops, yam generated the highest income23 The calculation of NPV is based on a 30-year time horizon, a 10% discount rate,nd one harvest per crop per year regardless of its cultivation period, as farmerecision-making about whether to combine crops in the same year is too complexo model.
/a 6,175.00 58,211.00
Local Agricultural Office, ICRAF, CIFOR.
(mean income during its cultivation period was US$1,531.40 ha−1,NPV = US$14,436.38 ha−1) in Indonesia followed by upland rice,maize and peanut. In Bangladesh farmers earn the highest incomefrom banana (mean income US$6,175.00 ha−1, NPV = US$58,211.00ha−1) followed by turmeric, cucumber, maize and upland rice.
To test the difference in overall economic performance (NPV) offarm production under agroforestry, with a mixture of tree crops,to that of non-agroforestry farming systems (swidden and perma-nent monoculture), the most popular locally cultivated trees wereselected: durian, nutmeg and teak in Indonesia; mango, jackfruit,lychee and mangium in Bangladesh. Risk factors, such as the effectthat the tree species combination may have on productivity ofthe understorey crops are important in assessing economic perfor-
mance. This effect depends on various factors, e.g. intensity of shadeand spread of tree canopy, sunlight, rainfall, soil conditions and fer-tilizer inputs. Therefore, sensitivity analysis was conducted testingthe effect of variation in crop yield reduction in 10% intervals from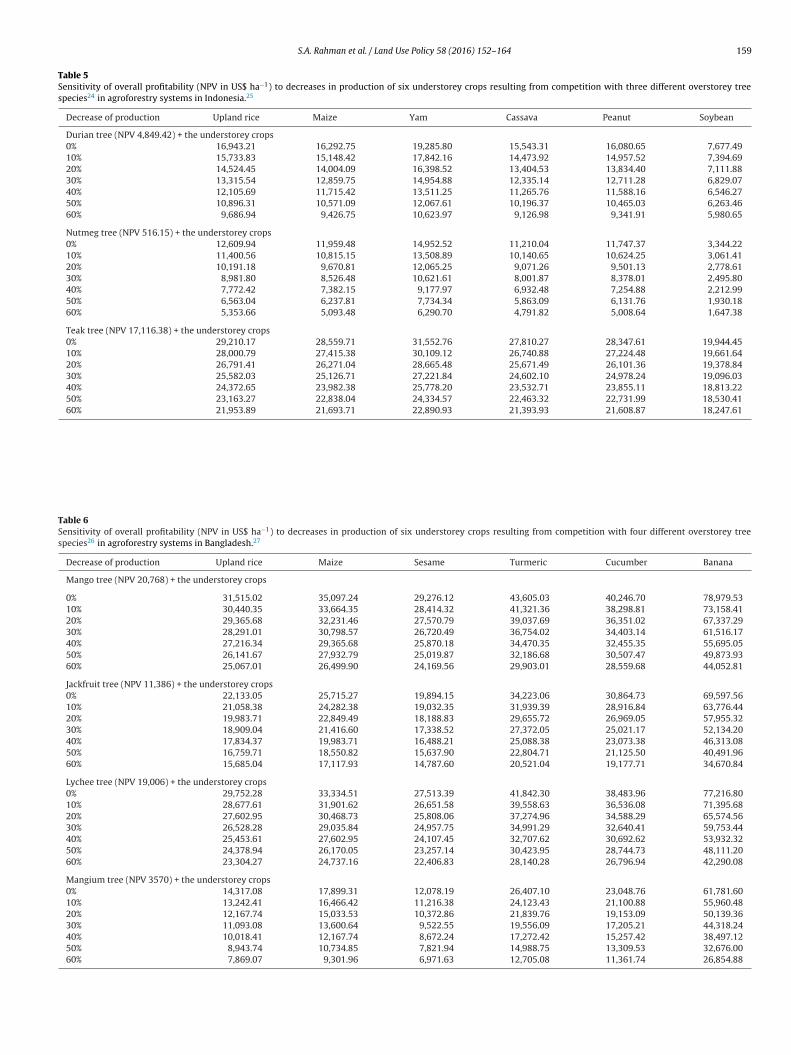
S.A. Rahman et al. / Land Use Policy 58 (2016) 152–164 159
Table 5Sensitivity of overall profitability (NPV in US$ ha−1) to decreases in production of six understorey crops resulting from competition with three different overstorey treespecies24 in agroforestry systems in Indonesia.25
Decrease of production Upland rice Maize Yam Cassava Peanut Soybean
Durian tree (NPV 4,849.42) + the understorey crops0% 16,943.21 16,292.75 19,285.80 15,543.31 16,080.65 7,677.4910% 15,733.83 15,148.42 17,842.16 14,473.92 14,957.52 7,394.6920% 14,524.45 14,004.09 16,398.52 13,404.53 13,834.40 7,111.8830% 13,315.54 12,859.75 14,954.88 12,335.14 12,711.28 6,829.0740% 12,105.69 11,715.42 13,511.25 11,265.76 11,588.16 6,546.2750% 10,896.31 10,571.09 12,067.61 10,196.37 10,465.03 6,263.4660% 9,686.94 9,426.75 10,623.97 9,126.98 9,341.91 5,980.65
Nutmeg tree (NPV 516.15) + the understorey crops0% 12,609.94 11,959.48 14,952.52 11,210.04 11,747.37 3,344.2210% 11,400.56 10,815.15 13,508.89 10,140.65 10,624.25 3,061.4120% 10,191.18 9,670.81 12,065.25 9,071.26 9,501.13 2,778.6130% 8,981.80 8,526.48 10,621.61 8,001.87 8,378.01 2,495.8040% 7,772.42 7,382.15 9,177.97 6,932.48 7,254.88 2,212.9950% 6,563.04 6,237.81 7,734.34 5,863.09 6,131.76 1,930.1860% 5,353.66 5,093.48 6,290.70 4,791.82 5,008.64 1,647.38
Teak tree (NPV 17,116.38) + the understorey crops0% 29,210.17 28,559.71 31,552.76 27,810.27 28,347.61 19,944.4510% 28,000.79 27,415.38 30,109.12 26,740.88 27,224.48 19,661.6420% 26,791.41 26,271.04 28,665.48 25,671.49 26,101.36 19,378.8430% 25,582.03 25,126.71 27,221.84 24,602.10 24,978.24 19,096.0340% 24,372.65 23,982.38 25,778.20 23,532.71 23,855.11 18,813.2250% 23,163.27 22,838.04 24,334.57 22,463.32 22,731.99 18,530.4160% 21,953.89 21,693.71 22,890.93 21,393.93 21,608.87 18,247.61
Table 6Sensitivity of overall profitability (NPV in US$ ha−1) to decreases in production of six understorey crops resulting from competition with four different overstorey treespecies26 in agroforestry systems in Bangladesh.27
Decrease of production Upland rice Maize Sesame Turmeric Cucumber Banana
Mango tree (NPV 20,768) + the understorey crops
0% 31,515.02 35,097.24 29,276.12 43,605.03 40,246.70 78,979.5310% 30,440.35 33,664.35 28,414.32 41,321.36 38,298.81 73,158.4120% 29,365.68 32,231.46 27,570.79 39,037.69 36,351.02 67,337.2930% 28,291.01 30,798.57 26,720.49 36,754.02 34,403.14 61,516.1740% 27,216.34 29,365.68 25,870.18 34,470.35 32,455.35 55,695.0550% 26,141.67 27,932.79 25,019.87 32,186.68 30,507.47 49,873.9360% 25,067.01 26,499.90 24,169.56 29,903.01 28,559.68 44,052.81
Jackfruit tree (NPV 11,386) + the understorey crops0% 22,133.05 25,715.27 19,894.15 34,223.06 30,864.73 69,597.5610% 21,058.38 24,282.38 19,032.35 31,939.39 28,916.84 63,776.4420% 19,983.71 22,849.49 18,188.83 29,655.72 26,969.05 57,955.3230% 18,909.04 21,416.60 17,338.52 27,372.05 25,021.17 52,134.2040% 17,834.37 19,983.71 16,488.21 25,088.38 23,073.38 46,313.0850% 16,759.71 18,550.82 15,637.90 22,804.71 21,125.50 40,491.9660% 15,685.04 17,117.93 14,787.60 20,521.04 19,177.71 34,670.84
Lychee tree (NPV 19,006) + the understorey crops0% 29,752.28 33,334.51 27,513.39 41,842.30 38,483.96 77,216.8010% 28,677.61 31,901.62 26,651.58 39,558.63 36,536.08 71,395.6820% 27,602.95 30,468.73 25,808.06 37,274.96 34,588.29 65,574.5630% 26,528.28 29,035.84 24,957.75 34,991.29 32,640.41 59,753.4440% 25,453.61 27,602.95 24,107.45 32,707.62 30,692.62 53,932.3250% 24,378.94 26,170.05 23,257.14 30,423.95 28,744.73 48,111.2060% 23,304.27 24,737.16 22,406.83 28,140.28 26,796.94 42,290.08
Mangium tree (NPV 3570) + the understorey crops0% 14,317.08 17,899.31 12,078.19 26,407.10 23,048.76 61,781.6010% 13,242.41 16,466.42 11,216.38 24,123.43 21,100.88 55,960.4820% 12,167.74 15,033.53 10,372.86 21,839.76 19,153.09 50,139.3630% 11,093.08 13,600.64 9,522.55 19,556.09 17,205.21 44,318.2440% 10,018.41 12,167.74 8,672.24 17,272.42 15,257.42 38,497.1250% 8,943.74 10,734.85 7,821.94 14,988.75 13,309.53 32,676.0060% 7,869.07 9,301.96 6,971.63 12,705.08 11,361.74 26,854.88

1 Use P
0tt(rofcatisvaop
imtfeseaatiecottg
4
tiw
Obsrocmyyotct
Ypyodmacpa
60 S.A. Rahman et al. / Land
% to 60% on the NPV (Tables 5 and 6). With durian as the overstoreyree crop, all of the understorey crops, except yam, are profitable upo yield reductions of 40% compared with other cropping systemsTables 4 and 5) in Indonesia. Nutmeg as a tree crop provides a loweturn (NPV) and the nutmeg system is not profitable at any levelf crop loss. In contrast, teak has high value so the teak-based agro-orestry system remains profitable regardless of the understoreyrop yield reduction it may cause. Similarly, in Bangladesh mango-nd lychee-based agroforestry systems are profitable regardless ofhe yield reduction with any selected crops except banana, whichs profitable up to 30% loss (Tables 4 and 6). The jackfruit-basedystem is profitable up to 50% loss of most crops, but there is a bigariability in the mangium system as rice, maize, sesame, turmericnd cucumber are profitable up to 30%, 20%, 40%, 10% and 10%f crop yield reduction respectively. In contrast banana is neverrofitable with mangium.
From the information gathered during our semi-structurednterviews of the non-agroforestry famer groups (swidden and per-
anent monoculture), a comparison of means is used to investigatehe conditional probability that a farmer may adopt tree-basedarming given a set of influential factors. The mean values of differ-nt influential factors, i.e. farmer age, education, land area, familyize, income and credit availability, revealed no significant differ-nces between those who have a (potential) interest in agroforestrynd those who have not, in either country, except that interest indopting agroforestry was very significantly associated with educa-ional level for swidden (but not permanent monoculture) farmersn Indonesia (Table 7). Therefore, with this exception, there is novidence that these factors have a significant influence on farmerhoice of tree-based farming in our study areas, which is corrob-rated by the qualitative information obtained from FGD sessionshat swidden and permanent monoculture are retained becausehey are deeply rooted in local traditions extending back over manyenerations.
. Discussion
Profitability measured by NPV over a 30-year time period shows
hat farmers will achieve a positive economic performance by mix-ng trees and seasonal crops in agroforestry systems comparedith seasonal agriculture in both countries. This finding holds
24 Fruit trees (durian, nutmeg) and timber tree (teak).25 NPV is calculated based on a 30-year time horizon with a 10% discount rate.nce trees are included in the cultivation system the lifespan of the project cane considered indefinite. However, for simplicity, in our analysis the project life istill considered to be 30 years as this may be a realistic lifetime for one productiveotation of fruit trees (durian and nutmeg), and for three rotations (harvest cycles)f the timber tree (teak). Yields of durian and nutmeg (from grafted seedlings) arealculated in three periods: durian has low yields during the fourth to sixth years,edium yields during the seventh to eighth years, and high yields from the ninth
ear onwards; nutmeg has low yields during the seventh to ninth years, mediumields during the tenth to twelfth years, and high yields from the thirteenth yearnwards. The calculation for each understorey crop is based on 30 annual produc-ions assuming constant income cycles, i.e. one production per year regardless of itsultivation period, as farmer decision-making about whether to combine crops inhe same year is too complex to model.26 Fruit trees (mango, jackfruit, lychee) and timber tree (mangium).27 NPV is calculated based on a 30-year time horizon with a 10% discount rate.ields of mango, lychee and jackfruit (from grafted seedlings) are calculated in threeeriods: mango and lychee have low yields during the sixth to eighth years, mediumields during the ninth to eleventh years, and high yields from the twelfth yearnwards; jackfruit has low yields during the sixth to seventh years, medium yieldsuring the eighth to ninth years, and high yields from the tenth year onwards. Thearket value of timber from mangium is calculated in ten-year rotation periods,
fter which it is assumed that it is replanted. The calculation for each understoreyrop is based on 30 annual productions assuming constant income cycles, i.e. oneroduction per year regardless of its cultivation period, as farmer decision-makingbout whether to combine crops in the same year is too complex to model.
olicy 58 (2016) 152–164
across a wide range of percentage reductions in understorey cropproduction when trees become mature and their canopies close.Teak-based agroforestry systems, followed by durian, showed thebest economic performance at the Indonesian site, both con-siderably outperforming seasonal crop-based farming systems.Agroforestry systems with two fruit tree species, mango and lychee,also showed a good economic performance in Bangladesh. In theshort term, however, before tree crops have reached maturity, per-manent monoculture and swidden farms provide higher income,as seasonal crop farms generate quicker returns than do agro-forestry farms. Furthermore, when adopting tree crops, farmershave to accept reduced yields of understorey seasonal crops beforereceiving the increase in income from harvesting these tree crops(Oladele and Popoola, 2013; Singh et al., 2012; Tiwari et al., 2012).Farmers may also face other interacting risks, such as crop fail-ures, fluctuating market demand and prices, pests and diseases,and climate change. Changing successfully to tree-dominated sys-tems will require farmers to develop access to high quality treegermplasm, tree management expertise, which may be lacking ingovernment extension services, and market channels for tree prod-ucts, which are generally different from those for annual crops.Nonetheless, a more ecologically diverse farming system yieldinga wider range of products is more likely to be buffered againstsuch risks over the 30-year time period assessed in this paper(Elevitch and Wilkinson, 2000). This change in farming system toagroforestry may, however, have serious subsistence and culturalcosts as the cultivation of seasonal crops is primarily for householdsubsistence consumption and is deeply rooted in their culture. Theretention of seasonal crop farming by many farmers, despite themedium-/long-term economic advantage of adopting agroforestrydemonstrated by the results of the present study, is likely to beexplained by culture- and tradition-linked factors retaining a deci-sive influence on farmer preferences. This is also indicated by theirretention of comparatively small plots of seasonal crops, despitethis restricting the efficiency of the productive assets (Rahmanet al., 2012).
Farmers are concerned about the loss of understorey cropproduction in agroforestry systems, however our results providestrong evidence that these will be compensated by the generationof cash income from tree products in the medium-term. Providedthat farmers can afford to bear the losses up to the time that theirtrees have grown to harvestable maturity, they are likely to gain anet benefit by achieving a level of income from tree products thatenables them to purchase essential needs including food. However,farmers may lack confidence in this shift in the basis of their liveli-hoods. Even if it is likely to increase their net income, they mayfeel more exposed to risks of market failure of their tree crops andregret the loss of cultural identity associated with the cultivationof specific traditional crops (Mwase et al., 2015; UEA, 2015; Gyauet al., 2014; Pannell, 2009). Thus, smallholder farmers’ decision-making about whether to shift their food production system toagroforestry in place of subsistence crop production is based oncultural considerations as well as the trade-off between short-termand a longer-term benefits.
Living costs are predicted to increase in both the studied coun-tries, however as food security largely depends on income security,even in remote places (van Noordwijk et al., 2014), our economicanalyses demonstrate that the higher income from tree-basedfarming has the potential to enhance food security. Incorporation oftree species selected for the local value of their products (fruit, tim-ber) into food-crop-based subsistence agricultural systems can alsoenhance household well-being by consumption of a more diverse
diet of higher nutritional quality, both from the harvested fruit andfrom foodstuffs that can be purchased with the income generated.In this sense, farming families may increase their food sovereignty
S.A. Rahman et al. / Land Use Policy 58 (2016) 152–164 161
Table 7Farmers’ interest in adopting agroforestry.
Variable Definition Expected sign Indonesia Bangladesh
Swidden Permanent monoculture Swiddenp-value p-value p-value
Age Decision maker’s age in years + 0.966 0.710 0.713Education Decision maker’s educational qualification (total years of schooling) + <0.001 0.923 0.339Land Household total land area (ha) + 0.477 0.057 0.222Household size Total number of people in the household (persons) + 0.907 0.210 0.559Income Household total income (US$) + 0.408 0.977 0.251
N
t(
tcssctatsoIr(2dficfT
ngsai1eacaciieiLaslepitnPttk
Credit = 1 if the farmer got credit from any sources, and 0 otherwise
ote: Significant value at p < 0.05 is indicated in bold.
hrough improved access to healthy and culturally appropriate foodVira et al., 2015; Edelman et al., 2014).
The higher establishment costs of agroforestry systems thanraditional agricultural alternatives indicated by the present studyan be attributed to their distinction from established routines ofeasonal farming (Rahman et al., 2008). All of the farmers in ourtudy site are poor17 (Table 2), therefore initial capital supportould be helpful to facilitate local adoption of agroforestry. Fur-hermore, the farmers do not have full tenure rights to the lands it is owned by the state (Table 1). Therefore, swidden farmersend to establish many small swidden plots across the landscape topread risk16 (Fig. 3), and this practice is viewed as a major causef tropical deforestation (Peng et al., 2014; Rahman et al., 2012).n contrast, agroforestry tends to be established in larger plots,eflecting the greater investment by households in this longer-termmore permanent) farming practice (Rahman et al., 2014; Michon,005). Tenure security is an important factor influencing land useecisions (Rahman et al., 2007; Feder et al., 1988). To adopt agro-orestry instead of traditional seasonal cultivation, farmers need tonvest substantial amounts of financial and labor resources. Inse-ure land tenure constrains such investments and has inducedarmers to continue their traditional land use practices (Rasul andhapa, 2003).
To adopt tree-based agroforestry systems, farmers may alsoeed to develop a different set of skills, knowledge and technolo-ies (Schultz, 2016), and the present study did find evidence of atrong positive association between education level and interest indopting agroforestry within one group of farmers (those practic-ng swidden in Indonesia). Others (Roshetko et al., 2007a,b; Lipton,989 Binswanger and Mcintire, 2016) argue that smallholder farm-rs cannot use improved technology when structural constraintsre imposed by institutions. Institutions not only govern the pro-esses by which scientific and technical knowledge is created, butlso facilitate the introduction and use of new technology in agri-ultural production. The equally important role of infrastructure,ncluding transportation facilities and access to market centres,n facilitating land use change has been emphasised by Reardont al. (2001), Turkelboom et al. (1996) and Allan (1986) as theyncrease the potential income from new crops and technologies. Inampung, Indonesia a team of socioeconomic, forestry, horticulturend livestock specialists determined that smallholder agroforestryystems and the productivity of those systems are limited by aack of technical information, resources and consultation (Gintingst al., 1996). Experience from across Indonesia shows that farmers’revious agricultural knowledge, quality of land resources, prox-
mity to markets and level of support received (both technical andhrough policy) all play important roles in determining the tech-ology adopted and subsequent success (Roshetko et al., 2007a,b;otter and Lee, 1998; Gintings et al., 1996). Therefore, the motiva-
ion of self-interest − the desire to profit from their investment ofime and resources − is invaluable for farmers’ success, once skills,nowledge, and institutional support have been secured (Roshetko+ 0.331 0.498 0.160
et al., 2008; Rasul and Thapa, 2007). If these institutional and pol-icy requirements can be met, then agroforestry systems have greatpotential as a ‘land sharing’ option in the marginal farmlands thatefficiently combines provision of local food security and environ-mental services of benefit to a wider population, instead of the ‘landsparing’ separation of agriculture and forests (Lasco et al., 2014; vanNoordwijk et al., 2014).
5. Conclusions
The economic assessment of tree-based faming in our researchshows higher net present value than that of seasonal agriculturalsystems in both West Java and eastern Bangladesh. Trees also helpdiversify farm products, which can potentially improve householdnutrition and welfare. In both locations, agroforestry is a practicethat has already been adopted by some households and this estab-lishes the set of tree species that are popular in each location toincorporate into food-crop-based agricultural systems. This repre-sents diversification of farming based on a combination of locallyfavoured tree and agricultural crops. Nonetheless, the cultural valueof retaining the practice of seasonal agriculture with a narrowset of traditional subsistence food crops still has the potential toinhibit farm diversification through agroforestry. This resistance tochanging farming practice is likely to be reinforced by the inabil-ity of many households to cope with the short-term loss of foodcrop productivity during the tree crop establishment phase, beforetree products can be harvested resulting in longer-term net ben-efits. Insecurity of land tenure compounds this risk. Therefore, toimplement such an initiative on the ground, a strong and long-term institutional framework is needed to provide more secureland tenure, and short-term technical and financial support (ini-tial capital provided by NGO and Government agencies) during thetree establishment phase. The success of this framework will begreatly facilitated by the development and implementation of gov-ernment policy involving a broad cross-section of local people toincorporate their aspirations, and sensitivity to their cultural val-ues, in the planning and decision-making processes. This will alsorequire provision of technical extension based on expert knowledgeof tree planting and management, which is likely to benefit fromfurther research. Participatory research may play a particularlyvaluable role in the areas of plant breeding to match local needsand the ecological functioning of agroforestry systems (Witcombeet al., 1996). This could result in agricultural sovereignty and self-sufficiency being operationalized spontaneously by the farmers ina smallholder tree-based farming environment that could lead toincreases in tree cover in the agricultural landscape.
Acknowledgements
This work is funded by Forest and Nature for Society (FONASO,initiated by the Erasmus Mundus programme of the EuropeanCommission to enhance and promote European higher education
1 Use Policy 58 (2016) 152–164
tRowJeta
AV
A
aHita
atttTosb
TYvc
m
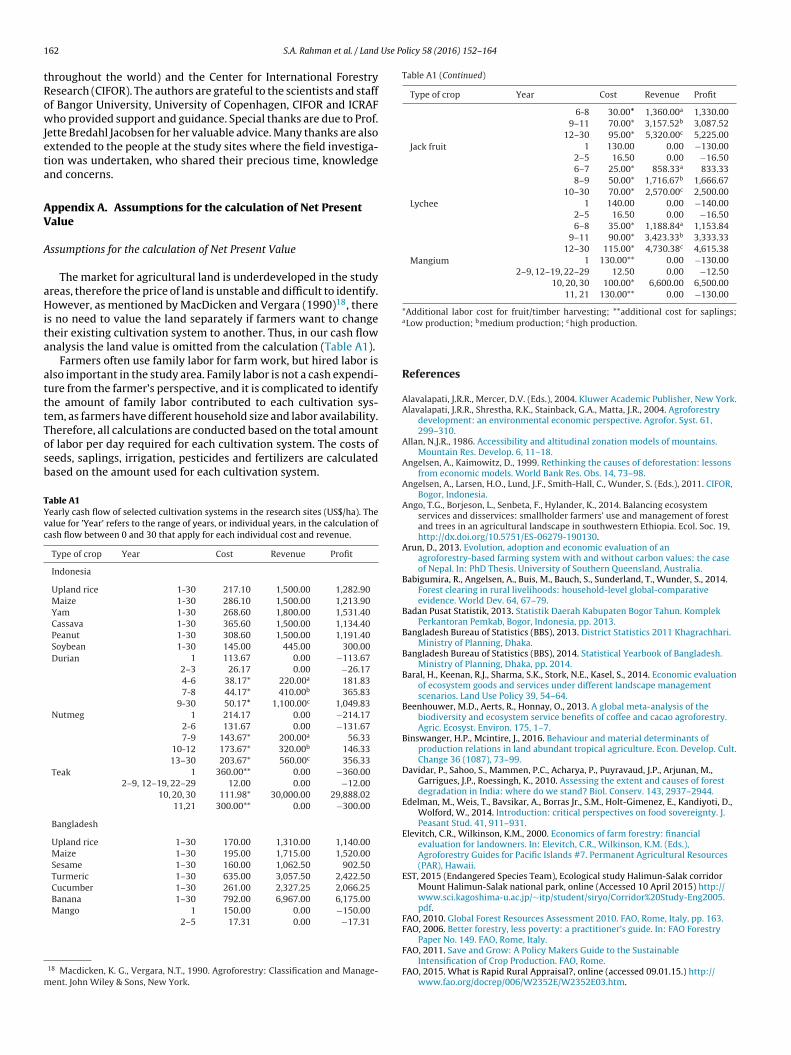
Table A1 (Continued)
Type of crop Year Cost Revenue Profit
6-8 30.00* 1,360.00a 1,330.009–11 70.00* 3,157.52b 3,087.52
12–30 95.00* 5,320.00c 5,225.00Jack fruit 1 130.00 0.00 −130.00
2–5 16.50 0.00 −16.506–7 25.00* 858.33a 833.338–9 50.00* 1,716.67b 1,666.67
10–30 70.00* 2,570.00c 2,500.00Lychee 1 140.00 0.00 −140.00
2–5 16.50 0.00 −16.506–8 35.00* 1,188.84a 1,153.84
9–11 90.00* 3,423.33b 3,333.3312–30 115.00* 4,730.38c 4,615.38
Mangium 1 130.00** 0.00 −130.002–9, 12–19, 22–29 12.50 0.00 −12.50
10, 20, 30 100.00* 6,600.00 6,500.0011, 21 130.00** 0.00 −130.00
*Additional labor cost for fruit/timber harvesting; **additional cost for saplings;
62 S.A. Rahman et al. / Land
hroughout the world) and the Center for International Forestryesearch (CIFOR). The authors are grateful to the scientists and stafff Bangor University, University of Copenhagen, CIFOR and ICRAFho provided support and guidance. Special thanks are due to Prof.
ette Bredahl Jacobsen for her valuable advice. Many thanks are alsoxtended to the people at the study sites where the field investiga-ion was undertaken, who shared their precious time, knowledgend concerns.
ppendix A. Assumptions for the calculation of Net Presentalue
ssumptions for the calculation of Net Present Value
The market for agricultural land is underdeveloped in the studyreas, therefore the price of land is unstable and difficult to identify.owever, as mentioned by MacDicken and Vergara (1990)18, there
s no need to value the land separately if farmers want to changeheir existing cultivation system to another. Thus, in our cash flownalysis the land value is omitted from the calculation (Table A1).
Farmers often use family labor for farm work, but hired labor islso important in the study area. Family labor is not a cash expendi-ure from the farmer’s perspective, and it is complicated to identifyhe amount of family labor contributed to each cultivation sys-em, as farmers have different household size and labor availability.herefore, all calculations are conducted based on the total amountf labor per day required for each cultivation system. The costs ofeeds, saplings, irrigation, pesticides and fertilizers are calculatedased on the amount used for each cultivation system.
able A1early cash flow of selected cultivation systems in the research sites (US$/ha). Thealue for ’Year’ refers to the range of years, or individual years, in the calculation ofash flow between 0 and 30 that apply for each individual cost and revenue.
Type of crop Year Cost Revenue Profit
Indonesia
Upland rice 1-30 217.10 1,500.00 1,282.90Maize 1-30 286.10 1,500.00 1,213.90Yam 1-30 268.60 1,800.00 1,531.40Cassava 1-30 365.60 1,500.00 1,134.40Peanut 1-30 308.60 1,500.00 1,191.40Soybean 1-30 145.00 445.00 300.00Durian 1 113.67 0.00 −113.67
2–3 26.17 0.00 −26.174-6 38.17* 220.00a 181.837-8 44.17* 410.00b 365.83
9-30 50.17* 1,100.00c 1,049.83Nutmeg 1 214.17 0.00 −214.17
2-6 131.67 0.00 −131.677-9 143.67* 200.00a 56.33
10-12 173.67* 320.00b 146.3313–30 203.67* 560.00c 356.33
Teak 1 360.00** 0.00 −360.002–9, 12–19, 22–29 12.00 0.00 −12.00
10, 20, 30 111.98* 30,000.00 29,888.0211,21 300.00** 0.00 −300.00
Bangladesh
Upland rice 1–30 170.00 1,310.00 1,140.00Maize 1–30 195.00 1,715.00 1,520.00Sesame 1–30 160.00 1,062.50 902.50Turmeric 1–30 635.00 3,057.50 2,422.50
Cucumber 1–30 261.00 2,327.25 2,066.25Banana 1–30 792.00 6,967.00 6,175.00Mango 1 150.00 0.00 −150.002–5 17.31 0.00 −17.31
18 Macdicken, K. G., Vergara, N.T., 1990. Agroforestry: Classification and Manage-ent. John Wiley & Sons, New York.
aLow production; bmedium production; chigh production.
References
Alavalapati, J.R.R., Mercer, D.V. (Eds.), 2004. Kluwer Academic Publisher, New York.Alavalapati, J.R.R., Shrestha, R.K., Stainback, G.A., Matta, J.R., 2004. Agroforestry
development: an environmental economic perspective. Agrofor. Syst. 61,299–310.
Allan, N.J.R., 1986. Accessibility and altitudinal zonation models of mountains.Mountain Res. Develop. 6, 11–18.
Angelsen, A., Kaimowitz, D., 1999. Rethinking the causes of deforestation: lessonsfrom economic models. World Bank Res. Obs. 14, 73–98.
Angelsen, A., Larsen, H.O., Lund, J.F., Smith-Hall, C., Wunder, S. (Eds.), 2011. CIFOR,Bogor, Indonesia.
Ango, T.G., Borjeson, L., Senbeta, F., Hylander, K., 2014. Balancing ecosystemservices and disservices: smallholder farmers’ use and management of forestand trees in an agricultural landscape in southwestern Ethiopia. Ecol. Soc. 19,http://dx.doi.org/10.5751/ES-06279-190130.
Arun, D., 2013. Evolution, adoption and economic evaluation of anagroforestry-based farming system with and without carbon values: the caseof Nepal. In: PhD Thesis. University of Southern Queensland, Australia.
Babigumira, R., Angelsen, A., Buis, M., Bauch, S., Sunderland, T., Wunder, S., 2014.Forest clearing in rural livelihoods: household-level global-comparativeevidence. World Dev. 64, 67–79.
Badan Pusat Statistik, 2013. Statistik Daerah Kabupaten Bogor Tahun. KomplekPerkantoran Pemkab, Bogor, Indonesia, pp. 2013.
Bangladesh Bureau of Statistics (BBS), 2013. District Statistics 2011 Khagrachhari.Ministry of Planning, Dhaka.
Bangladesh Bureau of Statistics (BBS), 2014. Statistical Yearbook of Bangladesh.Ministry of Planning, Dhaka, pp. 2014.
Baral, H., Keenan, R.J., Sharma, S.K., Stork, N.E., Kasel, S., 2014. Economic evaluationof ecosystem goods and services under different landscape managementscenarios. Land Use Policy 39, 54–64.
Beenhouwer, M.D., Aerts, R., Honnay, O., 2013. A global meta-analysis of thebiodiversity and ecosystem service benefits of coffee and cacao agroforestry.Agric. Ecosyst. Environ. 175, 1–7.
Binswanger, H.P., Mcintire, J., 2016. Behaviour and material determinants ofproduction relations in land abundant tropical agriculture. Econ. Develop. Cult.Change 36 (1087), 73–99.
Davidar, P., Sahoo, S., Mammen, P.C., Acharya, P., Puyravaud, J.P., Arjunan, M.,Garrigues, J.P., Roessingh, K., 2010. Assessing the extent and causes of forestdegradation in India: where do we stand? Biol. Conserv. 143, 2937–2944.
Edelman, M., Weis, T., Bavsikar, A., Borras Jr., S.M., Holt-Gimenez, E., Kandiyoti, D.,Wolford, W., 2014. Introduction: critical perspectives on food sovereignty. J.Peasant Stud. 41, 911–931.
Elevitch, C.R., Wilkinson, K.M., 2000. Economics of farm forestry: financialevaluation for landowners. In: Elevitch, C.R., Wilkinson, K.M. (Eds.),Agroforestry Guides for Pacific Islands #7. Permanent Agricultural Resources(PAR), Hawaii.
EST, 2015 (Endangered Species Team), Ecological study Halimun-Salak corridorMount Halimun-Salak national park, online (Accessed 10 April 2015) http://www.sci.kagoshima-u.ac.jp/∼itp/student/siryo/Corridor%20Study-Eng2005.pdf.
FAO, 2010. Global Forest Resources Assessment 2010. FAO, Rome, Italy, pp. 163.FAO, 2006. Better forestry, less poverty: a practitioner’s guide. In: FAO Forestry
Paper No. 149. FAO, Rome, Italy.FAO, 2011. Save and Grow: A Policy Makers Guide to the Sustainable
Intensification of Crop Production. FAO, Rome.FAO, 2015. What is Rapid Rural Appraisal?, online (accessed 09.01.15.) http://
www.fao.org/docrep/006/W2352E/W2352E03.htm.

Use Po
F
G
G
G
G
H
H
I
I
J
L
L
L
LL
M
MM
O
P
P
P
P
R
R
R
R
S.A. Rahman et al. / Land
eder, G., Onchan, T., Chalamwong, Y., 1988. Land policies and farm performance inThailands forest reserve areas. Econ. Dev. Cult. Change 36, 483–501.
aludra, G., Nurhawan, R., Aprianto, A., Sunarya, Y., Engkus, 2008. The lastremnants of mega biodiversity in west java and banten: an in-depthexploration of RaTA (Rapid land tenure assessment) in mount halimun-Salaknational park, Indonesia. In: Working Paper No 69. World Agroforestry Centre,Bogor, Indonesia.
intings, A.N., Anwar, C., Samsudin, I., Siregar, M.E., Punama, B.M., Kasirin, 1996.Agroforestry characterization in pakuan ratu and tulang bawang tengah, northlampung district, lampung. In: van Noordwijk, M., Tomich, T., Garrity, D., Fagi,A. (Eds.), Proceedings of a Workshop: Alternatives to Slash-and-Burn Researchin Indonesia. Bogor, Indonesia, 6–9 June 1995, ASB-Indonesia Report, Number6. ASB-Indonesia and International Centre for Research in Agroforestry(ICRAF), Bogor, Indonesia, pp. 59–68.
rossman, J.J., 2015. Ecosystem service trade-offs and land use among smallholderfarmers in eastern Paraguay. Ecol. Soc. 20, http://dx.doi.org/10.5751/es-06953-200119.
yau, A., Franzel, S., Chiatoh, M., Nimino, G., Owusu, K., 2014. Collective action toimprove market access for smallholder producers of agroforestry products:key lessons learned with insights from Cameroons experience. Curr. Opin.Environ. Sustain. 6, 68–72.
ersperger, A.M., Gennaio, M.P., Verburg, P.H., Burgi, M., 2010. Linking land changewith driving forces and actors: four conceptual models. Ecol. Soc. 15, 1.
osonuma, N., Herold, M., Sy, V.D., Fries, R.S.D., Brockhaus, M., Verchot, L.,Angelsen, A., Romijn, E., 2012. An assessment of deforestation and forestdegradation drivers in developing countries. Environ. Res. Lett. 7, 4009.
LEIA, 2000. Monocultures Towards Sustainability, online (accessed 01.07.15.)http://www.agriculturesnetwork.org/magazines/global/monocultures-towards-sustainability/monocultures-towards-sustainability-editorial.
dol, T., Haggar, J., Cox, L., 2011. Ecosystem services from smallholder forestry andagroforestry in the tropics. In: Campbell, W.B., Lopes, O.S. (Eds.), IntegratingAgriculture, Conservation and Ecotourism: Examples from the Field. Springer,New York.
ose, S., 2009. Agroforestry for ecosystem services and environmental benefits: anoverview. Agrofor. Syst. 76, 1–10.
abriere, N., Laumonier, Y., Locatelli, B., Vieilledent, G., Comptour, M., 2015.Ecosystem services and biodiversity in a rapidly transforming landscape inNorthern Borneo. PLoS One 10, 1–18.
ambin, E.F., Geist, H.J., Lepers, E., 2003. Dynamics of land-use and land-coverchange in tropical regions. Annu. Rev. Environ. Resour. 28, 205–241.
asco, R.D., Delfino, R.J.P., Espaldon, M.L.O., 2014. Agroforestry systems: helpingsmallholders adapt to climate risks while mitigating climate change. WIREsClim. Change 5, 825–833.
aurance, W.F., 2007. Forests and floods. Nature 449, 409–410.ipton, M., 1989. Agriculture, rural people, the state and the surplus in some Asian
countries: thoughts on some implications of three recent approaches in socialscience. World Develop. 17, 1553–1571.
cNeely, J., Schroth, G., 2006. Agroforestry and biodiversityconservation—traditional practices present dynamics, and lessons for thefuture. Biodivers. Conserv. 15, 549–554.
ichon, G. (Ed.), 2005. IRD, CIFOR and ICRAF, Indonesia.wase, W., Sefasi, A., Njoloma, J., Nyoka, B.I., Manduwa, D., Nyaika, J., 2015. Factors
affecting adoption of agroforestry and evergreen agriculture in southernAfrica. Environ. Nat. Res. Res. 5, 148–157.
ladele, A.T., Popoola, L., 2013. Economic Analysis of growing ginger (Zingiberofficinale) under teak (Tectona grandis) canopy in southwest Nigeria. J. For. Sci.29, 147–156.
annell, D.J., 2009. Enhancing the environmental benefits of agroforestry throughgovernment policy mechanisms. In: Nuberg, I., George, B., Reid, R. (Eds.),Agroforestry for Natural Resource Management. CSIRO Publishing,Collingwood, Australia, pp. 309–322.
eng, L., Zhiming, F., Luguang, J., Chenhua, L., Jinghua, Z., 2014. A review of swiddenagriculture in Southeast Asia. Remote Sens. 6, 1654–1683.
erfecto, I., Vandermeer, J., 2008. Biodiversity conservation in tropicalagroecosystems: a new conservation paradigm. Ann. N. Y. Acad. Sci. 1134,173–200.
otter, L., Lee, J., 1998. Tree planting in Indonesia: trends, impacts and directions.In: CIFOR Occasional Paper No. 18. Center for International Forestry Research(CIFOR), Bogor, Indonesia.
ahman, S.A., Rahman, F., 2011. Managing Forest at a Landscape Scale: ReconcilingSmallholder Forest Culture in the Uplands of Eastern Bangladesh Lap LambertAcademic Publishing. Saarbrucken, Germany.
ahman, S.A., Rahman, M.F., Codilan, A.L., Farhana, K.M., 2007. Analysis of theeconomic benefits from systematic improvements to shifting cultivation andits evolution towards stable continuous agroforestry in the upland of easternBangladesh. Int. For. Rev. 9, 536–547.
ahman, S.A., de Groot, W., Snelder, D.J., 2008. Exploring the agroforestry adoptiongap: financial and socioeconomics of litchi-based agroforestry by smallholdersin Rajshahi (Bangladesh). In: Snelder, D.J., Lasco, R.D. (Eds.), Smallholder TreeGrowing for Rural Development and Environmental Services: Lessons fromAsia Advances in Agroforestry Series, vol. 5. Springer, Netherlands, pp.
227–244.ahman, S.A., Rahman, M.F., Sunderland, T., 2012. Causes and consequences ofshifting cultivation and its alternative in the hill tracts of eastern Bangladesh.Agrofor. Syst. 84, 141–155.
licy 58 (2016) 152–164 163
Rahman, S.A., Rahman, M.F., Sunderland, T., 2014. Increasing tree cover indegrading landscapes: ‘integration’ and ‘intensification’ of smallholder forestculture in the Alutilla valley Matiranga, Bangladesh. Small-Scale For. 13,237–249.
Rasul, G., Thapa, G.B., 2003. Shifting cultivation in the mountains of South andsoutheast Asia: regional patterns and factors influencing the change. LandDegrad. Dev. 14, 495–508.
Rasul, G., Thapa, G.B., 2006. Financial and economic suitability of agroforestry as analternative to shifting cultivation: the case of the Chittagong hill tracts,Bangladesh. Agric. Syst. 91, 29–50.
Rasul, G., Thapa, G.B., 2007. The impact of policy and institutional environment oncosts and benefits of sustainable agricultural land uses: the case of theChittagong Hill Tracts, Bangladesh. Environ. Manage. 40, 272–283.
Reardon, T., Barret, C.B., Kelly, B., Savadogo, K., 2001. Sustainable versusunsustainable agricultural intensification in Africa: focus on policy reformsand market conditions. In: Lee, R., Barret, C.B. (Eds.), Tradeoffs and Synergies?Agricultural Intensification, Economic Development and the Environment.CABI publishing, UK, pp. 365–381.
Roshetko, J.M., Lasco, R.D., Delos, A.M.D., 2007a. Smallholder agroforestry systemsfor carbon storage. Mitig. Adapt. Strategies Global Change 12, 219–242.
Roshetko, J.M., Nugraha, E., Tukan, J.C.M., Manurung, G., Fay, C., van Noordwijk, M.,2007b. Agroforestry for livelihood enhancement and enterprise development.In: Djoeroemana, S., Myers, B., Russell-Smith, J., Blyth, M., Salean, I.E.T. (Eds.),Integrated Rural Development in East Nusa Tenggara, Indonesia (ACIARProceedings NO. 126), pp. 137–148.
Roshetko, J.M., Snelder, S.D., Lasco, R.D., van Noordwijk, M., 2008. Futurechallenge: a paradigm shift in the forestry sector. In: Snelder, D.J., Lasco, R.D.(Eds.), Smallholder Tree Growing for Rural Development and EnvironmentalServices: Lessons from Asia. Advances in Agroforestry Series, vol. 5. Springer,The Netherlands, pp. 453–485.
Roshetko, J.M., Rohadi, D., Perdana, A., Sabastian, G., Nuryartono, N., Pramono, A.A.,Widyani, N., Manalu, P., Fauzi, M.A., Sumardamto, P., Kusumowardhani, N.,2013. Teak agroforestry systems for livelihood enhancement, industrial timberproduction, and environmental rehabilitation. For. Trees Livelihoods 22,251–256.
Roshetko, J.M., 2013. Smallholder tree farming systems for livelihoodenhancement and carbon storage. In: PhD Thesis. Department of Geosciencesand Natural Resource Management, University of Copenhagen, Denmark.
Scherr, S.J., McNeely, J.A., 2008. Biodiversity conservation and agriculturalsustainability: towards a new paradigm of ecoagriculture landscapes. Philos.Trans. R. Soc. B 363, 477–494.
Schroth, G., de Fonseca, G.A.B., Harvey, C.A., Gascon, C., Vasconcelos, H.L., Izac,A.M.N., 2004. Agroforestry and Biodiversity Conservation in TropicalLandscapes. Island Press, Washington, DC.
Schultz, T.W., 2016. Transforming Traditional Agriculture. Yale University Press,New York.
Sinare, H., Gordon, L.J., 2015. Ecosystem services from woody vegetation onagricultural lands in Sudano-Sahelian West Africa. Agric. Ecosyst. Environ. 200,186–199.
Singh, A.K., Kumar, P., Singh, R., Rathore, N., 2012. Dynamics of tree-crop inter facein relation to their influence on microclimatic changes—a review. HortFloraRes. Spectr. 1, 193–198.
Snelder, S.D., Lasco, R.D., 2008. Smallholder tree growing in south and southeastasia. In: Snelder, D.J., Lasco, R.D. (Eds.), Smallholder Tree Growing for RuralDevelopment and Environmental Services: Lessons from Asia. Advances inAgroforestry Series, vol. 5. Springer, The Netherlands, pp. 3–33.
Steffan-Dewenter, I., Kessler, M., Barkmann, J., Bos, M.M., Buchori, D., Erasmi, S.,Faust, H., Gerold, G., Glenk, K., Gradstein, S.R., Guhardja, E., Harteveld, M.,Hertel, D., Höhn, P., Kappas, M., Köhler, S., Leuschner, C., Maertens, M.,Marggraf, R., Migge-Kleian, S., Mogea, J., Pitopang, R., Schaefer, M., Schwarze,S., Sporn, S.G., Steingrebe, A., Tjitrosoedirdjo, S.S., Tjitrosoemito, S., Twele, A.,Weber, R., Woltmann, L., Zeller, M., Tscharntke, T., 2007. Tradeoffs betweenincome biodiversity, and ecosystem functioning during tropical rainforestconversion and agroforestry intensification. Proc. Natl. Acad. Sci. 104,4973–4978.
Tiwari, T.P., Brook, R.M., Wagstaff, P., Sinclair, F.L., 2012. Effects of lightenvironment on maize in hillside agroforestry systems of Nepal. Food Secur. 4,103–114.
Tremblay, S., Lucotte, M., Reveret, J.P., Davidson, R., Mertens, F., Passos, C.J.S.,Romana, C.A., 2015. Agroforestry systems as a profitable alternative to slashand burn practices in small-scale agriculture of the Brazilian Amazon. Agrofor.Syst. 89, 193–204.
Tscharntke, T., Clough, Y., Bhagwat, S., Buchori, D., Faust, H., Hertel, D., Hölscher, D.,Juhrbandt, J., Kessler, M., Perfecto, I., Scherber, C., Schroth, G., Veldkamp, E.,Wanger, T.C., 2011. Multifunctional shade-tree management in tropicalagroforestry landscapes—a review. J. Appl. Ecol. 48, 619–629.
Turkelboom, F., Van, K.K., Ongprasert, S., Sutigoolabud, P., Pelletier, J., The changinglandscape of the Northern Thai hills: adaptive strategies to increasing landpressure Mountain Mainland Southeast Asia in Transition Chiang MaiUniversity Thailand 1996; 436–446.
UEA, 2015. Environmental Justice: Why Compensation is Not Enough, online
(accessed 09.07.15.) https://www.uea.ac.uk/international-development/dev-blog/home/-/asset publisher/1I1JoAAhCZsR/blog/id/3529911.Vaast, P., Somarriba, E., 2014. Trade-offs between crop intensification andecosystem services: the role of agroforestry in cocoa cultivation. Agrofor. Syst.88, 947–956.

1 Use P
V
v
W
64 S.A. Rahman et al. / Land
ira, B., Agarwal, B., Jamnadass, R., Kleinschmit, D., McMullin, S., Mansourian, S.,Neufeldt, H., Parrotta, J.A., Sunderland, T., Wildburger, C., 2015. Forests, treesand landscapes for food security and nutrition. In: Vira, B., Wildburger, C.,Mansourian, S. (Eds.), Forests, Trees and Landscapes for Food Security andNutrition. A Global Assessment Report. IUFRO World Series, vol. 33. IUFRO,Vienna, pp. 14–24.
an Noordwijk, M., Bizard, V., Wangpakapattanawong, P., Tata, H.L., Villamor, G.B.,
Leimona, B., 2014. Tree cover transitions and food security in Southeast Asia.Glob. Food Secur. 3, 200–208.iharto, M., Kusmana, C., Prasetyo, L.B., Partomihardjo, T., 2008. Tree diameterclass distribution in various vegetation types on mount Salak Bogor, WestBengal. Jurnal Ilmu Pertanian Indonesia 13, 95–102.
olicy 58 (2016) 152–164
Witcombe, J.R., Joshi, A., Joshi, K.D., Sthapit, B.R., 1996. Farmer participatory cropimprovement. i. Varietal selection and breeding methods and their impact onbiodiversity. Exp. Agric. 32, 445–460.
World Bank, 2015. World Bank’s $1.25/day Poverty Measure- Countering theLatest Criticisms, online (Accessed 05 May 2015) http://econ.worldbank.org/external/default/main?theSitePK=469382&contentMDK=22510787&menuPK=574960&pagePK=64165401&piPK=64165026.
Wood, S.L.R., Rhemtulla, J.M., Coomes, O.T., 2016. Intensification of tropicalfallow-based agriculture: trading-off ecosystem services for economic gain inshifting cultivation landscapes? Agric. Ecosyst. Environ. 215, 47–56.
Xu, J., 2011. China’s new forests aren’t as green as they seem. Nature 477, 371,http://dx.doi.org/10.1038/477371a.