land use classification mapping as a baseline input for ...º informe... · in reality, the...
TRANSCRIPT

1
Land Use Classification Mapping as a Baseline Input for Conservation Incentive Programs
Authors: Dr. Amy Rogers, Brittany Sprecher, and Laura Daly
ITTO Small Project RED SPD 055/11 Rev.4 (F)
Integrating Sustainable Livelihoods, Environmental Mortgages, and Science-based Reforestation for Tangible Forest Conservation Change in the Ecuadorian Chocó

2
Implementing institutions : Fundación Equilibrio Azul
Av Amazonas 2915 e Inglaterra, Esq
Edificio Inglaterra, Piso 2. Quito, Ecuador
Phone +593 22431097
Email [email protected]
Pinchot Institute for Conservation
1616 P St NW, Ste 100 Washington, DC 20036
Phone +1 (202)797-6580
Fax +1 (202)797-6583
Email [email protected]
Advanced Conservation Strategies
PO Box 1201, Midway, Utah 84049
Phone +1 (607)227-9768
Email [email protected]
Place and date : Esmeraldas, Ecuador; November 27, 2014
Disclaimer : Copyright © 2014
This Completion Report is part of ITTO RED-SPD
055/11 Rev.4(F):Integrating Sustainable Livelihoods,
Environmental Mortgages, and Science-based
Reforestation for Tangible Forest Conservation
Change in the Ecuadorian Chocó
Scientific & technical personnel : Amy Rogers, Brittany Sprecher, Laura Daly, and
that contributed to this report Cesar Castillo
Project number : RED SPD 055/11 Rev.4 (F)
Host government : Ecuador
Starting date of the project : August 28, 2012
Executing agency : Fundación Equilibrio Azul
Project coordinator : Dr. Amy E. Rogers
Duration of the project : 24 months

3
Table of Contents
Executive Summary .................................................................................................................... 4
1. Introduction ........................................................................................................................... 5
2. Applied Methodology ............................................................................................................ 8
3. Data Presentation ................................................................................................................. 11
4. Analysis & Interpretation ....................................................................................................... 11
5. Conclusions ............................................................................................................................ 18
6. Recommendations .................................................................................................................. 19
7. Implications for Practice .......................................................................................................... 19
Bibliography ................................................................................................................................... 20
Annex 1. Land surveyed in Mono Bravo pilot community ............................................................... 21
Annex 2. Land surveyed in Guayacan pilot community .................................................................. 22
Annex 3. Design guidelines for value transfer mechanisms for incentive-based pro-poor biodiversity
conservation schemes ...................................................................................................................... 23

4
Executive Summary
The intent of this technical report is to provide a detailed illustration of how GIS land use classification can be applied to facilitate effective incentive program design. In reality, the relative success of each conservation incentive program will be fundamentally dependent on how well its particular strategic approach responds to the specifics of local livelihood dynamics, deforestation drivers, existing economic incentives, and culture. The environmental mortgages concept leverages affordable investments in sustainable, low-impact livelihoods to create perpetual incentives for natural resource conservation by providing forest-dwelling communities with access to specific livelihood improvements in exchange for community-level conservation commitments. This ITTO Small Project sought to comprehensively develop and pilot the environmental mortgage via its application to forest-dwelling communities in the Mache-Chindul Ecological Reserve of Esmeraldas Province, Ecuador. Here, we discuss one important input in program design—GIS land use classification mapping—as a means of accurately quantifying community forest holdings, preventing perverse incentives for further deforestation, estimating parameters for specific livelihood improvement services, and providing a template for the enrollment and monitoring of forest assets. The specific aims of this land use classification analysis were as follows:
1. to determine total forest holdings in pilot communities as a prerequisite to calculations of required conserved forest for the program's conservation–livelihood trades, based on each community's maximum "environmental asset" potential;
2. to document standing forest before the pilot implementation phase, as a means of preventing perverse incentives for more deforestation once the livelihood chosen for revamping (cacao) becomes economically viable;
3. to quantify the extent of existing cacao plantations in the community for later coupling with in-situ inspections to accurately estimate current and potential harvest production volumes; this information would be used to determine whether sustainable cacao income alone can replace traditional logging + cacao combined income;
4. to calculate land area comprised by degraded forest that could be later enrolled in the program as environmental asset "extensions" once all primary forest has been committed:
5. to establish a baseline template of forests that can be used when mapping and monitoring areas enrolled in the program.
GPS data was collected for a total of 73 properties comprised by 2,088 hectares, over a ten month period from July 2013 through April 2014, in two pilot communities. All surveyed areas were categorized as one of three land uses: primary rainforest, cacao plantation, and degraded forest; transitions from one land use category to another were coded as waypoints. GPS data was then uploaded, tracks and waypoints converted into shapefile format, and imported to ArcGIS 10 using the projection WGS 84/UTM Zone 17 South. Land cover area for all properties and the terrain types contained within was calculated using the ArcGIS “Calculate Geometry” tool. Total community land holdings were tallied and used to determine the number of hectares that represented a quarter of community territory; this 25% was the amount of conserved forest required in exchange for the first and most substantive livelihood improvement package sponsored under the environmental mortgages incentive program. Proportional similarities in land use composition were striking between the two pilot communities, particularly in light of ethnic and cultural differences. In addition, both communities were willing to commit a full quarter of their territorial holdings (representing nearly half of their remaining forest assets) to conservation in exchange for the livelihood benefits of a direct market connection, the infrastructure required to attain export-level quality and volume, and legal registry as an autonomous producer's association. This finding confirms that forest-dwelling communities understand the long-term value of a sustainable and community-based livelihood option.

5
1. Introduction
The design of conservation incentive programs—and in particular, innovative approaches to conservation
incentives—is a fundamentally iterative process, the success or failure of which hinges upon how well incentive
design responds to the case-specific circumstances driving environmental degradation in the area to be conserved.
Adaptive design is of paramount importance. Whereas it is oftentimes possible to gain an informative picture of a
problem's principal components during the pre-project phase through secondary research and straightforward
preliminary observations, there are other critical components that require a deeper level of investigation (typically, via
primary research) in order to accurately determine the appropriate incentive design. Here, we discuss one such
component—GIS land use classification mapping—as a means of accurately quantifying community forest holdings,
preventing perverse incentives for further deforestation, estimating parameters for specific livelihood improvement
services, and providing a template for the enrollment and monitoring of forest assets.
The Problem
In low-income nations, efforts to alleviate poverty often produce incentives to degrade the local environment, and
efforts to protect the environment often fail to improve livelihoods. Current strategies for tropical forest conservation
have struggled with this challenge. Now commonly implemented in developing nations, ‘indirect approaches’ to
conservation promote alternative livelihoods that reduce the use of local natural resources, such as non-timber forest
product marketing, sustainable agriculture, and eco-tourism. However, on-the-ground efforts during the past several
decades have revealed that alternative livelihoods do not guarantee a concurrent decrease in environmental
degradation; most often, these approaches have failed to protect biodiversity and ecosystems to the extent needed
(Agrawal and Redford 2006). Recently, incentive payment approaches have been advocated and explored as a more
direct means to environmental protection, including payment for ecosystem services, restricted land easements, and
performance-based payments for biodiversity. The last of these approaches, such as paying directly for number of
forest hectares conserved in critical climate refugia, is the most direct and cost-effective way to protect an
environmental asset.
Incentive payments, however, are not livelihoods, and do not take into account the development needs of local
inhabitants (Agrawal and Redford 2006). Rather, they are short-term payments (typically annual) that rely on a long-
term funding stream, translating into a high-risk scenario for ephemeral incentives (West 2007). Unless continued,
these lump or one-time payments do not create sustainable incentives for the long-term protection of an
environmental asset (Kinch 2006). Direct payment schemes can also be complicated by other factors, such as ethical
issues due to economic differences between “buyer” and “seller” nations. In some cases, government policies can
complicate or prohibit direct payment schemes. Lastly, these schemes often require legal land tenure for payments—

6
a condition that does not coincide with the reality of natural resource expanses in most developing countries, where
the poorest of the population settle out of economic necessity.
An alternative approach that circumvents each of these loopholes is the environmental mortgage—a strategy that
leverages affordable investments in sustainable, low-impact livelihoods to create perpetual incentives for natural
resource conservation by providing forest-dwelling communities with access to specific livelihood improvement needs
in exchange for community-level conservation commitments (Mandel et al. 2009). This model directly addresses the
three causes identified by the REDDES Thematic Programme Document as leading to a reduced quality and quantity
of forest environmental services in ITTO producing member countries: persistent poverty coupled with lack of
alternative livelihoods, insecure land tenure and inadequate financing mechanisms for SFM or reforestation, and a
fundamental disconnect between compensation for environmental services and the communities that maintain them
(ITTO 2009). This ITTO Small Project sought to comprehensively develop and pilot the environmental mortgages
concept via its application to forest-dwelling communities in the Mache-Chindul Ecological Reserve of Esmeraldas
Province, Ecuador.
Origins of Mache Chindul Reserve
Starting in 1964, the area now comprised by Mache-Chindul Reserve was targeted as part of an Agrarian Reform
program aimed at converting unproductive lands into agriculture. Under this program, colonization was incentivized
via the promise of legal land title for double the area that a colonist ‘worked’ (i.e. deforested). Colonists rushed into
the area from neighboring Manabí province, where a majority of forested lands had already been converted to
pasture. The colonization/deforestation process was allowed to proceed for several decades before the Ecuadorian
government began to receive international pressure to conserve the area's Chocó forests due to their extraordinary
levels of endemism (Dodson & Gentry 1991). Ecuador’s response was to “erase” the agency that had made the land
title promises and declare the 121,000-hectare area an Ecological Reserve in 1996. Most of the inhabitants that
arrived during the colonization process remain, dispersed across the reserve in an estimated 80+ small villages
(MAE 2005).
Landholders, with the exception of a small proportion that acquired their legal titles early on, have been told
repeatedly by the Ministry of Environment that no individual titles will be given, but the Reserve’s management plan
affords a formalized, albeit vague "recognition" of the communities as a whole. This management plan, finalized
around 2007 and now out of date (MAE 2005), is the area's only guiding document. Economic activities are severely
constrained within reserve boundaries, with cacao and timber currently representing the two predominant sources of
the cash economy that characterizes most remote rainforest communities.

7
Deforestation Drivers in Ecuador
According to the FAO, approximately 9,865,000 hectares (35.6%) of Ecuador's surface area was forested in 2010
(FAO 2010). Of this, just under half is classified as primary forest. During the past two decades, Ecuador lost an
average of 1.43% of its forests per year, tallying up to 28.6% of the total (Butler 2006). Approximately 80% of this
deforestation took place on the coast, with selective logging heavily affecting what remains (as a benchmark, up to
47% estimated to be affected in 1993; Butler 2006). Of the coast, Esmeraldas Province has the highest annual
deforestation rate (4.07%), with 674,953.50 hectares of remaining forest estimated in 2000 and between 13,735.30
and 27,470.60 hectares deforested every year since (Zambrano-Barragan, 2010). Compounding this problem is the
reality that conservation initiatives in the region are few and far between.
Much of the deforestation is indirectly caused by land tenure conflict--members of the country's poorest sector either
squat on, or buy without title, lands that they then proceed to deforest because a) due to their lack of legal collateral,
they have no funds for livelihood improvement options and agricultural mainstays all have periods of scarcity, b) it
has been culturally grilled into their consciousness that "unworked" land is free for anyone's taking, or c) they reason
that since it is a question of time until they are kicked off their land, efficient exploitation is the only economic strategy
that makes sense (Morales et al. 2010). All of the reserve communities that we interviewed described one or more of
these dynamics when discussing reasons for the need to deforest.
Low opportunity costs in northwest Ecuador incite further exploitation of forests as lands are clear-cut for
monocultures (primarily African Palm and eucalyptus) and pastureland. The reason for this conversion is cited in
Mache Chindul's Management Plan, which describes average per-hectare land sale prices of $345 for pasture, $291
for cacao, and $272 for standing forest (MAE 2005). This began in the 1980s, when the opening of the Esmeraldas-
Borbon road initiated the sale of cacao to intermediaries (Dodson & Gentry 1991). By the 1990s the price of cacao
fell significantly on what were already aging cacao plantations, many of which were destroyed by the worst El Niño
episode in decades. The result: timber extraction replaced cacao as the region's predominant source of income
(Nelson & Galvez 2000). Compounded by the government's refusal to acknowledge the existence of communities in
the reserve at that time (including denial of all basic services), logging firms were soon welcomed as a means for
facilitating penetration roads.
Research Aim
The aim of this land use classification analysis was five-fold:
6. to determine total forest holdings in pilot communities as a prerequisite to calculations of required conserved
forest for the program's conservation–livelihood trades, based on each community's maximum
"environmental asset" potential;

8
7. to document standing forest before the pilot implementation phase, as a means of preventing perverse
incentives for more deforestation once the livelihood chosen for revamping (cacao) becomes economically
viable;
8. to quantify the extent of existing cacao plantations in the community for later coupling with in-situ
inspections to accurately estimate current and potential harvest production volumes; this information would
be used to determine whether sustainable cacao income alone can replace traditional logging + cacao
combined income;
9. to calculate land area comprised by degraded forest that could be later enrolled in the program as
environmental asset "extensions" once all primary forest has been committed:
10. to establish a baseline template of forests that can be used when mapping and monitoring areas enrolled in
the program.
2. Applied Methodology
Study Sites
After a four-month reconnaissance process in Mache-Chindul Reserve during which twelve candidate communities
were ultimately visited and interviewed, two communities were selected for participation in the environmental
mortgages pilot program. These two communities are located in the reserve's central-western interior, close to the
headwaters of the Sucio and Muisne rivers and bordering the reserve's core of intact forest (Figure 1). Guayacan and
Mono Bravo both shared each of the following four selection criteria:
Location within reserve boundaries
De facto stewardship of substantive areas of intact primary forest
A pre-existing focus on cacao as one of the community's predominant livelihoods
Pronounced social capital, or community cohesiveness
GPS Data Collection
GPS data was collected over a ten month period from July 2013 through April 2014. On each survey day, two project
technicians accompanied the property owners of adjacent lots on foot to register boundaries and record changes in
land use. This substantive ground-truthing period is attributable to the fact that terrain in both communities is often
comprised by steep and muddy forested slopes, interspersed with frequent narrow rocky drainages and cliffs. Each
individual property was recorded as a track on Garmin GPS MAP 62s internal memory. All surveyed areas were
categorized as one of three land uses: primary rainforest, cacao plantation, and degraded forest, and transitions from
one land use category to another were coded as waypoints stored in the GPS internal memory. Once the GPS
mapping of each property was completed, hand-drawn sketch of land use breakdowns and boundary landmarks was

9
Figure 1. Map of vegetation cover and land use classification in the 121,000-hectare Mache-Chindul Ecological
Reserve, circa 2004. Dark green areas represent remaining forest, and yellow arrows indicate environmental
mortgage pilot communities. Adapted from Alianza Jatun Sacha/CDC – Ecuador source data.

10
created in a field notebook with the owner present; this step was implemented to aid in the conceptual grasp of GIS-
produced maps at a later date, and to accurately keep track of waypoint sequences and neighboring property
ownership boundaries.
GIS Analyses
GPS data was then uploaded, tracks and waypoints were converted into shapefile format, and imported to ArcGIS 10
using the projection WGS 84/UTM Zone 17 South. Polygons representing each property were created using track
data, and subsequently divided into terrain types using waypoint data. Each polygon added to the property database
was first cleaned and examined for topological errors. Land cover area for all properties and the terrain types
contained within was calculated using the ArcGIS “Calculate Geometry” tool in the projection UTM Zone 17 South.
Before finalizing property boundaries in the master database, each individual map was reviewed by the pilot
community's elected president for accuracy.
Incentive Program Applications
Total community land holdings were tallied and used to determine the number of hectares that represented a quarter
of community territory; this 25% was the requisite amount of conserved forest in exchange for the first and most
substantive livelihood improvement package sponsored under the environmental mortgages pilot program. A printed
and laminated individual property map was created for each community member that allowed their land to be
surveyed. For both Guayacan and Mono Bravo, this was the first controlled quantification of individual land holdings
to have been conducted. Because not all community members were willing to map their properties, additional
deductive measures were required in order to estimate total forest holdings: for "missing" properties, neighboring
property borders were used to opportunistically identify transitions to and from rainforest terrain, and an additional
map including non-surveyed properties was pieced together.
Individual maps were used by community members participating in the environmental mortgages program to
determine the number of hectares that each was going to contribute toward the first conservation-livelihood trade.
Once the community collectively reached the required number of conserved forest hectares, areas designated by
each participant were ground-truthed as individual tracks on the GPS internal memory, correcting for over- and
under-estimates in enrolled area boundaries by using the Garmin GPS Map 62s "calculate area" function while in the
field. Finally, a community-level map of all surveyed properties and major topographical landmarks was presented to
the local governing body of each pilot community as a planning resource.

11
3. Data Presentation
A total of 73 properties comprised by 2,088 hectares were surveyed in the pilot communities of Mono Bravo and
Guayacan. Rainforest was by far the predominant terrain type in the two territories, totaling 1,380 hectares (66.1% of
all surveyed land), with degraded forest as the second-most common terrain type at 514 hectares total (Table 1).
Despite the fact that Mono Bravo's mapped properties represented a mere third of the territory mapped in Guayacan
(Figure 2), the proportional representation of each terrain type was very similar in the two communities. Surveyed
rainforest represented 68.5% of Mono Bravo's mapped territory and 65.3% in Guayacan, cacao plantations
represented 12.0% in Mono Bravo and 8.4% in Guayacan, and degraded forest represented 19.5% and 26.4%,
respectively (Table 1).
Thirty-five properties total were mapped
and classified according to land use
composition in the community of Mono
Bravo (Figure 3), and an additional 24
properties were mapped via opportunistic
deduction (Figure 4) in order to arrive at a
total territory size of 817 hectares. Forty-
three properties total were mapped and
classified according to land use composition in the community of Guayacan (Figure 5), with an additional nine
properties mapped via opportunistic deduction (Figure 6) in order to arrive at a total territory size of 2,342 hectares.
Again, proportions were very comparable between the two communities, with 65.4% of the total territory surveyed in
Mono Bravo and 66.4% of the total territory surveyed in Guayacan.
Total territory size was then employed to calculate a 25% requirement of conserved forest as the prerequisite for
program participation in each community; 200 hectares was settled upon as the enrollment total for Mono Bravo and
600 hectares for Guayacan. Community members referred to their individual property maps to assess how many
forest hectares each could feasibly contribute to the collective goal based on a new understanding of asset
distributions (forest, cacao, and degraded forest; Figure 7).
4. Analysis & Interpretation
Proportional similarities in land use composition were striking between the two pilot communities, particularly in light
of ethnic and cultural differences: Mono Bravo is dominated by Afro-ecuadorian inhabitants that focus almost entirely
on cacao and timber for income, while Guayacan is dominated by Mestizo inhabitants that include cattle ranching as
a third source of income. The fact that even the proportion of community lands that were willingly offered up for
Table 1. Summary of land use composition surveyed in the pilot communities of Mono Bravo and Guayacan, Mache-Chindul Ecological Reserve, Ecuador. Hectares, followed by percentage of each community's surveyed total (in parentheses), are presented.
Terrain Type Pilot Community Total (ha)
Mono Bravo Guayacan
Non-enrolled Forest (ha) 169 (31.6%) 1,014 (65.3%) 1,183
Enrolled Forest (ha) 197 (36.9%) NA 197
Cacao (ha) 64 (12.0%) 130 (8.4%) 194
Degraded Forest (ha) 104 (19.5%) 410 (26.4%) 514
Total (ha) 534 1,554 2,088

12
Figure 2. Land use classification for the pilot communities of Guayacan and Mono Bravo in Mache-Chindul Ecological
Reserve, Ecuador. Regional overview of the geographic relationship and existing topography between the two.

13
Figure 3. Land use classification in the pilot community of Mono Bravo, Mache-Chindul Ecological Reserve, Ecuador.
Overview of mapped community properties. Legend: green = non-enrolled forest, stippled = enrolled forest, purple =
cacao plantations, and peach = degraded forest. Number of hectares for each property and terrain type is presented
in Annex 1.

14
Figure 4. Supplemental map used to deduce total territorial land holdings in the pilot community of Mono
Bravo, Mache-Chindul Ecological Reserve, Ecuador. Gray areas with green borders represent forest that was
opportunistically estimated using neighboring property boundaries. Legend: green = non-enrolled forest,
stippled = enrolled forest, purple = cacao plantations, and peach = degraded forest.

15
Figure 5. Land use classification in the pilot community of Guayacan, Mache-Chindul Ecological Reserve,
Ecuador. Overview of mapped community properties. Legend: green = non-enrolled forest, stippled =
enrolled forest, purple = cacao plantations, and peach = degraded forest. The number of hectares for each
property and terrain type is presented in Annex 1.

16
Figure 6. Supplemental map used to deduce total territorial land holdings in the pilot community of Guayacan, Mache-Chindul Ecological
Reserve, Ecuador. Gray areas represent forest that was opportunistically estimated using neighboring property boundaries. Map shows only
individual property boundaries; land use classifications are not represented.
17
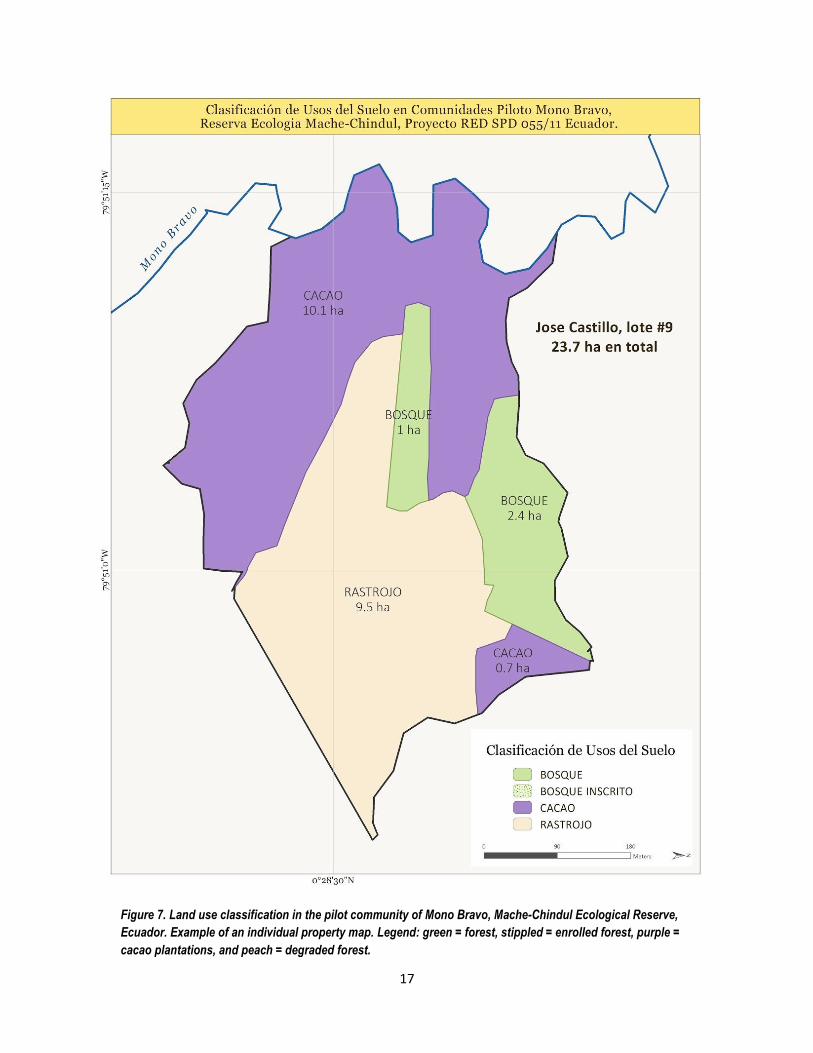
Figure 7. Land use classification in the pilot community of Mono Bravo, Mache-Chindul Ecological Reserve,
Ecuador. Example of an individual property map. Legend: green = forest, stippled = enrolled forest, purple =
cacao plantations, and peach = degraded forest.

18
mapping was nearly identical underscores this point, as it is a mapping-related measure that is entirely behavior-
based. Sadly, the remaining 68.5% and 65.3% of territory represented by rainforest (in Mono Bravo and Guayacan,
respectively; Table 1) can almost certainly be attributed to the logistical challenges associated with timber extraction
rather than to an innate conservation mentality. In both cases, steep and muddy terrain complicates log extraction to
the nearest river system, significantly slowing the rate of potential felling, and dry season conditions make for a near-
impossible trajectory to the nearest intermediary buyer, limiting most extraction to approximately half of the year.
Similarities in the proportion of lands comprised by cacao plantations are also interesting, given the substantive
difference in harvest production between the two communities. Mono Bravo plantations innately produce more cacao
due to climatic micro-conditions, and do not require the chemical inputs that are commonly used in Guayacan to
augment production. Patterns of degraded forest show an analogous unexpected trend, given that proportions are so
similar in the two communities despite only Guayacan having a notable focus on cattle ranching activities.
With respect to incentive program design, the a priori determination of environmental assets for each participating
community ensures a perception of program equity, should different communities compare notes. The influence of
this factor should not be underestimated, as current forest holdings (or lack thereof) are typically the collective legacy
of generations of difficult land management decisions, many of which require great sacrifice. It is worth noting that
both communities were willing to commit a full quarter of their territorial holdings (representing nearly half of their
remaining forest assets) to conservation in exchange for the livelihood benefits of a direct market connection, the
infrastructure required to attain export-level quality and volume, and legal registry as an autonomous producer's
association. This finding definitively confirms that forest-dwelling communities understand the long-term value of a
sustainable and community-based livelihood option.
5. Conclusions
Land use classification analyses comprise a fundamental baseline input for the successful adaptive design of any
conservation incentive program due to their roles in establishing parameters and elucidating behaviors. Mapping
results have a multitude of incentive program applications, including the quantification of environmental assets for
assessment of maximum participation potential, the documentation of existing intact forest resources for prevention
of perverse incentives, and area-based calculations of future livelihood potential to enable long-term benefit planning.
Via the present study, land use classification was used to quantify previously unknown territorial forest holdings, to
create equitable incentive program enrollment terms, and to enable both short- and long-term planning for cacao
market revamping steps and the environmental assets required for future conservation-livelihood trades.

19
6. Recommendations
The intent of this technical report is to provide a detailed illustration of how GIS land use classification can be applied
for effective incentive program design. In reality, the relative success of every conservation incentive program is
fundamentally dependent on how well a strategic approach responds to the specifics of local livelihood dynamics,
deforestation drivers, existing economic incentives, and culture. As stated in the introduction, an iterative process of
adaptive design is critical. Each land use classification approach will therefore be both project- and site-specific.
7. Implications for Practice
Toward the aim of facilitating the advancement of conservation incentive programs as a tangible solution to the now-
common conservation-poverty dilemma that characterizes tropical forests, we have developed a comprehensive set
of user-friendly design guidelines based on the learning process gained from this project (Annex 3).
Implications for practice that are specific to the land use classification component of incentive mechanism design can
be summarized as follows:
When quantifying any measurable geographic unit, there is no substitute for the reliable and rigorous data
attained via GIS mapping; community estimates and outdated approaches most often result in inaccurate
data that can seriously skew results.
The importance of establishing a baseline of existing forest resources cannot be over-stressed. Given the
rapidly evolving nature of today's tropical forest cover trends, these data often generate unexpected project
benefits, particularly with respect to long-term planning.
For projects addressing deforestation and economic alternatives, land use classification serves as a first line
of defense in determining how comparable "replicated" study sites are in actuality, providing perspective on
behavioral similarities or differences that can help to shape strategic approaches.
Critical to the success of any conservation incentives initiative is a vision deliberately oriented toward long-
term program sustainability, both financially and logistically. Design decisions made now will have
ramifications that reach far into the future; GIS mapping can supply one source of the fundamental baseline
data that is required for proper planning.

20
Bibliography
Agrawal, A. and Redford, K. 2006. Poverty, development, and biodiversity conservation: shooting in
the dark? Working Paper 26, pp. 1-58. Wildlife Conservation Society, Bronx, NY, USA.
Butler, R. 2006. Statistics: Ecuador. Retrieved from Mongabay.com on 30 November, 2014 from
http://rainforests.mongabay.com/deforestation/archive/Ecuador.htm
Dodson, C. H., and Gentry, A.H. 1991. Biological extinction in western Ecuador. Annals of the Missouri Botanical Garden 78: 273-295. Food and Agriculture Organization of the United Nations (FAO). 2010. Global Forest Resources
Assessment 2010, Main Report. FAO Forestry Paper 163. Rome, Italy.
International Tropical Timber Organization (ITTO) 2009. Reducing deforestation and forest degradation
and enhancing environmental services in tropical forests (REDDES). ITTO Thematic Programme
Document, Yokohama, Japan. 22 pp.
Kinch, J. 2006. A socio-economic assessment of the Huon Coast Leatherback Turtle Nesting Beach
Project. Final technical report to the Western Pacific Regional Fishery Management Council, Honolulu,
Hawaii, USA. 60 pp.
Mandel, J.T., Donlan, C.J., Wilcox, C., Cudney-Bueno, R., Pascoe, S., and Tulchin, D. 2009. Debt
investment as a tool for value transfer in biodiversity conservation. Conservation Letters 2: 233-239.
Ministerio del Ambiente del Ecuador (MAE). 2005. Plan de manejo y gestión participativa de la Reserva
Ecológica Mache-Chindul 2005–2010. Alianza REMACH, Quito, Ecuador. 168 pp.
Morales, M., Naughton-Treves, L., and Suarez, L. (Eds.) 2010. Seguridad en la tenencia de la tierra e incentives para la conservación de bosques. ECOLEX. Quito – Ecuador. Nelson, V. and Galvez, M. 2000. Social impact of ethical and conventional cocoa trading on forest-dependent people in Ecuador. Natural Resources and Ethical Trade Programme, University of Greenwich, UK. 29 pp. West, P. 2007. Conservation is our government now: The politics of ecology in Papua New Guinea. Duke
University Press, Durham, NC, USA.
Zambrano-Barragan, C. 2010. National forest and climate policy in Ecuador: perspectives for REDD+
and social participation. Programa Derechos, Cambio Climático, y Bosques – ECUADOR. Centro de
Planificación y Estudios Sociales, Rainforest Foundation Norway. Quito, Ecuador.

21
Annex 1. Land surveyed in Mono Bravo pilot community.
Lot Number
Owner Code
Community Forest
(ha) Enrolled Forest
(ha) Cacao
(ha) Degraded Forest
(ha) Total (ha)
1 AT Mono Bravo 31.7
0.9 32.7
2 SJ Mono Bravo
17.2
2.4 19.5
3 LA Mono Bravo 5.6 15.8 4.8
26.1
4 BC Mono Bravo 20.7
12.1 32.9
5 Reserva Mono Bravo
11.7
11.7
6 JC Mono Bravo 18.2
18.2
7 AC Mono Bravo 9.6
1.9 13.1 24.7
8 JC Mono Bravo
0.3 3.3 3.6
9 JC Mono Bravo 3.5
10.8 9.5 23.8
10 CC Mono Bravo
13.4 2.6 0.8 16.9
11 AJ Mono Bravo 0.5
1.1 2.5 4.1
12 AT Mono Bravo
1.7 2.6 4.2
13 KT Mono Bravo
1.6 2.2 3.8
14 AT Mono Bravo
6.4 8.3 14.6
15 FT Mono Bravo
3.6 3.2 6.8
16 FT Mono Bravo
0.9
0.9
17 FT Mono Bravo 10 10.3 0.6
21
18 CC Mono Bravo
8.5 2.4 4.1 15
19 JC Mono Bravo 6
2.8 4.5 13.3
20 LC Mono Bravo 17.3
0.4 11.7 29.4
21 JB Mono Bravo 13.3
2.6 0.8 16.7
22 FJ Mono Bravo
3.3
2.6 5.9
23 JB Mono Bravo
3.2 0.4 3.6
24 EA Mono Bravo 1.7 7.9 2.6
12.2
25 AJ Mono Bravo 3.3
3.4 5.2 11.8
26 FJ Mono Bravo 9.8
9.8
27 AT Mono Bravo 12.1
0.1
12.2
28 MA Mono Bravo 5.8 57.6 0.4 0.7 64.6
29 FA Mono Bravo
5.8 2.8 12.7 21.3
30 SJ Mono Bravo
0.8
0.8
31 EA Mono Bravo
2.9
2.9
32 MA Mono Bravo
3.5
3.5
33 JBC Mono Bravo
22.6
22.6
34 JB Mono Bravo
17.8
17.8
35 AJ Mono Bravo
5.2
5.2
TOTAL
169 197 64 104 534

22
Annex 2. Land surveyed in Guayacan pilot community.
Lot Number
Owner Code
Community Forest
(ha) Cacao
(ha) Degraded Forest
(ha) Total (ha)
1 AB Guayacan 41.3 6.2 24.3 71.7
2 EZ Guayacan 64.5 4.5 15.5 84.4
3 EP Guayacan 43.5 0.8 4.8 49.1
4 AB Guayacan 54.8 5.8 18.6 79.2
5 RM Guayacan 4.2 4.5 12.4 21
6 EB Guayacan 28.6 5.1 8.8 42.6
7 JB Guayacan 10.7 2.6 0.3 13.6
8 SB Guayacan 5.7 3.3 10.7 19.8
9 SB Guayacan 3.8
1.8 5.7
10 OM Guayacan 44.3 15.4 20.3 80
11 LS Guayacan 16.1 2.6 2.4 21.1
12 JR Guayacan 8.5
3.3 11.8
13 JR Guayacan 19.9 0.9 22.1 42.9
14 AA Guayacan 1.6 3.9 14.4 19.9
15 AZ Guayacan 15.2 1.1 12.5 28.8
16 JZ Guayacan 8.5
2.5 11
17 WZ Guayacan
4.7 14.6 19.3
18 WZ Banbe 9.5
11.4 21
19 CV Guayacan 16.5 4.2 8.8 29.4
20 RR Guayacan 1.7 0.5 21.6 23.8
21 JO Guayacan 42.1 8.2 8.1 58.4
22 GB Guayacan 9.7 1.3 14.8 25.9
23 JA Guayacan 24.1
14.4 38.5
24 EM Guayacan 24
1.4 25.3
25 ED Guayacan 80.7
80.7
26 CD Guayacan 26 6.2 31.5 63.8
27 JO Guayacan 29.3
29.3
28 DR Guayacan 7 0.8 8.2 15.9
29 EB Guayacan 13.8 0.3 7.8 21.9
30 FB Guayacan 21.7 3.6 6.7 32
31 RA Guayacan 115 4.9 13.3 133.3
32 JC Guayacan 35.5 0.5 7.8 43.8
33 GV Guayacan 45.1 0.3 4.5 50
34 JP Guayacan 17.4 9.4 1.9 28.7
35 SC Guayacan 42.8 0.8 2.4 46
36 CC Guayacan 12.6 10.8 11.5 34.9
37 MJ Guayacan 25.1 4 13.2 42.3
38 LB Guayacan 15
15.6 30.6
39 MB Guayacan 1.9 1.4 2.1 5.4
40 AC Guayacan 2.3 1.3 0.4 4
41 FC Guayacan 11.9 2 4.9 18.8
42 LB Guayacan 5.9 3.3 8.9 18.1
43 EP La Tortuga 5.4 4.9
10.4
Total
1,014 130 410 1,554

23
Annex 3.
Design Guidelines for Value Transfer Mechanisms for Incentive-based
Pro-poor Biodiversity Conservation Schemes (Version 1.1)1
TABLE OF CONTENTS
Abbreviations Used ................................................................................................................................... 24
Possible value transfer mechanisms for pro-poor conservation practitioners .................................... 24
Cash ........................................................................................................................................................ 24
Advantages .......................................................................................................................................... 25
Disadvantages ...................................................................................................................................... 25
Required organizational capacities ...................................................................................................... 26
Desirable community traits .................................................................................................................. 26
Productive assets ................................................................................................................................... 27
Advantages .......................................................................................................................................... 27
Disadvantages ...................................................................................................................................... 28
Required organizational capacities ...................................................................................................... 29
Desirable community traits .................................................................................................................. 29
Services ................................................................................................................................................... 30
Advantages .......................................................................................................................................... 32
Disadvantages ...................................................................................................................................... 32
Required organizational capacities ...................................................................................................... 33
Desirable community traits .................................................................................................................. 33
Access to credit ...................................................................................................................................... 33
Advantages .......................................................................................................................................... 35
Disadvantages ...................................................................................................................................... 35
Required organizational capacities ...................................................................................................... 36
Desirable community traits .................................................................................................................. 36
Decision-Support tools .............................................................................................................................. 37
Cash ........................................................................................................................................................ 37
Productive assets ................................................................................................................................... 39
Services ................................................................................................................................................... 40
Access to credit ...................................................................................................................................... 41
Potential partnership discussion framework .......................................................................................... 43
Root causes of poverty and environmental degradation ...................................................................... 43
Relationship between conservation and poverty reduction ................................................................. 43
1 This document was developed by two members of the project's core scientific and technical team, Dr. Josh Donlan
(Advanced Conservation Strategies) and Andrew Tulchin (Social Enterprise Associates) based on learning gained
during RED SPD 055/11 Rev.4(F), and is currently being edited for publication. Suggested citation is as follows:
Advanced Conservation Strategies & Social Enterprise Associates. 2013. Value transfer mechanisms for incentive-
based pro-poor conservation schemes. Working Paper

24
ABBREVIATIONS USED
CCT Conditional cash transfer
MFI Microfinance institution
PES Payment for ecosystem services
PPC Pro-poor conservation
VTM Value transfer mechanism
POSSIBLE VALUE TRANSFER MECHANISMS FOR PRO-POOR CONSERVATION
PRACTITIONERS
Practitioners wishing to implement incentive-based PPC schemes will need to perform a thorough
analysis of the natural capital, the community in which it resides, and the dynamics between the
community and its environment. The community in question should be party to this analysis; in many
cases the primary determinant of which VTM to employ in a community should be the community itself.
However, before practitioners can begin to discuss program ideas with a community, they must have a
thorough understanding of their organizations’ own competencies and resources.
This section presents four broad categories of VTMs, with the aim of creating a framework PPC
practitioners can use to evaluate the viability of each for their organizations and the communities they
hope to serve. This is not intended to be a tool practitioners use to identify natural capital to conserve, or
communities with which to work. Rather, this section is aimed at practitioners who have already had
some engagement with a community and have identified environmental degradation, poverty, and the
linkage between the two as community issues.
Value can be transferred to sellers of ecosystem services in the following forms: cash, productive assets,
services, and access to credit.
CASH
Cash is frequently deployed as a value transfer mechanism in the conservation space in PES programs—
the transfer of value from the buyer of ecosystem services to the seller is usually a cash transaction
(Engel, Pagiola, & Wunder, 2008). While some CCT practitioners have also had success with in-kind
payment of immediate consumables2 like rice or wheat, the majority of CCT programs that have been
studied and found to be effective also involve cash transfers. Best practices suggest that cash is a superior
transfer mechanism to in-kind consumables unless recipients of payments are not able to purchase what
they need easily with cash, or security concerns or geography make cash transfer undesirable.
2 Consumable transfers used to be preferred by governments who feared the misuse of cash by recipients, but the success of cash
transfers in recent history suggests that fear is unfounded—while undesirable consumption (e.g. alcohol, tobacco) sometimes
increases as a result of cash transfers, it does not do so disproportionately to increased consumption of desirable goods and
services like food or health services (Fuller, 2013). Therefore, the decision to transfer value with consumables instead of cash
should be pragmatic, not based on any ideology.

25
Advantages Disadvantages
● The poor know best how to help
themselves
● Easily adjusted if necessary
● Well-understood
● Technological innovation is making cash
transfers easier, even in remote areas
● No graduation
● Difficult to sustain financially
● Vulnerable to market fluctuations
● Might create dependency
● Most likely to face fraud problems
● Potential equity issues
ADVANTAGES
The main advantage of cash as a VTM is that the poor know how to help themselves, and cash is often the
best way to facilitate this. Fuller (2013) suggests that all nonprofits with a focus on poverty alleviation
should use cash transfer as a benchmark against which to measure all development aid—cash is the
preferable VTM unless it is determined that the nonprofit can do more for the poor with a dollar than the
poor can do for themselves.
In many cases, the payments in a PES system compensate recipients for the opportunity costs they incur
by not degrading their natural capital for its extractive value. Cash is the ideal mechanism to accomplish
this, because payments can theoretically be adjusted as opportunity costs change, perhaps indexed to
global commodity prices. However, this flexibility requires the administering organization to be
financially sophisticated enough to adjust payments quickly enough to keep the program healthy.
Mobile phone penetration and technological innovation involving mobile phone cash transfers such as
Safaricom’s M-Pesa program in Kenya make it increasingly easy to transfer funds even in remote regions
(Buku & Meredith, 2013; Suri, Jack, & Stoker, 2012). With M-Pesa, cash is physically deposited and
withdrawn by customers via a network of more than 35,500 agents, which are located at fueling stations,
grocery stores, Safaricom dealers, and other easy-to-access locations. The program has seen rapid
adoption. Since its launch in 2007, M-Pesa has facilitated more $1.4 trillion in peer-to-peer SMS transfers
for over 15 million customers (Buku & Meredith, 2013). Around 80% of Kenya’s population uses mobile
money services, a fact which has revolutionized many aspects of daily life in the country, and which has
helped participating households cope with and spread risk (Suri, Jack, & Stoker, 2012). The undeniable
success of M-Pesa has been difficult to recreate outside Kenya to date (Buku & Meredith, 2013), but it
stands as encouraging proof of concept—transaction costs of using cash as a value transfer mechanism
are likely to decrease in the future, even in remote areas.
DISADVANTAGES
Although CCT programs have not been around long enough for studies to determine whether they are
effective at breaking the intergenerational cycle of poverty, doing so is a goal that informs program
design. This is why payments in programs like Oportunidades are tied to school attendance and medical

26
checkups for children. Some people will probably always be poor, so there will always be a need for
poverty alleviation programs, but if CCT programs are effective, they will slowly chip away at the
conditions that necessitate them in the first place. One might optimistically predict payouts to decrease
over time.
It is difficult to draw a parallel to PES in this respect. Even a successful PES program is unlikely to make
itself less necessary. In fact, global economic realities will probably dictate that the opportunity cost of
conservation will continue to increase, and therefore a simple PES program that aims to compensate
communities or individuals for conserving ecosystem services will need to increase payouts over time to
remain effective. This has obvious implications for program funding. Organizations wishing to administer
cash-based PES programs will have to be financially sophisticated and have diversified and reliable
funding sources.
Some suggest that the use of cash as a VTM might create dependency (Medeiros, Britto, & Soares, 2008;
Robertson & Wunder, 2005) and fail to promote economic development for the poor. In the case of a
homogenous agricultural community of smallholders whose primary economic activity is harmful to the
environment, cash payments in exchange for not producing might lead to undesirable social outcomes.
This is a tension between conservation and poverty reduction—practitioners who view conservation as a
tool for poverty reduction will consider this outcome a failure (Roe & Elliott, 2006). Practitioners who
view poverty as a critical constraint on conservation (Adams et al., 2004) will also recognize this outcome
as undesirable. Individuals or communities will be less likely to become dependent on cash transfers if
there are a variety of economic activities available to the community.
Most PES schemes require enforceable land tenure to be effective. Equity issues arise from these
requirements: poor smallholders are less likely to have formal land tenure (Muradian et al., 2010).
Of all the VTMs discussed here, cash is most likely to create fraud problems for a PPC scheme. Fraud can
occur at the transfer recipient level, but also at program agent, politician, other intermediary levels
(Lindert, Linder, Hobbs, & De la Briére, 2007).
REQUIRED ORGANIZATIONAL CAPACITIES
Use of cash as a transfer mechanism requires sufficient cash flow to be able to provide regular, timely
payments to program participants. It also requires infrastructure to facilitate those transfers (e.g. local
banking capacity, mobile phone penetration, distribution stations). Therefore, organizations should not
consider cash transfer PES systems unless they have multiple, stable sources of income that can
reasonably be expected to provide long-term—and potentially increasing—payments to providers of
ecosystem services, and access to payment-facilitating infrastructure.
Because of the risk of fraud, organizations deploying cash transfers as a VTM will need to devote
significant resources to oversight to keep fraud in check.
DESIRABLE COMMUNITY TRAITS
PES is not a one-size-fits-all model—it is a tool best matched to an ecosystem in which the benefits of
services are seen as externalities by the managers of that ecosystem (Engel, Pagiola, & Wunder, 2008).
Therefore, for cash to be a viable VTM for PPC, the environmental asset being protected must be
imperiled by the community’s routine economic activities, and the benefits of the asset’s continued
existence should be seen by the community as externalities. In this case, transfer values must exceed the

27
opportunity costs of conservation. Therefore, consensus must be reached within the community and
between the community and the PPC organization about the community’s opportunity costs.
The lack of clear and enforceable property rights is considered a real impediment to PES implementation
(Muradian et al., 2010). A good candidate community for cash transfers has formal land tenure.
In order for cash to be a desirable VTM, there must be a functioning market in the community at which
ecosystem managers can convert the cash they receive for conservation to goods and services they value.
Of all the VTMs, cash has the highest risk of fraud. The administering organization will have to devote
resources to oversight, but a high level of social capital in the community is also desirable to help
minimize fraud.
PRODUCTIVE ASSETS
Occasionally, practitioners and communities that control some environmental asset might agree that an
appropriate VTM is an appreciable, or productive, asset. One case in which this decision was made is a
payment for watershed services (PWS) scheme in Bolivia’s Los Negros valley, where 42 farmers are paid
to 2774 hectares of watershed. The buyers in this PWS scheme are twofold: the US Fish and Wildlife
Service, which has a broader interest in conservation of biodiversity, and downstream irrigators, who are
the direct users of the watershed services being paid for (Asquith, Vargas, & Wunder, 2008). The PWS
recipients in this scheme specifically rejected cash as a VTM out of fear that it would be spent
immediately and create no lasting value. They opted instead to receive payments in the form of artificial
beehives—one for each 10 hectares of watershed enrolled per year. Training in apiculture is also made
available to recipients of the beehives to help them achieve high returns on their hives (Robertson &
Wunder, 2005). In the case above, beehives presented a new alternative economic activity to the farmers
in Los Negros. Productive assets can augment current economic activities.
Advantages Disadvantages
● Source of continued income
● “Demonstration effect”—more “wow” per
dollar
● Can help build relationships when
communities mistrust cash transfers
● Can introduce alternative, more
sustainable economic activities into a
community
● Require labor inputs and upkeep costs
● Require skill to produce value
● Difficult to give conditionally in practice
● Not easily subdivided—less program
flexibility
● Less liquid than cash
ADVANTAGES
If managed with care, productive assets can become a source of continued income. This can be appealing
to sellers of ecosystem services, especially if they are not convinced that the PES scheme is built to last
and provide similar future income. It becomes something the recipient must care for, which is particularly

28
relevant to the goals of conservation. In cases where there is limited local capacity for saving, investment,
and entrepreneurship, asset transfer might provide a more lasting value to the community than cash
transfer. (Robertson & Wunder, 2005)]
Low-value in-kind transfers such as beehives—valued at $35—provide a “demonstration effect” that
similarly valued cash transfers do not (Robertson & Wunder, 2005). Therefore, payment in the form of
productive assets might be an attractive option for program administrators with severe budget constraints.
Sellers of ecosystem services sometimes reject cash as a transfer mechanism out of fear that such
payments will lead to land expropriation, whether or not this fear is rational (Robertson & Wunder, 2005).
In such cases, where building trust with ecosystem services sellers is an issue, in-kind transfers are a less
threatening way to establish a strong relationship.
Productive assets can introduce alternative economic activities that are compatible with conservation.
These activities have the potential to replace environmentally harmful economic activity. Further, an asset
like a beehive provides a lasting incentive to conserve the bees’ forest habitat (Robertson & Wunder,
2005). Of course, the incentives that come along with an asset used as a VTM must be given significant
consideration: incentivizing farmers to preserve forest by providing them with cattle would be self-
defeating.
DISADVANTAGES
Productive assets require labor inputs and upkeep costs, which increase the opportunity cost of
conservation for the seller of the ecosystem services (Robertson & Wunder, 2005).
Assets are not equally useful to all recipients. They will produce little or no value for an unskilled
manager.
Transferring productive assets on a conditional basis is difficult in practice. In Bolivia, the administering
organization determined early on that although their stated policy was that beehives would be recaptured
by the organization if farmers violated their agreements not to deforest, doing so would have
unacceptably very high political costs (Robertson & Wunder, 2005). The practical realities of asset
recapture might slowly erode the program’s effectiveness over time as word spreads that violations are
not punished.
Assets are also less easily subdivided. In the case of the PWS system in Bolivia, for example, a farmer
could not set aside 5 hectares for a year and receive half a beehive. He would, instead, have to set aside
those 5 hectares for two years before receiving payment (Robertson & Wunder, 2005).
While assets can be sold on a secondary market, they are not as liquid as cash.3 Further, the use of assets
in a PES scheme might overwhelm the local market for that asset. If everyone in a small village is trying
to sell beehives, sellers will realize little or no value for their assets. This underscores the importance of
deciding on a VTM with a great deal of input from the community. In the PWS scheme in Bolivia, a
number of value transfer options were discussed, road improvements, marketplace construction, bridge
construction, and barbed wire for property lines (Asquith, Vargas, & Wunder, 2008).
3 If many recipients are turning around and sell the asset for cash, that indicates that cash (or a different asset) might have been a
better VTM in that context.

29
REQUIRED ORGANIZATIONAL CAPACITIES
An organization will only have success using productive assets as a VTM if it is able to demonstrate the
value of that asset. Most productive assets will not produce value for their owners without skilled
management. Organizations deploying productive assets as a VTM should be prepared to train recipients
in the use and maintenance of their new assets.
DESIRABLE COMMUNITY TRAITS
Communities will only be receptive to productive assets as an incentive if they are open to diversifying
their economic activities and understand the value that can be created with the new assets. The
community must also have access to a market that is willing to pay them for the goods and services their
new assets are capable of producing (e.g. if beehives are used as a VTM, value is only created if the
recipients of the beehives are able to sell the honey they produce, especially if they do not consume much
honey themselves).
Not all members of the community will be equally able to create value from a productive asset. Therefore,
the asset should be compelling to a large enough portion of the community that a secondary market for
the productive asset is possible—the scheme will benefit from additional participants that, although they
do not want the asset for its primary value, are able to sell it to access value.
Because asset recapture is likely to be infeasible in practice, a high level of social capital in the
community will serve as an additional—and possibly necessary—driver of compliance after the assets are
transferred.

30
SERVICES
Because of the success of CCT, the prevailing sentiment in modern poverty alleviation—especially in
Latin America—is that the poor can usually do more for themselves with cash than can be done for them
with equivalently valued services (Santos, Paez-Sousa, Miazagi, Silva, & Medieros da Fonseca, 2011).
However, there are often services that a poor community is unable to provide for itself. If a need for a

31
particular service is evident in a community that manages ecosystem services, the provision of that
service or services might be an appropriate way to transfer value through a PPC scheme.
Services can be broken into two categories: income-improving services and non-income-improving
services. Income-improving services include technical assistance (e.g. to increase agricultural yields, to
improve quality through processing) and market access services, whereby a major market participant
provides access to substantial selling opportunities. Non-income-improving services include social goods
like health services and education, which are not linked to income but which all communities need and
which might, in certain situations, prove to be powerful incentives.
Income-improving services Non-income-improving services
● Market access services (e.g. advanced
purchase commitment, price premium)
● Technical assistance to improve quantity
or quality of product
● Health services
● Education services
Most services that could be provided as incentives in a PPC scheme are well understood in the
practitioner community, and the breadth of possibilities is outside the scope of this work. However, the
concept of conditional market access service might benefit from some illustration. In 2001, with the help
of Conservation International, Starbucks Coffee Company announced new purchasing guidelines aimed at
more sustainable coffee production. The company scored suppliers on a 100 point scale: 50 points for
environmental impacts, 30 for social conditions, and 20 for economic issues. Suppliers who met all
Starbucks’ requirements became preferred suppliers, receiving priority in Starbucks’ purchasing queue
(Austin & Reavis, 2004). The income-improving service in this model is simply the guarantee of purchase
at favorable prices, which is provided on the condition that the supplier meets Starbucks’ and
Conservation International’s sustainable production guidelines.
Advantages Disadvantages
● Complement other VTMs well
● Partner organizations might help diversify
funding sources
● Might change behavior beyond life of
PPC scheme
● Difficult to provide conditionally in
practice
● Difficult to value
● Might exclude some community members
● Non-liquid and non-transferable
● Increased risk of conflict between
providing organizations

32
ADVANTAGES
Services need not comprise the entirety of a PPC scheme’s incentives; services are likely to complement
other VTMs well. Some level of technical assistance services should probably be bundled with most
productive assets, for example.
Because provision of multiple services will probably require a coalition of organizations to participate in
a PPC scheme, the scheme might have more diversified funding sources and therefore be more able to
withstand occasional funding interruptions.
Technical assistance services have the potential to change the way an economic activity is carried out,
even beyond the lifetime of the PPC scheme. To the extent that new techniques achieve both greater
sustainability and greater income, communities are incentivized to continue them.
In the case of market access services through a large corporation like Starbucks, funding is relatively
secure. As the end provider of value to the community, Starbucks benefits not only from bringing a high
quality product to market, but also from the public relations generated by such a program. Starbucks will,
for the foreseeable future, be purchasing great quantities of coffee, and selling cups at a premium to
customers who are willing to pay well above commodity prices for coffee with a story.
DISADVANTAGES
Many will find applying conditionality to provision of certain services (especially non-income-improving
ones like health or education services) morally problematic. Even those who view poverty alleviation
only as a means of achieving environmental conservation will struggle with the implications of program
failure. If an organization cannot agree internally and with all its partners that it is willing to withhold
services if conservation goals are not achieved, it should not consider service provision as a VTM.
Because the goal of any VTM is to encourage conservation in a community of ecosystem managers, any
VTM must be more valuable to that community than practices that will degrade the environment. Because
some services are difficult to value—there is surely value in bettering the education of young people in a
community, but reasonable people will disagree about dollar amounts—it will be a challenge to establish
a level of service provision that achieves the goals of a PPC scheme.
Provision of non-income-generating services could fail as a VTM if those services are valued highly by
some, and not at all by others within a community. For example, education services might be valued by
community members with children, and not valued by those without children. It is even possible that
those without children would feel cheated by and develop resentment towards educational services as a
VTM.
Schemes that offer a wide variety of services as VTMs will probably involve a coalition of partner
organizations to provide those services. This will necessitate a great deal of attention paid to coordination
and management by the lead organization, which might require additional personnel and funds to be
diverted to program management, and not the provision of services.
It is always possible for tensions to emerge between partner organizations due to fundamental mission
disagreements or more workaday concerns, and this possibility is increased with each additional partner.
Practitioners considering provision of services they do not have internal capacities to provide should

33
choose their partners carefully to mitigate this risk. The lead organization should ensure that all parties
agree about where the project falls on Roe and Elliott’s (2006) PPC continuum.
REQUIRED ORGANIZATIONAL CAPACITIES
Many organizations considering service provision as a VTM will have the provision of that service at the
core of their mission, and will have built their organizations around the effective provision of that service.
For example, an organization that offers health services as a VTM probably employs doctors, nurses, or
other health practitioners for that purpose, and probably offers a similar suite of health services in each
community in which it works. It is unlikely that the same organization would also provide technical
assistance for improving agricultural production.
This is not to say that organizations that are not built around the provision of a particular service cannot
offer services as VTMs. It is certainly possible that the health-focused organization discussed above
might identify a need for agricultural technical assistance and seek a partner to provide that service.
Therefore, the ability to identify partners—and work constructively with them—is an important
organizational capacity for service provision as a VTM.
In the special case of market access services, organizations must have the ability to purchase and market
the products produced by the community. It is better if this is accomplished through established channels
such as the Starbucks model discussed above, in which there is little risk of the purchaser of goods
disappearing and uprooting the entire PPC scheme in the process.
DESIRABLE COMMUNITY TRAITS
For service provision to be a viable VTM, a need for particular services must be identified in the
community, and the community must agree that receiving those services on a conditional basis would be
valuable enough to make them engage in good conservation practices. Therefore, the most important traits
a community must have for services to be an ideal VTM are the need for a service, internal recognition of
that need, and cohesive agreement about the value of meeting that need.
ACCESS TO CREDIT
Many potential sellers of ecosystem services face the same barriers to conventional credit that traditional
microfinance customers face: they do not own property that would be acceptable as collateral, and they
have no credit history. For this reason, access to credit might be a compelling incentive to conserve
valuable ecosystem services and promote economic development.
ACS has proposed a conservation scheme inspired by microfinance: environmental mortgages (Mandel et
al. 2009). In an environmental mortgage scheme, a community-held natural asset is capitalized, and that
capital is made available to the local community and individuals within that community through
microfinance mechanisms—small loans and other livelihood development investment instruments. The
asset is closely monitored, and the capital made available to the community is linked directly to the
quality of the asset. In this way, communities are rewarded for environmental stewardship with additional
access to credit, and penalized with less access to credit should the targeted asset degrade.

34
One way to conceptualize an environmental mortgage scheme is that the natural capital becomes wealth
for the community that cares for it, not simply income. It is an asset, not simply a source of income—it is
stock, not flow. Because loans must be paid back, lent funds are likely to be invested to increase income
by improving product quality or increasing productive capacity. Because the future availability of credit is
dependent on the continued health of the natural asset, these income improvements are less likely to come
at the expense of the environment.
A community is a good candidate for an environmental mortgage program if its primary economic
activities pose a threat to the health of its environmental assets, but small alterations to those economic
activities might create economic and environmental win-wins. Environmental mortgage schemes have not
yet been piloted and studied, but the following hypothetical scenario is one in which an environmental
mortgage scheme might be effective.
A hybrid species of cacao plant called CCN-51 that thrives on direct sunlight has recently gained
popularity in cacao farming communities in Ecuador. Although CCN-51 cacao is of a poorer quality than
Nacional—the local, traditionally shade-grown species—it is believed to produce greater yields (Bentley,
Boa, & Stonehouse, 2004). Therefore, if local cacao farming communities cannot access markets that will
pay premium prices for Nacional, economic incentives exist for them to raze rainforest canopy, their
valuable environmental asset, and plant CCN-51 in order to increase cacao yields.
If the community views the rainforest itself as a source of wealth and income, however, the incentive to
clearcut is abated. If the value the rainforest produces for the community is greater than the opportunity
cost of not realizing the extra yield from CCN-51, the forest might remain.
In this hypothetical environmental mortgage scheme, the portion of rainforest canopy that the community
has actual or de facto control over is capitalized by a conservation organization (with funds from
donations or sales of carbon offsets). The community would be able to take out small loans against the
capitalized value of the rainforest canopy. The canopy is closely monitored, and the amount of available
credit fluctuates proportionally with the canopy’s health.
Farmers are able to use this access to credit to increase their shade-grown Nacional yields, or to refine
their harvesting and processing practices to make their Nacional yields meet the standards necessary to
sell them at a price premium, further increasing income. All the while, the rainforest canopy, upon which
the access to credit relies, becomes ever more valuable to the community.
Advantages Disadvantages
● Microfinance has been successful in
reducing poverty
● Clear and enforceable property rights are
not necessary
● Unlikely to create dependency
● Funds might be recoverable in event of
program failure
● Untested
● Ability to fund uncertain
● Difficult to value
● Might exclude some community members
● Vulnerable to market fluctuations
● Unlikely to be able to follow all
microfinance best practices

35
ADVANTAGES
As Mandel et al. (2009) point out, access to credit might be a superior VTM to cash in communities
where there are not clear and enforceable property rights. A capitalized community asset from which a
community can borrow does not require property rights, just de facto management ability.
There are some concerns that CCT schemes can create transfer dependency, a poverty trap. This is most
likely to occur when increases in income are directly linked to decreases in transfer benefits (Lindert,
Linder, Hobbs, & De la Briére, 2007). Although sufficient study has not been done on PES to determine
whether it is susceptible to the same danger, the similarities between CCT and PES suggest that it is at
least a possibility, especially in cases where smallholder farmers are compensated not to produce, or to
produce less than they otherwise would and no alternative economic activities are viable or available.
Because loans are of a determinate length and are meant to be used to some income-generating end, the
microfinance industry has not had to address dependency as a poverty trap. Therefore, access to credit as
a VTM is probably not in danger of creating the same dependency dynamic.
An interesting advantage to access to credit in general, and specifically environmental mortgages, is that
funders might be able to recover their funds in the event of program failure. If a fund is capitalized based
on the health of an environmental asset and that asset is destroyed, the money is not destroyed. Contrast
this with PES schemes, in which transferred funds are unrecoverable. In PES, donors give hopefully and
payments are meted out conditionally. In environmental mortgages, the donor gives conditionally. This
distinction might aid in securing funding for a pilot PPC scheme that uses access to credit as a VTM.
DISADVANTAGES
The primary disadvantage to using access to credit as an incentive for PPC schemes is uncertainty:
environmental mortgages are untested. There are many parallels between microfinance and environmental
mortgages, but many questions remain.
An established pipeline of funds for capitalizing environmental mortgage schemes does not exist, so an
organization seeking to pilot an environmental mortgage program will have to do significant
development. It might be possible to excite private donors about a new VTM, but organizations might
also consider following the Plan Vivo model of selling emissions offset certificates, or biodiversity
banking, a market mechanism by which developers pay to offset potential biodiversity losses that might
result from their projects (Kumaraswamy & Udayakumar, 2011). However, a number of concerns exist
about the effectiveness of biodiversity banking as it is currently formulated (Bekessy et al., 2010; Walker,
Brower, Stephens, & Lee, 2009). Practitioners wishing to pilot an environmental mortgage program might
not want to rely on an embattled mechanism for their own funding.
There are a number of imaginable scenarios in which access to credit could quickly become unattractive
relative to an asset’s extractive value. This could occur due to a spike in global commodities markets, or
due to an inability to achieve satisfactory returns on investments made with that credit. In the former case,
the cost of borrowing could be indexed, inversely, to the relevant global commodity price. In the latter
case, access to credit would need to be paired with technical assistance and/or market access services. In
either case, anticipating the point at which incentives flip would be a nontrivial task—access to credit is
more difficult to quantify than, say, cash transfers. Tipping points would likely vary from community to

36
community, and individual to individual, just as internal rates of return vary from organization to
organization and individual to individual.
Implementing and administering an environmental mortgage scheme would require some level of
financial sophistication. If this is not present internally, a partner MFI in the area might be able to assist,
but if an MFI is already operating nearby then the incentive of access to credit is dampened to the extent
that the MFI in place is making credit available to the target community.
Microfinance practitioners overwhelmingly prefer to lend to women, who are considered most likely to
invest in the family and thereby break the poverty cycle (Brau & Woller, 2004). In the case of
environmental mortgages or other microfinance-inspired conservation themes, it is unclear if this
convention can be followed. The access to credit in an environmental mortgage scheme is meant to
incentivize good environmental stewardship, e.g., producing shade-grown cacao rather than clearcutting
canopy to produce higher yields. If it is men who make the decisions germane to conservation, e.g.,
whether to deforest a parcel of land, it follows that men are the ones who must be incentivized in an
environmental mortgage scheme. More research is necessary to understand whether this presents a serious
problem in an environmental mortgage scheme.
Practitioners interesting in piloting the environmental mortgage concept will need to be clear about
whether their primary motivation is poverty reduction or conservation. If the asset is damaged through no
fault of the community participating in the environmental mortgage program (e.g. natural disaster, roving
bandits), the organization administering the environmental mortgage will need to decide whether to
continue lending to the community in the hopes of capital recovery, or to stop lending once the protected
asset has been destroyed. This is a problem that exposes some tension within PPC: different practitioners
will react differently depending on where they fall on the continuum proposed by Roe and Elliott (2006).
Those whose overarching motivation is conservation might be willing to close down shop, while those
whose primary goal is poverty reduction might not.
REQUIRED ORGANIZATIONAL CAPACITIES
Organizations considering an environmental mortgages or other credit-access VTMs must be financially
sophisticated and well-versed in microfinance best practices, or have access to a partner MFI who is not
already making credit available to the target population. Because no established funding mechanisms for
environmental mortgages exist, an organization should only consider access to credit as a VTM for PPC if
they are confident in their ability to secure sufficient funds to capitalize a natural asset.
DESIRABLE COMMUNITY TRAITS
If an MFI is already providing the community access to credit on any significant scale, then a PPC
scheme offering more of the same might be able to distinguish itself with lower borrowing costs, but
access to credit will be a less attractive VTM than it would be in a community with no access to credit.
Therefore, especially if an organization is piloting a new instrument like an environmental mortgage, it
will want to identify a community that is not currently receiving access to credit.

37
Conventional microfinance wisdom states that a high level of social capital is important—it reduces
information costs for the lender, and increases social pressure to repay loans in a timely manner.
Questions have been raised in academic circles as to whether social capital matters as much as
microfinance practitioners believe (Ito, 2003), but it would still be better to have high social capital in a
community than not to pilot a credit-access PPC scheme there.
One advantage of environmental mortgages, in theory, is that enforceable property rights are not
necessary (Mandel, et al., 2009), which would make access to credit a viable VTM in some communities
in which cash is not one. A community receiving access to credit does not need official property rights,
just de facto control of the natural capital being preserved. Communities that are somewhat isolated are
also desirable—as isolation is a guard against “roving bandits” from outside the community who might
try to capture the extractive value of the environmental asset.
DECISION-SUPPORT TOOLS
Which VTM or VTMs to offer is a decision that must be made on multiple levels. The first is the
organizational level—an organization considering incentive-based PPC must evaluate its own ability to
deploy each VTM. Second is the community context level—each PPC scheme will be different at this
level, and will rely on the community stakeholder support for its success. A program will only work if the
VTM recipients value the incentive; the final program decisions will have to involve the community.
The following sections will help practitioners assess the viability of offering the four broad VTM
categories, first at the organizational level, then at the community context level. At each level, a number
of statements germane to particular VTMs are made. Practitioners can either check the box next to a
statement, affirming it, or describe their organizations’ response if they cannot affirm it. Responses may
include partnering with other organizations that can provide needed capabilities, or other organizational
responses (e.g. a community does not have the expertise to profit from a productive asset, but the
organization can provide complementary technical assistance). If an organization has to leave more than 2
boxes unchecked for a particular VTM, it should probably not consider deploying that VTM.
Many organizations that choose to run PPC schemes will forge partnerships to boost capacity and
mitigate risk. While partnerships can make PPC schemes possible where they might otherwise not be and
expand the range of VTMs available, partnerships also introduce complexity and the risk of inter-
organizational conflict. To mitigate this risk, all potential partners should engage in open and frank
communication about their conception of PPC. Irreconcilable disagreements between organizations in
these conversations—one organization sees poverty reduction as a way to conserve and another sees
conservation as a way to reduce poverty, for example—should be taken very seriously as reasons not to
partner. The frameworks proposed by Adams et al. (2004) and Roe and Elliott (2006) are a good starting
point for these discussions. A brief worksheet based on these frameworks can be found at the end of this
section.
CASH
Organization
If you are unable to check any box, explain how your organization will respond to that difficulty (e.g.
partnership with another organization). If you have to leave any boxes unchecked, you should reconsider
using cash as a VTM.

38
Condition Check Response
1. My organization has multiple, stable
funding sources that are available for
PPC projects
☐
2. My organization has experience
administering cash transfer programs ☐
3. My organization has the resources to
devote to fraud prevention measures. ☐
Community
Rate your confidence on a 1–5 scale (1 = not confident; 5 = completely confident) that the community
meets each of the following conditions. For any conditions with confidence ratings less than 5, indicate
how your organization will respond to increase that confidence level or mitigate that difficulty. If there
are two or more conditions about which you are not able to reach high levels of confidence, you should
reconsider using cash as a VTM.
Condition Confidence Response
1. The community’s primary economic
activity currently contributes to
environmental degradation __
2. The goods and services the
community values are available for
purchase at market __
3. Infrastructure exists that will enable
regular, reliable cash transfers (e.g.
banking services, mobile phone
penetration) __
4. The community is able to reach
internal consensus about the opportunity
costs of conservation __
5. My organization is able to reach
consensus with the community about
opportunity costs of conservation and a __

39
fair transfer amount and schedule
6. My organization understands the
market for the goods the community
produces, and is able to react to changes
in that market that might change the
efficacy of previously agreed-upon
payment amounts __
7. There are clear and enforceable
property rights in the community __
8. The community has a high level of
social capital __
PRODUCTIVE ASSETS
Organization
If you are unable to check any box, explain how your organization will respond to that difficulty (e.g.
partnership with another organization). If you have to leave any boxes unchecked, you should reconsider
using productive assets as a VTM.
Condition Check Response
1. My organization is familiar with
the operation of this productive asset ☐
2. My organization can demonstrate
the benefits of this asset ☐
3. My organization is able to provide
technical assistance related to the use
of this asset
☐
Community
Rate your confidence on a 1–5 scale (1 = not confident; 5 = completely confident) that the community
meets each of the following conditions. For any conditions with confidence ratings less than 5, indicate
how your organization will respond to increase that confidence level or mitigate that difficulty. If there
are two or more conditions about which you are not able to reach high levels of confidence, you should
reconsider using productive assets as a VTM.

40
Condition Confidence Response
1. The community has demonstrated
an interest in diversifying its
economic activity __
2. The community has the technical
ability to profit from the use of this
productive asset __
3. There is a functioning market for
the products or services this asset
will help participants generate __
4. There is a high level of social
capital in the community __
5. There is a secondary market for
the productive asset itself __
6. With this productive asset, my
organization can provide more value
to the community per dollar than the
community could provide for itself
per dollar __
SERVICES
Organization
If you are unable to check any box, explain how your organization will respond to that difficulty (e.g.
partnership with another organization). If you have to leave any boxes unchecked, you should reconsider
using services as a VTM.
Condition Check Response
1. My organization’s core capability
is the provision of a service ☐
2. My organization is willing to ☐

41
provide this service conditionally
and withdraw it if conservation goals
are not met
Community
Rate your confidence on a 1–5 scale (1 = not confident; 5 = completely confident) that the community
meets each of the following conditions. For any conditions with confidence ratings less than 5, indicate
how your organization will respond to increase that confidence level or mitigate that difficulty. If there
are two or more conditions about which you are not able to reach high levels of confidence, you should
reconsider using services as a VTM.
Condition Confidence Response
1. My organization has identified a
need or needs within the community
that cannot be addressed by cash
transfer
__
2. The community agrees that it has
these needs __
3. The community would value
services that address these needs __
4. With this service, my organization
can provide more value to the
community per dollar than the
community could provide for itself
per dollar
__
ACCESS TO CREDIT
Organization
If you are unable to check any box, explain how your organization will respond to that difficulty (e.g.
partnership with another organization). If you have to leave any boxes unchecked, you should reconsider
using access to credit as a VTM.

42
Condition Check Response
1. My organization is familiar with
microfinance best practices ☐
2. My organization has identified
funders who are interested in
conditionally capitalizing loan funds
that are tied to the health of natural
assets
☐
Community
Rate your confidence on a 1–5 scale (1 = not confident; 5 = completely confident) that the community
meets each of the following conditions. For any conditions with confidence ratings less than 5, indicate
how your organization will respond to increase that confidence level or mitigate that difficulty. If there
are two or more conditions about which you are not able to reach high levels of confidence, you should
reconsider using access to credit as a VTM.
Condition Confidence Response
1. The community is relatively
isolated __
2. There is a high level of social
capital in the community __
3. If there are not enforceable
property rights, the community has
de facto control of an important
environmental asset __
4. If there are currently any MFIs
providing access to credit in the
community, their reach is minimal __

43
POTENTIAL PARTNERSHIP DISCUSSION FRAMEWORK
Partnerships between organizations should only be entered after a careful vetting process. A robust
literature exists to provide guidance through partnering negotiations; synthesizing it is outside the scope
of this document. However, when partnering in the specific context of PPC, practitioners must engage in
discussions about how they view both the root causes of poverty and environmental degradation, and the
relationship between the fields of conservation and poverty reduction. These discussions will help the
organizations to avoid some conflicts in the context of the PPC schemes they create together, and
navigate those conflicts that still arise. Strong disagreements should be seen as reasons not to partner.
ROOT CAUSES OF POVERTY AND ENVIRONMENTAL DEGRADATION
The following broad questions are intended to spark conversations in which each organization outlines its
working assumptions about the root causes of the problems PPC aims to address, and how those
assumptions inform the solutions they deploy.
Poverty
What are the root causes of poverty?
Why is poverty reduction important?
Why is poverty reduction difficult?
How should the preceding responses inform our poverty reduction efforts?
Conservation
What are the root causes of environmental degradation?
Why is conservation important?
Why is conservation difficult?
How should the preceding responses inform our conservation efforts?
RELATIONSHIP BETWEEN CONSERVATION AND POVERTY REDUCTION
The following brief worksheet, based on frameworks from Adams et al., (2004) and Roe and Elliott
(2006), is suggested as a way to begin discussions about the relationship between the fields of
conservation and poverty reduction.
For each statement, indicate the level to which you agree or disagree on a scale of 1–5
(1 = Disagree completely; 5 = Agree completely)

44
Statement Agreement level
Poverty reduction and conservation are separate policy realms __
Poverty is a critical constraint on conservation __
Conservation should not compromise poverty reduction __
Poverty reduction depends on living resource conservation __
With which statement do you agree most? Why?
With which statement do you disagree most? Why?
Where does your organizational focus fall on the following continuum?
Why?