land stewardship in the 21st century: the …coweeta.uga.edu/publications/2068.pdfcolorado...
TRANSCRIPT

USDA United StatesDepartment ofAgriculture
Forest Service
Rocky MountainResearch Station
Fort Collins,Colorado '80526
ProceedingsRMRS-P-13
March 2000
Land Stewardship in the 21st Century:the Contributions of
Watershed Management
Conference Proceedings Tucson, Arizona March 13-16,2000

Ffolliott, Peter F.; Baker Jr., Malchus B.; Edrriinster, Carteton B.; DHIon, Madelyn C.;Mora, Karen L, technical coordinators. 2000. Land stewardship in the 21* century:The contributions of watershed management; 2000 March 13-16; Tucson, AZ. Proc.RMRS-P-13. Fort Collins, CO: U.S. Department of Agriculture, Forest Service,Rocky Mountain Research Station. 438 p.
Abstract
The purpose of this conference was to increase awareness through exploration andevaluation of global, national, and regional perspectives about the potential contribu-tions that watershed management can make to the conservation, sustainable develop-ment, and use of natural resources in ecosystem-based land stewardship in the 21st
century. The conference consisted of 2 and a half days of synthesis papers. Thesepapers were presented in plenary sessions and prepared by invited speakers frompublic and private research, management, and educational organizations. Over 50poster papers complemented the synthesis papers to broaden the conference scope.
Keywords: land stewardship, watershed management, ecosystem-basedmanagement, natural resources, conservation, sustainable development, sustainableuse
You may order additional copies of this publication by sending yourmailing information in label form through one of the following media.Please send the publication title and number.
' Telephone (970)498-1392
E-mail rschneider/[email protected]
FAX (970)498-1396
Mailing Address Publications DistributionRocky Mountain Research Station240 West Prospect StreetFort Collins, CO 80526-2098
Publisher's note: To deliver symposium proceedings to readers as quickly as possible,manuscripts do not undergo full editing. Views expressed in each paper are those of theauthor and not necessarily those of the sponsoring organizations or the USDA ForestService. Trade names are used for the information and convenience of the reader anddo not imply endorsement or preferential treatment by the sponsoring organizations orthe USDA Forest Service.
Cover art by Mary Willox, Techno Transfer, Longmont, CO

Watershed Management Contributions to Land Stewardship:Case Studies in the Southeast
Wayne T. Swank1 and David R. Tilley2
Abstract—We describe three examples of watershed managementstudies, at different spatial scales, that provide approaches and infor-mation useful in enhancing natural resource stewardship in the south-em Appalachians. A multiple use "pilot" study, initiated 35 years agoat the Coweeta Hydrologic Laboratory, demonstrates mat southernAppalachian forests can be successfully managed for water, timber,wildlife, and recreation. Added benefits of mis small scale (144 ha)watershed study are the education and on-the-ground demonstrationvalues. A demonstration project of ecosystem management, initiated inthe early 1990s on a 1820 ha watershed provides an integrated, interdis-ciplinary ecosystem approach to research, planning, and management.Organized around themes of ecosystem restoration, forest sustainability,human and economic values, and ecosystem structure and function, themultifaceted studies are providing new knowledge and managementbenefits. More recently, regional scale watershed research was initiatedon two river basins within a 70,000 km2 area of western North Carolina.The goal is to develop a predictive understanding of the social, eco-nomic, and environmental factors tha t drive land use cover changes andto evaluate the consequences of change for terrestrial and aquaticbiodiversity, water quality, and regional carbon cycles. E'm'ergy, a toolfor synthesizing the multiple values of watersheds, is applied to theecosystem management study.
Introduction
As with much of the nation, the mix of forest uses andbenefits in the southern U.S; has greatly accelerated in thepast several decades. The rapidly changing faces andvoices of the South (Cordell et al. 1998) provide excitingopportunities to address complex issues related to plan-ning, policy, and science for the region's natural resources.Interdisciplinary watershed management provides a use-ful analytical framework for structuring and assessingalternative mixes of forest uses across multiple scales oftime and space.
Our objectives in this paper are 1) to illustrate; throughcase studies in the southeast U.S., the utility of watershedmanagement as a framework for evaluating the conserva-tion and sustainable development and use of resources at
' USDA Forest Service, Southern Research Station, Otto, NC2 Department of Environmental Engineering Sciences, Center
for Wetlands, University of Florida, Gainesville FL; presently atDepartmentofEnvironmentalEngineering, Texas A&M UniversityKingsville, Kingsville, TX
several spatial scales and 2) to implement a methodology,emergy analysis, for synthesizing commodity and non-commodity values of watershed values and functions.
The Regional Setting
The region is characterized by three physiographicdivisions: the coastal plain, piedmont, and mountains.Abundant resources, highly diverse and attractive ecosys-tems, demographic shifts, job opportunities, and othersorioeconomic factors contribute to a dynamic changingSouth. During the past three decades the population hasincreased 54% and the region (13 southern states) was theonly one within the U.S. with net growth from domesticin-migration (Cordell et al. 1998). Forests cover 87 millionha in the region and the 81 million ha classified as timber-land (Sheffield & Dickson 1998) accounts for an estimated40% of the productive timberland in the U.S. Nearly 70%is in nonindustrial private forest ownership. Other tim-berland ownerships are comprised of national forests(5.7%), other public agencies (4.8%), and the remainder inforest industry (« 20%). About 52% of the timberland isclassed as a hardwood type and upland hardwoods com-prise 37% of the total timberland. The pine forest typeoccupies about 33% of the timberland with 15% in pineplantations and 18% in natural pine plantations (Sheffieldand Dickson 1998). In the past decade the region hasemerged as a leader in the world's forest products indus-try, accounting for about 25 % of world paper productionand 35% of solid wood products manufacturing, nation-wide, the region provided 50% of the softwood and 42% ofthe hardwood timber produced in the country in 1992 andthe South is expected to supply major future increases inthe national timber market (Wear et al. 1998).
The region also encompasses an abundance of water,recreation, and wildlife as illustrated in a comprehensiveassessment of the Southern Appalachians, a sub-region of15 million ha within seven southeastern states (SouthernAppalachian Assessment Summary Report 1996). Thearea cqntains parts of 73 major watersheds, and nine majorrivers that arise in the southern Appalachians providedrinking water to the major cities of the Southeast. The
USDA Forest Service Proceedings RMRS-P-13. 2000 93

mean main stream and river density is 12 m/ha and whenall perennial streams are included, ranges from 48 in thepiedmont to 87 m/ha in the mountains. Natural lakesand reservoirs represent about 1.5% of the total area. Thesouthern Appalachians are well known for their scenicbeauty and the recreation opportunities they provide. Inthe past 15 years, there has been a significant increase inthe number and diversity of recreationists in the region.Concurrently, demand has increased for specific recre-ation opportunities such as hiking and white waterrafting/kayaking. The southern Appalachians is home toan estimated 80 species of amphibians and reptiles, 175species of birds, 65 species of mammals and more than25,000 species of invertebrates. Populations of majorgame species such as deer, turkey, and bear have in-creased in the past 25 years while populations of birdssuch as ruffed grouse and bobwhite quail have de-clined.
Clearly, the south is a region with a rapidly growingrange of public interest and changing views of land andnatural resources. This situation is probably most evidentand complex in the Appalachians where mixed owner-ships, diverse resources, and increasing population pres-sures offer challenging planning and policy decisions formultiple uses on the landscape. Fortunately, past and^current watershed research in the region provides infor-mationrelevant to decisionmaking processes. The CoweetaHydrologic Laboratory, a 2185 ha USDA Forest Serviceresearch facility located in the Appalachian Mountains ofwestern North Carolina, has a long history of interdisci-plinary watershed research. It is this cooperative researchprogram from which we drawpur case studies.
Multiple Use Management:A Pilot Program
One of the earliest and most practical demonstrations ofthe multiple use concept in a watershed context in theeastern U.S. was implemented at Coweeta in 1962(Hewlett and Douglass 1968). At the time, there wassubstantial controversy over the Multiple Use Act passedearlier in 1960 because dn-the-ground examples of theconcept were lacking. The concept was pilot-tested on a144 ha hardwood-forested watershed (WS 28) in theCoweeta basin for the uses it was judged to be best suitedfor; water, timber production, hunting, fishing, and hik-ing. Scientists delineated objectives and prescriptions toevaluate conflicts among uses and to demonstrate poten-tial management practices for the future (Hewlett andDouglass 1968).
Prescriptions
One of the highest priorities was to provide access onthe catchment without impairing other resources. Prop-erly planned access is a basic component of watershedmanagement that is essential in achieving other goals andaccess should be designed to meet current and anticipatedfuture needs. Four classes of roads were specified andincluded forest engineered roads to specified standardsand a network of climbing roads, contour roads, and skidtrails using criteria developed from previous research atCoweeta and from some new ideas for design criteria.
Silvicultural conditions of existing stands dictated even-aged management (dearcutting) on the slopes and ridgesto regenerate the degraded forest from the previous selec-tive logging in 1923-24 and to produce the maximum yieldof water and deer browse. In the cove forest, a thinningwas prescribed along with removal of residual poor qual-ity overstory trees remaining after earlier logging, to in-crease growth of the residual yellow-poplar stand. Toenhance the visual appeal of the cove in winter and spring,eastern hemlock (Tsuga canadensis) and dogwood (Cornusflorida L.) were not cut. .?;
The Appalachian Tratf,: which traverses the higher el-evations of the watershed, was improved and interpreta-tive signs were placed at strategic locations to enhancerecreation. Improvement of trout habitat consisted of re-moving old logging debris from the lower portion of themain stream and construction of small logs dams to createmore riffles and pools.
Responses to Management
Previous papers provide detailed analysis of responsesto prescriptions (Douglass and Swank 1976; Swank 1998)arid only a review of findings are provided in this paper.An overall summary of resource/use responses is pro-vided in table 1. Based on the paired watershed method ofanalysis, streamflow on WS28 increased 22 cm the firstyear after harvest and then declined exponentially overthe next 9 years before returning to baseline levels. Thecumulative effects of cutting on total flow was an increase> one million m3 of water. Much of this increased dis-charge occurred in the autumn season when flows arelowest and both human and aquatic water demands arehighest. Analysis of the storm hydrograph showed that,during storm periods, quick-flow volume (direct runoff)increased an average of 17% (Douglass and Swank 1976).During the height of logging activity, peak dischargeincreased an average of 33% and then declined rapidlyfollowing road stabilization and recovery of evapotrans-piration.
94 USDA Forest Service Proceedings RMRS-P-13. 2000

Table 1. Summary of Watershed Responses to Multiple-UseManagement Prescriptions on WS28, Coweeta HydrologicLaboratory (0 = Minimal Response, + = Positive Response,- = Negative Response)
Resource/Use Response
Water Yield
Storm Discharge'
Sediment
Nutrient Loss
Vegetation
Wildlife
Recreation (Hunting, Hiking)
01-
01-
0
Sediment delivery to streams was minimal due to properroad locations and construction features. However, in-creased frequency of cleaning the weir ponding basinclearly indicated an acceleration of bedload movement.Much of the bedload scouring occurred in the streamsection where fish dams were constructed and reflectsreadjustment of the stream energy gradient. Apparently,the impact of management on aquatic resources wasminimal because the stream still supported a good nativebrook trout fishery several years after treatment. Streamchemistry was not measured in the early years but about10 years after disturbance, net nutrient budgets (com-pared to adjacent control watersheds) suggested smalllosses of nutrients from thei-watershed (Douglass andSwank 1976). '•£
Vegetation responses to cutting are rapid in the south-ern Appalachians due to both sprout and seedling regen-eration. Thirty years after harvesting in the 73 ha ofdearcutting prescription, basal area exceeds that of theforest prior to cutting (30 m2 ha"1). Moreover, the speciescomposition is greatly improved with and abundance ofQuercus, Prunus, Betula, Tilia, and Lirodendrm species(Swank 1998). Stand conditions present an array of futuremanagement options. Objectives of thinning the cove for-est were equally successful. Growth "rates of 'residual yel-low poplar were increased about 40% and by age 30, standbasal area had increased to 46 mzha'1. Advanced regenera-tion and understory diversity has increased over time andthere is also a diverse herbaceous layer (Parr 1992).
Responses of other resources and uses to managementhave also been evaluated or observed. The variety ofhabitats produced by silvicultural and prescriptions in-creased species diversity of breeding birds (Tramer 1969;Tramer 1994) and the variety of shrews and mice (Gentryet al. 1968). The varied habitat has been a strong attractantfor turkey foraging and the area supports a large turkey
population. Other wildlife such as deer and ruffed grousehave benefitted from management and the watershed,with improved access, is still a favorite area of hunters.The road network over the watershed also provides afavorite area for the day hiker. Wild flame azaleas thatbecame established on the edge of roadway clearing andan abundance of flowering dogwood provide outstandingaesthetic value.
Summary
This 35-year-old watershed based study has demon-strated that southern Appalachian forests can be success-fully managed for a variety of uses. Although there maybesome conflicts among uses, it is important to recognizethat ecosystem changes are not irreversible and opportu-nities are available to meet future goals. Many of thefindings from this pilot project have been factored intoforest management planing and practice. Moreover, wesuggest that another important long-term contribution ofthe study lies in its demonstration and education values.The watershed provides a setting where managementdecisions are made, applied, and evaluated. It provides anon-the-ground framework where managers, conservationand environmental groups, policy makers, and studentscan view and discuss resource issues. This benefit fromwatershed research has been repeatedly observed frominteraction with numerous groups who tour Coweeta andthis catchment each year.
Integrated WatershedEcosystem Management
> The Wine Spring Creek Ecosystem Management Projectis a recent example of integrated research where the water-shed is the basic unit for evaluating management and landstewardship. Ecosystem management is currently an op-erating philosophy of the USDA Forest Service with theobjective of usinganecologicalapproach to achievebroadermultiple use objectives (Kessler et al. 1992; Thomas 1996).Similar to when the concept of multiple use managementemerged in 1960, there are a wide range of views andopinions about the concept of ecosystem management(Swank and Van Lear 1992; Ecological Applications 1996).We suggest there is no blueprint for implementing ecosys-tem management; indeed, different approaches will beneeded to address the array of issues inherent to varied
3DA Forest Service Proceedings RMRS-P-13.2000 95
regions of the country. The real need is for tailored, on-the-ground examples of ecosystem management.
Compared to the earlier demonstration of multiple useat Coweeta, ecosystem management encompasses abroader perspective. Specifically, there is a mixed partner-ship where scientists, managers, the public,.and othergroups have a role in the decision making process. As aresult, the planning approach is more comprehensive, thescience is more interdisciplinary, and tools for synthesissuch as modeling and decision support systems are re-quired to facilitate interpretations. However, a commonthread of past and present approaches is that the water-shed still provides the fundamental framework for evalu-ating land use issues and alternatives for management.
The Setting and Approach
In 1992 we developed and initiated the ecosystem man-agement project in the 1820-ha Wine Spring Creek Basinwhich is located in the Nantahala mountains of westernNorth Carolina, about 50 km from Coweeta (Swank et al.1994). The objective of the project is to use/and or developecologically based concepts and technology to achievedesired natural resource conditions. The watershed iscomprised of steep slopes with elevations ranging from918 to 1660 m. Annual precipitation averages 1800 mmand mean monthly temperatures range from 0.5° in Janu-ary to 21.3° in July. A mix of hardwood forest types,dominated by oak, cover the watershed and McNab et al.
(1999) have classified five ecosystem units forbased on vegetation, soil, and topographic variables!through third-order streams drain the basin and;*}Spring Creek flows to Nantahala Lake, an important!ervoir in the region. Most of the basin is managed'bjWayah Ranger District, national Forests in North <lina, but a portion is in private ownership at the base.cwatershed near Nantahala Lake. The area supportfljdiverse fauna and variety of uses, with primary acce , .„„provided by a paved Forest Sendee road through tHefl||tllmiddle of the basin. --':g| """***'
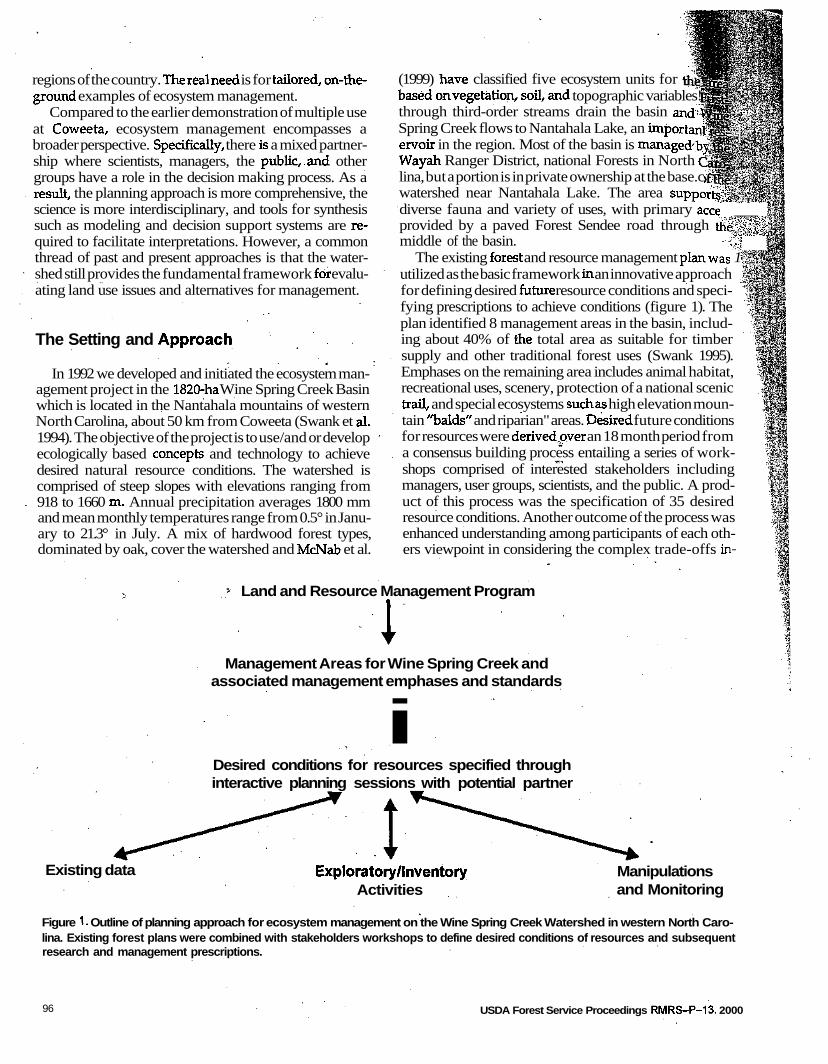
The existing forest and resource management plan was 1utilized as the basic framework in an innovative approachfor defining desired furore resource conditions and speci-fying prescriptions to achieve conditions (figure 1). Theplan identified 8 management areas in the basin, includ-ing about 40% of the total area as suitable for timbersupply and other traditional forest uses (Swank 1995).Emphases on the remaining area includes animal habitat,recreational uses, scenery, protection of a national scenictrail, and special ecosystems such as high elevation moun-tain "balds" and riparian" areas. Desired future conditionsfor resources were derived,pver an 18 month period froma consensus building process entailing a series of work-shops comprised of interested stakeholders includingmanagers, user groups, scientists, and the public. A prod-uct of this process was the specification of 35 desiredresource conditions. Another outcome of the process wasenhanced understanding among participants of each oth-ers viewpoint in considering the complex trade-offs in-
Land and Resource Management Program
Management Areas for Wine Spring Creek andassociated management emphases and standards
iDesired conditions for resources specified throughinteractive planning sessions with potential partner
Existing data Exploratory/InventoryActivities
Manipulationsand Monitoring
Figure 1. Outline of planning approach for ecosystem management on the Wine Spring Creek Watershed in western North Caro-lina. Existing forest plans were combined with stakeholders workshops to define desired conditions of resources and subsequentresearch and management prescriptions.
96 USDA Forest Service Proceedings RMRS-P-13. 2000

volved in ecosystem management (Meyer and Swank1996).
Research
Over the past 5 years a cadre of more than 60 scientistsand land managers in 6 research units in the SouthernResearch Station, National Forest Systems, and 8 universi-ties along with conservation and environmental groups,state agencies, and the public have participated in thestudy. The 35 desired resource conditions span 8 primaryresearch and management themes (table 2) which thus far,have entailed more than 40 studies. The research processentails the identification of existing data, exploratory andinventory activities, and manipulations/monitoringneeded to test hypotheses or achieve goals (figure 1). InPhase I of the project three prescriptions are centered onvarious habitat manipulations to move the watershedtoward desired conditions:
1. Stand replacement fire was prescribed on about300 ha to restore a degraded pine/hardwood com-munity and to stimulate forage production andpromote oak regeneration along a hillslope gradi-ent (Elliott et al. 1999). An interdisciplinary re-search team assessed initial responses of both
; terrestrial and aquatic ecosystems to management(table 3) and research continues to determine ifdesired conditions will be achieved;
i|2. Four silvicultural prescriptions (three replicates)were applied to the mixed oak stands to regener-
:Vate oak and increase bipdiversity. Research isleyaluating effects on vegetation, soil nutrients,jiwater quality, small mammals and herpetofauna,
ffed grouse, soil invertebrates, stream inverte-ates, and fish production;
3. Stream habitat improvement on an impoverishedaquatic habitat section of Wine Spring Creek hasbeen implemented through woody debris addi-tions based on research on trout use of woodydebris and habitat in Wine Spring the basin (Flebbe1999).
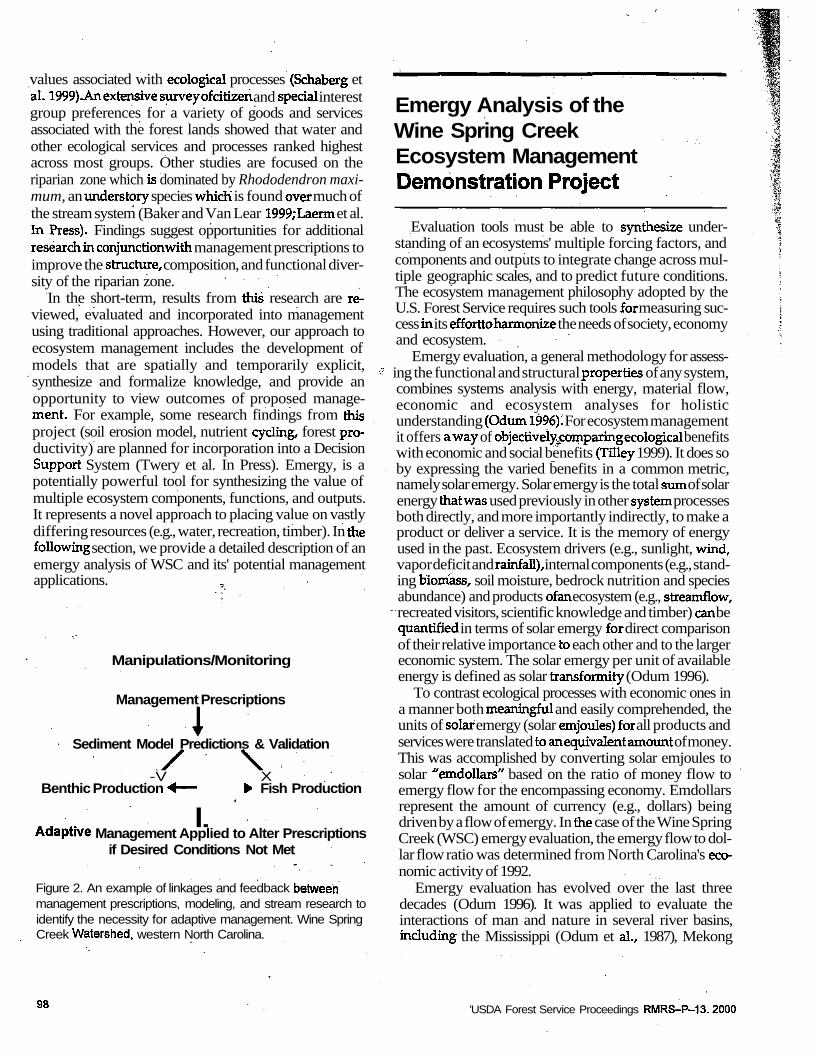
An example of how research is integrated with manage-ment is illustrated in figure 2 where measured effects onresources are linked with adaptive management to pro-vide a continuing process for achieving desired resourceconditions. A major strength of the research is simulta-neous studies in time and space which facilitates thedetection of cause and effect relationships and provides afirmer basis for management decisions. Opportunities forincorporating findings into management are greatly en-hanced because of the close planning and on-the-groundpartnership between managers, scientists, and other par-ticipants in the project.
Additional research in the project also provides valu-able information and tools for management. For example,soil erosion and stream sedimentation research are show-ing the benefits of best management practices associatedwith forest roads and other management prescriptions.Results have been used to develop a user-friendly, modu-lar based, Geographic Information System for predictingsoil erosion and transport to streams (Sun et al. In Press;Swank et al. 1994). This simulation model provides forestmanagers with a risk-assessment tool for evaluating theimpacts of alternative management practices on waterquality (Sun and McNulty 1998). An improved basis formanagement planning was also gained through socioeco-nomic research. Recreation studies identified human usesof the watershed and customer preferences for future uses(Cordell et al. 1996). Alarger scale study of national forestsin western North Carolina showed how economic toolscan be extended to quantify complex social and biological
/Tajor research and management themes derivedition of desired future conditions for resources
|Spring Creek basin.
sification
nagement
ijity/Water Quality/Habitat Alternation
toctiviry (Regeneration, Biodiversity, and"
sment
ilation Dynamics
aids")
Table 3. Summary of resources examined and relateddocumentation for stand replacement/habitat improvementburning on the Wine Spring Creek Ecosystem ManagementProject in western North Carolina
Resource Reference
Elliott etal. 1999
Voseetal. 1999
Vegetation ^
Nutrient pools, soil andstream chemistry, stream sediment
Small mammals and herpetofauna Ford et al. 1999
Soil macroarthropods Crossley and Lamoncha,In Press
gs RMRS-P-13. 2000
values associated with ecological processes (Schaberg etal. 1999). An extensive survey of citizen and special interestgroup preferences for a variety of goods and servicesassociated with the forest lands showed that water andother ecological services and processes ranked highestacross most groups. Other studies are focused on theriparian zone which is dominated by Rhododendron maxi-mum, an understory species which is found over much ofthe stream system (Baker and Van Lear 1999; Laenn et al.In Press). Findings suggest opportunities for additionalresearch in conjunction with management prescriptions toimprove the structure, composition, and functional diver-sity of the riparian zone.
In the short-term, results from this research are re-viewed, evaluated and incorporated into managementusing traditional approaches. However, our approach toecosystem management includes the development ofmodels that are spatially and temporarily explicit,synthesize and formalize knowledge, and provide anopportunity to view outcomes of proposed manage-ment. For example, some research findings from misproject (soil erosion model, nutrient cycling, forest pro-ductivity) are planned for incorporation into a DecisionSupport System (Twery et al. In Press). Emergy, is apotentially powerful tool for synthesizing the value ofmultiple ecosystem components, functions, and outputs.It represents a novel approach to placing value on vastlydiffering resources (e.g., water, recreation, timber). In thefollowing section, we provide a detailed description of anemergy analysis of WSC and its' potential managementapplications. ,
Manipulations/Monitoring
Management Prescriptions
Sediment Model Predictions & Validation
-V XBenthic Production -4.— E Fish Production
I.Adaptive Management Applied to Alter Prescriptions
if Desired Conditions Not Met
Figure 2. An example of linkages and feedback betweenmanagement prescriptions, modeling, and stream research toidentify the necessity for adaptive management. Wine SpringCreek Watershed, western North Carolina.
Emergy Analysis of theWine Spring CreekEcosystem ManagementDemonstration Project
Evaluation tools must be able to synthesize under-standing of an ecosystems' multiple forcing factors, andcomponents and outputs to integrate change across mul-tiple geographic scales, and to predict future conditions.The ecosystem management philosophy adopted by theU.S. Forest Service requires such tools for measuring suc-cess in its effort toharmonize the needs of society, economyand ecosystem.
Emergy evaluation, a general methodology for assess-<? ing the functional and structural properties of any system,
combines systems analysis with energy, material flow,economic and ecosystem analyses for holisticunderstanding (Odum 1996)! For ecosystem managementit offers a way of objectivelyjComparing ecological benefitswith economic and social benefits (Tilley 1999). It does soby expressing the varied benefits in a common metric,namely solar emergy. Solar emergy is the total sum of solarenergy that was used previously in other system processesboth directly, and more importantly indirectly, to make aproduct or deliver a service. It is the memory of energyused in the past. Ecosystem drivers (e.g., sunlight, wind,vapor deficit and rainfall), internal components (e.g., stand-ing biomass, soil moisture, bedrock nutrition and speciesabundance) and products of an ecosystem (e.g., streamflow,recreated visitors, scientific knowledge and timber) can bequantified in terms of solar emergy for direct comparisonof their relative importance to each other and to the largereconomic system. The solar emergy per unit of availableenergy is defined as solar transformity (Odum 1996).
To contrast ecological processes with economic ones ina manner both meaningful and easily comprehended, theunits of solar emergy (solar emjoules) for all products andservices were translated to anequivalent amount of money.This was accomplished by converting solar emjoules tosolar "emdollars" based on the ratio of money flow toemergy flow for the encompassing economy. Emdollarsrepresent the amount of currency (e.g., dollars) beingdriven by a flow of emergy. In the case of the Wine SpringCreek (WSC) emergy evaluation, the emergy flow to dol-lar flow ratio was determined from North Carolina's eco-nomic activity of 1992.
Emergy evaluation has evolved over the last threedecades (Odum 1996). It was applied to evaluate theinteractions of man and nature in several river basins,including the Mississippi (Odum et al., 1987), Mekong
98 'USDA Forest Service Proceedings RMRS-P-13.2000

(Brown and McClanahan 1996), Amazon (Odum et al.1986) and Maracaibo of Columbia and Venezuela(Howington 1999). Small watersheds have also been evalu-ated with emer gy, including ones of the southern Braziliancoast (Romitelli 1997), the Coweeta Hydrologic Lab(Romitelli and Odum 1996) and most recently Wine SpringCreek of the Southern Appalachians (Tilley 1999).
We describe, the methodology and demonstrate its ap-plication in evaluating the ecological-economic system ofthe Wine Spring Creek Ecosystem Management Demon-stration Project (WSC). The multiple benefits of the for-ested watershed, such as wood, water, tourism and bio-geochemical cycling, are compared in terms of solar emergyand emdollars.
Methods of Emergy Evaluation
Applying the emergy evaluation methodology to theWSC involved four steps:
1. identifying the system,
2. creating an emergy evaluation table,
3. determining the energy value of forcing factorsand components and
4. converting energy values to solar emergy andemdollars.
The energy systems language (figure 3a) was used toconceptualize the system of the WSC. The diagrams pro-vided a holistic picture of the ecosystem and identified theimportant forcing factors, internal components and ex-ported products, along with their interactions. The pro-cess of developing each energy systems diagram was asfollows:
1. The spatial boundary was defined as the water-shed,
The temporal boundary was defined as a year,
A list of the forcing factors and internal units,thought to be important, was developed withmput from the project team and other experts,
: Preliminary, complex diagrams of the system wereJrawn with the energy systems language, arrang-
ig forcing factors and internal components inof their solar transformity,
|gh values of the solar emergy of the forcingIts and state variables were calculated as ap. of filtering out unessential parameters and~~a?ting others,
6. A final systems diagram was drawn, includingonly those forcing factors and state variables whichrepresented greater than 5% of total emergy fl—-or stocked, respectively.
low
fjce Proceedings RMRS-P-13. 2000
Figure 3b explains how the solar emergy values of theforcing factors, internal processes and multiple productsof a system were calculated. First, the energy flow of eachforcing factor was determined. The energy was trans-formed to solar emergy by multiplying by the appropriatesolar transformity. Unless calculated within this work orotherwise noted, solar transformities used were from Odum(1996). In figure 3b the solar emergy value of the internalpathway Z equaled the solar emergy input Y. The solaremergy of product V was the sum of the two inputs tosector B, Z and U. The solar transformity of input U wasdetermined based on its external transformation (i.e., Y'/U'). The solar transformity of internal pathway Z and theproduct V were calculated by dividing solar emergy byenergy. The emdollars of each flow were found by divid-ing solar emergy by the average solar emergy-to-dollarratio of the regional economy. In the case of WSC it was1.12 E12 sej/$.
Results and Discussion ofEmergy Evaluation
Figure 4a is the systems diagram of the ecosystem ofWine Spring Creek watershed. The diagram demonstrateshow the energies of the meteorological system—sunlight,wind, vapor saturation deficit and rain—interacted with. the mountain geology to create a mixed-hardwood forestwith organically rich soils, deep saprqlite and plentifulwater reserves.
Figure 4b shows the systems diagram of the ecologicaleconomic system of the Wine Spring Creek watershed.The details of the ecosystem, which were shown in figure4a, -were aggregated and economic forcing functions wereadded. The diagram revealed how the capture of environ-mental energies by forest and mountain supported theecosystem, which in turn, formed the basis for the humaneconomy.
The diagrams and the process of developing themprovide an instrument for focusing the attention of man-agers, policy makers and other environmental decisionmakers on the whole system. They help build consensusby identifying the system. If the practice of organizingforcing functions and components from left to right, ac-cording to their solar transformity, is followed, then holis-tic overview prevails and the diagrams clarify under-standing.
99

Or
Energy circuit- A pathway forrepresenting the flow ofenergy, material or information.Source: Outside source ofenergy delivering forces orflows (forcing function).Storage; An energy storage(state variable).Heat sink; Dispersion ofpotential energy into heatInteraction.' Interactiveintersection of twopathways coupled toproduce an outflow.Box: Miscellaneous symbolfor function is labeled.
a) Definition of energy systems language.
Consumer Unit that
jdg8
quality, stores h, andfeeds h backautocatarytically.Producer: Unit thatcollects and transformslow-quality energyunder controlinteractions ofhigh-quality flows.Transaction: Indicatesa sale of goods orservices (solid line)in exchange for paymentof money (dashed line).
i Y
External' I transformation\ofYJoU _
„ Evaluated System
b) Systems diagram for explaining emergy. —A— ^ .—o- *" — Sink
Figure 3. Energy systems language with definitions (a) and an energy systems diagram explaining how emergy flows are calcu-lated (b). Abbreviations: e(X) = energy of X; M(X) = emergy of X; T(X) = transformity of X. The first step is to determine energyvalues of inputs, Y & U, internal pathway, Z and exported product, V. Next, emergy is assigned based orhhe total emergyrequired to make a product. Thus, M(Y)=T(Y)*e(Y), M(Z)=M(Y), M(U)=T(U)*e(U), M(V)=M(Z)+M(U). The waste heat [e(a)+e(b)]does not possess emergy since it is the energy lost in the energy transformation process. Finally, the transformities of the internalpathway and exported product are determined, T(Z)=M(Z)/e(Z) and T(V)=M(V)/e(V). In this example, T(U) is needed in terms ofthe base energy source, Y. Therefore, T(U) would need to be calculated, T(U)=M(T)/e(U').
100 USDA Forest Service Proceedings RMRS-P-13. 2000

Wind
a) Ecosystem of Wine Spring Creek —Tiltey, 1999
Water Runoff, t Fuete
Sediment Yield
Human builtnfrastructure
TimberRecreationResearch
b) Ecological Economic Systemof Wine Spring Creek
Tiey, 1999
Diagram of the ecosystem of Wine Spring Creek watershed (a) and systems diagram of the ecological eco-ine Spring Creek watershed (b). Abbreviations: N-nutrients, e-water vapor, O.M.-organic matter.
«dingsRMRS-P-l3.2000 101

Table 4 shows the emergy evaluation of the environ-mental energies used, the economic energies imported,the main internal processes and four important productsexported for the WSC watershed.
The chemical energy of precipitation provided the larg-est input of solar emergy (1603 Em$/ha/y), environmen-tal or economic. Remarkably, four of the environmentalsources (geopotential of rain, chemical potential of waterused in transpiration, water vapor saturation deficit andland cycle) contributed a similar amount of solar emergy-between 385 and 525 Em$/ha/y. The solar emergy ofsunlight and atmospheric deposition were the two small-est environmental contributors (<46 Em$/ha/y). The totalincoming solar emergy derived from renewable environ-mental sources (2055 Em$/ha/y) was the sum of threeindependent sources: chemical potential of precipitation,land cycle and atmospheric deposition. Other environ-mental sources are not added to avoid double counting(see Tilley 1999 for further explanation).
Comparison of the solar emergy contributed by thevarious ecosystem drivers demonstrated that water wasthe most important factor and indicates that properlymanaging water is critical to ecosystem health. The largeamount of solar emergy in the land cycle confirms the factthat soil management is also important for a vibrant forest.
Listed next in table 4 (items 9-16) are the non-renewablesources of solar emergy that were imported by humans.The watershed received over 15,000 visitors annually(Cordell et al.1996). Tourists used various energies (auto-motive fuel and their own services) to enjoy free recre-ational resources. In one year, visitors utilized 12 Em$/ha/y of automobile fuel while in the WSC watershed. Anadditional 124 Em$j/ha/y of auto-fuels were consumedby local through-traffic. The value of the tourists' time,worth 699 Em$/ha/y, was a major imported resource. TheForest Service, over the last 25 years was paid an averageof $9/ha/y (12 Em$/ha/y) by loggers. This was an orderof magnitude less than the Forest Service expended (121Em$/ha/y) to maintain 32 km of paved and unpavedroads, but nearly equal to the value paid for managementservices (18 Em$/ha/y). The largest imported source ofsolar emergy was from scientist's participating in the WSCEcosystem Demonstration Project (1252 Em$/ha/y).
If ecological sustainability is defined as the condition atwhich ecosystem benefits are acquired at a rate that doesnot hinder ability to provide future goods and services,then the ecological sustainability of the WSC system can bemeasured with the environmental loading ratio (ELR).The ELR was defined as the total imported solar emergyper unit of indigenous, environmental solar emergy (Brownand Ulgiati 1997). The WSC had an ELR of 1.1 indicatingthat economic activity evenly matched the ecological ca-pacity of the forest. If the WSC was pristine and not usedin any way for economicpurposes, then there would be no
imported solar emergy and the ELR would be zero,purpose ecosystems with ELR's lower than the WSC ifdude the Luquillo National Forest in Puerto Rico (ELRJ0.15; Doherty et al. 1997), where visitation was muchigher but spread over a greater area, and the Everglade!!National Park (ELR = 0.82; Gunderson 1992). OdumOdum (1980) found the ELR of a New Zealand pineplantation to be 1.4. At this rate of economic activity theecological sustainability of the pine plantation cannot beassessed with definitiveness, but the ecological sourcesdid provide less solar emergy than economic sources. Forfurther perspective on how the ELR relates to ecologicalsustainable, consider that the ELR of Charlotte (N.C.), amodern American city, was 134 (Tilley 1999). Increasingthe amount of imported solar emergy to the WSC willmake the economic "load" much greater and the ecosys-tem less sustainable.
From a management perspective, the ELR could usedfor regional forest planning. Multi-purpose lands such asthe WSC, could be targeted to maintain an ELR of one (i.e.,an even match between economy and ecology), whilewilderness lands could be'selected to have much lowerELR's, possibly less than 0,10.
In table 4 the solar emergy value of wood growth andforest production (NPP) were each 892 Em$/ha/y, whichwas the sum of the solar emergy of transpiration, landcycle and atmospheric deposition. The geologic work thatweathered bedrock was the most valuable internal pro-cess (2055 Em$/ha/y).
Water yield, harvested timber, recreationists and scien-tific data were the exports determined to posses largeamounts of solar emergy (table 4). Total solar emergy of allexports was 4292 Em$/ha/y. Based on this rate, the 1128ha WSC watershed contributed wealth to the region at theannual rate of 4.8 million Em$.
A goal of ecosystem management is to maintain abalance between the ecological, economic and sociologicalgoods and services provided by the ecosystem. With theemergy model, the balance (i.e., all outputs contributeequal solar emergy) of an ecosystem as well as its totaloutput can be determined for alternative managementplans. The WSC is fairly well balanced because it is con-tributing multiple benefits (water, recreation and infor-mation), valued in terms of solar emergy, at similar rates(table4). If perfect balance is the goal, then timber harvest,which represented only 6% of total solar emergy output,needs to be increased or the other benefits need to bedecreased. With all flows (input, internal and output) inthe same unit (solar emergy), a sensitivity analysis caneasily be performed to determine what happens to thebalance of watershed products and ecosystemsustainability (i.e., environmental loading ratio ~=1.0)under various management plans.
mif
102 USDA Forest Service Proceedings RMRS-P-13. 2000
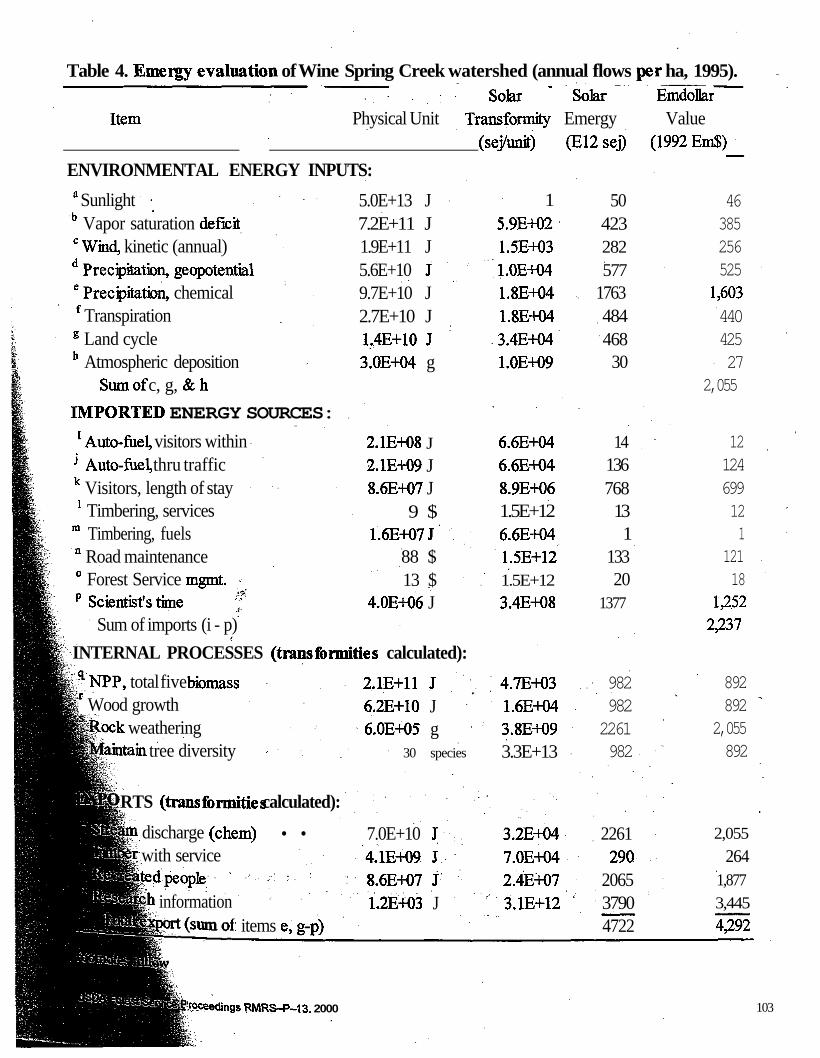
Table 4. Emergy evaluation of Wine Spring Creek watershed (annual flows per ha, 1995).• . . ~ ~ . , ; • Solar " Solar Emdollar
Item Physical Unit Transformity Emergy Value. ' (sej/unit) (E12sej) (1992 Em$)
ENVIRONMENTAL ENERGY INPUTS:a Sunlightb Vapor saturation deficit0 Wind, kinetic (annual)d Precipitation, geopotentiale Precipitation, chemicalf Transpiration
g Land cycleh Atmospheric deposition
Sum of c, g, &h
IMPORTED ENERGY SOURCES:1 Auto-fuel, visitors withinj Auto-fuel, thru traffick Visitors, length of stay1 Timbering, services
m Timbering, fuelsn Road maintenance0 Forest Service mgmt. -p Scientist's time *
Sum of imports (i - p)
INTERNAL PROCESSES (transformities calculated):q
5.0E+13 J7.2E+11 J1.9E+11 J5.6E+10 J9.7E+10 J2.7E+10 J1.4E+10 J3.0E+04 g
15.9E-+021.5E+03l.OE+041.8E-KM1.8E+043.4E+04l.OE+09
50423282577
1763484468
30
2.1E+08 J2.1E+09 J8.6E-K)7 J
9 $1.6E407 J
88 $13 $
4.0E+06 J
6.6E+046.6E-+048.9E+061.5E+126.6E-H)41.5E+121.5E+123.4E-+08
14136768131
13320
1377
1NPP, total five biomassr Wood growth
lock weatheringlin tree diversity
RTS (transformities calculated):
discharge (chem)with serviceitedpeople
information
2.1E+11 J6.2E+10 J6.0E+05 g
30 species
4.7E-+031.6E-+043.8E-K)93.3E+13
9829822261982
46385256525
1,60344042527
2,055
12124699121
12118
1,2522,237
892892
2,055892
an) • • 7.0E+10 J4.1E+09 J8.6E-H)7 J1.2ELH)3 J
: items e,g-p)
3.2E-HM7.0E-+042.4E-+073.1E+12
2261290
206537904722
2,055
2641,8773,445
4,292
Irpceedings RMRS-P-13. 2000 103

Footnotes to Table 4 " ,* Solar insolation @ ground 5.02E+13 J/mA2/yr (taken from Coweeta, Swift et al., 1988)
b Energy of vapor saturation deficit used, J/y = 7.17E+11 (see TUley 1999)
' Wind energy, J/y = 1.88E+11 (complex function, see TUley 1999 for details)d Potential energy @ mean elev. (J) = (area)(runoff)(mean elev - min elev)(densityXgravity)
(10,000 mA2)*(1.423 m/y)*(1318-920 m)*(1000 kg/m^.SEnergy, geopotential (J) = 55.5E+9
e Precipitation® 1330 m= 1,961 mm/yr Forest Service (1995-1997)Gibb's free energy of rainfall (10ppmvs35ppt),J = (area)(rainfell)(Gibbs no.)
. - • (10,000 mA2)*(1.960m)*(4.94E6J/mA3)Gibb's free energy (J) = 9.69E+10
f Mean rate of transpiration 538 mm/y CS30U (pers. coram. L. Swift, Coweeta)Gibb's free energy of rainfall (lOppm vs 35ppt), J = (areaXtranspiration)(Gibbs no.)
(10,000 mA2)*(0.538m)*(4.94E6 J/mA3)Total energy (J) = 2.66E+10
8 Emergy of land cycle calculated as eartHeat flow/Area = 1.36E-HJ6 J/n^l/y, @ Bryson City, NCEnergy (J) = 1.36E+10 (Smith et al., 1981; in Pollack et al.,;1991).Transfonnity, 34,400 sej/J was the mean calculated for the continents by Odu& 1996.
1
' Deposition rate, kg/ha/y:
Gas within WSC =Energy(J) =Energy(J/ha) =
Gas within WSC -EnergyCD =Energy(J/ha) =
30 estimate based on Coweeta Hydrologic Lab
3.70E+01 (bbl/yr, see Tilley 1999)(_bbl/yr)*(6.28e9 J/bbl)2.06E-K)8
3.70E+02 (bbl/yr, see Tilley 1999)(_bbl/yr)*(6.28e9 J/bbl)2.06E+09
no. ofgroupsfyr =mean group size =mean length of stay =
Energy(J) =Energy(J/ha) =
4,361 Cordelletal., 1996.2.7 people
19.0 hours(__people-hrs/yr)*(104 Cal/hr)*(4186 J/Cal)8.63E+07
Transfonnity of 8,900,000 sej/J is the avg. for a U.S. citizen during avg. day.
1 Revenue from timber sales from 1973-1999 (26y) was $250,000 (Wayah Ranger District).Revenue, $/ha/y - 8.5
m U.S. National average fuel use: 23 E15 J/y to harvest 648 E6 mA3'of woodFuel use in WSC timbering, J/ha/y = 1.56E+07
' Length of unpaved roads:
Length of paved roads =Cost to maintain roadsCost of rd, $/ha/y =Costofrd,$/y =
24 km (CIS database)9 km (GIS database, FS 711)
5.000 $/mile/y (B. Culpepper. Wayah Ranger District)(length of rds, km)x($5000/mile/y)x(l mile/1.609 km)/(1128 ha)8.84E-H)!
104 USDA Forest Service Proceedings RMRS-P-13. 2000

0 Expenditures, $/ha/y = 13
P At least 52 forest scientist, forest managers, university scientists and graduate studentsworked on the WSC Ecosystem Project from 1992-99. Assume they devoted 10% of then-total wmk per year to gathering, analyzing, publishing and sharing their researchEffort, people-hr/y = 1.04E-KW
Energy (J/ha) = ( peoplc-hrsMWKM Cal/hr)*(4186 J/Caiy<l 128 ha)Energy (J/ha) = 4.01E+06
Transformity: post-college educated person (Odum 19%)
4 Roots+wood+leaves 14390 kg/ha/y; Day and Monk, 1977.Energy(J) = (NPP4cg/ha^)x(area,ha)(l()OOg/kg)(3.5kcal/g-dry wt)(4186 J/kcal)
2.11E+I1Transformity = (empower of evapotranspiration + deep heat + atmos. dep.) / (net production)
r Wood growth 4.20E+03 kg/ha/y; Monk and Day, 1977.Energy(J) = (accum.,kg/ha/y)x(area. ha)(1000 g/kg)(3.5 kcal/g-dry wt)(4186 J/kc
6.15E+10Transformity = .(empower of evapotranspiration + deep heat + atmos. dep.) / (wood accumulation
'Erosionrate,g/mA2/y = 60 Vefoel, 1985.Sediment lost, g/ha/y 6.00E+05Empower-to-flux (sej/g) = (empower of rain+deep heat+atmos. dep.) / (weathering rate)
1 From die species-area curve, there were 30 species found within the first ha sampled.See TJOey 1999 for details
9 Stream dischargeRunoff = 1.42 m/y mean 1995-96. Source: Coweeta Hydro. LabChemical Energy(J) = (10,000 mA2)*(U2 m/y)*(4.94E6 J/mA3)Chemical Energy(J) = 7.03E+10Transformity: [empower of rain + deep heat] / energy
v Since 1973 (26^), timber harvest from WSC watershed was 8623 mA3 sawtimber and 4259mA3 of roundW|od, valued at $251,000 (Wayah Ranger District courtesy of BillTimber harvest rate, mA3/ha/y= 0.44
Energy(J)= ( mA3)*(5E5g/mA3)*(4.5Kcal/g)*(4186 J/Cal)Ene^gy(J)= 4.14E+09
Transformity of timber = (emergy of wood + road maintenance + FS management +timbering fuels + timbering servicesVenergy of timber .
w Same energy as visitor's length of stay above (#24)Transformity = [sum of env. & econ. empower inputs /{metabolism of visitors duringEnvironmental inputs were taken as half the annual flow of rain+deepheat+atmosphericdeposition since the main road is only opened from Apr. to Nov. ,Economic inputs were sum of auto-fuel use, visiting time, road maintenance, and FS managemen
x From 1992 to 1998,47 publications and 10 reports were produced (Swank 1999)Publication rate over the six years was 57 76 = 9.5 pubsy^r. Publications average 10 pages in lenGrams of research.articles published, g/y = 9.5 articles/y x 10 pages x 1 g/page - 95 g/yEnergy of articles, J/y = grams x 3.5 kcal/gx 4186 J/kcal = 1.39E6J/yEnergy of articles, J/ha/y= 1,232Transformity = [sum of empower inputs (rain, deepheat, atmospheric deposition, roadmaintenance, FS management, and research erToit)]/[energy of publications, annual rate]
y Total Export was rain + deep heat + atmos. deposition -t- all imported sources (items 10-18)
orest Service Proceedings RMRS-P-13,2000 105

Regional Scale Analyses inProgress
Watersheds also provide a useful framework for evalu-ating land stewardship at larger landscape scales; i.e.,river basins. However, the complexities of planning andassessment increase substantially at a regional scale withmixed ownerships and multiple land uses.
As part of the Long-Term Ecological Research programat Coweeta, regional scale research was initiated to assessthe effects of human caused disturbances on ecologicalprocesses. The effort encompasses a 15,000 km2 area ofwestern North Carolina with a focus on the Little Tennes-see and French Broad river basins. Interdisciplinary re-search is being conducted by more than 30 co-principalinvestigators including social and economic scientists,as well as aquatic and terrestrial ecologists. The overallresearch goal is to develop a predictive understandingof the social, economic and environmental factors thatdrive land use cover changes and to assess the ecologi-cal consequences of changes for terrestrial and aquaticbiodiversity, water quality, and regional carbon cycles(Swank 1998). Regional land use change models (Wearand Bolstad 1998) will be linked to socioeconomic andenvironmental models to forecast the consequences offuture land use practices and policy. Initial researchshows that whole watershed land use in the 1950s (com-pared to 1990s) is the best predictor of present daydiversity of stream invertebrates and fish (Harding et al.1998). Findings indicate that past land use, particularlyagriculture, may result in long-term reductions in aquaticdiversity, that persist even with reforestation of the water-shed.
Acknowledgments
The authors wish to thank James M. Vose arid JayMartin for technical reviews and suggestions for im-proving the manuscript. We also acknowledge the con-tributions of numerous colleagues including the WayahRanger District staff; particularly Bill Culpepper andMichael Wilkins for their support on Wine SpringCreek.
Literature Cited
Baker, T.T.; Van Lear, D.H. 1998. Relations between diver-sity of rhododendron thickets and diversity of riparianforest For. Ecol. Manage. 109:21-32.
Brown, M.T.; Ulgiati, S. 1997. Emergy based indices andratios to evaluate sustainabiliry: monitoring technologyand economics toward environmentally sound innova-tion. Ecological Engineering. 9:51-69.
Brown, M.T.; McClanahan, T.R. 1996. Emergy analysisperspectives of Thailand and Mekong River dam pro-posals. Ecological Modeling. 91(1-3): 105-130.
Cordell, H.K.; Bliss, J.C.; Johnson, C.Y.; Fly, M. 1998.Voices from the South. Trans. 63rd No. Am. Wildl. andNatur. Resour. Conf. 332-347.
CordeU,H.K.;Teasley,R.J.;BergstromJ.1996. CUSTOMER:Wine Spring Creek watershed. Final report, Southeast-em Forest Experiment Station, Athens, GA. 88 pp.
Crossley, D.A., Jr.; Lamoncha, K.L. In Press. Response offorest soil microarihropods to a forest regenerationburn,at Wine Springs ;f(Southem Appalachians). In:Proceedings First Biennial North American Forest Ecol-ogy Workshop; 1997 June 24-26; Raleigh, N.C.
Doherty, S.J.; Scatena, F.N.; Odum, H.T. 1997. Emergyevaluation of the Luquillo Experimental Forest andPuerto Rico. Final report to International Institute ofTropical Forestry, Rio Piedras, Puerto Rico.
Douglass, J.E.; Swank, W.T. 1976. Multiple use in southernAppalachian hardwoods - a ten year case history. In:Proceedings of the 16th Intern. Union of Forestry Res.Organization's World Congress, 1976, Oslo, Norway.IUFRO Secretariat, Vienna, Austria. 425-436.
Day, F.P., Jr.; Monk, C.D. 1977. Net primary productionand phenology on a Southern Appalachian watershed.Amer. J. Botany. 64:1117-1125.
Ecological Applications. 1996. Forum: Perspectives onecosystem management. 6:692-745.
Elliott, K.J.; Hendrick,R.L.; Major, A.E.; Vose, J.M.; Swank,W.T. 1999. Vegetation dynamics after a prescribed fire inmesouthernAppalachians.For.EcoLManage. 114:215-226.
Flebbe, P.A. 1999. Trout use of woody debris and habitatin Wine Spring Creek, North Carolina. For. Ecol. Man-age. 114:367-376.
Ford, W.M; Menzel,M.A.; McGill,D.W;; Laerm, ].; McCay,T.S. 1999. Effects of a community restoration fire onsmall mammals and herpetofauna in the southern Ap-palachians. For. Ecol. Manage. 114:233-243.
106 USDA Forest Service Proceedings RMRS-P-13. 2000

Gentry, J.B.; Odum, E.P.; Mason, M.; Nabholz, V.; MarshaU,S.; McGinnis, J.T. 1968. Effect of altitude and forestmanipulation on relative abundance of small mam-mals. Jour. Of Mammalogy. 49:539-541.
Gunderson, L.H. 1992. Spatial and temporal dynamics inthe Everglades ecosystem with implications for waterdeliveries to Everglades National Park. M.S. thesis.University of Florida, Gainesville. 239 pp.
Harding, J.S.; Benfield, E.F.; Bolstad, P.V.; Helfman, G.S.;Jones, E.B.D. m. 1998. Stream biodiversity: the ghost ofland use past. Proceedings of the National Acad. Sci.U.S.A. 95:14843-14847.
Hewlett, J.D.; Douglass, J.E. 1968. Blending forest uses.Research Paper, SE-37 USDA, For. Serv. SE For. Expt.Sta., AsheviUe, N.C. 15 pp.
Howington, T. 1999. A spatial analysis of emergy of aninternationally shared drainage basin and the implica-tions for policy decisions. Ph.D. dissertation. U. ofFlorida, Gainesville.
Kessler, W.V.; Salwasser, H.; Cartwright, C. W., Jr.; Caplan,J.A. 1992. New perspectives for sustainable naturalresources management. Ecological Applications. 2:221-225.
Laerm, J.; Menzel, M.A.; Wolf, D.J.; Hicks, N.G. In Press.Role of riparian zones in structuring small mammalcommunities in the Southern Appalachians. In: Pro-ceedings First Biennal North American Forest EcologyWorkshop; 1997 June 24-26, Raleigh, N.C.
McNab, W.H.; Browning, S.A.; Simon, S.A.; Fouts, P.E.1999. An unconventional approach to ecosystem unitclassification in western North Carolina, USA. For.Ecol. Manage. 114:405-420.
Meyer, J.L.; Swank, W.T. 195f6. Ecosystem managementchallenges ecologists. Eco£ Appl. 6(3): 738-740.
Odum, H.T., 1996. Environmental accounting: emergyand environmental decision making. John Wiley andSons, New York. 370 pp.
Odum, H.T.; Odum, E.G. 1980. Energy systems of NewZealand and the use of embodied energy for evaluatingbenefits of international trade. Proceedings of EnergyModelling Symposium, Nov. 1979, Technical Publ. No.
k 7. New Zealand Ministry of Energy, Wellington, NZ.J -247 pp.
, H.T.; Brown, M.T.; Christiansen, R.A. 1986. En-SY systems overview of the Amazon basin. Report to
Cousteau Society. Center for Wetlands, U.of FL 190pp.""/ H.T.; Diamond, C.; Brown, M. 1987. Energy sys-
& overview of the Mississippi River Basin. CenterrAT-lTands #87-1, Univ. of Florida. 107 pp.
y!992. Long-term vegetation response to thin-p southern Appalachian cove. MS Thesis, Univ.*~- Athens, GA. 126pp.
Hurter,SJ.;Johnson,J.R.1991.Anew globalbmpilation. Department of Geological Sci-i Mich., Ann Arbor.
Romitelli, M.S., 1997. Energy analysis of watersheds. Ph.D.dissertation,.University of Florida, Gainesville. 292 pp.
Romitelli, M.S.; Odum, H.T., 1996. Energy analysis ofCoweeta River basin, N.C. Final report to the U.S.D.A.Coweeta Hydrologic Laboratory, Otto, NC.
Schaberg, R.H.; Holmes, T.P.; Lee, K.J.; Abt, R.C. 1999.Abscribing value to ecological processes: an economicview of environmental change. For. Ecol. Manage. 114:329-338.
Sheffield, R.M.; Dickson, J.G. 1998. The South's forestland- on the hotseat to provide more. Trans. 63rd No. Am.Wildl. and Naur. Resour. Conf. 316-331.
Southern Appalachian Man and the Biosphere (SAMAB).1996. The southern Appalachian assessment summaryreport. Rept. 1 Of 5. Atlanta: USDA, Forest Service,Southern Region. 166 pp.
Sun, G.; McNulty, S.G. 1998. Modeling soil erosion andtransport on forest landscape. In: Winning Solutions forRisky Problems: Proceedings of Conference 29, Interna-tional Erosion Control Association. 187-198.
Sun, G.; McNulty, S.G.; Swift, L.W., Jr.; Boggs, J. In Press.Risk assessment of sediment contribution to streamsdue to forest management using a GIS-based simula-tion model. 1999 ASAE Annual International Meeting,Toronto, Ontario, Canada. Paper No. 995050.
Swank, W.T. 1995. Current issues facing foresters in partsof North America. In: Brown, I.R. ed. Forests and Water:Proceedings of a discussion meeting; 1994 March 25-27;Edinburgh, Scotland. Institute of Chartered Foresters:129-148.
Swank, W.T. 1998. Multiple use forest management in acatchment context. In: Proceedings of an InternationalConference. Multiple Land Use and Catchment Man-agement. Eds. Cresser, M.; Pugh, K. The MacaulayLand Use Research Institute, Aberdeen, Scotland, UK.27-37.
Swank, W.T.; McNulty, S.G.; Swift, L.W., Jr. 1994. Oppor-tunities for forest hydrology applications to ecosystemmanagement. In: Ohta, T.; Fukushima, Y.; Suzuki, M.,eds. Proceedings of the International Symp. on For.Hydrology; 1994 Oct. 24-28; Tokyo, Japan. 19-29.
Swank, W.T.; Van Lear, D.H. 1992. Multiple-use manage-ment: Ecosystem perspectives of multiple-use manage-ment. Ecological Applications. 2:219-220.
Swift, L.W., Cunningham, G.B.; Douglass, J.E. 1988. Cli-^matology and hydrology. In: Swank, W.T.; Crossley,D. A., Jr., eds. Forest hydrology and ecology at Coweeta.Ecological Studies, vol. 66. New York: Springer-Verlag:35-55.
Thomas, J.W. 1996. Forest Service perspective on ecosys-tem management. Ecological Applications. 6: 703-705.
Tilley, D.R. 1999. Emergy basis of forest systems. Ph.D.dissertation. University of Florida, Gainesville. 296 pp.
Tramer, E.J. 1969. Bird species diversity: components ofShannon's formula. Ecology. 50: 927-929.
\ Proceedings RMRS-P-13. 2000 107

Tramer, E.J. 1994. Breeding bird consensus at CoweetaHydrologic Laboratory: A comparison of 1967 and 1993.Coweeta Historical Files. 1.5:25 pp.
Twery, M.J.; Rauscher, H.M.; Bennett, D.J.; Thomasma,S.A.; Stout, S.L.; Palmer, J.F.; Hoffman, R.E.; DeCalesta,D.S.; Gustafsm, E.; Cleveland, H.; Grove, J.M.; Nute, D.;Kim, G.; Kollasch, R.P. In Press. NED-1: Integratedanalyses for forest stewardship decisions. Computersand Electronics in Agriculture.
Velbel, M. A. 1985. Geochemical mass balances and weath-ering rates in forested watersheds of the southern BlueRidge. Am. J. Sci. 285:904-930.
Vose, J.M.; Swank, W.T.; Clinton, B.O.; Knoepp, J.D.;Swift, L.W. 1999. Using stand replacement fires torestore southern Appalachian pine-hardwood ecosys-tems: effects on mass, carbon, and nutrient pools. For.Ecolo. Manage. 114:215-226.
Wear, D.N.; Abt, R.; Mangold, R. 1998. People, space andtime: Factors thatwiflgovernforestsustainability. Trans.63rd No. Am. Wildl. and Narur. Resour. Conf. 348-361.
Wear, D.N.; Bolstad, P. 1998. Land use changes in southernAppalachian landscapes: Spatial analysis and forestevaluation. Ecosystems. 1:575-594.
108 USDA Forest Service Proceedings RMRS-P-13. 2000