land resources -...
TRANSCRIPT

Land ResourcesRika Harini
General Concept of Land and Soil
• Ambiguity between soil and land
• The meaning is really different but related to each other

The Meaning of Land
• As a chemistry laboratory in nature where decomposition process and chemistry synthesize reaction happen (Berzelius, 1803)
• To make it simple land is the uppermost earth crust which was formed by weathered rock (Fallon, 1855)

• Land as a mineral and organic form and also as a result of live and dead creatures activities with relief parent material on the earth surface (Dokuchaev, 1879).
• Land is the outermost of earth crust, non-coherent and crumbly material, and tend to have different characteristics in terms of colour, structure, physical characteristics, chemistry process and composition, and also biological and morphological characteristics (Marbut, 1927).

• Land encompasses all environmental condition where soil is one of its part.
• Land: combination of earth surface and close-to-surface elements which very important for human life (Mabbut, 1968)

Land (Geographically)
Land is a specific area in the uppermost part of the earth, including all biosphere elements which able or not able to move and located in above or below the earth crust in that area; consist of atmosphere, soil and rock material, topography, water, plants and animals; also the effect of human activities during the past times or current times; which all affect the use of land by human in the meantime or future.

Land is one of many important natural resources for human to live (socio-economically and sosio-culturally)
The highest institution related to land in Indonesia (BPN-National Bureau of Land), still using “soil” as a terms of land. The reasons behind the difficulties of changing are below.
1. Technically, changing “soil” into “land” bring major consequences which need more time, work, and fund.
2. Juridically, law of land (UUPA) is still using “soil” in terms of “land
“land” is used in terms of science while “soil” is used in terms of technical matters.

Soil dimension from aspect of area (area, field, space) or land could be seen from these aspects below.
1. Area (narrow area, spacious area); Ownership status (legality: possessed land, rent land, “sakap” land, country land, people land, cultural land (lahan adat))
2. Morphology (terrain form based on process, erosion land, sedimentation land, weathered land, aquatic land, land area)
3. Topography (elevation and slope: flat, wavy, hilly, mountainous)
4. Geology ( based on its rock bed)

The effect of human activity to land (Kotrowicki,1964)
Land (Landuse Object)Human
(Landuse Subject)
Landuse Form Landuse OrientationLanduse Method Landuse Effect
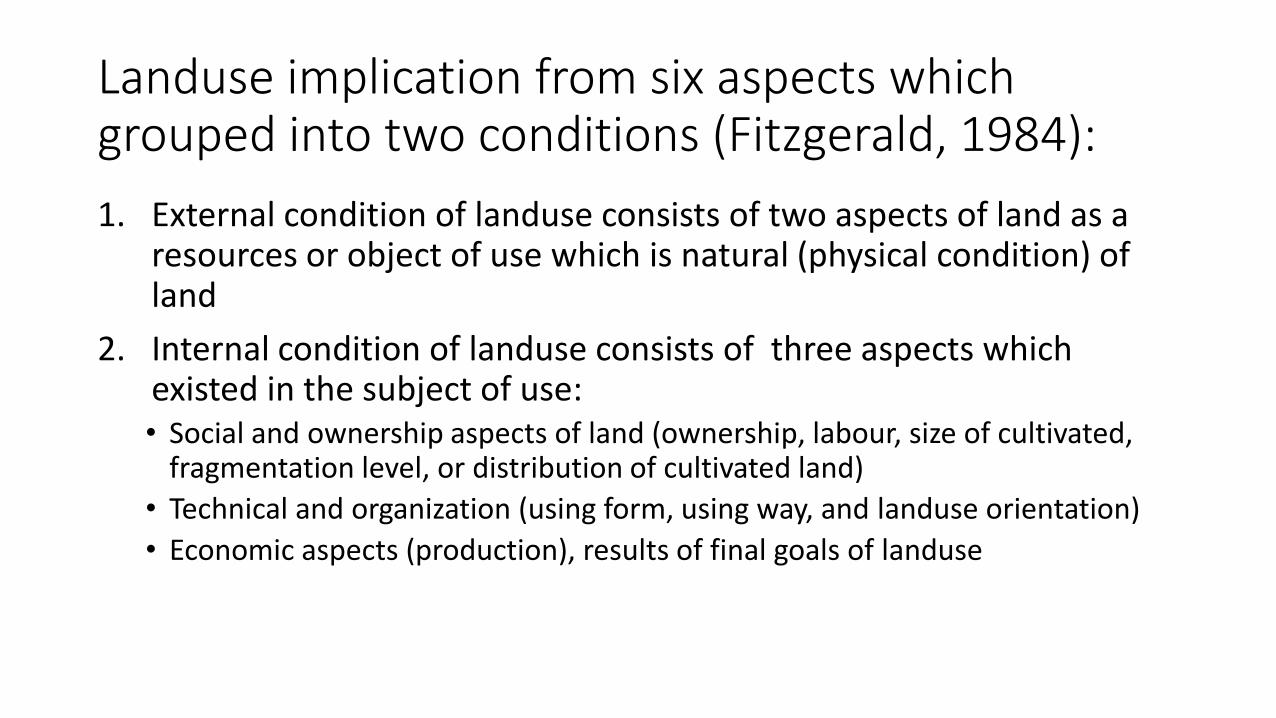
Landuse implication from six aspects which grouped into two conditions (Fitzgerald, 1984):
1. External condition of landuse consists of two aspects of land as a resources or object of use which is natural (physical condition) of land
2. Internal condition of landuse consists of three aspects which existed in the subject of use:• Social and ownership aspects of land (ownership, labour, size of cultivated,
fragmentation level, or distribution of cultivated land)
• Technical and organization (using form, using way, and landuse orientation)
• Economic aspects (production), results of final goals of landuse
Social Physical
EconomyTechnic
KEPUTUSAN
PENGGUNAAN
LAHAN
KESADARAN TTG
INFORMASI
DAN
PERSEPSI
ORGANISASI
SOSIAL
TRADISI
ANGGOTA
KELUARGA
CURAH HUJAN
LERENG
TINGGI
TEMPAT
KARAKTERISTIK
TANAH
BIBIT BARU
MESIN BARU
PEMBERAN-
TAS HAMA
BARU
PUPUK BARU
JARAK RUAMH
KE LAHAN
JARAK RUMAH
KE PASAR
UKURAN LAHAN
GARAPAN
HARGA PASAR
SUBSIDI
PEMERINTAH
KETERSEDIAAN
DANA
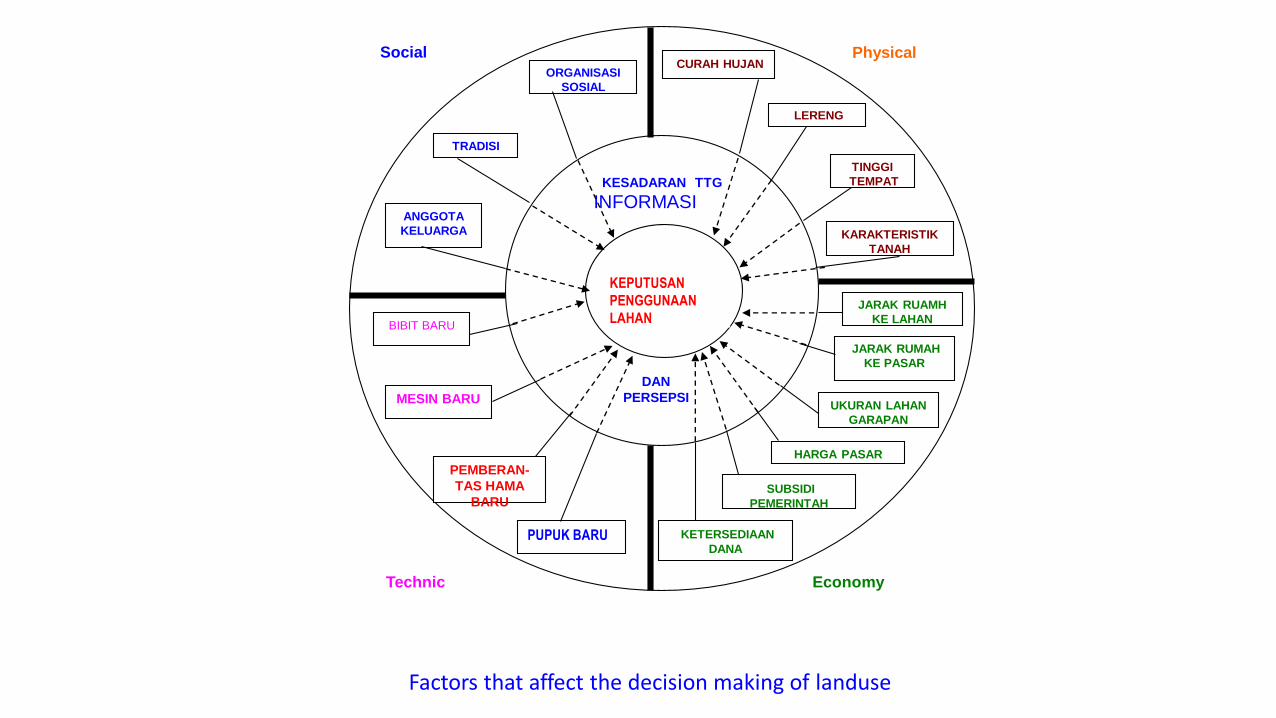
Factors that affect the decision making of landuse

Natural Resources Balance (Making Methods)

Economically, balance is:
• A measurement that is used to test and evaluate the balance between wealth and debt
• “Spatial Natural Resources Balance” is made to give a whole picture about natural resources in Indonesia
• Beside functioning as an information resources, Spatial Natural Resources Balance is also used as a tool to evaluate natural resources potencies in a location

Land Resources Balance
• Land resources balance is made to evaluate the inventory results which include two periods of making so the changing could be recognized
• Descriptively, land resources balance is served in table format. Left column consist of natural resources potency (activa) and right column consist of natural resources use (pasiva)
• On the land natural resources balance making the total area balance will not exist since the total area is constant except there is a redevelopment, and what actually happen is the changing of natural resources type.
• Therefore, in a table of land natural resources there should be an information about the changing of land resources use.

Landuse Change 2000-2004
No. Bentuk Penggunaan Lahan Luas Lahan (Ha) Penambahan (+)
Pengurangan (-)
(Ha)
2000
1 Jalan 216500 216500 0
2 Permukiman 1726960 1901856 +174896
3 Bangunan Umum 89885 100285 +10400
4 Sawah 2130310 2130310 0
5 Pertanian Lahan Kering 1702465 1700465 -2000
6 Kebun Campur 39885 39885 0
7 Pariwisata 2474185 2494185 +20000
8 Perikanan 70000 112005 +42005
9 Pertambangan 2105000 2161000 +56000
10 Lain-Lain 1315310 1004009 -301301
Jumlah 11870490 11870490 0

Land Resources Balance Aspect : LandusePeriod : 2000-2004
No. Bentuk Penggunaan Lahan Luas Lahan (Ha) Penambahan (+)
Pengurangan (-)
(Ha)
2000
1 Jalan 216500 216500 0
2 Permukiman 1726960 1901856 +174896
3 Bangunan Umum 89885 100285 +10400
4 Sawah 2130310 2130310 0
5 Pertanian Lahan Kering 1702465 1700465 -2000
6 Kebun Campur 39885 39885 0
7 Pariwisata 2474185 2494185 +20000
8 Perikanan 70000 112005 +42005
9 Pertambangan 2105000 2161000 +56000
10 Lain-Lain 1315310 1004009 -301301
Jumlah 11870490 11870490 0

Landuse Change
No. Bentuk Penggunaan Lahan Luas Lahan (Ha) Penambahan (+)
Pengurangan (-)
(Ha)
2000
1 Jalan 216500 216500 0
2 Permukiman 1726960 1901856 +174896
3 Bangunan Umum 89885 100285 +10400
4 Sawah 2130310 2130310 0
5 Pertanian Lahan Kering 1702465 1700465 -2000
6 Kebun Campur 39885 39885 0
7 Pariwisata 2474185 2494185 +20000
8 Perikanan 70000 112005 +42005
9 Pertambangan 2105000 2161000 +56000
10 Lain-Lain 1315310 1004009 -301301
Jumlah 11870490 11870490 0

Land Carrying Capacity

Definition
• Land carrying capacity is a unit of individual amount of a species which could be supported by specific environment
• Exceeded land carrying capacity means the land cannot support the number on people who lived there in specific well-being state
• Environmental carrying capacity is the capability of environment to support all living creatures by providing all natural resources to fulfillbasic needs or space to live in specific state of social stability

• Based on Soemarwoto (2001), environmental carrying capacity is a natural environmental support capability, which based on plants biomass and animals which could be collected and caught per unit of area and time in specific location

• Carrying capacity is an optimum ability of environment to support life and meet the life standard of people who lived in that area.
• If optimum ability is exceeded meanwhile the number population tend to increase there would be competition in order to occupy natural resources
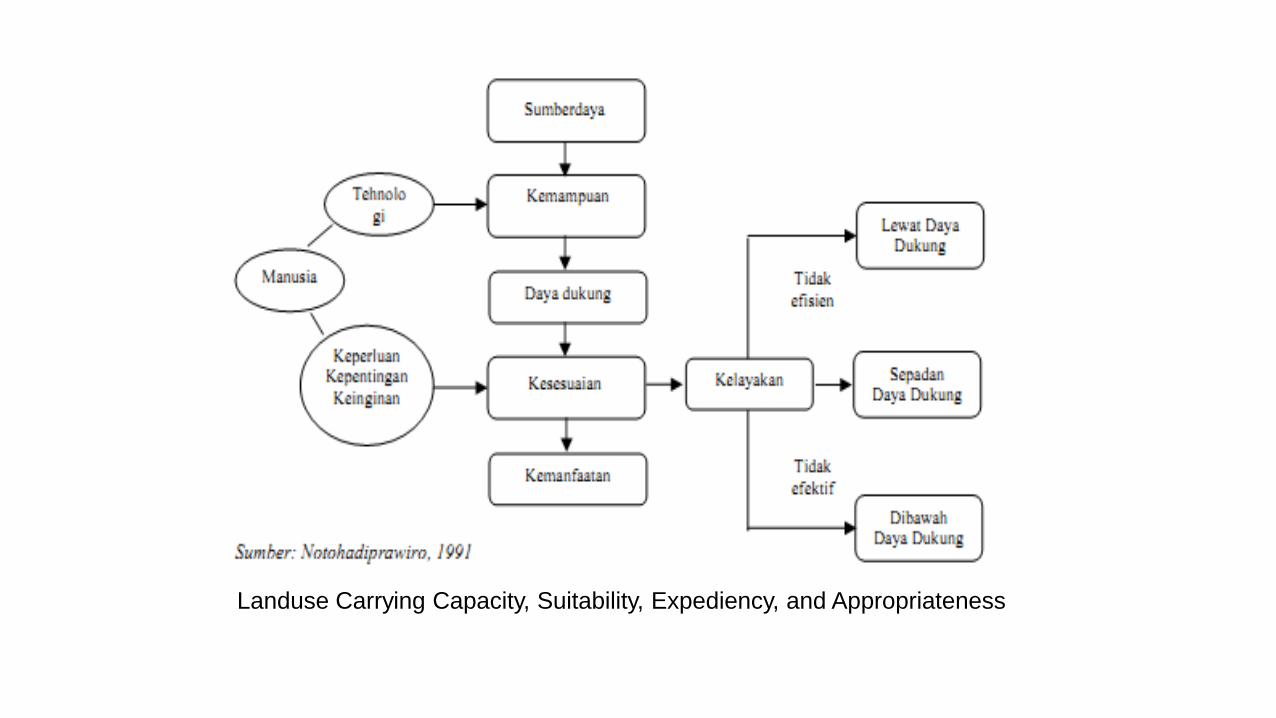
Landuse Carrying Capacity, Suitability, Expediency, and Appropriateness

• Land Carrying Capacity is measured based on carrying capacity, calculated by area function variable divided by existing number of people with this formula:
A= L / P
A= Land Carrying Capacity
L = Land Area (ha)
P = Number of population (people)
• If the value of land carrying capacity is lower than the predetermined value it could be said that the number of population exceeds the environmental carrying capcity
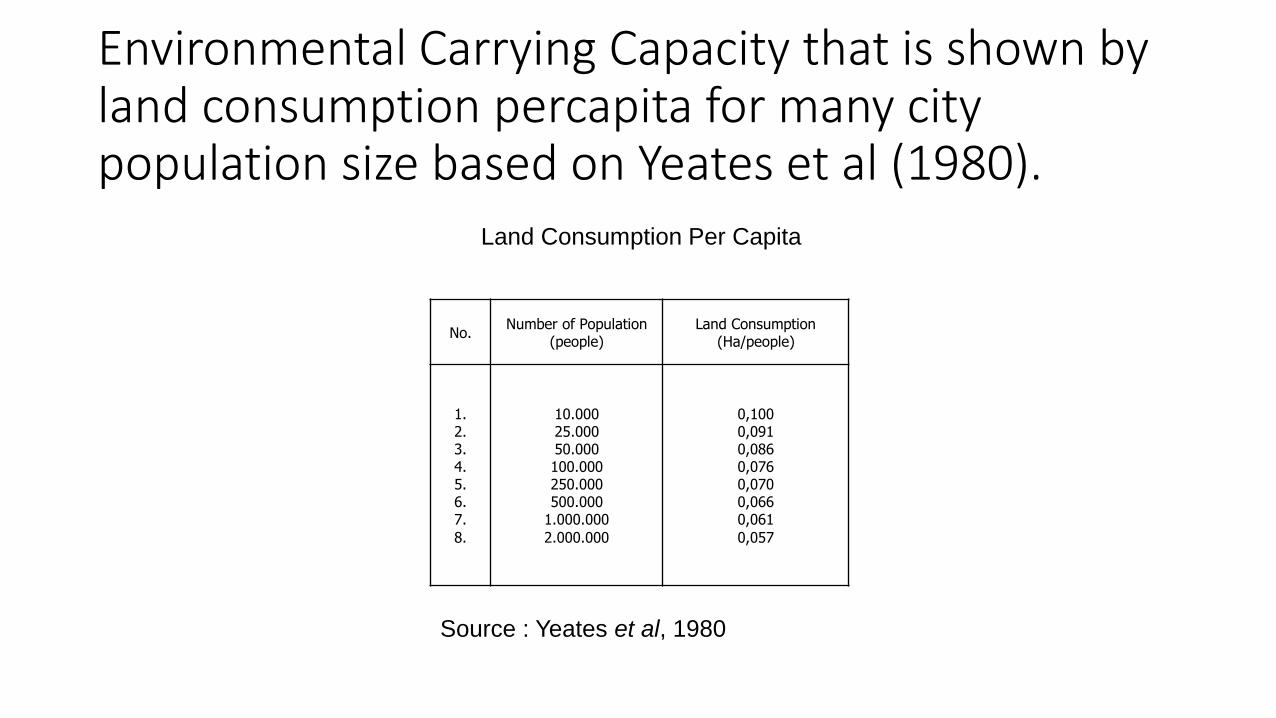
Environmental Carrying Capacity that is shown by land consumption percapita for many city population size based on Yeates et al (1980).
No.Number of Population
(people)Land Consumption
(Ha/people)
1.2.3.4.5.6.7.
8.
10.00025.00050.000100.000250.000500.000
1.000.000
2.000.000
0,1000,0910,0860,0760,0700,0660,061
0,057
Land Consumption Per Capita
Source : Yeates et al, 1980

• PP= Z = f.Po(1+r)tA
PP = Population Process
Z = minimum land area to live properly
f fraction (%) number of farmer to number of population
Po = Number of Population in beginning time (to)
r = population growth
t = time
L = total area of agricultural land
TP>1 population pressure happened and exceeds land carrying capacity
TP=1 population pressure is optimum
TP < 1 population pressure is not optimum

• DDL = 1/TP
DDL>1 high land carrying capacity
DDL=1 optimum land carrying capacity
DDL< 1 low land carrying capacity

• Land Carrying Capacity = A x rHxhxf
A = total land amount r = harvesting frequencyH = number of family h = percentage of total number of populationf = Ukuran rata-rata lahan yang dimiliki petaniCarrying Capacity > 1 Enough Carrying Capacity <1 Deficient Carrying Capacity =1 Balance

Carrying capacity of a location is determined by:
1. Natural resources potency (natural, artificial, human)
2. Technology that is used to manage resources (natural, artificial, human)
3. Type of jobs
4. Population income
Natural resources availability which can be managed and utilized by human will increase environmental carrying capacity
Basic Variables of Land Carrying Capacity:
1. Available land potency (including land area)
2. Number of population

• In agriculture sector, Carrying Capacity Ratio is a ratio between available land and number of farmers
• Things that should be known are average land area needed per family, available land potency, and its use for agriculture activity

• Factors which determine land carrying capacity (Riyadi and Bratakusumah, 2004):
1. Total agriculture land area
2. Harvesting frequency (Ha/year)
3. Number of head of family (household)
4. Percentage of population (population growth rate, population density, and number of population)
5. Average size of agriculture land which possessed by farmer (tanahkas desa)

Obstacle Factors of Land Carrying Capacity
1. Internal: Limited land and nutrition
2. External: environmental degradation and pollution, natural disaster, and unstable climate

Forest Resources
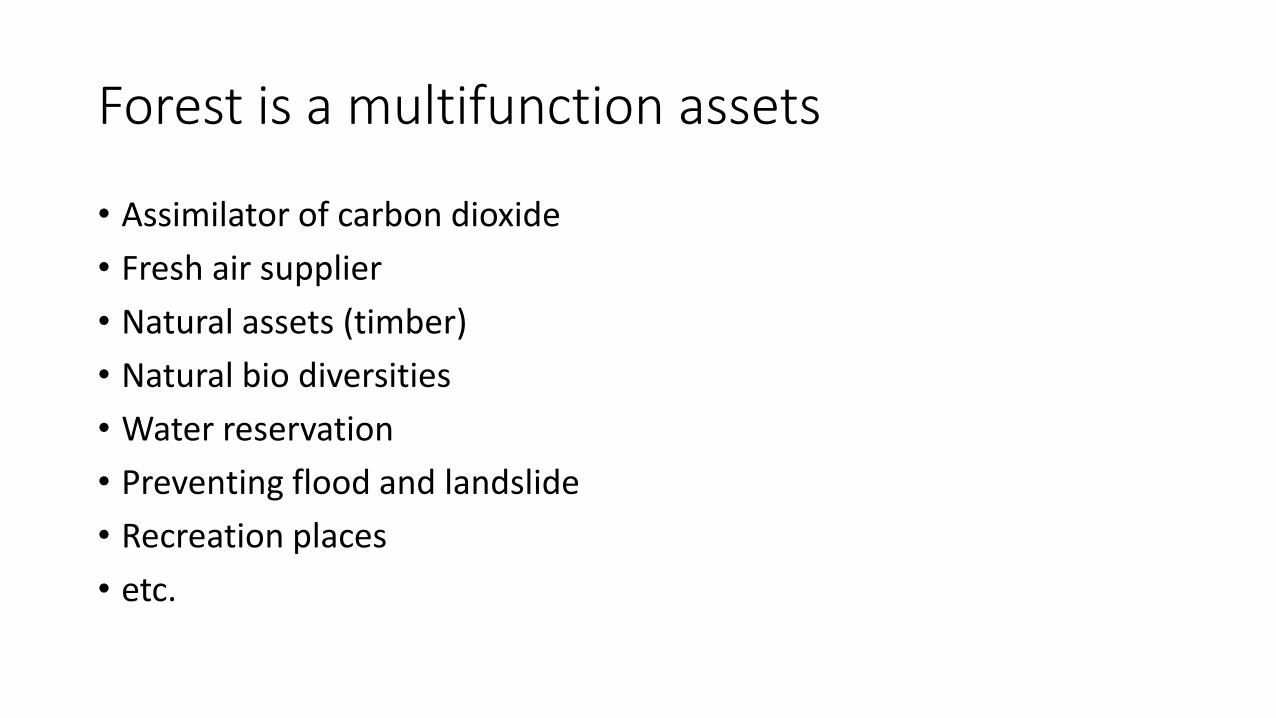
Forest is a multifunction assets
• Assimilator of carbon dioxide
• Fresh air supplier
• Natural assets (timber)
• Natural bio diversities
• Water reservation
• Preventing flood and landslide
• Recreation places
• etc.

Agroforestry
Land management by combining food plants production with forestry plants
1. Agri-silviculture (agriculture and forestry)
2. Sylvopastoral System (Forestry and Livestock)
3. Agroslyvo-pastoral system (Agriculuture + Forestry + Livestock)
4. Multiporpuse forest tree production system (timber, leaves, fruits to be consumed by human and livestocks)

Based on (UU Nomor 32 tahun 1990), forestdivided into 3: 1. Permanent forest; forest which is located in forest region
2. Reserve forest; forest which is located in forest region but the use/function is not decided yet
3. Other forest; forest which is located out of forest region and reserve forest region

• Protected Forest
Forest area which because of the characteristics of its nature intended to manage water system, preventing flood and erosion, also maintaining land fertility (UUPK No. 5 Tahun 1967)
• Cultivation Forest
Forest area which is appointed as its main function cultivation based on its natural, human, and artificial resources potency and condition (UUPR No, 24 Tahun 1992)
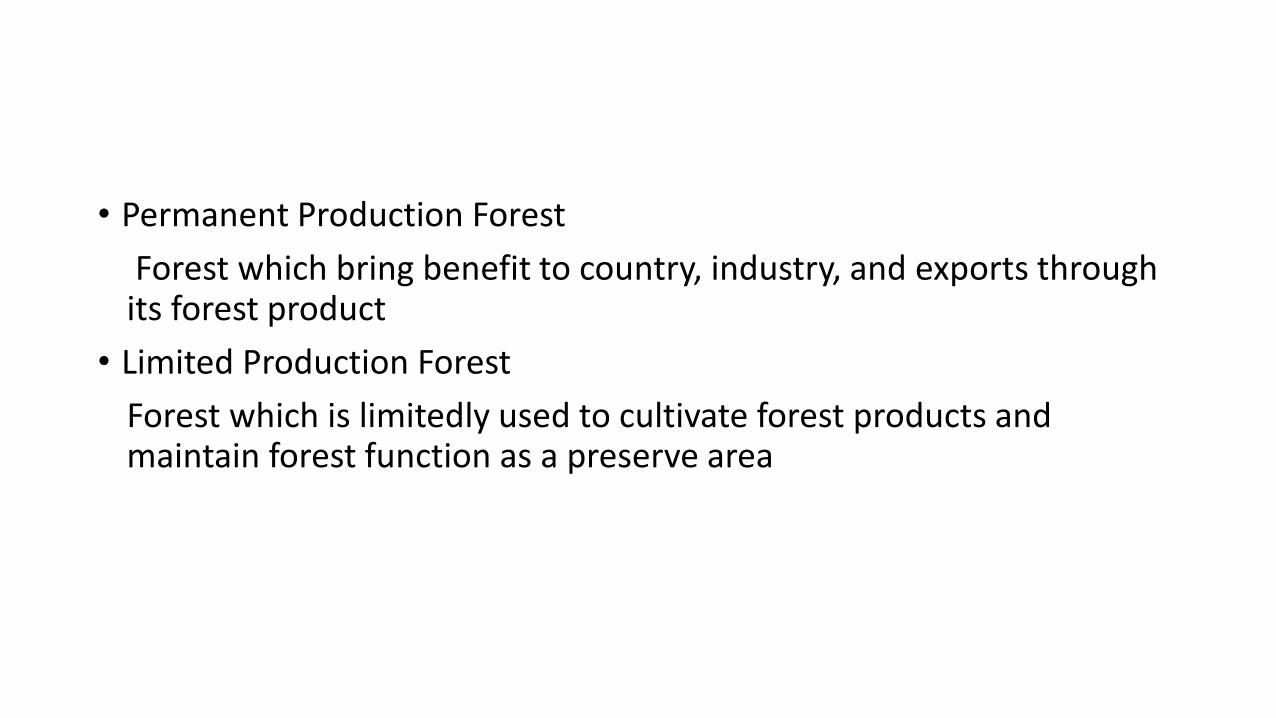
• Permanent Production Forest
Forest which bring benefit to country, industry, and exports through its forest product
• Limited Production Forest
Forest which is limitedly used to cultivate forest products and maintain forest function as a preserve area

Based on its ecosystem, forest is divided into:
1. Wet Forest : forest which grow and develop in wetland (brackish forest, swamp forest, peat forest)
2. Dry Forest: forest which grow and develop in dry land (beach forest, lowland tropical forest, highland tropical forest)
3. Mangrove Forest: forest which is sometimes inundated by sea water and not affected by climate
4. Peat Forest: forest which is periodically or always inundated by fresh water
5. Beach Forest: forest which grow in seashore -above the highest tideline- and is not affected by climate

6. Lowland Tropical Forest: forest which grows on dryland in 2-1000 aswl
7. Highland Tropical Forest: forest which grows on dryland above 1000 aswl

• As a renewable energy, the difference between forest resource and water resource is most of the forest are not common property resource
• Forest resources are possessed by government with their management rights are owned by private sectors or certain community

Other Differences:
1. Time Scale
2. Option Value
3. Unit Price
4. Utilization Conflict

Measuring Feasibility of Natural Resources
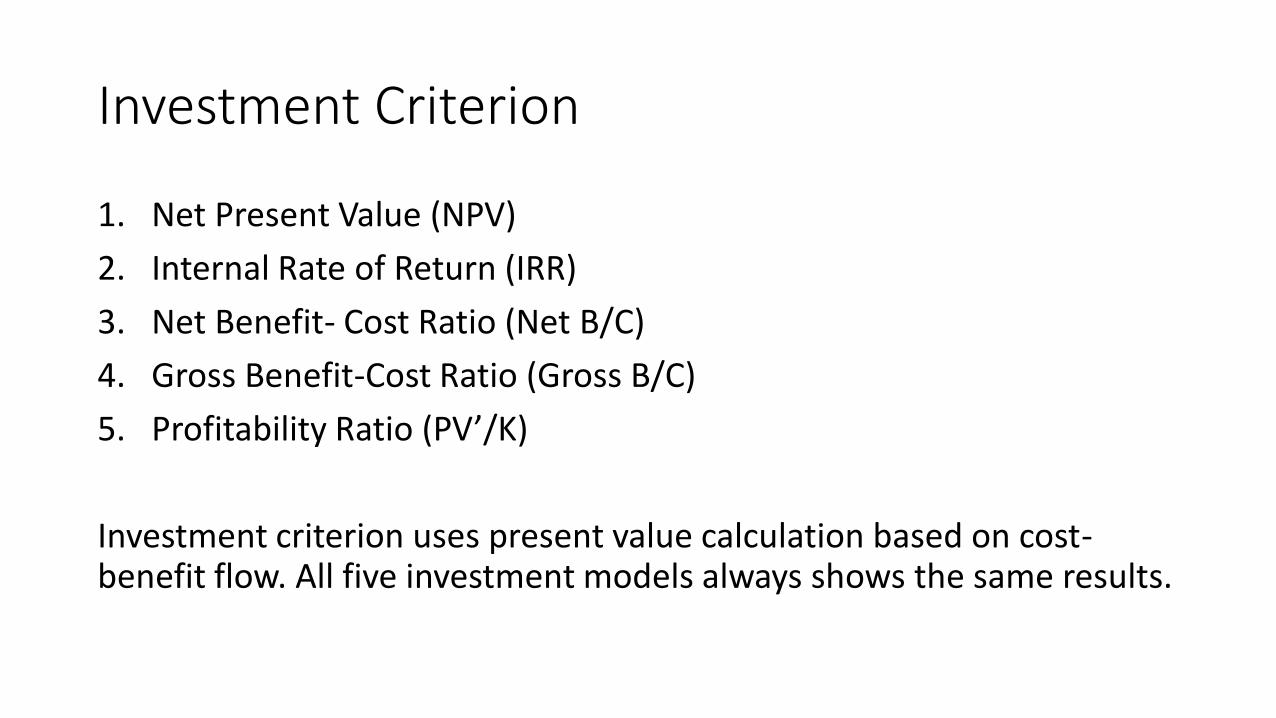
Investment Criterion
1. Net Present Value (NPV)
2. Internal Rate of Return (IRR)
3. Net Benefit- Cost Ratio (Net B/C)
4. Gross Benefit-Cost Ratio (Gross B/C)
5. Profitability Ratio (PV’/K)
Investment criterion uses present value calculation based on cost-benefit flow. All five investment models always shows the same results.

If natural resources utilization activity gives the same profit with the marginal standard, so:
• NPV=0
• IRR= Social Discount Rate
• Net B/C=1
• Gross B/C=1
• PV’/K=1

If natural resources utilization activity more profitable than marginal standard, so:
• NPV > 0
• IRR => Social Discount Rate
• Net B/C > 1
• Gross B/C > 1
• PV’/K > 1
• Usually in making investment opportunity, more than one criterion are used.
• All criterion are the same and nothing is better than the others
• NPV, IRR, and Net B/C are the most used criterion
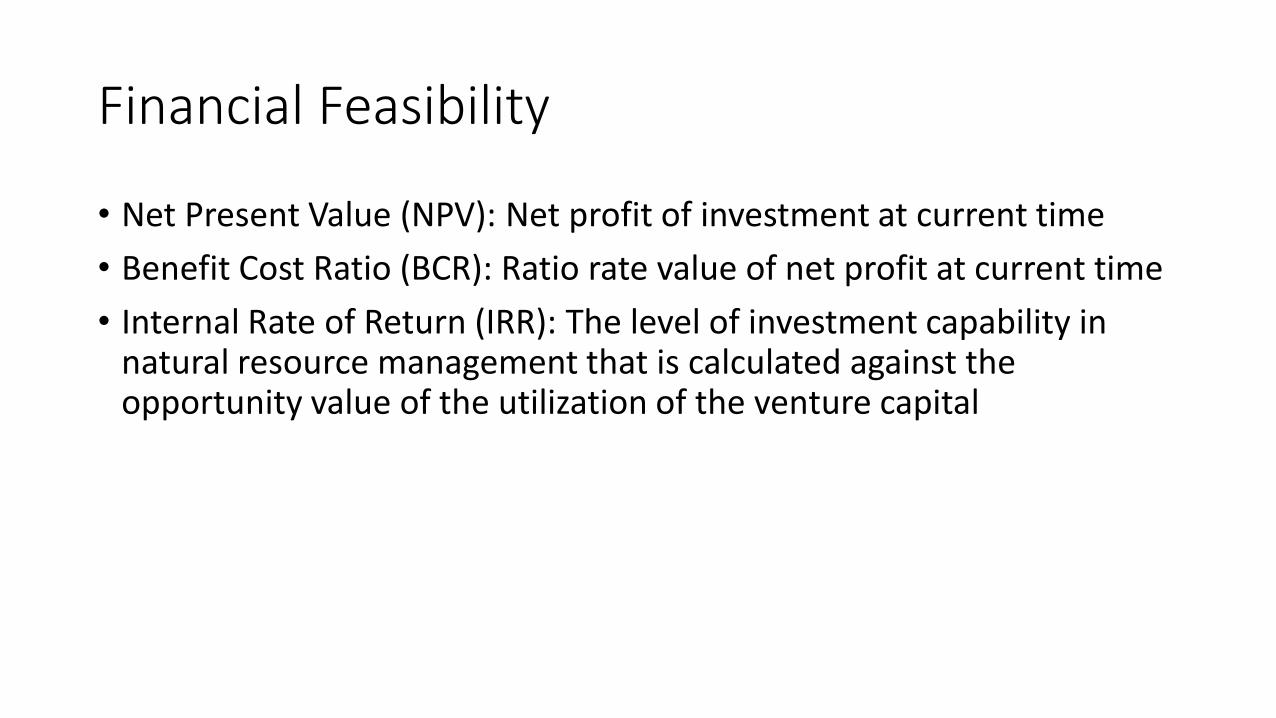
Financial Feasibility
• Net Present Value (NPV): Net profit of investment at current time
• Benefit Cost Ratio (BCR): Ratio rate value of net profit at current time
• Internal Rate of Return (IRR): The level of investment capability in natural resource management that is calculated against the opportunity value of the utilization of the venture capital

Present Value
• Cost value that should be invested in present time (last 0th year) so profit value could be obtained
• Present value is for a cost or benefit every year
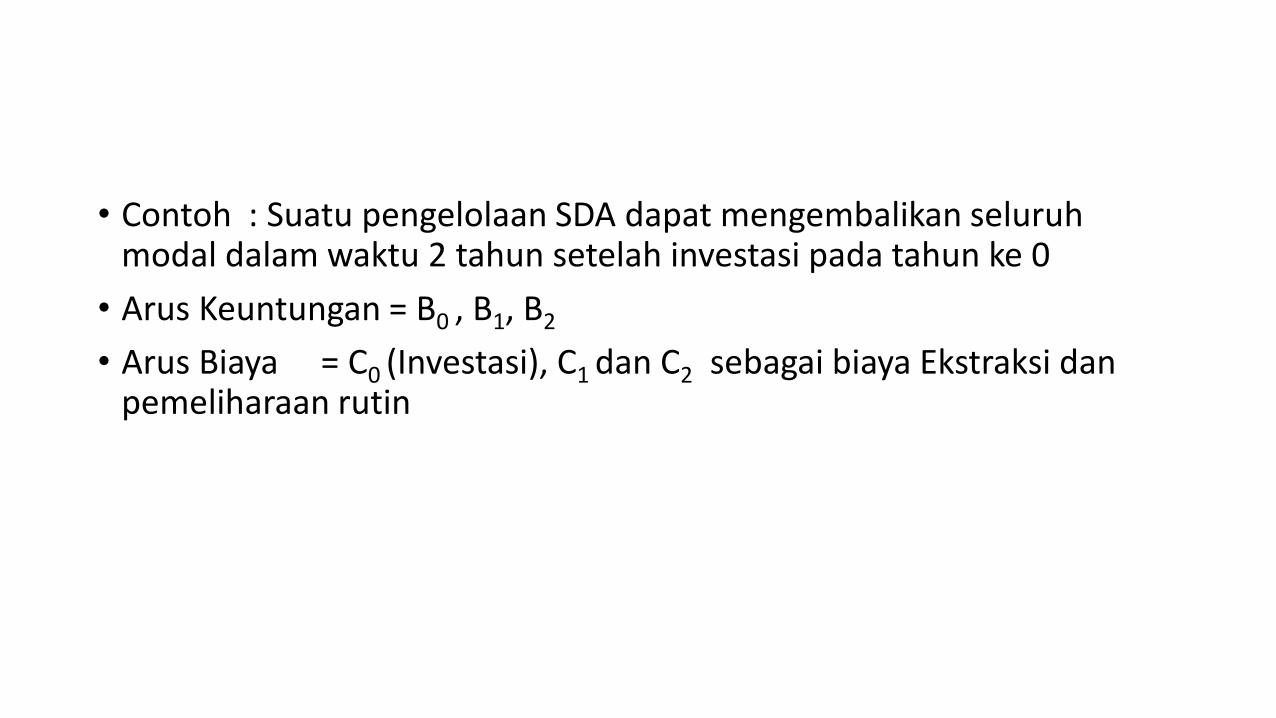
• Contoh : Suatu pengelolaan SDA dapat mengembalikan seluruh modal dalam waktu 2 tahun setelah investasi pada tahun ke 0
• Arus Keuntungan = B0 , B1, B2
• Arus Biaya = C0 (Investasi), C1 dan C2 sebagai biaya Ekstraksi dan pemeliharaan rutin

• Present value dari unsur Bt dan Ct =
Bt /(1+i)t atau Ct/(1+i)t
• Sehingga jumlah nilai sekarang adalah :
B0/(1+i)0 + B1/(1+i)1 + B2(1+i)2
C0/(1+i) 0 + C1/(1+i) 1 + C2/(1+i)2 atau
• PV Keuntungan = Bt/(1+i) t
• PV Biaya = Ct/(1+i) t
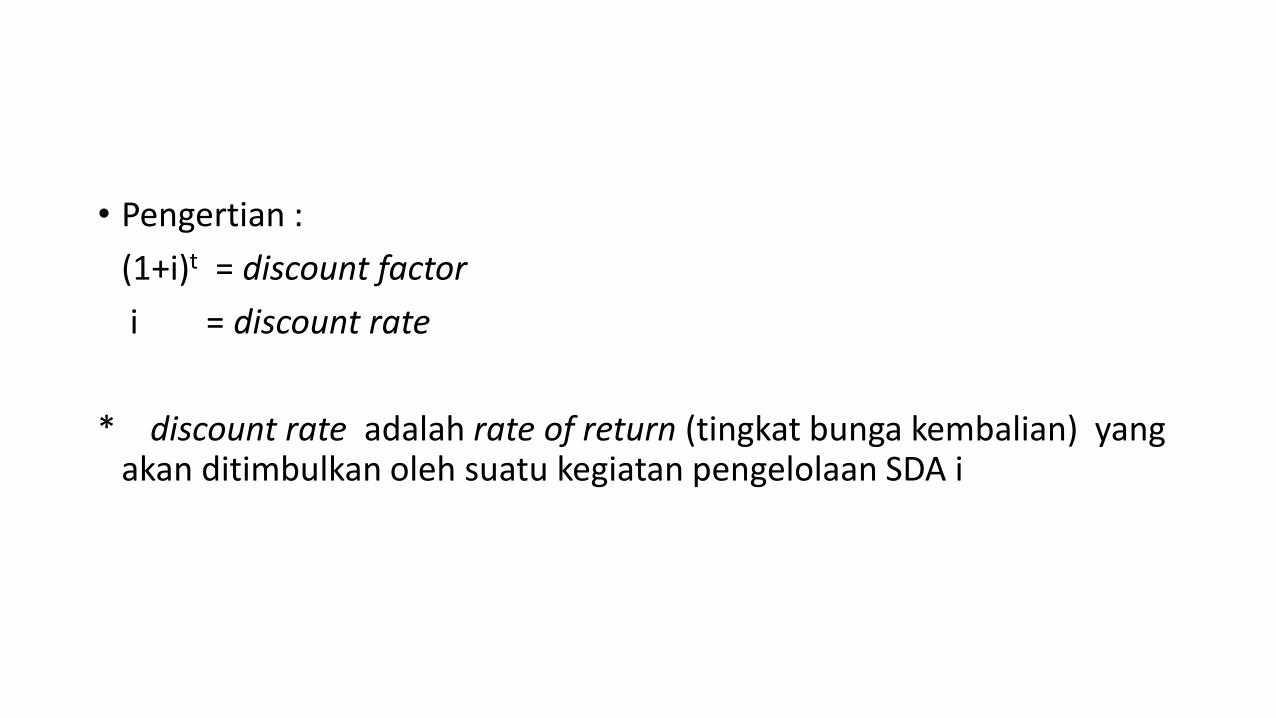
• Pengertian :
(1+i)t = discount factor
i = discount rate
* discount rate adalah rate of return (tingkat bunga kembalian) yang akan ditimbulkan oleh suatu kegiatan pengelolaan SDA i

Contoh : Perhitungan PV benefit dan Biaya Proyek X pada Social Discount rate = 15%
Biaya Present value Tahun Modal Rutin Jumlah
Benefit
Discount factor
(1,15)-t Jumlah Biaya
Jumlah Benefit
1 2 3 4 5 6 (5x3) 7 (5x4)
0 800 800 - 1,0 800 -
1 500 300 800 100 0,8696 696 87
2 300 300 200 0,7561 227 151
3 300 300 1000 0,6575 197 658
4 300 300 1000 0,5718 172 572
5 300 300 1000 0,4972 149 497
6 300 300 1000 0,4323 130 432
7 300 300 1000 0,3759 113 376
Jumlah 3400 5300 2484 2773

Net Present Value
• NPV suatu kegiatan pengelolaan SDA merupakan PV arus benefit dikurangi PV arus biaya
• Rumus NPV :
B0/(1+i)0 + B1/(1+i)1 ………….. + Bn(1+i)n -
C0/(1+i) 0 + C1/(1+i) 1 ……………. + Cn/(1+i)n

• Atau :
NPV = n n n
Bt /(1+i)t - Ct/(1+i)t = (Bt – Ct) / (1+i)t
t=0 t=0 t=0
• Kegiatan pengelolaan SDA akan dilaksanakan jika NPV > atau = 0
• Jika NPV= 0 artinya pengelolaan SDA tersebut akan mengembalikan sama persis sebesar social oportunity cost faktor produksi modal
• NPV<0 maka pengelolaan SDA tidak dapat menghasilkan senilai biaya yang dipergunakan (kegiatan ditolak)

Contoh Perhitungan NPV proyek X pada berbagai tingkat discount rate sosial
Tahun
Benefit
Jumlah Biaya
(modal +rutin)
Benefit –
Biaya (sisa)
Discount Factor serta nilai PV
i=10% PV=4x3
i=15% PV=6x3
i=25% PV=8x3
1 2 3 4
5
6
7
8
9
0 -
800 -800 1,0 -800
1,0 -800
1,0 -800
1
100
800 -700 0,9091
-636
0,8696
-609
0,800
-560
3-7
1.000
300 700 3,1329
2193
2,5347
1774
1,7211
1205
NPV 674 289 -219

• PV benefit 2773 dan PV Biaya 2484 sehingga NPV = 289 ( Pada discount rate 15%)
• Perhitungan NPV dipersingkat dengan men-discount arus Benefit dan Biaya menjadi satu arus saja yaitu Bt-Ct dalam setiap tahun
• Semakin tinggi discount rate semakin kecil (negatif) nilai NPV proyek.

Internal Rate of Return (IRR)
• Nilai discount rate sosial yang membuat NPV proyek sama dengan 0
n
( Bt – Ct) / (1+i)t = 0
t=0
Perhitungan IRR tidak bisa dipecahkan secara langsung :
-Dengan cepat melalui program komputer
-Coba-coba
• Dipilih nilai discount rate i1 yang kira-kira mendekati nilai IRR yang benar, kemudian di hitung arus benefit dan biaya. Jika hasil NPV positif, maka nilai discount rate i1 terlalu rendah, sebaliknya jika NPV negatif nilai discount rate i1 terlalu tinggi
• NPV pertama positif maka nilai i2 yang lebih tinggi sehingga NPV mendekati 0, dan sebaliknya
• Interpolasi atau ekstrapolasi
IRR = i1 + (NPV)/(NPV1-NPV2) x ( i1 - i2 )
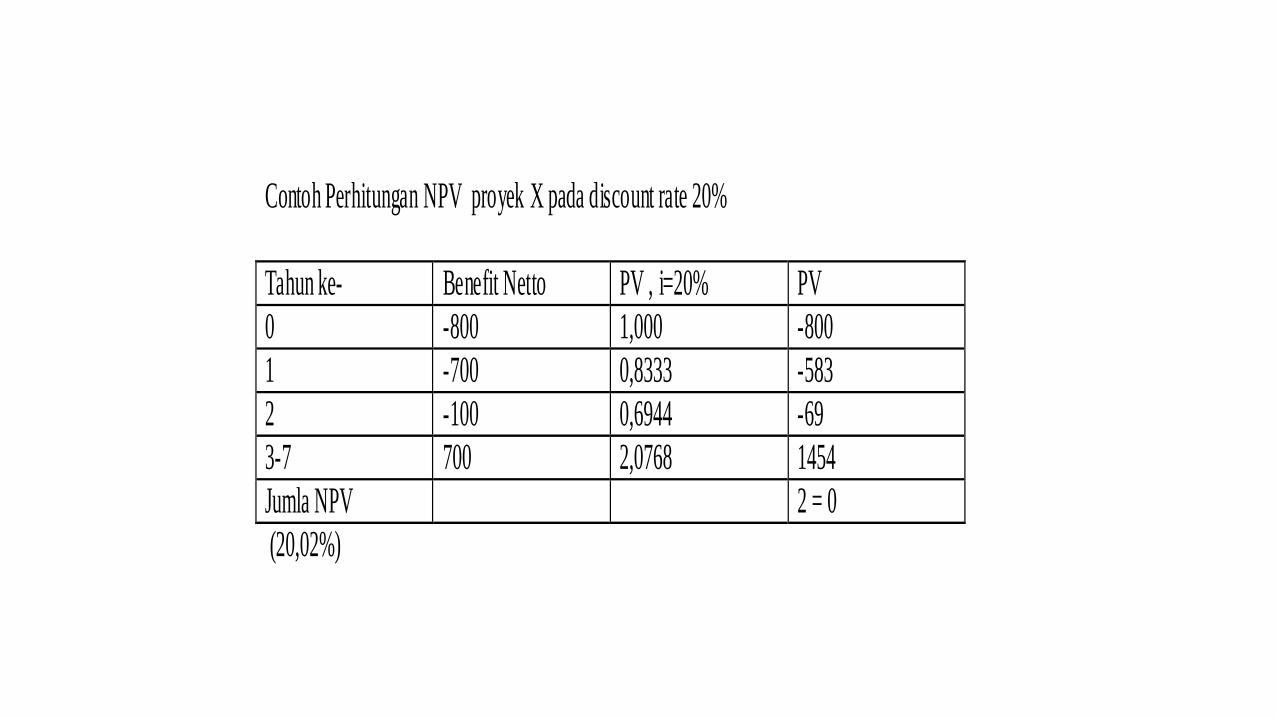
Contoh Perhitungan NPV proyek X pada discount rate 20%
Tahun ke- Benefit Netto PV , i=20% PV
0 -800 1,000 -800
1 -700 0,8333 -583
2 -100 0,6944 -69
3-7 700 2,0768 1454
Jumla NPV 2 = 0
(20,02%)

Net B/C (BCR)
• Perlu dihitung terlebih dahulu
(Bt – Ct) / (1+i)t untuk setiap tahun
• Merupakan angka Perbandingan antara Marginal Benefit (PV positif) dan Marginal Cost (PV negatif)
n
• BCR = ∑ Bt
t=0 (1+i)t
n
∑ Ctt=0 (1+i)t