land reforms, poverty reduction, and economic...
TRANSCRIPT
225
K l a u s D e i n i n g e r *World Bank, Washington, D.C.
H a r i K . n a g a r a j a n * National Council for Applied Economic Research, New Delhi
Land Reforms, Poverty Reduction, and Economic Growth: Evidence from India
Motivation and Background
With about three-fifth of India’s workforce still in agriculture, operation of rural factor markets, in particular those for land
rental, will be essential to allow movement of labor out of agriculture and the expansion of the non-agricultural sector that will be needed to sustainably reduce poverty in rural areas (Panagariya, 2008). It will also be critical to counter a trend of increasing fragmentation of land and holding sizes through subdivision by facilitating consolidation of land into larger operational farm sizes that will be important if incomes in the rural sector are to keep up with the rest of the economy. Finally, the scope for greater agricultural productivity and diversification through movement toward higher-value commodities will critically depend on farmers having scope for entering into contracts to realize economies of scale in production (for example, adherence to phyto-sanitary standards) and marketing.
However, many states continue to outlaw land leasing or other forms of contractual arrangements, thereby restricting the operation of markets for key factors (land, labor, credit) in numerous ways. This policy is widely perceived as detrimental not only to investment incentives and the effective utilization of scarce resources but, by preventing land access by the landless, may also impose considerable losses on the poor. Many of the relevant policy initiatives have their origin in efforts at land reform that were adopted with
* We thank S. Bery, A. Panagariya, T. N. Srinivasan, A. Banerjee, P. Bardhan, A. Kochar, R. Somanathan, E. Duflo, for detailed comments on earlier drafts. Financial support from the collaborative DFID-World Bank program on land policies and rural development is gratefully acknowledged. The views expressed in this paper are those of the authors and do not necessarily reflect those of the World Bank, NCAER, or DFID.
226 Ind Ia pol Icy forum, 2009–10
the explicit goal of dealing with the inherited inequality of land ownership by facilitating redistribution of land to the poor. Two problems with this stand out. On the one hand, inability to implement such legislation in many states, a failure to provide full ownership rights to beneficiaries in cases where they did receive land, and the impact such laws have on the willingness of landlords to rent out land, all pose a danger of the unintended consequences of land reform policies ending up directly hurting the poor. On the other hand, such policy restrictions will make it very difficult, if not impossible, to achieve the agricultural growth rates of 4.5 percent targeted by the Planning Commission (Government of India, 2008).
Beyond the functioning of rural land markets, broader concerns relate to the fact that, in many respects, India’s system of land administration fails to deliver the level of tenure security and operational efficiency needed in a modern economy to encourage land-related investment, improve governance, and reduce informality as well as land-related conflict far beyond the rural sector. Reasons for such failure can be found in incomplete and overlapping records, as well as, institutional overlap and inefficiency all of which can be traced to the original objectives of land administration in India. Recent efforts to computerize land records and registration in some states have led to some progress but a large number of obstacles, most notably relating to spatial records, remain to be addressed (World Bank, 2007). In fact, it is often argued that only a drastic move toward conclusive title along the lines of Australia’s Torrens system will provide the modernization of land administration that is needed in India (Wadhwa, 1989).
This paper examines empirical evidence from India in light of international best practice to provide guidance on these issues that is grounded in representative data rather than anecdotal information. The second section provides a historical account of the emergence of land-related policies and institutions over time to provide the backdrop for our analysis and allow formulation of hypotheses that are subject to empirical testing. The third section develops a conceptual model of the operation of rural rental markets and then uses a unique panel dataset at the household-level to provide evidence on the functioning of land rental markets. The goal of doing so is not only to assess the extent to which such markets contribute to productivity and improved land access but also to provide quantitative evidence on the impact of restrictions to the operation of such markets that continue to be widespread in India. Indeed, our results suggest that the way in which rental markets operate has changed over time and that there is little justification to maintaining these restrictions which reduce productivity, by preventing more productive producers from accessing land, as well as equity, by putting
Klaus deininger and Hari K. nagarajan 227
land out of the reach of the landless and poor whose welfare could be most improved through land access.
The fourth section applies a similar empirical framework to the operation of land sales markets to test whether, as often alleged by policy-makers, operation of such markets in an environment characterized by multiple market imperfections, will give rise to undesirable outcomes. The main concern is that, with less than full insurance due to credit market imperfections, exogenous shocks (for example, droughts) may lead to accumulation of land by the wealthy who, in an environment where land leasing is subject to transaction costs, will not be able to make the most productive use of it. Empirical evidence suggests that, while such shocks are indeed of relevance, they did not prevent the transfer of land to more productive producers although, as one would expect, sales markets were less effective than rental markets in transferring land to the poor.
The fifth section focuses on land administration in India more generally in three specific respects. First, we assess the extent to which computerization of land records as well as registration in select states holds lessons for institutional reform of India’s land administration system more generally. In addition to having had success at improving governance and transaction costs of registering land, such measures also provide opportunities to increase tenure security by moving toward a more unified institutional structure, making it easier to search the chain of previous transactions, and allowing officials to conduct basic checks before a transaction is registered. Second, we discuss reasons for the lack of comparable progress with respect to spatial data and use this to identify technical and institutional options to improve the spatial information in India’s land administration system. Finally, we debate the extent to which a transition from a registration system based on deeds to one based on titles is realistic. In doing so, we explain key differ-ences between the two systems, identify ways in which deeds systems can be improved, and draw on the experience of other countries to describe mechanisms for making the transition between the two and the implications for recent attempts in a number of Indian states to create the legal framework that would allow making such a transition.
Policy Context and Historical Background
With ill-defined or incomplete property rights, those holding land need to spend resources to defend their rights. As such expenditures (guards and fences) often have little direct social or productive value, they lead to
228 Ind Ia pol Icy forum, 2009–10
dissipation of rents and divert resources from more productive uses. The privately optimal amount of spending on protection can be excessive from a social point of view (De Meza and Gould, 1992; Feder and Feeny, 1991; Malik and Schwab, 1991). Enforcement of property rights by the state realizes economies of scale and has benefits that are non-rival (that is, one person’s enjoyment does not reduce others’ benefits), although some of them allow exclusion of others, characteristics generally associated with a club good (Lueck and Miceli, 2006; Shavell, 2003). If property rights are secure, well-defined, and publicly enforced, land owners need to spend less time and resources guarding them. By reducing the risk of expropriation, secure property rights assure land users of the ability to enjoy the fruits of their labor, thus encouraging them to make long-term land-related investments and manage land sustainably (Besley, 1995). Also, ability to verify boundaries at low-cost and legal measures to minimize land-related conflicts reduces transaction costs in a number of ways. Systems to document and verification of land ownership are public interventions to enhance tenure security. The magnitude of net private and social gains will depend on the extent to which a land registration system induces higher levels of tenure security and the nature, magnitude, and opportunity cost of the resources thus freed up, compared to the cost of the apparatus needed for administration and enforcement of property rights.1
Also, provision of credit is risky because uncertainty and asymmetric information lead to credit rationing in equilibrium and reduced lending volumes compared to a world of perfect information (Stiglitz and Weiss, 1981). The use of collateral is a universal practice to reduce the extent of credit rationing and improve welfare. Its immobility and relative indestruct-ibility make land ideal collateral. However, banks’ ability to use it for this purpose on a large scale is contingent on a formal and low-cost way to unambiguously identify land ownership. In the absence of other obstacles to the operation of financial markets and if land rights can be exercised, a
1. While much of the literature relies on a unitary household model, women’s ability to own land is often constrained by social practice. Even if constitutions outlaw gender discrimination, females can often access land only through male relatives and their ability to inherit land or hold on to it in case of widowhood or divorce is limited. This can affect their intra-household bargaining power, the allocation of household spending among alternative uses, efficiency of land use (Udry, 1996), and participation in non-farm opportunities (Quisumbing and Maluccio, 2003). Legal changes and land registration programs that take into account local realities and enforcement capacity can contribute to women’s social and economic empowerment (Deininger and Castagnini, 2006; Joireman, 2008).
Klaus deininger and Hari K. nagarajan 229
reliable land registry can thus help to increase credit access. As this will allow borrowers to obtain funding for projects the true risk of which is less than what lenders would assume without collateral, this would increase the level of investment and improve economic efficiency. In such situations, formalizing land tenure can encourage financial market development and use of financial instruments that draw on the abstract representation of property through formal documents (de Soto, 2000).
However, rather than documenting and securing rights, the main goal of India’s land administration system in colonial days was to obtain government revenue. The de facto award of land rights to revenue collectors (zamindars) in large parts of the country had consequences that affect development to this day (Banerjee and Iyer, 2005). This has two types of implications. Rather than aiming to establish a system of land administration that would provide low-cost means to secure and transfer rights, the system inherited from the British was adopted without critical examination or major modifications. Instead, immediate post-independence efforts focused on establishing a more equitable land ownership-distribution through abolition of rent-collecting intermediaries and broader agrarian reform. In fact, abolition of intermediaries was tackled swiftly and successfully virtually everywhere after independence. Land reform consisted of three main elements. The first one was tenancy reform which aimed to limiting the rent to be paid for land by tenants and increasing their security, in particular by prohibiting tenant evictions. The second policy was ceiling legislation, which aimed to legislate a maximum land holding and require owners to dispose of all that was owned beyond this limit. The third element was securing land ownership by those who did not have land, partly through distribution of ceiling land.
The fact was that in the constitution legislative and implementation responsibility was assigned to states led to considerable diversity in timing, nature, and speed of implementation. At the same time, it is fair to say that even in the most progressive states, implementation of these policies was variable at best non-existent in many cases, and far below the potential virtually everywhere.2 It took until the 1970s for serious efforts at
2. The fact that implementation of ceiling reforms and tenancy restrictions started in earnest only after 1972 allowed landlords to “prepare” by resuming self-cultivation, evicting tenants or transforming them into wage workers, or implement spurious subdivisions. Using census figures, Appu (1996) estimates that, to avoid having to give rights to tenants, landlords evicted about 30 million tenants or about one-third of the total agriculturally active population, similar to evidence from other countries with similar policies (Deininger, 2003).

230 Ind Ia pol Icy forum, 2009–10
implementation to materialize. After the late 1980s, efforts waned again; in fact between 1995/96 and 2003/04, that is, for almost a decade, progress almost completely halted.3 While land reforms overall are still credited with the transfer of almost 10 mn ha, 2.5 mn ha via ceiling surplus redistribution, and 7.35 mn ha via tenancy legislation (Kaushik, 2005),4 there is now widespread concern that the policies to bring such reform about could, by preventing landlords from supplying land to the market and instead encouraging them to leave it fallow, have significant negative impact on efficiency as well as equity.
Especially in view of the fact that India’s land administration system is widely viewed as having difficulty delivering the public goods it was designed to provide, the continued adequacy of such policies has been questioned. Even at the high point, implementation was lackluster at best. Moreover, most of the relevant policies were put in place long time ago and high levels of economic growth continue to profoundly transform India’s economic landscape. This puts new demands on land policy to facilitate development of the non-agricultural sector while also creating new opportunities for poverty reduction. In particular, growth and safety nets may have helped to attenuate many of the market imperfections that historically provided the main justification for government intervention in the functioning of land markets, implying that it would be better for government to focus its effort on providing a well-functioning system of land rights rather than to try and implement policies which have not only encountered widespread resistance but which may also cause undesired side effects for the very groups who are expected to benefit from them. Exploring the impact of such intervention and its continued justification would thus be of interest.
3. The increment in ceiling surplus land transferred during the period amounted to only 10,800 ha which is only about one-tenth of the land declared ceiling surplus which had not been distributed. The fact that all the remainder remains tied up in litigation suggests that further progress in achieving redistribution of ceiling land could be slow—it would take almost 90 years to dispose of remaining ceiling surplus cases if the current pace is maintained—and that, by clogging up the court system and preventing it from quickly dispensing justice in other urgent matters, the ceiling legislation may impose external effects beyond land rental markets (Moog, 1997).
4. The amount of land involved is much larger than what was redistributed in other Asian land reforms such as Japan (2 mn ha), Korea (0.58 mn ha), and Taiwan (0.24 mn ha). In terms of total area distributed, this puts India on par with Mexico which, in a much more land-abundant setting, and starting in 1917, managed to distribute slightly more than 13 mn ha (Deininger, 2003).
Klaus deininger and Hari K. nagarajan 231
Land Leasing
This section focuses on the empirical analysis of contemporary land lease markets in India. Following a description of the traditional rationale for restrictions on land leasing and the prevalence of such policies across different states, it develops a framework that allows us to make predictions on the impact of such restrictions. This is followed by an empirical test of the extent to which predictions are supported by household panel data for 1982 and 1999. The evidence from this is then used to draw policy conclusions.
Nature and Potential Impact of Land Leasing Restrictions
Although empirical evidence on the impact of rent ceilings and other forms of tenancy control in rural areas is limited, the issue has been analyzed in urban contexts where rent control is a textbook example for policies that transfer resources from landlords to sitting tenants in the short term but that will be associated with inefficiencies in the medium to long run (Arnott, 2003). The key reason is that, by fixing rents below their equilibrium level, controls reduce the supply of new housing (or maintenance of existing stock) due to artificially reduced prices (Gyourko and Linneman, 1990), thus making access to rental more difficult thereafter (Basu and Emerson, 2000). With a constant or decreasing number of beneficiaries and an increasing number of new entrants who need to access to land in distorted markets, social cost of maintaining land rental restrictions will increase over time (Glaeser, 2002). Identifying other policies that can be better targeted and have fewer un-desirable side-effects are thus desirable (Munch and Svarer, 2002).
The impact of rental restrictions may be equally severe in rural areas. Landlords affected by tenancy legislation may have an incentive to revert to self-cultivation for fear of losing it permanently although this may be associated with less efficiently cultivation (Appu, 1996). In fact, descrip-tive data from NCAER’s 2006 ARIS-REDS survey suggest that, in states where rental is outlawed, such as Karnataka or Kerala, 30 percent or more of the cultivable land remains fallow even in the main cropping season. Even if inefficiency is less directly visible, cultivation based on wage labor is significantly less efficient than owner-cultivation based on family labor (Binswanger et al., 1995). Also, the rights given to tenants under land reform legislation provide tenants with heritable security against eviction but not ownership, are non-transferable, and still require rent payment to the landlord. This is likely to reduce both parties’ incentives for land-related investments and undermines the scope to increase allocative efficiency
232 Ind Ia pol Icy forum, 2009–10
through sub-leasing. Thus, although they can provide benefits by increasing tenants’ tenure security (though stopping short of full land ownership), such measures are likely to negatively affect supply of land to the leasing market. In doing so, they may make it more difficult for productive farmers to access land and for bad farmers to migrate or join the non-agricultural economy.
In fact, none of the Indian states permit sub-leasing of lands to which tenants had received permanent rights in the course of land reform and most states also restrict transfers of land that had been received through land reform. Therefore, these two variables measure restrictions on the operation of land rental markets that is exogenous to households’ decisions. Variations in legislation across states thus provide scope for analyzing the impact of such policies on outcomes. To do so, we use the share of households who benefited from key land reform policies as an indicator for policy-induced constraints to the operation of rental markets. Specifically, we construct for each state the share of households who were awarded tenancy rights and the share of ceiling surplus area that was actually transferred to beneficiaries.5
Conceptual Framework
To explore the impact of such restrictions on rental markets, we use a sim-ple model where a key rationale for producers to enter land markets is the desire to adjust for differences in their existing endowments of land and effective family labor (Deininger et al., 2008). Let household i be endowed with fixed amounts of labor (L−i) and land (A−i), and agricultural ability (ai). Agricultural production follows a production function f (ai, li,a, Ai) with standard properties, that is, f´ > 0, f˝ < 0 with respect to all arguments and the cross-derivative with respect to labor and land being positive. Relative land scarcity, together with the cost of supervising labor (Frisvold, 1994) makes wage-labor based cultivation undesirable in equilibrium (Binswanger et al., 1995), implying that households allocate their labor endowment between farming their own land (li,a) and off-farm employment (li,o) at an exogenous wage (wi). Renting of land incurs transaction costs TCin for renting-in and TCout for renting-out because of the need to obtain information on
5. We use area rather than beneficiaries because in some cases ceiling surplus land was distributed to a collective entity such as a cooperative so that the number of beneficiaries would be misleading. Also, the existence of large discrepancies between the amount of land expropriated and actually distributed—which is due to the fact that in some cases land that had been distributed could not occupied by beneficiaries or was taken back after some time—led us to focus on land actually distributed.
Klaus deininger and Hari K. nagarajan 233
market conditions, to negotiate and enforce payments, and the presence of regulations that restrict transferability or completely outlaw certain contract types. Transaction costs are assumed to be proportional to the size of land transferred. With households able to structure rental contracts in a way that allows those lacking liquidity to enter into arrangements,6 thus allowing to defer rental payments until the harvest, household i’s decision problem is to choose Ai, li,a, and li,o to solve
Max
l l Apf l A wl I A A r TC
I
i a i o ii i a i i o
ini i
in
, ,, ,, ,
( , , ) [( )( )]α + − − +
+ oouti
outA A r TC[( )( )]− − (1a)
s.t. li,a + li,o ≤ L− (1b)
li,a, li,o, Ai ≥ 0 (1c)
where p is the price of agricultural goods, r is the rental rate, Ai is the operational land size, I in is a indicator variable for rent-in (=1 for rent-in, 0 otherwise), I out is an indicator for rent-out (=1 for rent-out, and 0 otherwise), TC in and TC out are transaction costs, and all other variables are as defined above. From the first order conditions, we can derive three propositions that can be tested empirically.7
Proposition 1: The amount of land rented in (out) is strictly increasing (decreasing) in households’ agricultural ability, ai, and strictly decreasing (increasing) in the land endowment A−i. Land rental will transfer land to efficient, but land-poor producers, thereby contributing to higher levels of productivity and more efficient factor use in the economy.
Proposition 2: The presence of transaction costs defines two critical ability levels a1(TC out, …) and au(TC in, …) such that households with ability ai∈[a1, au] will remain in autarky. Any increase in TC in or TC out will expand the autarky range, thus reducing the number of producers participating in rental markets and the number of efficiency-enhancing land transactions. Compared to a situation with no transaction cost, this will decrease productivity and social welfare.
6. As we have data on overall leasing but not the specific contractual form, we couch our discussion in general terms rather than a specific rental arrangement.
7. For a more detailed derivation, see Deininger and Jin (2007).
234 Ind Ia pol Icy forum, 2009–10
Proposition 3: Increases of the exogenously given wage for off-farm em-ployment will imply that higher amounts of land are transacted in rental markets as households with low agricultural ability who join the off-farm labor market will supply more land. With an appropriate model closure (see Deininger et al., 2008 for details), this leads to a decrease in the equilibrium rental rate which will prompt high-ability workers to rent in more land and specialize in agricultural production.
Estimation Strategy
Equations (2a, 2b, 2c) indicate that producers’ decision to enter land rental markets depends on their marginal productivity in autarky, MP(A−) as com-pared to the rental rate to be paid r(TC in) or received r(TC out) which is a function of transaction costs. Formally, the three regimes are characterized by
Rent-out regime ( ): A A Mi*
i> + <P A r TCiout( ) ( )ε (2a)
Autarky regime ( )A Ai*
i= < + <: r TC MP A r TCouti
in( ) ( ) ( )ε (2b)
Rent-in regime ( ): A Ai*
i< + >MP A r TCiin( ) ( )ε (2c)
A producer’s marginal product MP(A−), will depend on his or her ability (a), endowment with land (A−), family labor (L−), assets (K), and the opportunity cost of labor which will be affected by the level of education (E) and the presence of opportunities in the local off-farm labor market (O). Defining a well-behaved net earning function g(a, A−, L−, K, E, O) with first derivative g′(.), we can write a linear version of the latter as MP(A−) = g′(a, A−, L−, K, E, O) = β0 + β1a + β2 A− + β3L− + β4K + β5E + β6O. Transaction costs are expected to depend on policy variables S, household characteristics Z, and a dummy D99 for 1999. With linear versions of the transaction cost functions denoted by r(TCout) = η0 + η1S + η2Z + η3D99 and r(TCin) = δ0 + δ 1S + δ 2Z + δ3D99 and defining an index variable yi such that yi = 1 if A*< A−; yi = 2 if A* = A−; yi = 3 if A* > A−, we can rewrite the system of equations (2a, 2b, 2c) as an ordered probit model that can be estimated using maximum likelihood methods.
Pr ob( )y S Z D
A L K E
i i= = < + + + − −
− − − − −
1 0 1 2 399
0 1
2 3 4 5
Φ{ε η η η η β β α
β β β β ββ6O} (3a)

Klaus deininger and Hari K. nagarajan 235
Pr ob( )y S Z D A L
K E O
i = = + + + − − − −
− − −
2 0 1 2 399
0 1 2 3
4 5 6
Φ{η η η η β β α β β
β β β << < + + +
− − − − − − −
ε δ δ δ δ
β β α β β β β βi S Z D
A L K E O
0 1 2 399
0 1 2 3 4 5 6 } (3b)
Prob( )y S Z D
A L K Ei i i= = > + + + − −
− − − − −
3 0 1 2 399
0 1
2 3 4 5
Φ{ε δ δ δ δ β β α
β β β β β66O}
(3c)
Variables we expect to affect marginal productivity are agricultural ability (a), the derivation of which will be discussed below, a dummy for landlessness and the log of the land endowment to represent A−, the number of members in the 14–60 and below 14-year age group to represent L−, the value of assets and the share of agricultural assets (livestock, implements, and agricultural structures) for K, the head’s age (as a proxy for experience) and a dummy for primary education to represent human capital E, and mean village income O to represent wage labor opportunities in off-farm labor markets. Transaction cost of land rental participation are affected by producer’s caste status (Z), a time dummy (D99), and land policy (S) which is proxied by either the share of households who were recognized under tenancy reform, the share of area distributed under ceiling legislation, or the number of tenancy laws enacted as discussed earlier.
The propositions from our model allow making predictions on the signs of individual coefficients. The factor equalization from proposition 1 implies that rental markets will transfer land to more productive producers (β 1 > 0) with lower levels of land endowments (β 2 < 0) and more family labor (β 3 > 0). The hypothesis of wealth bias in rental markets, possibly due to credit market imperfections, translates into β 4 > 0. Diversification effects implied by proposition 3 suggest that producers with higher levels of education have better off-farm opportunities and will be less likely to rent in land (β 5 < 0) and that higher levels of non-agricultural wages, proxied by O, will make renting in less likely (β 6 < 0).
Proposition 2 implies that, by moving the cut-off points where producers shift from renting out to autarky and from autarky to renting in, respectively, rental market restrictions expand the range of autarky but do not affect producers’ marginal product due to the fixed wage rate. We thus expect η1 < 0 and δ1 > 0, respectively. By the same logic, higher transaction costs for producers from scheduled and backward castes imply η2 < 0, and δ 2 > 0 while a reduction over time in transaction costs due to better access to information implies η3 > 0 and δ 3 < 0.
236 Ind Ia pol Icy forum, 2009–10
A key element of the above regressions is households’ agricultural ability a. As the data available are a panel of households and their offspring who were observed in 1982 and again in 1999, we can recover this parameter from a panel production function using household (or dynasty) fixed effects to proxy for ability (Deininger and Jin, 2008). Let technology be represented by the Cobb-Douglas production function
Q A L K X tijt i j ijt ijt ijt ijt= +exp( ) exp( )α α φθ θ θ θ1 2 3 4
(4)
where Qijt is the value of agricultural output produced by household i in village j in year t; Aijt, Lijt and Kijt, Xijt are total cultivated area, labor for crop production, value of agricultural assets, and amounts of chemical fertilizer, organic manure, pesticides, and seeds, θ1, θ2, θ3, and θ4 are technical coefficients, aj is a time invariant village level parameter reflecting, among others, access to markets, infrastructure, and other time invariant factors such as climate, ai is the time invariant household fixed effect which we use to measure of ability, and t is a time dummy so that exp(φt) measures productivity changes over time. To estimate this, we let aij = ai + aj, take logarithms of both sides, and add an iid error term to obtain
qijt = aij + θ1 aijt + θ2 lijt + θ3 kijt + θ4 xijt + φ t + εijt (5)
where lower case letters are in logarithms. With multiple observations per household, we can subtract means
qijt – q−ij = aij – a−ij + θ (Zijt – Z−
ij) + φ (t – t ) + εijt – ε−ij (6)
where Zijt is a vector including a, l, k, x with coefficient θ. As aij – a−ij = 0, this can be simplified to
qijt – q−ij = θ (Zijt – Z−
ij) + φ (t – t ) + εijt – ε−ij (7)
This can be used to obtain a ij, composed of a producer’s idiosyncratic ability ai and unobserved village attributes aj. Letting the latter be the
average of household fixed effect in the village α α^j ij
i
=
∑ nj
(Mundlak,
1961) allows to obtain a i, the producer-specific effect by subtracting a j from a ij.
An alternative approach to determine producers’ level of technical efficiency in each of the periods is to use a stochastic frontier production function. This assumes that the disturbance term is composed of two additive components vi and ui where vi is pure white noise and ui ~ N + (0, δu
2) captures
Klaus deininger and Hari K. nagarajan 237
producers’ level of technical inefficiency TEi = exp(–ui) (Coelli, 1995). While the strong distributional assumption and the fact that ui will capture other shocks imply that this approach is inferior to the one based on panel data, it does not require us to drop the large number of households who were included only in the second period. We therefore use it as a robustness check for our results below without reporting detailed results.
Data Sources and Descriptive Evidence
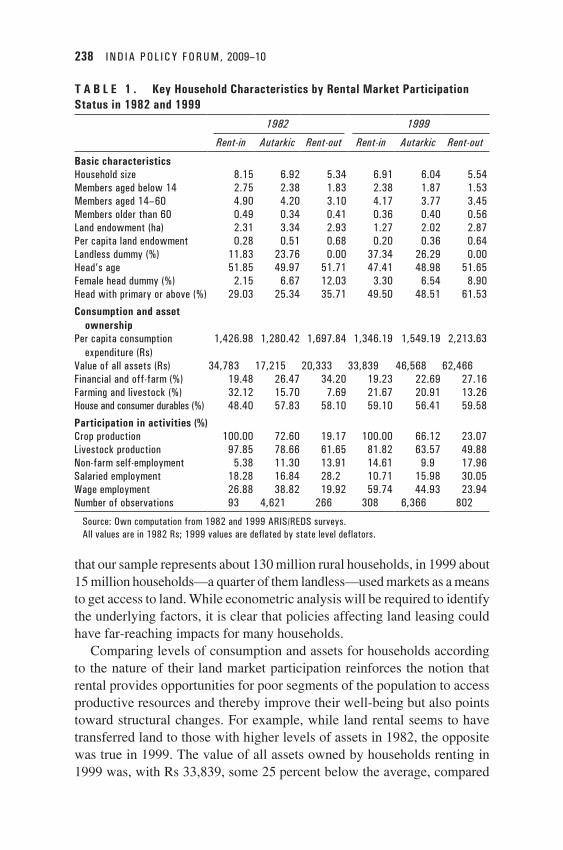
The data used here and below come from two rounds of NCAER’s ARIS/REDS survey conducted in 1982 and 1999, respectively. This survey, the first rounds of which were implemented in 1968–71 covers all of India’s major states. The 1982 sample includes some 5,000 households (Foster and Rosenzweig, 1996) and adding replacements and splits yields about 7,500 households which are located in 242 villages in 104 districts and 17 states in 1999 (Foster and Rosenzweig, 2004).8 Table 1 presents household characteristics by rental participation status (rent-in, rent-out, or autarkic). It points toward an increase in the level of land market activity over the period; from 5.3 percent and 2 percent for renting out and renting in, respectively, in 1982, the share of market participants has increased to 10.7 percent and 4.1 percent in 1999.9 This suggests that rental markets functioned better in the second, as compared to the first period. Comparing the per capita land endowment for land owners who either remained in autarky (0.51 ha and 0.36 ha in 1982 and 1999, respectively), rented in (0.28 ha and 0.20 ha), or rented out (0.68 ha and 0.64 ha) illustrates that, in both periods, rental provided opportunities for land-scarce and labor-abundant households to gain access to land. Land markets transferred land from households with more educated and female heads to male headed ones with less education. The share of landless who had gained access to land through rental markets increased from 12 percent in the first to 37 percent in the second period, suggesting an expansion of outreach toward this group over time. Noting
8. Sample states include Andhra Pradesh, Bihar, Chhattisgarh, Gujarat, Haryana, Himachal Pradesh, Jharkhand, Karnataka, Kerala, Madhya Pradesh, Maharashtra, Orissa, Punjab, Rajasthan, Tamil Nadu, Uttar Pradesh, and West Bengal.
9. While this is a large change, the level of rental market activity increased more rapidly, and in a shorter period, in other Asian countries such as China or Vietnam, despite the fact that the more egalitarian land ownership distribution in these countries would put greater limits on the potential of land markets to equalize operational holdings than in India. In Vietnam, the share of households renting has increased from 3.8 percent to 15.8 percent in the 5-year period between 1993 and 1998 (Deininger and Jin, 2008). In China, the same figure increased from 2.3 percent in 1996 to 9.4 percent in 2001 (Deininger and Jin, 2005).
238 Ind Ia pol Icy forum, 2009–10
that our sample represents about 130 million rural households, in 1999 about 15 million households—a quarter of them landless—used markets as a means to get access to land. While econometric analysis will be required to identify the underlying factors, it is clear that policies affecting land leasing could have far-reaching impacts for many households.
Comparing levels of consumption and assets for households according to the nature of their land market participation reinforces the notion that rental provides opportunities for poor segments of the population to access productive resources and thereby improve their well-being but also points toward structural changes. For example, while land rental seems to have transferred land to those with higher levels of assets in 1982, the opposite was true in 1999. The value of all assets owned by households renting in 1999 was, with Rs 33,839, some 25 percent below the average, compared
T a B L E 1 . Key Household Characteristics by Rental Market Participation Status in 1982 and 1999
1982 1999
Rent-in Autarkic Rent-out Rent-in Autarkic Rent-out
Basic characteristicsHousehold size 8.15 6.92 5.34 6.91 6.04 5.54members aged below 14 2.75 2.38 1.83 2.38 1.87 1.53members aged 14–60 4.90 4.20 3.10 4.17 3.77 3.45members older than 60 0.49 0.34 0.41 0.36 0.40 0.56land endowment (ha) 2.31 3.34 2.93 1.27 2.02 2.87per capita land endowment 0.28 0.51 0.68 0.20 0.36 0.64landless dummy (%) 11.83 23.76 0.00 37.34 26.29 0.00Head’s age 51.85 49.97 51.71 47.41 48.98 51.65female head dummy (%) 2.15 6.67 12.03 3.30 6.54 8.90Head with primary or above (%) 29.03 25.34 35.71 49.50 48.51 61.53
Consumption and asset ownership
per capita consumption expenditure (rs)
1,426.98 1,280.42 1,697.84 1,346.19 1,549.19 2,213.63
Value of all assets (rs) 34,783 17,215 20,333 33,839 46,568 62,466financial and off-farm (%) 19.48 26.47 34.20 19.23 22.69 27.16farming and livestock (%) 32.12 15.70 7.69 21.67 20.91 13.26House and consumer durables (%) 48.40 57.83 58.10 59.10 56.41 59.58
Participation in activities (%) crop production 100.00 72.60 19.17 100.00 66.12 23.07livestock production 97.85 78.66 61.65 81.82 63.57 49.88non-farm self-employment 5.38 11.30 13.91 14.61 9.9 17.96Salaried employment 18.28 16.84 28.2 10.71 15.98 30.05Wage employment 26.88 38.82 19.92 59.74 44.93 23.94number of observations 93 4,621 266 308 6,366 802
Source: own computation from 1982 and 1999 arIS/rEdS surveys.all values are in 1982 rs; 1999 values are deflated by state level deflators.

Klaus deininger and Hari K. nagarajan 239
to autarkic households who had assets equivalent to the mean of the sample and those renting out whose asset endowment was significantly above the average (by about 33 percent). This not only supports the notion that it is now the asset-poor who benefit from land access provided by rental markets but also suggests that, over time, wealth became less important for agricultural production and more relevant for non-agricultural activity.10 At the same time, a narrowing gap between rent-in and average households with respect to per capita expenditure is consistent with the hypothesis of land markets making a positive contribution to participants’ livelihood. The high share of renters engaging in (agricultural) wage employment suggests that land rental provides wage laborers with ways to earn additional income. The fact that, in contrast to 1982, non-farm self-employment is much higher among rent-in households than either the mean or those who remained in autarky suggests that land rental is not an obstacle to participation in the rural non-farm economy.
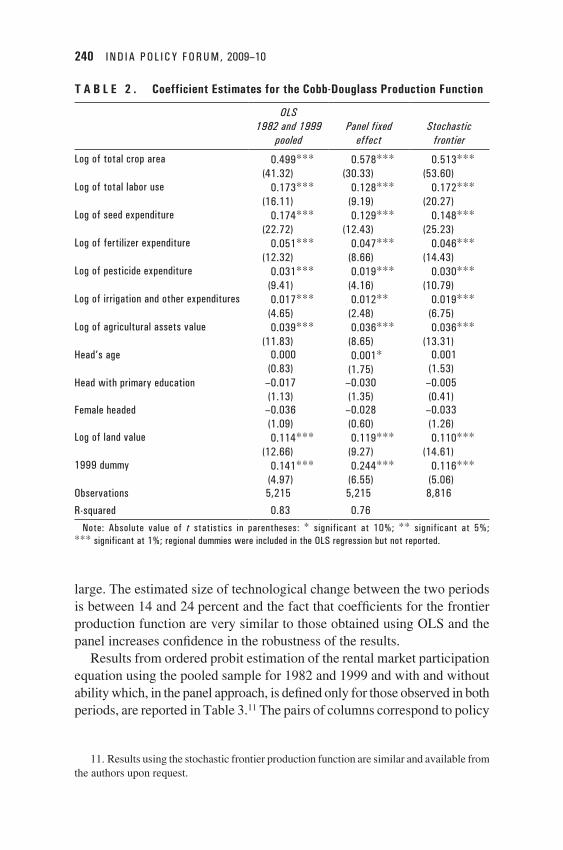
Econometric Results
To obtain a measure of households’ agricultural ability, a production function, coefficients for which are reported in Table 2, was estimated. Although a significant number of households for whom production is observed only in one of the periods are dropped, the specification fit the data well with an R2 of 0.76 for the fixed effect estimation, and of 0.83 for OLS with coefficient estimates from both being close to each other. Concerning the individual variables, land is estimated to be by far the most important input for crop production; doubling cultivated land area alone would lead to a 50 percent to 58 percent increase in total crop production. This is followed by seed expenditures and labor use with an estimated elasticity of 13 percent to 17 percent each. Compared to these, returns to fertilizer, pesticides, irrigation, and assets are more moderate with elasticities of about 5 percent, 2–3 percent, 1–2 percent, and 4 percent for expenditure on fertilizer, pesticides, irriga-tion, and others. While neither education nor the gender of the household head are significant, land quality matters and doubling land values, which we use as a proxy for land quality, would increase total output by 11–12 percent. Significant variation of ability across households could imply that, even without a strong pull from non-agricultural employment opportunities, the scope for market-mediated transfers to bring about efficiency gains could be
10. Finding significant differences in the composition of the asset portfolio between rent-in and rent-out households, with the former having relatively more of their wealth in farming and livestock, and the latter in off-farm and financial assets, is not too surprising.
240 Ind Ia pol Icy forum, 2009–10
large. The estimated size of technological change between the two periods is between 14 and 24 percent and the fact that coefficients for the frontier production function are very similar to those obtained using OLS and the panel increases confidence in the robustness of the results.
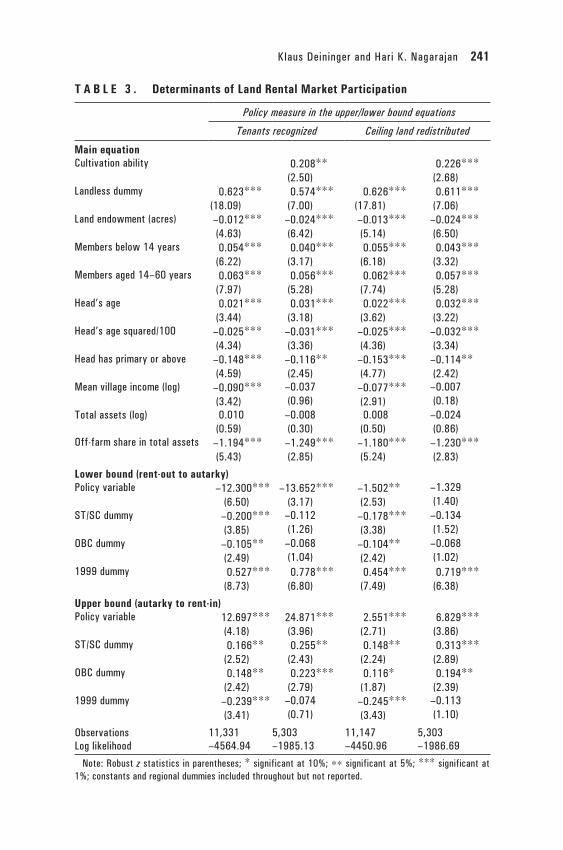
Results from ordered probit estimation of the rental market participation equation using the pooled sample for 1982 and 1999 and with and without ability which, in the panel approach, is defined only for those observed in both periods, are reported in Table 3.11 The pairs of columns correspond to policy
T a B L E 2 . Coefficient Estimates for the Cobb-Douglass Production Function
OLS1982 and 1999
pooledPanel fixed
effectStochastic
frontier
log of total crop area 0.499***(41.32)
0.578***(30.33)
0.513***(53.60)
log of total labor use 0.173***(16.11)
0.128***(9.19)
0.172***(20.27)
log of seed expenditure 0.174***(22.72)
0.129***(12.43)
0.148***(25.23)
log of fertilizer expenditure 0.051***(12.32)
0.047***(8.66)
0.046***(14.43)
log of pesticide expenditure 0.031***(9.41)
0.019***(4.16)
0.030***(10.79)
log of irrigation and other expenditures 0.017***(4.65)
0.012**(2.48)
0.019***(6.75)
log of agricultural assets value 0.039***(11.83)
0.036***(8.65)
0.036***(13.31)
Head’s age 0.000(0.83)
0.001*(1.75)
0.001(1.53)
Head with primary education –0.017(1.13)
–0.030(1.35)
–0.005(0.41)
female headed –0.036(1.09)
–0.028(0.60)
–0.033(1.26)
log of land value 0.114***(12.66)
0.119***(9.27)
0.110***(14.61)
1999 dummy 0.141***(4.97)
0.244***(6.55)
0.116***(5.06)
observations 5,215 5,215 8,816
r-squared 0.83 0.76
note: absolute value of t statistics in parentheses: * significant at 10%; ** significant at 5%; *** significant at 1%; regional dummies were included in the olS regression but not reported.
11. Results using the stochastic frontier production function are similar and available from the authors upon request.
Klaus deininger and Hari K. nagarajan 241
T a B L E 3 . Determinants of Land Rental Market Participation
Policy measure in the upper/lower bound equations
Tenants recognized Ceiling land redistributed
Main equationcultivation ability 0.208**
(2.50)0.226***
(2.68)landless dummy 0.623***
(18.09)0.574***
(7.00)0.626***
(17.81)0.611***
(7.06)land endowment (acres) –0.012***
(4.63)–0.024***(6.42)
–0.013***(5.14)
–0.024***(6.50)
members below 14 years 0.054***(6.22)
0.040***(3.17)
0.055***(6.18)
0.043***(3.32)
members aged 14–60 years 0.063***(7.97)
0.056***(5.28)
0.062***(7.74)
0.057***(5.28)
Head’s age 0.021***(3.44)
0.031***(3.18)
0.022***(3.62)
0.032***(3.22)
Head’s age squared/100 –0.025***(4.34)
–0.031***(3.36)
–0.025***(4.36)
–0.032***(3.34)
Head has primary or above –0.148***(4.59)
–0.116**(2.45)
–0.153***(4.77)
–0.114**(2.42)
mean village income (log) –0.090***(3.42)
–0.037(0.96)
–0.077***(2.91)
–0.007(0.18)
Total assets (log) 0.010(0.59)
–0.008(0.30)
0.008(0.50)
–0.024(0.86)
off-farm share in total assets –1.194***(5.43)
–1.249***(2.85)
–1.180***(5.24)
–1.230***(2.83)
Lower bound (rent-out to autarky)policy variable –12.300***
(6.50)–13.652***
(3.17)–1.502**(2.53)
–1.329(1.40)
ST/Sc dummy –0.200***(3.85)
–0.112(1.26)
–0.178***(3.38)
–0.134(1.52)
oBc dummy –0.105**(2.49)
–0.068(1.04)
–0.104**(2.42)
–0.068(1.02)
1999 dummy 0.527***(8.73)
0.778***(6.80)
0.454***(7.49)
0.719***(6.38)
Upper bound (autarky to rent-in)policy variable 12.697***
(4.18)24.871***(3.96)
2.551***(2.71)
6.829***(3.86)
ST/Sc dummy 0.166**(2.52)
0.255**(2.43)
0.148**(2.24)
0.313***(2.89)
oBc dummy 0.148**(2.42)
0.223***(2.79)
0.116*(1.87)
0.194**(2.39)
1999 dummy –0.239***(3.41)
–0.074(0.71)
–0.245***(3.43)
–0.113(1.10)
observations 11,331 5,303 11,147 5,303log likelihood –4564.94 –1985.13 –4450.96 –1986.69
note: robust z statistics in parentheses; * significant at 10%; ** significant at 5%; *** significant at 1%; constants and regional dummies included throughout but not reported.
242 Ind Ia pol Icy forum, 2009–10
variables, that is, recognition of tenants and distribution of above-ceiling land. To interpret these, recall the coding of 1 for rent-out, 2 for autarky, and 3 for rent-in regimes, implying that positive coefficients increase the probability of renting out.
The highly significant coefficient on ability implies that, as expected, rental markets improve productivity of land use by transferring land from less to more efficient producers. The magnitude is large; according to the estimates, the probability for the most efficient household in the sample to rent-in is more than double that for the average household.12 There is also a strong factor equalization effect. Higher land and lower labor endowments—especially for 14–60-year olds—increase the propensity to supply land to the rental market. This suggests that, by transferring land to labor-rich but land-poor households, markets allow gainful employment of rural labor. The large significant coefficient of the landless dummy implies that rental is important for landless households to access land. Landless producer’s propensity to rent is, at 5.4–8.6 points, almost double that of land owners. Lack of significance for the coefficient on total assets suggests that rental markets are not biased in favor of the wealthy. In line with descriptive statistics reported earlier, this would imply that the importance of tenant wealth, for example, to reduce moral hazard, is no longer a very significant issue as wealth bias that had characterized such markets earlier was reduced with diversification of the economy.13 The response of rental markets to economic growth is visible from the fact that completion of primary education by the head increases (decreases) the propensity to rent out (in) land, by about 2.1 percent and 1.1 percent, respectively. Mean village income increases the tendency to rent out as well, implying that, as the level of income increases, households will be more likely to move out of agriculture, supply land to the rental market, and allow those remaining behind to increase their holdings and income levels, as is also observed in other countries, for example, China.
Regarding the lower bound equation, regressions suggest that policy restrictions will lead to a significant and quantitatively large reduction of land
12. While lack of data on profits before and after rental participation makes it difficult to assess the net impact on productivity, evidence from China, where rental helped increase pro- ductivity gains by some 60 percent (Deininger and Jin, 2007), suggest that these can be large.
13. Inclusion of an interaction between the time dummy and asset ownership (not reported) suggests that land rental markets had been biased in favor of the wealthy in 1982 but that, presumably due to better credit market access in the study areas, this bias had disappeared by 1999.
Klaus deininger and Hari K. nagarajan 243
supply to rental markets. Estimated effects are strongest for recognition of tenants (first and second column), consistent with the notion that landlords will be less willing to rent out if doing so can attenuate their property rights or if there are limits on their ability to negotiate rents. This is consistent with expectations that ceiling legislation poses less of a threat than tenancy regulation—as the latter applies to all market participants irrespective of their holding size—and enforcing it is more politically controversial and administratively complex than implementing tenancy legislation. The 1999 dummy illustrates that, over time, land rental supply increased significantly.
Turning to the (upper) bound between autarky and renting in, positive coefficients on all policy variables suggests that rental restrictions also depressed demand, making it more difficult for households to obtain land through rental. In most equations, coefficients are bigger for the upper as compared to the lower bound, suggesting that the impact of policy-induced restrictions may be larger on the demand than the supply-side. Backward and scheduled castes are more likely to remain in autarky and over time, the size of the autarky area has decreased, that is, land rental markets have become more active.
Policy Implications
In rural India, there is an increasing recognition of the importance of land rental markets to bring land to more productive uses while at the same time providing a basis for development of the rural non-farm economy. Although the continued need for restrictions on the operation of land rental markets has been debated in case studies, quantitative evidence of its impact has been scant, giving rise to a debate that is highly ideological in nature. Contrary to what is often assumed, our data suggest that, by allowing higher ability individuals to access land and equalizing factor ratios, rental markets improve overall productivity and equity. Interacting policy variables with producers’ estimated productive efficiency (not reported) allows more detailed exploration of rental restrictions’ impact on efficiency with results reinforcing the notion that rental restrictions significantly curtail efficiency of land use by preventing land access by the most efficient producers and slowing growth of the non-agricultural economy.
To quantify the impact of policy restrictions we compute, for every house-hold, the predicted probability to rent out with actual values for all right hand side variables and with the tenancy restriction variable taking a value of zero. Taking the difference between these two values as a measure for the impact

244 Ind Ia pol Icy forum, 2009–10
of tenancy restrictions suggests that their removal could lead to a considerable increase in renting out, by between 40 percent and 70 percent. Removal of tenancy restriction is even more important for potential tenants as it could more than double access to land by those renting in. While significant time trends in both upper and lower bound equations suggest that the combined effect of higher overall growth and non-agricultural activity may reduce the undesirable impacts of rental regulation over time, estimated coefficients are small and not always significant; their magnitude implies that almost a century will be required to offset the effects of rental restrictions. Indeed, the government has recognized the importance of taking action on legalizing land leasing and eliminating rental market restrictions in the context of a broader regulatory framework for land market operation (Government of India, 2008).
Land Sales Markets
Although less restricted than land rental, it is often argued that land sales can lead to outcomes that are undesirable from an equity and an efficiency point of view due to imperfections in other markets. In addition to reviewing the underlying arguments, we provide empirical evidence to assess the extent to which this is true. Results suggest that, even though exogenous shocks have an impact on land sales, this does not imply that their operation would reduce efficiency; to the contrary, they helped more productive but land-poor and labor-abundant farmers gain access to land.
Motivation and Conceptual Framework
While theoretical models that put land sales markets into the general context of a household’s choice of an optimum asset portfolio can generate widely divergent predictions, empirical evidence to assess the extent to which these correspond to actual outcomes—and key underlying factors—is often scant. In fact, as land sales markets are normally very thin, large or sufficiently long samples will be required to be able to observe causes and consequences of land market participation. Existing studies are often based on comparatively small samples (Lanjouw and Stern, 1998; Sarap, 1995) or rely on retro-spective information (Baland et al., 2007). The implied selectivity and lack of initial characteristics makes it in many cases difficult for analysis to go beyond simple descriptive statistics or transition matrices with little scope
Klaus deininger and Hari K. nagarajan 245
to help identify underlying factors and thus provide much-needed insight to enlighten the policy debate.
If households do not face subsistence or borrowing constraints that would otherwise prevent them from fully insuring against risk, everybody has access to the same set of information, and switching transaction partners is costless, the market for land sales will not be different from that for land rental. Demand for land would be determined by producers’ ability to make best use of the land in farming and relative land endowments and market transactions will enhance social welfare by allowing small producers with higher levels of productivity to bid land away from large and less productive land owners (Zimmerman and Carter, 1999). Land prices would equal the net present value of the stream of profits from the best available land use, and potential buyers would be indifferent between renting land and purchasing it.
Policy-makers’ concern about land sales leading to outcomes that may not be desirable from a social or economic perspective originates in three observations, namely that (i) imperfections in markets for credit and insurance will affect participation in land markets, and that subsistence constraints can force households to take decisions based on short-term requirements that are inconsistent with maximization of welfare in the long term; (ii) differences in producers’ access to information will lead to variation in transaction costs; and (iii) with positive transaction cost, acquisition of land for speculative purposes unrelated to its use in agricultural production will lead to sub-optimal production outcomes.
Households’ decision problem can be illustrated by considering the option of holding two assets, one, for example, land, with high returns but that is also risky and illiquid, and another one, for example, grain, with lower returns but less risk and higher liquidity. At every point in time, households choose a combination between these two assets to maximize utility over the entire lifetime and subject to limits for borrowing and an overall budget constraint. While an analytical solution to this problem is impossible unless more structure is imposed, numerical simulations show that credit market imper-fections and risk, households’ need to satisfy basic subsistence needs can give rise to land being supplied to the market by producers who are forced to sell under duress in bad years, often to individuals with access to non-covariate income streams outside the local rural economy or large amounts of assets (Zimmerman and Carter, 1999).
In high-risk environments, this may lead the poor to rationally prefer assets with a lower but more stable return to land even if transaction costs were modest and they had access to credit to acquire it. With imperfect

246 Ind Ia pol Icy forum, 2009–10
credit markets, some households will be able to buy and accumulate land not because they would be more productive but due to their ability to better overcome such market imperfections (Carter and Salgado, 2001; Zimmerman and Carter, 2003). Similarly, others may be forced to sell use land markets to sell land in exchange for less risky assets to minimize their exposure to risk even though they would be able to make more productive use of the land than those who acquire it (Rosenzweig and Binswanger, 1993). In addition to these factors, macroeconomic instability, expectations of future land price hikes and transaction costs in lease markets, lack of sufficiently attractive alternative assets, policies, and the valuation of land for non-productive reasons, all will affect households’ participation in land sales markets independently from their innate productivity. We model these two sets of factors that will affect land markets in a rather independent manner in our ordered probit estimation as discussed below. A direct consequence of this is that the productivity and equity impact of land sales market operation will depend on the extent to which other markets function and net effects of land sales markets are ambiguous a priori and will have to be decided empirically depending on whether or not risk is high.
With India’s highly unequal distribution of land, distress sales had historically played a major role (Kranton and Swamy, 1999). Evidence suggests that households’ access to insurance substitutes allowing them to buffer consumption during crisis had a significant impact on whether land sales markets helped to equalize endowments or contributed to further dis-equalization (Cain, 1981). To halt these tendencies, virtually all states implemented, during the 1960s and 1970s, different types of land reform measures, mainly in the form of ceilings for land ownership and security against eviction as well as rent ceilings for tenants.14 In addition to these, legislation in virtually all states prohibits land transfers from tribals to non-tribals. Transaction costs are further increased by stamp duty which has to be paid upon registration of a sale and which in most cases amounts to more than 10 percent of land value (Alm et al., 2004).
14. Ceilings on the amount of land that could be held by an individual or household although implementation effort varied widely and generally, was much delayed until the early 1970s. Contrary to Korea, where land owners’ anticipation of such ceilings led to a tremendous increase in land sales market transactions that transferred income to former tenants and increased productivity (Jeon and Kim, 2000), they were largely evaded by spurious subdivisions (Kaushik, 2005). Where, as in West Bengal, implementation of land reform legislation was effective, ceilings are still credited with having led to greater land sales market activity (Bardhan and Mookherjee, 2006).
Klaus deininger and Hari K. nagarajan 247
Estimation Strategy
Based on the discussion earlier, we build on Deininger et al. (2009) to explore three issues, namely (i) whether land sales promote efficiency of land use by transferring it to households with higher levels of ability; (ii) the extent to which land sales contribute to equalization of endowments, that is, transfer land from labor-poor and land-rich to labor-rich and land-poor households; and (iii) whether shocks and policies affect the outcomes observed in land sales markets. Further, we are interested to see how land sales compare to non-market transfers. We distinguish factors that affect households’ or dynasties’ latent demand for land due to their level of productivity from other factors, unrelated to productivity, that may prevent them from exercising this demand or force them to sell even if doing so runs counter to long-term maximization of productivity using an ordered probit model with variable upper and lower thresholds for land market participation. Latent demand is determined by their current and expected future ability to make productive use of the land. Actual participation decisions will, in addition, be affected by factors unrelated to productivity such as transaction costs and shocks. Formally, we assume that latent demand for land depends on long-term productivity which can be expressed as a reduced form equation
f(a, A−, L, K, O) = β0 + β1a + β2 A− + β3 K + β4 L + β5 N (8)
Thresholds for the transition between sales and autarky and autarky and purchase are defined as follows:
pS(T) = η0 + η1 S + η2 C + η3 G + η4 (C × S) + η5 (G × S) + η6 Z (9)
pB(T) = δ0 + δ1 S + δ2 C + δ3G + δ4(C × S) + δ5 (G × S) + δ6 Z (10)
where S denotes whether or not the household experienced a weather shock, defined as a level of rain below the average for two consecutive growing seasons, C denotes credit access, G local availability of mechanisms for risk coping, in particular the employment guarantee scheme, Z is a vector of other characteristics, and the β s, δ s, and η s are parameters to be estimated.
Factors affecting the extent of participation in the main equation are the level of ability and the dynasty’s endowment with land, labor, and assets, the length of the households’ independent existence in 1999, and the position in the life cycle which are represented empirically by a dummy for whether a household is from a landless dynasty and the dynasty’s land endowment to represent A and initial asset endowments and levels of per capita
248 Ind Ia pol Icy forum, 2009–10
consumption to proxy for K. To proxy for life cycle events and concerns about inter-generational transmission (L), we use the number of unmarried sons aged between 5 and 25 years in 1981. We expect β1 > 0 and β2 < 0 as high levels of agricultural ability increase producers’ marginal product and thus their competitiveness in land markets while standard assumptions for the production function imply a negative relationship between land endowment and marginal product. In other words, higher agricultural ability or lower land endowment will increase a household’s likely propensity to shift from autarkic to land purchase and less likely to move away from autarkic to land sale. As, with imperfections in credit and labor markets, higher levels of wealth or family labor will increase a household’s marginal productivity, we expect β3 > 0, β4 > 0, and β5 > 0.
Concerning the variables in the threshold equations, note that Z includes policy constraints on tribals’ land market participation, the inequality of land holdings in the village that will affect transaction costs in the land market, and the growth rate of village income to proxy for non-farm opportunities. We expect negative weather shocks to increase the supply of land to the market through (distress) sales and safety nets to reduce it as they improve poor people’s ability to cope with unanticipated shocks, thus η1 > 0, and η3 < 0. While presence of banks also improves the ability to cope with shocks, it will also provide greater liquidity that would increase land market activity, making the sign of η2 indeterminate. As safety nets and banks improve the ability to cope with shocks, we expect η4 < 0 and η5 < 0.
On the supply side, we expect shocks (village employment schemes) to increase (decrease) land supply to the market, hence δ1 < 0, and δ3 > 0. By the same liquidity argument as above, we expect that δ3 < 0. If access to banks and safety nets reduces the supply of land to markets through distress sales and less supply would reduce the number of those being able to buy land, we expect δ4 > 0 and δ5 > 0. Finally, the presence of constraints on market participation by tribals leads us to expect a negative (positive) sign on the coefficient for STs/SCs in the upper (lower) threshold equation. On the other hand, by increasing the scope for productivity-enhancing land transactions, economic growth at the village level is expected to increase land market activity, thus we expect the coefficient on this variable to be positive (negative) in the upper and lower threshold equations, respectively.
To compare effects of market transactions to those of non-market transactions (that is, inheritance, gift, dowry, etc.), we run an ordered probit model that identifies key determinants for non-market land transfers with some modifications of the variables to be included in the ordered probit model. For example, the entire argument of transaction costs associated
Klaus deininger and Hari K. nagarajan 249
with land sale and land purchase will not be relevant to inheritance and gift exchange. Correspondingly, we treat the two thresholds in the ordered probit model as constant. As discussed earlier in the estimation strategy section, we treated the lower and upper bounds of the ordered probit model as constant because the transaction costs are unlikely to be relevant to non-market transactions.
Descriptive Statistics
With 15 percent and 8 percent (or 0.88 percent and 0.47 percent annually) of the population and 9 percent and 5 percent of the land involved in purchasing or selling land, respectively, the level of land sales market activity in the data compares to what has been reported by other Indian studies in similar time periods (Dreze et al., 1997; Mani and Gandhi, 1994; 1997; Rawal, 2001).15 There are clear regional differences, with land purchase markets being quite inactive in the North (6 percent of population and 3 percent of land) but relatively active in the South (25 percent and 18 percent of population and land). Even in the most active areas, land sales and purchase markets are much less active than those for rental in which 15 percent and 9 percent participated in 1999 alone (Deininger et al., 2008).
Table 4 summarizes initial characteristics in the top panel and changes in key variables between the two survey periods in the bottom panel for the whole sample (column 1) and for households who sold, bought, and remained in autarky (columns 2, 3, and 4, respectively) over the period.16 The top panel allows three main conclusions. First, data point to land sales equalizing factor endowments; land sellers had significantly smaller initial adult populations and per capita landholdings than purchasers (3.8 versus 4.4 persons aged 14–60 and 2 versus 1.3 ha per capita, respectively). Fifteen percent of buyers came from a landless dynasty, that is, more than 60 percent of those who started out landless acquired land through the market.17 Initial non-land assets or levels of per capita income are equal for purchasers, sellers, and autarkic households although the two former
15. Rawal (2001) reports a number of studies from India that find that in most cases the share of land transacted annually was below 0.5 percent. Part of the reason for this low figure may be the fact that in the studies quoted, the denominator was total village land rather than the land owned by survey respondents.
16. The results of t-tests for the significance of differences between the group transferring land and those remaining in autarky are indicated by stars as explained in the table.
17. At the same time 2 percent of the sample who were landless in 1982 managed to acquire land but had sold it by the end of the period.
250 Ind Ia pol Icy forum, 2009–10
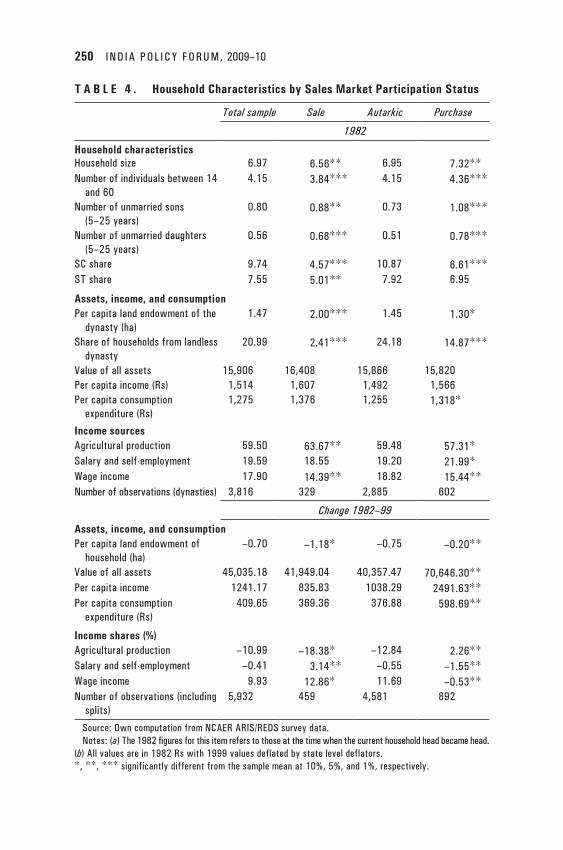
T a B L E 4 . Household Characteristics by Sales Market Participation Status
Total sample Sale Autarkic Purchase
1982
Household characteristicsHousehold size 6.97 6.56** 6.95 7.32**number of individuals between 14
and 604.15 3.84*** 4.15 4.36***
number of unmarried sons (5–25 years)
0.80 0.88** 0.73 1.08***
number of unmarried daughters (5–25 years)
0.56 0.68*** 0.51 0.78***
Sc share 9.74 4.57*** 10.87 6.61***ST share 7.55 5.01** 7.92 6.95
assets, income, and consumptionper capita land endowment of the
dynasty (ha)1.47 2.00*** 1.45 1.30*
Share of households from landless dynasty
20.99 2.41*** 24.18 14.87***
Value of all assets 15,906 16,408 15,866 15,820per capita income (rs) 1,514 1,607 1,492 1,566per capita consumption
expenditure (rs)1,275 1,376 1,255 1,318*
Income sourcesagricultural production 59.50 63.67** 59.48 57.31*Salary and self-employment 19.59 18.55 19.20 21.99*Wage income 17.90 14.39** 18.82 15.44**number of observations (dynasties) 3,816 329 2,885 602
Change 1982–99
assets, income, and consumptionper capita land endowment of
household (ha)–0.70 –1.18* –0.75 –0.20**
Value of all assets 45,035.18 41,949.04 40,357.47 70,646.30**per capita income 1241.17 835.83 1038.29 2491.63**per capita consumption
expenditure (rs)409.65 369.36 376.88 598.69**
Income shares (%)agricultural production –10.99 –18.38* –12.84 2.26**Salary and self-employment –0.41 3.14** –0.55 –1.55**Wage income 9.93 12.86* 11.69 –0.53**number of observations (including
splits)5,932 459 4,581 892
Source: own computation from ncaEr arIS/rEdS survey data.notes: (a) The 1982 figures for this item refers to those at the time when the current household head became head.
(b) all values are in 1982 rs with 1999 values deflated by state level deflators. *, **, *** significantly different from the sample mean at 10%, 5%, and 1%, respectively.
Klaus deininger and Hari K. nagarajan 251
had slightly higher initial levels of consumption. Second, the fact that the number of unmarried sons and daughters for sellers (1.08 and 0.78) and buyers (0.88 and 0.68) is markedly above that of those in autarky (0.73 and 0.51) suggests links between land market participation and life cycle events. Finally, the share of scheduled caste (SC) and tribe (ST) households who sold (4.6 percent and 5 percent) and that of SCs—but not STs—who bought land (6.6 percent and 7 percent, respectively) is significantly below their population share (9.7 percent for SCs and 7.55 percent for STs), possibly due to policies restricting land sales by STs (World Bank, 2007).
Shifting to changes over time in the bottom panel suggests that, while sellers did not become appreciably worse off, land purchasers experienced considerable welfare gains with large increases in asset ownership (Rs 70,646 versus 41,949 and 40,357), per capita income (Rs 2,491 versus 1,038 and 836), and expenditure (598 versus 369 and 376), were significantly above those for sellers and non-participants, respectively. While for the whole sample, wages were substituted for income from agricultural production, purchasers increased the share of income derived from agricultural production. Land purchasers moved to the top of the three groups in terms of per capita land endowment. Although population growth implied that all households saw their per capita land endowment decline, the magnitude was smaller for purchasers than the rest (–0.2 ha p.c. versus –0.8 and –1.2 for autarkic and sellers). The extent to which such performance was underpinned by higher levels of productivity will have to be explored through econometric analysis.
Econometric Evidence
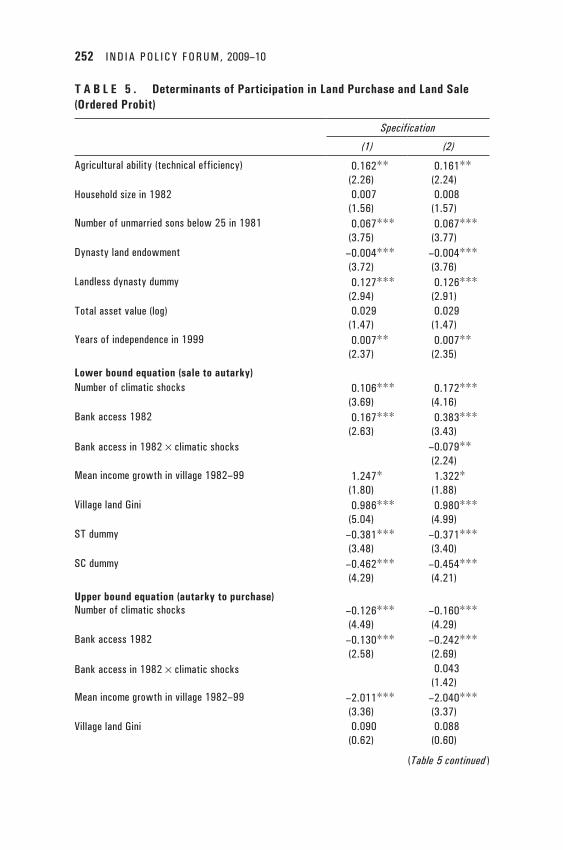
Coefficients for the main equation and participation cut-offs in the ordered probit are reported in Table 5 where column 2 also includes an interaction between shocks and bank access.18 A productivity-enhancing impact of land markets is highlighted by the positive coefficient on initial ability which suggests that sales transferred land to those who had been more efficient producers in 1982. Interestingly, imperfections in credit market, to the extent that they did exist, were not strong enough to overcome this tendency.19
18. Recall the coding of 1 for sale, 2 for autarky, and 3 for purchase. 19. As agricultural ability is not available for those whose dynasty did not cultivate land
in 1982, estimation of the ordered probit model without farming ability increases the sample by about 1,400. Results, which are available upon request, are generally consistent with those reported here. To interpret the results, recall that the coding 1 is for sale, 2 is for autarky, and 3 is for renting in, that is, a positive coefficient implies that the variable under concern increases the probability of land purchase and reduces that of a land sale.
252 Ind Ia pol Icy forum, 2009–10
T a B L E 5 . Determinants of Participation in Land Purchase and Land Sale (Ordered Probit)
Specification
(1) (2)
agricultural ability (technical efficiency) 0.162**(2.26)
0.161**(2.24)
Household size in 1982 0.007(1.56)
0.008(1.57)
number of unmarried sons below 25 in 1981 0.067***(3.75)
0.067***(3.77)
dynasty land endowment –0.004***(3.72)
–0.004***(3.76)
landless dynasty dummy 0.127***(2.94)
0.126***(2.91)
Total asset value (log) 0.029(1.47)
0.029(1.47)
years of independence in 1999 0.007**(2.37)
0.007**(2.35)
Lower bound equation (sale to autarky)number of climatic shocks 0.106***
(3.69)0.172***
(4.16)Bank access 1982 0.167***
(2.63)0.383***
(3.43)Bank access in 1982 × climatic shocks –0.079**
(2.24)mean income growth in village 1982–99 1.247*
(1.80)1.322*
(1.88)Village land Gini 0.986***
(5.04)0.980***
(4.99)ST dummy –0.381***
(3.48)–0.371***(3.40)
Sc dummy –0.462***(4.29)
–0.454***(4.21)
Upper bound equation (autarky to purchase)number of climatic shocks –0.126***
(4.49)–0.160***(4.29)
Bank access 1982 –0.130***(2.58)
–0.242***(2.69)
Bank access in 1982 × climatic shocks 0.043(1.42)
mean income growth in village 1982–99 –2.011***(3.36)
–2.040***(3.37)
Village land Gini 0.090(0.62)
0.088(0.60)
(Table 5 continued )
Klaus deininger and Hari K. nagarajan 253
Compared to the least efficient dynasty in the sample, a member of the most productive would have a probability of purchasing land (over the whole period) that is higher by about 3.8 percentage points (or 25 percent). The main equation also supports the hypothesis of sales markets contributing to factor equalization as is visible from the negative coefficient on the dynasty land endowment and the positive and highly significant coefficient on whether or not a household came from a landless dynasty.20 According to the regression, members of a landless dynasty were 15 percentage points more likely to buy land than those with the highest land endowment in the sample. Data also support the life-cycle hypothesis, suggesting that those with unmarried sons in 1982 were significantly more likely to pur- chase land.21 Also, households that have been in existence independently for longer were more likely to participate in land markets. Finally, the insignificant sign on household’s non-land assets suggests that, once other factors are controlled for, ownership of other assets did not make it easier to purchase or sell land. This suggests that speculative motives by households with large amounts of non-covariate income are not a factor that drives the observed patterns of land transactions in India over the period studied.
Results from the lower bound between land sales and autarky and the upper bound between autarky and purchase highlight a number of interest-ing results: The positive (negative) sign of climatic shocks in the lower
20. To check whether it was access to salaried income or earnings from non-agricultural self-employed that enabled the landless to purchase land, we include an interaction between the landless dummy and the share of non-farm income. The fact that this coefficient is consistently insignificant (not reported) suggests that this concern is not substantiated by the data.
21. As presence of sons in the relevant age range is highly correlated with that of daughters (ρ = 0.4), we include only the former.
Specification
(1) (2)ST dummy 0.093
(1.13)0.089
(1.09)Sc dummy 0.296***
(3.90)0.291***
(3.83)
observations 5,930 5,930
note: robust z statistics in parentheses. * significant at 10%; ** significant at 5%; *** significant at 1%.regional dummies included throughout but not reported. regional dummies are jointly significantly different from zero.
(Table 5 continued )
254 Ind Ia pol Icy forum, 2009–10
(upper) bound equations suggests that droughts or floods in consecutive seasons significantly increase the odds of a household selling land, thus also expanding the quantity of land available on the market. The positive coefficient on bank access suggests that having a bank available increases activity in land markets overall. As local economic growth, which could be correlated with banks’ location choice, is controlled for, the better liquidity afforded by bank presence is likely at the root of this. The negative coefficient on the interaction of this variable with the number of shocks implies that availability of banks can help offset somewhat less than half of the effect of shocks, for example, by providing credit and insurance substitutes that reduces the need for distress sales.
The significant and negative sign on the coefficient for dummies of SCs and STs in the lower bound equation suggests that both are less likely to sell land while that in the upper bound implies that SCs—but not STs—are also less likely to purchase land.22 Higher growth at the village level is estimated to shift the upper bound down, that is, to encourage land purchases, without affecting the boundary between sales and autarky. The finding that a more unequal land distribution (proxied by the Gini) at the village level shifts the boundary between sales and autarky upwards while leaving the upper bound unaffected could suggest that the threat of ceiling legislation being implemented prompted land owners to sell off land in anticipation of such policies (Bardhan and Mookherjee, 2006).
Policy Implications
The most important finding relates to the productivity and equity impacts of land sales market operation. Although they are, as expected, much less active than rental markets, land sales transferred land to better cultivators, thereby contributing to net gains in productivity. At the same time, and despite imperfections in other factor markets that could, in principle, lead
22. The negative coefficient on STs in the lower bound could be explained as a consequence of legal restrictions on land sales by tribals. However, the fact that the point estimate for the coefficient on SCs is even larger than (though not significantly different from) the coefficient on STs casts doubt on the validity of this interpretation, consistent with widespread reports about violations of this regulation (World Bank, 2007). The positive and significant coefficient on the SC dummy, compared to lack of significance of the ST dummy, suggests that, at least in our sample, discrimination in the land market against STs is not prevalent. In fact, we can reject equality of the two coefficients at the 1 percent level. As this is contrary to what had been found in other studies (Thorat et al., 2008), detailed study of this issue in a specifically tribal context would be desirable.
Klaus deininger and Hari K. nagarajan 255
to adverse outcomes, they also contributed to equity by equalizing factor ratios and allowing relatively land-poor and labor-abundant households to improve their levels of asset ownership and welfare without making sellers worse off. Second, and in addition to performing much better than non-market alternatives, land sales markets were significantly more active where overall economic growth was higher, suggesting that as the econ- omy develops and other obstacles and factor market imperfections are gradually dealt with, they are likely to perform an even more important role. Finally, producers’ propensity to participate in land sales markets was signifi-cantly increased by the number of times they experienced an unfavorable shock, suggesting that credit market imperfections and subsistence constraints continue to be an important determinant of land sales. At the same time, ways to mitigate such shocks, if interacted with the frequency of shocks, helped counteract such negative impacts, suggesting that rather than trying to prevent land sales through administrative fiat, it may be preferable to explore mechanisms which those affected can use to better cope with risks to avoid undesirable land sales arising from distress. Attempts to prevent such sales by administrative fiat will be difficult to enforce and have often backfired by worsening the terms of the transaction instead of preventing them (Deininger, 2003).
Other Land Policy Issues
A first area relates to the need to reduce transaction costs (and increase governance) by clarifying the institutional framework for land administration, including the setting of reasonable tax rates. In the Indian context, a number of factors, including duplication of institutions and high fees, limited coverage of the system and low reliability of the information it contains make it costly to obtain reliable information on land ownership or to transfer it. This can cause growing informality where owners see little gain in register-ing land transactions, thus eroding the reliability and value of the land administration system.
Reducing Transaction Costs of Land Transactions
Modern land administration deals with the recording, processing, and dis-semination of information about ownership, value, and use of land and the resources associated to it. This includes determination and (public) docu-mentation of property rights and attributes such as boundaries of the land.

256 Ind Ia pol Icy forum, 2009–10
India’s land administration system was established by the British with the goal of collecting land tax (revenue) on agricultural lands, rather than securing rights. Although the contribution of land revenue to government income has shrunk from about 60 percent in the mid-19th century to less than 1 percent today and the revenue department being loaded with a host of administrative functions,23 the basic institutional structure was maintained largely without change though there are, of course, some variations across states.
Instead of having one institution dealing with land matters in an author-itative and conclusive manner, responsibilities are split between four main institutions all of whom only provide presumptive evidence. The land revenue department maintains the textual database for land records, collects land revenue, in addition to its regular administrative functions. The survey and settlement department is responsible for maintaining spatial data, mapping and demarcating boundaries, and executing surveys for sub-division on demand. The department of stamps and registration is responsible for registering deeds, as well as, other instruments and collects stamp duty, the magnitude of which has long eclipsed that of land revenue, on these transactions. Finally, as land records cover agricultural areas only, local bodies such as municipal corporations or panchayats maintain property tax registers and in some cases also maps, layout plans, or city surveys in areas that have not been covered by original surveys. The problems arising from this are three-fold, namely (i) duplication of records that increases trans-action costs and reduces transparency; (ii) lack of unambiguous ownership; records and maps in many areas, especially peri-urban ones fostering conflict; and (iii) complete absence of land administration structures in marginal areas reducing tenure security and incentives for sustainable management of natural resources.
First, records are not routinely shared between revenue and registration departments or updated (mutated) in case a transaction occurs; in fact high
23. The duties of revenue official include the conduct of general elections, issuance of certificates, implementation and monitoring development schemes, and provision of relief in natural calamities. A study in Andhra Pradesh showed that revenue officials spent 32 percent of their time on administration of welfare programs, 25 percent on judicial and magisterial functions, 25 percent on developmental activities and implementation of schemes, 10 percent on general administration, and only 8 percent on land administration (Agrawal, 2006). With no change in the way land records were to be maintained, this must have affected the quality with which this tasks was performed. More importantly, as this shift reduced the emphasis on land records in the curriculum for public servants, many may no longer be familiar with the details of the associated documents, something that would, over time, lead to further decline in land record maintenance.
Klaus deininger and Hari K. nagarajan 257
fees encourage informal transactions. This implies that records are often seriously out of date, raising both transaction cost and the potential for dispute. High stamp duties, a need to comply with complex regulations and the time and money spent in duplicative and inefficient procedures made the cost of registering property in India one of the highest in the world. According to the World Bank’s 2004 “Doing Business” study, India ranked 123 out of 140 countries (World Bank, 2004).24 Overlapping institutional mandates and ill-defined processes, together with appreciating land values, provide ample opportunities for corruption. An independent study highlights that admin-istration is considered the least transparent and the second most corrupt public service in the country, at par with the police and the lower judiciary. Of the households interacting with land records or registration departments, 48 percent had to pay a bribe, with the total amount of bribes paid each year estimated at Rs 3,126 crore (Transparency International India, 2005).
Second, rural areas at the urban fringe have increasingly become subject to urbanization. Although this increased land values, thereby increasing the benefits from fixing boundaries more precisely, in many states urbanization led to the lapse of the survey department’s responsibility for maintaining an accurate spatial record. Responsibility for this was, instead, transferred to municipal corporations which often lacked technical competence and were interested in records for tax purposes. Even where they have adjusted to the new requirements, maps are not part of the ownership record. This is a main reason for high levels of land-related conflict which, in a pilot study was found to affect 28 percent of parcels in peri-urban areas (Agrawal, 2006) and be responsible for some 40 percent of all court cases in state high courts (Debroy, 2000).
Finally, forest, as well as, revenue lands that had previously been waste and thus were never subject to a settlement survey have increasingly been brought under agricultural cultivation. Inability by the relevant institutions to carry out the required actions implies that numerous households in marginal areas remain without rights to the land they may have used for very long periods of time. This reduces their incentives to invest and manage land sustainably and implies that, if land is needed for other purposes such as infrastructure or public investment, they may not be entitled to compensation. The areas involved are large; for example, 74 percent of land in scheduled
24. Given the reduction in stamp duties affected in Maharashtra and the fact that the World Bank’s indicator for the whole country is based only on the major commercial city (in this case Mumbai), this indicator decreased somewhat after 2004.
258 Ind Ia pol Icy forum, 2009–10
areas of Orissa is categorized as (unsurveyed) state land, with 26 percent and 48 percent being revenue and forest land, respectively (Kumar et al., 2006). Given the concentration of poverty in these areas, surveying and settling these areas is of great relevance for poverty reduction. To address these issues, states have started to computerize land records or registration.
In such situations, computerizing records can bring three-fold benefit. First, it has simplified the system and significantly reduced petty corruption that was traditionally involved in getting access to land records. A sur-vey from Karnataka estimates that computerization in this state saved Rs 80 crore of bribes and Rs 6.6 crore in waiting time per year, in addition to non-quantifiable impacts on villagers’ attitude to officials (Lobo and Balakrishnan, 2002). Second, where it is fully operational, computerization improved the quality of government service delivery and is generating surpluses from user fees that can be ploughed back to expand and improve the system (for example, through village-level access). Third, computerization helped to improve credit access in some cases and a number of states demon-strate that computerized records can be used as a springboard to integrate revenue records with the registry and even spatial data. This can be achieved by automating the back-end of the process, by ensuring that surveys be done before mutation, and by providing registry officials with access to the land records database before registering a document.
Success in computerization of land records was based on three principles: First, manual records were abolished so as to ensure that computerized records are routinely used so as to avoid duplication and confusion. Second, all of the computerized system are financially self-sufficient and in fact generate considerable surplus income, thus allowing outsourcing of tasks where public sector capacity is insufficient and reducing political influence. Third, to ensure confidence in the system, transparent processes were adopted, for example, through verification of records involving active participation by land owners, integrity of data was ensured through centralized state data centers with appropriate security features and audit trails, and publicity, that is, making information available on the internet to help de-mystify the process and to cross-check data. “Best practice” in computerizing land registration was similarly based on three factors. First, there was some re-engineering of the underlying business practices, for example, involving standardization and simplification of deeds, the development of a process to automate market valuation, and the setting of clear performance standards. Second, roll-out plans were adopted to proceed from offices with high volume of transaction to those with limited land market activity and uniform
Klaus deininger and Hari K. nagarajan 259
fee schedules were adopted to have areas with high land values implicitly provide a cross-subsidy to more remote ones. Finally, outsourcing to the private sector was key from the very beginning.
The impact of computerization of registration has been tremendous, in a number of respects. First, in a number of states, computerization has led to a significant increase in the number of registered land transfers and increased revenue from duties even though duty rates had been substantially reduced. This suggests that more transparent processes for registration and property valuation increased the usefulness of services to customers and that demand for such services exists. Second, the fact that in some states encumbrance certificates for a significant length of time are available helps to increase tenure security. Being able to obtain these electronically via the internet implies a significant reduction in the transaction costs for sellers and purchasers as well as banks, although evidence regarding its impact on credit market activity is still limited. Finally, computerizing registry data created the preconditions for a functional integration between registration and records that will have to be a key element of any effort to make the land administration system more conclusive, thereby reducing transaction costs and insecurity involved in dealing with land.
From a technical perspective, computerizing land registration is straight-forward and the main source of resistance is likely to be political, often from people in the system whose ability to obtain rents would be negatively affected. Still, a number of policy issues need to be addressed to maximize its impact. First, even though some states have moved to reduce high levels of stamp duty that tended to drive transactions into informality, the taxes levied on property transfers in India, in contrast to land taxes, remain among the highest in the world. Unless they are reduced, even the best technical solutions for improving land records are unlikely to be sustainable. Options to partially replace stamp duty with higher land taxes—levied on market values and ideally shared between local bodies and states—would be more in line with international best practice and need to be explored urgently. Second, it will be important to ensure completeness of registry records and their consistency with the data maintained by the land revenue department. This will require regulatory changes to ensure that mutations, for example, through succession, that did not need to be registered in the past, will be registered automatically and free of charge, something that will be easy once systems are computerized. Third, computerized systems make it easy to increase officials’ accountability and thus increase the value of certificates as a proof of land ownership. Simple ways of doing so are to give them
260 Ind Ia pol Icy forum, 2009–10
access to the information (for example, encumbrance certificates) needed to perform basic checks on transactions that register, to automate mutations, and to adopt uniform parcel identifiers. Some states’ requirement to lodge an approved survey before a transaction can be registered goes further in the same direction.
Table 6 illustrates that, although uneven across states, progress has been considerable. For example, computerized records are now fully or partly operational in Karnataka, Gujrat, Rajasthan, Madhya Pradesh, Maharashtra, Uttar Pradesh, and Tamil Nadu and registration is (almost) fully computer-ized in Andhra Pradesh, Rajasthan, Maharashtra, Karnataka, and Tamil Nadu. To facilitate further change and to provide incentives for states to expand surveying activity, the Indian government has in late 2008 approved the National Land Records Modernization Program (NLRMP), a centrally sponsored scheme with an initial endowment of Rs 2,000 crore, that integrates previous programs and, in particular by conducting pilots in one district per state, aims to eventually facilitate the transition to conclusive title rather than just a deeds system (Government of India, 2008).
Improving Spatial Records
There is little doubt that establishment of a comprehensive, reasonably accurate, and cost-effective spatial framework will be a key element of any strategy to improve India’s land administration system. Without such a system, it will be impossible to identify gaps or overlaps and thus have a system that guarantees tenure security comprehensively and on a broad basis. However, long neglect and gaps in institutional responsibilities imply that quality and reliability of existing spatial data are much inferior to that of textual ones. It is recognized that, instead of conducting revisional surveys every 30 years, as done by the British in colonial times, a self-sustaining system that is updated whenever a transaction occurs will be required. While existing spatial records can be used as a basis in some cases, their generally outdated nature implies that simple computerization with some field check-ing, as was done for textual records, will be insufficient. There is thus an urgent need for viable and replicable models to improve and maintain spatial records. This is difficult due to the specialized nature and high cost of surveying, the presence of strong vested interests pushing for technically sophisticated rather than economically viable options, and the fact that costs increase exponentially with precision. A spatially differentiated approach will be needed that chooses strategies based on maximum use of existing records, heavy use of remote sensing technology with appropriate ground
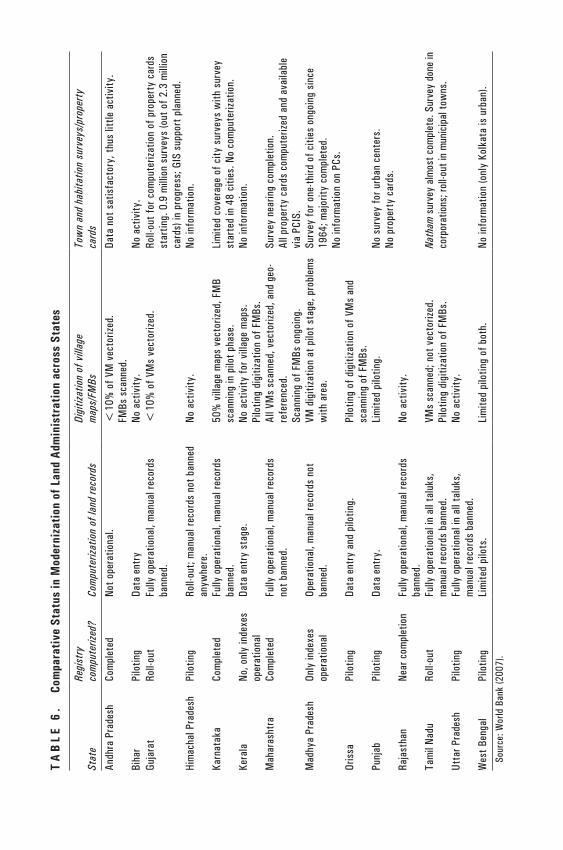
Ta
BL
E 6
. Co
mpa
rati
ve S
tatu
s in
Mod
erni
zati
on o
f Lan
d ad
min
istr
atio
n ac
ross
Sta
tes
Stat
eRe
gist
ry
com
pute
rized
?Co
mpu
teriz
atio
n of
land
reco
rds
Digi
tizat
ion
of v
illag
e
map
s/FM
BsTo
wn
and
habi
tatio
n su
rvey
s/pr
oper
ty
card
s
andh
ra p
rade
shco
mpl
eted
not o
pera
tiona
l.<
10%
of V
m v
ecto
rized
. fm
Bs s
cann
ed.
data
not
sat
isfa
ctor
y, th
us li
ttle
act
ivity
.
Biha
rpi
lotin
g da
ta e
ntry
no
act
ivity
.no
act
ivity
.Gu
jara
tro
ll-ou
t fu
lly o
pera
tiona
l, m
anua
l rec
ords
ba
nned
.<
10%
of V
ms
vect
orize
d.ro
ll-ou
t for
com
pute
rizat
ion
of p
rope
rty
card
s st
artin
g. 0
.9 m
illio
n su
rvey
s (o
ut o
f 2.3
mill
ion
card
s) in
pro
gres
s; G
IS s
uppo
rt p
lann
ed.
Him
acha
l pra
desh
pilo
ting
roll-
out;
man
ual r
ecor
ds n
ot b
anne
d an
ywhe
re.
no a
ctiv
ity.
no in
form
atio
n.
Karn
atak
aco
mpl
eted
fully
ope
ratio
nal,
man
ual r
ecor
ds
bann
ed.
50%
vill
age
map
s ve
ctor
ized,
fm
B sc
anni
ng in
pilo
t pha
se.
lim
ited
cove
rage
of c
ity s
urve
ys w
ith s
urve
y st
arte
d in
48
citie
s. n
o co
mpu
teriz
atio
n.
Kera
lano
, onl
y in
dexe
s op
erat
iona
lda
ta e
ntry
sta
ge.
no a
ctiv
ity fo
r vill
age
map
s.pi
lotin
g di
gitiz
atio
n of
fm
Bs.
no in
form
atio
n.
mah
aras
htra
com
plet
edfu
lly o
pera
tiona
l, m
anua
l rec
ords
no
t ban
ned.
all V
ms
scan
ned,
vec
toriz
ed, a
nd g
eo-
refe
renc
ed.
Scan
ning
of f
mBs
ong
oing
.
Surv
ey n
earin
g co
mpl
etio
n.
all p
rope
rty
card
s co
mpu
teriz
ed a
nd a
vaila
ble
via
pcIS
. m
adhy
a pr
ades
hon
ly in
dexe
s op
erat
iona
lop
erat
iona
l, m
anua
l rec
ords
not
ba
nned
.Vm
dig
itiza
tion
at p
ilot s
tage
, pro
blem
s w
ith a
rea.
Su
rvey
for o
ne-th
ird o
f citi
es o
ngoi
ng s
ince
19
64; m
ajor
ity c
ompl
eted
. no
info
rmat
ion
on p
cs.
oris
sapi
lotin
gda
ta e
ntry
and
pilo
ting.
pi
lotin
g of
dig
itiza
tion
of V
ms
and
scan
ning
of f
mBs
.pu
njab
pilo
ting
data
ent
ry.
lim
ited
pilo
ting.
no s
urve
y fo
r urb
an c
ente
rs.
no p
rope
rty
card
s.
raja
stha
nne
ar c
ompl
etio
nfu
lly o
pera
tiona
l, m
anua
l rec
ords
ba
nned
.no
act
ivity
.
Tam
il na
duro
ll-ou
tfu
lly o
pera
tiona
l in
all t
aluk
s,
man
ual r
ecor
ds b
anne
d.Vm
s sc
anne
d; n
ot v
ecto
rized
. pi
lotin
g di
gitiz
atio
n of
fm
Bs.
Nath
am s
urve
y al
mos
t com
plet
e. S
urve
y do
ne in
co
rpor
atio
ns; r
oll-o
ut in
mun
icip
al to
wns
. ut
tar p
rade
shpi
lotin
gfu
lly o
pera
tiona
l in
all t
aluk
s,
man
ual r
ecor
ds b
anne
d.no
act
ivity
.
Wes
t Ben
gal
pilo
ting
lim
ited
pilo
ts.
lim
ited
pilo
ting
of b
oth.
no
info
rmat
ion
(onl
y Ko
lkat
a is
urb
an).
Sour
ce: W
orld
Ban
k (2
007)
.
262 Ind Ia pol Icy forum, 2009–10
truthing, and an overall cost that is in line with land values and beneficiaries’ ability and willingness to pay. Drawing on India’s capabilities to combine satellite imagery with existing village maps and other readily available spatial products to generate a basic cadastral index map would be a low cost option to provide a comprehensive framework, identify gaps, and on this basis establish criteria for ways to address spatial data problems in a step-wise and affordable manner. This would be particularly important for poverty reduction as recognition of group rights by very poor and marginal groups who were left out of the traditional system is possible at low cost using satellite imagery and could significantly increase incentives for sustainable land management and reduce dangers of land alienation.
Putting in practice a spatial system that responds to these needs will require that (i) public sector activity focus on broad provision of clear public goods, that is, comprehensive coverage with a low precision cadastral index map that can be generated at modest cost by combining satellite imagery with existing village and tax maps, instead of establishing islands of high quality spatial data in an ocean that remains largely uncharted; (ii) pilots focus on developing integrated, scalable, and cost-effective ways to generate spatial data and link them to textual records applicable to archetypical situations (for example, unrecorded subdivisions, complete change in land use patterns, loss of spatial data, or complete lack of survey); (iii) lessons from pilots be translated into regulations and guidelines for private actors; (iv) an effort to expand capacity and increase the role of the private sector (with structures for accountability) in areas where willingness and capacity to pay exist a state monopoly on surveying as is still the case in most Indian states;25 (v) providing a regulatory framework for application of a range of survey methods with defined precision requirements; (vi) strengthening capacity in the private and the public sector; and (vii) revamping survey processes, for example, shifting from paper-based to electronic ones to reduce cost and make survey more affordable.
Is There a Need to Move toward a Title Registration System?
It has long been noted that, partly because they are fiscal in nature and pre-sumptive in character, and partly because of their incompleteness, the value of current land records in India as a proof of ownership, and thus a basis for
25. There is no argument about the government having to verify the authenticity of the work but this does not mean that outsourcing is not possible, as illustrated by Eastern European countries.
Klaus deininger and Hari K. nagarajan 263
transactions or credit, is extremely limited (Wadhwa, 2002).26 To change this, it has often been argued that India needs to make the transition from a system based on deeds to one based on title where the state guarantees property rights. In fact, the states of Andhra Pradesh, Rajasthan, and Delhi are discussing legislative changes that would allow establishment of a title registration system.
To understand the associated issue, it is important to understand differ-ences and common elements between the two. A deeds registration system is a public repository where documents evidencing transactions with land can be lodged, numbered and dated, indexed, and archived. Recording of the document will give public notice of the transaction, serve as evidence for it, and may assign priority to the right claimed in that document with registered deeds normally taking priority over unregistered ones, or any deeds registered subsequently. However, registration of a deed does not imply any inference about the legal validity of the transaction or that the parties were legally entitled to carry out the transaction. As discussed earlier, the registration office will, in principle, register anything and in practice in India, officers often invest more time in ensuring the identity of the parties to the transaction than the physical location and attributes of the land. Under registration of titles, the register itself serves as the primary evidence of ownership. It is commonly identified by three attributes, namely (i) the mirror principle indicating that the situation in the registry is an exact reflection of reality; (ii) the curtain principle, implying that anybody interested in inquiring about the title status of a given property will not have to engage in a lengthy search of documents but can rely on the evidence from the title registry being definitive; and (iii) the assurance principle ac-cording to which the government will indemnify for damages incurred as a consequence of errors in the registry.
Thus, while deeds and title registration systems intend to put rights in land on public record, a deed provides only evidence of an isolated trans-action and says little about the validity of this transaction.27 Simply put,
26. …a deed does not in itself prove title, it is merely a record of an isolated transaction. It shows that a particular transaction took place, but it does not prove that the parties to the transaction were legally entitled to carry out the transaction and therefore it does not prove the validity of the transaction. It is left exclusively to the person entering into a transaction concerning an immovable property to investigate himself about the soundness of the title to that property of the person. (Wadhwa, 2002)
27. To illustrate, if, under title registration, A fraudulently sells a piece of land (which actually belongs to C) to B who purchases in good faith, B becomes the rightful owner and any claims by C are extinguished as soon as the sale is registered. The only recourse open to C
264 Ind Ia pol Icy forum, 2009–10
under a deeds system potential purchasers will need to expend resources to investigate whether the seller’s title is genuine whereas under a title system this is not needed as the validity of such claims has already been checked for them by the registry system. This implies that the entry in the registry is definitive and that the state is willing and able to indemnify any person who suffers material loss, for example, due to disputes that arise out of a duly registered transaction. Of course, either the state or any private insurer will be able to offer such a guarantee only if the risk of disputes surfacing is low. This risk is a function of the completeness of the information in the registry, the ease of searching it; and its reliability. To minimize risks, modern deeds systems have taken measures including (i) compulsory registration; (ii) parcel-based indexing; (iii) computerization and standardization; and (iv) examination of documents at the point of registration to ensure com- pliance with applicable laws and regulations.28
First, compulsory registration may be made a condition of the validity of the deed by providing in the law that unregistered deeds may not be admitted in court as evidence of title. Documents which are not registered can then be safely ignored and searching the deeds register, which can be automated by having encumbrance certificates computerized, will enable anybody dealing in land to make sure that no material factor has been overlooked, thereby affording significant protection against concealed conveyancing. Second, while basic deeds registration systems are normally filed and indexed under the names of parties, rather than a unique parcel identifier, and do
would be to demand compensation, but not restitution of the property, from the state which in turn has the option to sue A. The need to ensure that the responsibility taken up by the state can be met is one of the reasons why title registration systems are normally associated with a guarantee fund to facilitate payment of such compensation. By contrast, under a deeds system, it is B’s responsibility to investigate the veracity of A’s ownership claims and C will be able to demand restitution of the property from B, implying that B will incur the loss. Put simply, under a deeds system, the cost of acquiring information about the ownership status of a particular piece of land have to be incurred by the purchaser (something that may lead to a less than optimum amount of land market activity) while under a title system the state guarantees this information. However, note that, despite a common misconception to the contrary, even a Torrens system of title registration does not guarantees boundaries or areas of parcels. In fact no title registration legislation expressly supports that notion, and no case law supports it. Many more modern title registration statutes expressly provide that indefeasiblity does not extend to the lengths, bearing, and areas of registered parcels.
28. A number of countries, including the Netherlands, South Africa, and the USA use these techniques to run highly effective deeds systems that offer levels of protection that are equivalent, or even higher, than those found in title systems where, due to low quality of the underlying information, a government guarantee is not possible.

Klaus deininger and Hari K. nagarajan 265
not include or require cadastral maps, these elements are required in more advanced systems. This then allows computerization of title abstracts as well as the links to cadastral maps, parcel based indices, and examination of documents described earlier can greatly improve the quality of information provided by deeds registries and reduce the cost of searching them. Finally, the risks that a deed is not properly drawn can be minimized by requiring officials to check compliance with essential rules and making the registry liable for any damages incurred as a consequence of negligence or even insurance. Insurance against defects in title for a property being transferred is a common arrangement in most states of the USA where title insurance companies have developed private deeds registers and will insure purchasers against losses as a result of defective title.
If, as a consequence of these steps having taken, regular operation of the registry is satisfactory, options for conversion from deeds to title registration may be considered. The main types are a conversion that is entirely voluntary, a compulsory transaction-based conversion, or a systematic process whereby specific areas are declared “conversion” areas to allow systematic deter-mination of all immovable property rights and following issuance of title documents (possibly qualified with a provision to mature into full titles if no counter-claims surface within a specified period of time). Under voluntary conversion, owners of land may apply to convert their land from deeds to title registration but experience in Australia has shown that this process alone will not achieve full conversion.29 Compulsory transaction-based conversion offers the advantage of converting land whenever it is subject of a transaction, for example, by requiring that the party lodging the deed for registration is required to produce proof of a good title which will then be examined by the registry. This approach, which was taken in England and Scotland is cheap but slow and will also not achieve full conversion, but has the advantage that valuable land will enter into the title registration system first. Systematic conversion, though much more expensive, may thus be necessary if maintaining a dual system for an extended period of time is considered undesirable and has been adopted even in England and Scotland to complete the process. Legislation to establish the legal basis
29. In the States of Victoria and New South Wales, Australia voluntary conversion was the only conversion process for around 100 years, with the result that there were still large amounts of unregistered land. There was insufficient incentive for land owners to go to the cost and trouble of applying for title registration unless a large-scale development was planned. It was finally concluded that there needed to be some element of compulsion or automatic conversion for the change to take place within a finite time.
266 Ind Ia pol Icy forum, 2009–10
for land titles as currently under discussion in Andhra Pradesh and Delhi relies on systematic conversion while the recently adopted Land Title Act in Rajasthan uses voluntary conversion by peri-urban land owners. Success of all of these pieces of legislation will depend critically on the ability to establish and maintain the needed institutional infrastructure which differs significantly from what is in place currently. A further success factor is in the type of rights that can be registered (and the cost of doing so) as well as the mechanisms used to adjudicate property rights in the process of a systematic field survey. Unless they comprehensively account for a wide range of potential evidence and reach conclusive and accepted conclusions regarding ownership rights for the vast majority of parcels so as to quickly establish an information base that is reliable, complete, and of high quality and for which a state guarantee can be offered, the credibility of the process as well as the end-product may suffer and could be undermined.
Conclusion and Policy Implications
Although land administration and policy in India are complex subjects with considerable variation across states, our analysis allows us to derive a number of key messages for policy and specific program. First, there is little justification for maintaining restrictions on land leasing that have been inherited from earlier land reform efforts. To the contrary, such restrictions undermine productivity and equity by preventing land access by more productive producers, as well as, development of the non-farm economy. Second, even though there is clear evidence of land sales being affected by credit market imperfections that make it difficult for households to fully insure themselves, land sales in the Indian regions covered by our survey, and within the current policy environment, are shown to contribute to greater productivity while at the same time equalizing factor ratios. Finally, government efforts to improve effectiveness of land administration through computerization of land records and registration provide a basis for further advances that can help to either significantly improve tenure security within an improved system of deeds registration or to make the transition toward a title registration system where reliability of information is guaranteed by the state or private insurers. Further progress along this path will depend on the ability to address not only technical issues but also develop a field-based adjudication process that is comprehensive and robust enough and the scope for establishing an efficient and streamlined institutional struc-ture to ensure reliability of information and reduce the transaction cost of registering land transfers.
267
Comments and Discussion
Pranab Bardhan: I largely agree with some of the main conclusions of the paper, particularly those pointing to unintended consequences of much of land legislation, the benefits of land transfer (either through tenancy or sales) from the landed to the land-poor but more productive producers, and the value of computerized land records and registration.
Let me here focus only on cases where I have some differences or my emphasis may be somewhat different.
l That prohibition of land lease is inefficient and inequitable has been recognized in the literature for quite some time. But when the authors argue against land rental restrictions, which presumably include restrictions that ensure security of tenure (at a reasonable rent) for pre-existing tenants (hitherto working on an oral lease), they should be aware of a trade-off in such cases: on the one hand, such restrictions may discourage landlords from leasing-out (which the authors focus on); on the other hand, security of tenure and rent ceilings may encourage long-term investments on land by the tenants. There is a substantial theoretical literature on the latter issue, but the authors should at least refer to the empirical literature—for recent examples, see Banerjee et al. (2002) and Bardhan and Mookherjee (2008), where it is shown that such security of tenure enhancing land reform has significantly improved farm productivity in West Bengal.
l A proxy used for rental restrictions is “no. of tenancy laws.” I think counting the no. of laws as a measure of land reform (as has been done in part of the empirical literature) is problematic.
l Transaction costs in land lease:
I do not quite understand why transaction costs are necessarily higher for scheduled and backward castes (most cultivators today belong to these castes—their social network may even yield some advantages in transactions among cultivators), except may be in terms of legal processes.
In the theoretical literature on tenancy, transaction costs include costs of monitoring (moral hazard in unobservable use of effort
268 Ind Ia pol Icy forum, 2009–10
and other variable inputs). The authors’ theoretical set-up does not seem to include them. If it did then in the context of “limited liability” it is possible to generate the phenomenon of “tenancy ladders” (landlords prefer leasing out to wealthier tenants)—for a demonstration of this, see Bardhan and Udry (1999), Chapter 6. But in the empirical results of this paper assets seem to be insig-nificant in land-lease decisions, which is surprising. The land-poor may “demand” more land-lease, but the landlords may prefer “supplying” leases to better-off tenants—the resulting equilibrium is not captured in the authors’ estimating equations.
l In the rental equation one should include the possession of bullocks as an important determinant of land rental. A landless person, not owning a bullock, would not try to lease in land, as the bullock rental market is often weak (largely on account of moral hazard reasons).
l In the section “Estimation Strategy”, mean village income is taken to represent non-farm wage labor opportunities, but the latter may also depend on mean income in other villages or towns nearby.
l In different parts of India one hears about increasing incidence of “reverse tenancy” (small farmers leasing out to the rich), as in recent years cultivation has become more costly and more dependent on market-purchased inputs. Do the authors’ data for 1999 counter this?
l National Council of Applied Economic Research (NCAER) data seem to suggest a large increase in tenancy over time, which contradicts the finding of tenancy decline from NSS data (according to which percentage of operational land area leased-in was 10.6 percent in 1970–71, 7.2 percent in 1981–82, and 6.5 percent in 2002–03). One would like to know why NCAER data show such a diverging trend compared to NSS data (the latter based on a sample of more than 52 thousand households in the latest round, many times the sample size in NCAER data).
l In the empirical equation for determining land sales/purchase, it is important to correct for land quality, as the data are for households across the whole of India (this has been an important issue in the old literature on agricultural production functions).
l In the same equation the landless include professionals (like school teachers or traders) as well as agricultural laborers. For the purpose of interpretation it may be useful to separate out the occupational categories.

Klaus deininger and Hari K. nagarajan 269
Surjit S. Bhalla: I also have a story about being informed late but I shall just end with the fact that I do not have a PowerPoint presentation. First, I shall give some general comments and some comments on data, and then some specifics on the paper.
First and foremost, I think the REDS data is an extremely rich source of data for answering several questions, including the ones that Deininger and Nagarajan have done. One suggestion here is that I think it is time now that the NSS and National Council of Applied Economic Research (NCAER) talked to each other when they write the papers and, therefore, a paper which has NCAER data should also have NSS data, and I shall tell you how it will actually enrich your paper quite considerably. And I think the opposite with the NSS people who work only on NSS, should be able to refer to and use the NCAER data. This obviously involves that the NCAER data be now publicly available for sale, etc., just like the NSS’s, and I hope that this is the beginning of that or that this could lead to that.
As far as the paper goes, the topic investigated, the evidence provided, policy conclusions, I think the work is extremely server and I have very little to question on it. There are a couple of points that I have. One is on the measurement of ability and the second, on the differential trends with NCAER, with NSS—Pranab has already mentioned to that. So, the comments that I have will pertain to additions to the paper that I think will make it “better.” They are not really additions. One thing I should mention that these are actually two papers. Therefore, you have a lot of material or you have done two papers. “Land Administration” part is a paper in itself. So, when I say that these are additions, it may be a bit of cut-and-paste and a bit of additions.
Coming to the data, the topic is both controversial and interesting and I think one of the first questions one wants to know is what is the land dis-tribution in India? Now, the NSS data has land distribution data, unit level data going back to 1983, just to try and show what is the distribution of land. You have one reference in the paper where it says it is highly unequal and this is where you can show unequal with respect to whom. The related point on that is that you have got very interesting set of results and statistics in other countries and I shall suggest that you have it in a table where it can be much better, much more prominently displayed so that the reader can actually see where other countries have faced similar problems and how they have tackled. So, you do mention it, do write it, you have it in footnotes, and I shall give it a lot more prominence.
270 Ind Ia pol Icy forum, 2009–10
On land reform, there is one question that I think Pranab perhaps indirectly eluded to but springs up to any reader. You have data from 1969–1970–1971, then 1982 and then 1999, while the one measure land reform that occurred in India was in West Bengal and that happened, I think, in the late 1970s or early 1980s. What are the results of that? I know you will face small sample problems, but this is where with a bit of marrying of the NSS data and your own data, try and relate some of the questions on productivity, etc., with this one major land reform that occurred and to try and answer the question, did it work? This is before we get to tenancy and other considerations which I shall come to. Before we get to that stage, we know that land reform not only works, but works spectacularly. We have the example of China. Well, let us see the good old-fashioned example from India, particularly from West Bengal to see what has happened.
Now, to some more specific comments on your paper. You know you have a throwaway line which I would give a lot of prominence. The editors may not have that line survive at the time of printing but the throwaway line refers to ideological prejudice. We, at IPF and other places, do not believe that ideology has anything to do with either research or economics or policy, but I would really give it a lot of attention. You do have in the case of land sales but you have much less in the case of tenancy. As to why are these policies there, why were they initially there, who are they supposed to benefit and who they are actually benefiting. So, it is just a tabular form. Now, how does tenancy hurt? I am taking a naïve and I do not think it hurts. Clearly, there must be evidence that it has hurt people and hurt people more than it has helped them, etc. etc., so that this was a good policy to initiate, let alone to follow now in 2007. So, I think in a tabular form upfront, these were the reasons. Some history as to whether these reasons were valid when they were first initiated, in other words by valid meaning non-ideological, and whether they are still valid today, and I shall give some examples of some of the things.
Let me start off with the SEZs, which Pranab also alluded to, and whether the government should be involved in the sale of land. There are theoretical arguments as to why something might happen but you have actually got empirical data. So, first, rather than go into theory, we can all construct theoretical models which will show whichever result one wants. Really, the ultimate test is, does it hold in practice? Therefore, one example of the SEZs is that have the poor benefited and/or whether the state should intervene? There is an interesting example that all the places where there has been trouble on the SEZs, have been places where the government is directly involved in purchasing the land and then selling to SEZ developer.

Klaus deininger and Hari K. nagarajan 271
All the states like Haryana where the state is not being involved, where the buyer is directly in contact with the seller, as you are alluding to, there is no problem. So, I would bring that discussion in because it is very pertinent to your conclusion. Now, what is the reason indeed in the case of Orissa where there is a large multinational developer called PASCO and the state wants to come in and say, no, we shall buy it and we shall sell it to PASCO, obviously with a large differential and PASCO saying, listen, we want to be transparent; we shall go out to the marketplace and we shall pay and let us see who the seller prefers? So, I think this is very relevant to your conclusions.Second, it is also the ideological prejudice, and this pertains to some of the discussion that we have had in the last couple of days, on education. The Planning Commission—please correct me if I am wrong—in its draft for the 11th Five-Year Plan had a whole section there as to how education vouchers should be introduced as a way for both equity and efficiency and the final draft of the plan document does not contain any reference to vouchers and indeed there is some flak of a better word, camouflage of the whole original idea. This has to do with ideological prejudice, this has to do with perhaps some facts that one covered as to how can a student of poor family lose when he is given the option of whatever school he has to go to and given the money to attend the school. I am yet to understand. One argument is, well, no school will be there or no schools are there. If no schools are there, it does not affect either way and the poor person is better off because he is getting an equivalent amount of money. So, how somebody loses out by having the option of both going to a government school and going to a private school, I would like to know, and I think this underlines some of the discussion particularly about land rentals as to what is the logic of restricting land rentals and all kinds of things. You might want to refer to the urban land rental laws which made investment in housing completely impossible. Not only tenants had rights but their grand children had rights and their dogs and cats had rights to the house. So, there was no investment in housing at all until the reform came in that you could rent only for eleven months at a time and, therefore, not be subject to any tenancy laws. And lo and behold! There has been an absolute boom in land rentals and efficiency in the entire land market in the urban sector.
One other aspect is, now you have some calculations of how much productivity will go up. Klaus, you have mentioned a little bit in your presentation. I am just trying to reinforce that. There is a big debate, as you know, in India, which was mentioned by the Finance Ministry yesterday as to whether agriculture can grow at four percent and this needed to grow. You have calculations as to how much terminal productivity will
272 Ind Ia pol Icy forum, 2009–10
increase, distribute that over a few years if these policies are enacted and just give illustrative numbers as to what will happen to Indian agricultural growth, and in a comparative sense what will happen or what has happened with China.
Another aspect is, you mentioned as to how about 18 percent of the people were involved in land sales and SCs/STs, you state, was a very small fraction, somewhere around 10 or 13 percent. I was quite surprised, given the common presumption which I also had that there was a huge amount of discrimination and SCs/STs just could not participate in land sales to find this large number.
One other aspect that I think needs a bit more discussion is—it comes out in your appendix but even there it is indirect, but I think there are other papers from the REDS that demonstrate this; you can use also the NSS in an indirect fashion to come up to the same—as to what is happening to non-farm income in the rural areas?
Last two points. One is on the results. They are very very suggestive of everybody moving up the ladder in terms of who is now participating in the land rental market, who is benefiting, etc. If that is indeed the case, just to go further into it, just to show that listen, you could do it by dossals, etc., a sort of a transition matrix as to who is benefiting and who is losing, and you can do it in relative and absolute terms.
One other statistics which you may want to bear in mind and which should appear somewhere is that since 1993, there has been practically zero growth in the absolute number of cultivators and agricultural workers in India. So, clearly refraction has come down considerably but there is no growth. It may be 0.1 percent per annum. I think this needs to be set in into the entire debate about what is happening in agriculture on the equity side, whether the poor are becoming worse off, etc. etc. You are finding that the same amount of output, or 5 or 10 percent higher output is now being produced by the same number of people, and this is related to whether you are moving up the ladder or not.
To conclude, the argument which I would like is that the arguments for the policies India has enacted in land as well as in tenancy should clearly state what the original rationales was, whether there was justification for the original rationale from the data in the 1950s and 1960s when these things were enacted, and today what the situation is, how it has changed, what your results suggest, and whether there is any rationale for these policies today.
Klaus deininger and Hari K. nagarajan 273
General Discussion
T. N. Srinivasan raised a number of questions. First, he questioned the authors’ approach of treating all tenancy as if it was a fixed rent cash tenancy. In reality, there are diverse tenancy markets including sharecropping with various shares to input sharing with output sharing. Second, variation in land quality has important implications for the analysis of issues such as inequality. The proportion of poor-quality land is higher on large land holdings. This means measured inequality will be higher than if we adjust for quality. Third, the analytic separation of land rental market from land sales market done by the authors poses the problem that the two markets are connected. The implicit value of a piece of land an individual wants to sell is closely related to the net present value of rent he or she can earn through renting it out. Fourth, in practice, land rental market is much thicker than land sales market. It is unlikely that land sales market is competitive to the same degree as land rental market. Finally, there is the issue of titles versus deed that did not get discussed. Since deed—and not title—is all the seller of land has, treatment of land sale as if it was like any other asset with properly defined ownership is misleading.
Devesh Kapur questioned the proposition by Pranab Bardhan that the government had to be necessarily involved in land acquisition to protect the rights of the farmer. He cited an example from Jharkhand whereby logging in forests was forbidden on the assumption that this would be to the benefit of contractors and detriment of tribal people. In reality, large-scale illegal logging took place with state functionaries pocketing a good part of the profit. But then logging was made legal and it turned out that logging rate went down and tribal people made good money as well. Kapur asked how much more evidence was needed before we would be convinced that the state intervention at every stage is not the solution for the protection of the poor and vulnerable. It is one thing to argue that people should have the option of either selling through the state if they so desire but quite another to insist on the monopoly by the state when we have overwhelming evidence that in reality implementation by the state invariably enriches functionaries of the state.
Anjini Kochar raised a number of questions with respect to estimation method and variables used in regressions. First, she hypothesized that what the authors called ability was actually land quality. The residual in the production function is likely to represent land quality. Second, the authors appear to be measuring the impact of differences in legislation as the

274 Ind Ia pol Icy forum, 2009–10
state-specific effect. If so, this is likely to contain not just legislative but all state-specific effects. Finally, while the paper makes much of credit constraints, in the empirical work, credit constraints are not taken into account.
Kirit Parikh referred to a 2002 article on land title by Wadhwa and stated that all land titles in India are presumptive. Wadhwa had looked at the issue in the 1980s and suggested a path to issuing titles but government after government has refused to follow up. This statement led Rajnish Mehra to ask how land ownership was enforced in the absence of any guarantee by the government. Arvind Panagariya responded that the enforcement was through the courts. An individual has the ownership right until someone challenges that right in a court of law. And when that happens, the court decides who the true owner is.
Parmod Kumar from NCAER commented that he had studied data from northern and eastern India and found that in prosperous states, small farmers were leasing their land to large farmers (the phenomenon of “reverse tenancy”) while in poorer states the opposite was the dominant practice. Since the data set Deininger and Nagarajan use has data for two separate years that are very far apart, they may find a switch from conventional tenancy (by large farmers to small farmers and the landless) to reverse tenancy. A second evolving phenomenon is that over time, agricultural development has led to the replacement of share cropping by fixed-rent tenancy. This phenomenon may also be captured in the data the authors have employed.
Hari Nagarajan responded to several of the questions raised. He questioned Bardhan on the importance of land tenure security on the ground that all available evidence has been drawn from West Bengal and the provision of tenure security took place under peculiar political atmosphere that is non-comparable across rest of the country. Regarding legislative differences across states, the variable used is the number of legislations in the state as the proxy for seriousness of land reform. Addressing one of the questions raised by Srinivasan, Nagarajan said there was no obvious way to treat sales and rental markets for land as interconnected markets. Addressing some other questions, he noted that reverse tenancy was marginal in their data; the paper cannot do very much about land quality because data on it are not available; and, likewise, the paper cannot deal with the issue of how land should be acquired.
Klaus Deininger added to the responses provided by Nagarajan. He noted that their regressions control for land value, which must partially capture land quality. He said the regressions include regional dummies, which means the measure of policy restrictions is at the state rather than village or household level. On land acquisition, Deininger expressed fear that India may be making
Klaus deininger and Hari K. nagarajan 275
a mistake of adopting the Chinese model whereby the government acquires land and then passes it on to private entrepreneurs. Establishing government monopoly over land acquisition is something India might want to avoid. Finally, on land title issue, Deininger said that the revenue record in rural areas was essentially equivalent to title even if it is not called that. Banks do accept registration records as collateral for short-term borrowing though not for long-term borrowing. Computerization of records can help further since the government is not just recording current occupancy but also all encumbrances levied in the preceding 20 years. This will further pave the way for the banks to accept land as collateral.
Pranab Bardhan repeated his belief in the importance of security of tenure citing various works. He agreed that all this work related to the experi-ence in West Bengal but added that international evidence pointed in the same direction. Bardhan also reiterated his conviction that the government needed to be an active participant in land acquisition though this conviction did not derive from a faith in the efficacy of bureaucratic functionaries. If bureaucratic functionaries have been responsible for the horrors described by Devesh Kapur, leaving matters to the market have also led to horrors. Bardhan concluded by noting that in his view, bureaucratic functionaries and private market were not the only two alternatives. Local panchayat governments and independent commissions consisting of NGOs, agents of real estate developer, and local groups could also play a role.
276 Ind Ia pol Icy forum, 2009–10
References
Agrawal, V. K. 2006. “Andhra Pradesh Pilot Project on Integrated Land Information System.” Paper presented at MoRD-WB Workshop on Land Policies and Administration in India, New Delhi, January 5 and 6, 2006.
Alm, J., P. Annez, and A. Modi. 2004. “Stamp Duty in Indian States: A Case for Reform.” World Bank Policy Research Paper 3413. Washington, D.C.: World Bank.
Appu, P. S. 1996. Land Reforms in India: A Survey of Policy, Legislation and Implementation. New Delhi: Vikas Publishing House.
Arnott, R. 2003. “Tenancy Rent Control.” Swedish Economic Policy Review 10 (1): 89–121.
Baland, J.-M., F. Gaspart, J. P. Platteau, and F. Place. 2007. “The Distributive Impact of Land Markets in Uganda.” Economic Development and Cultural Change 55 (2): 283–311.
Banerjee, A. and L. Iyer. 2005. “History, Institutions, and Economic Performance: The Legacy of Colonial Land Tenure Systems in India.” American Economic Review 95 (4): 1190–213.
Banerjee, A., P. Gertler, and M. Ghatak. 2002. “Empowerment and Efficiency: Tenancy Reform in West Bengal.” Journal of Political Economy 110 (2): 239–80.
Bardhan, P. and C. Udry. 1999. Development Microeconomics. Oxford: Oxford University Press.
Bardhan, P. and D. Mookherjee. 2006. “Land Reform, Decentralized Governance, and Rural Development in West Bengal.” Paper prepared for the Stanford Center for International Development Conference on Challenges of Economic Policy Reform in Asia, Stanford, CA, May 31–June 3, 2006.
———. 2008. “Productivity Effects of Land Reform: A Study of Disaggregated Farm Data in West Bengal, India.” Available online at http://emlab.berkeley.edu/users/webfac/bardhan/papers/wbfarmprodbraejsubm.pdf (accessed on May 17, 2010).
Basu, K. and P. M. Emerson. 2000. “The Economics of Tenancy Rent Control.” Economic Journal 110 (466): 939–62.
Besley, T. 1995. “Property Rights and Investment Incentives: Theory and Evidence from Ghana.” Journal of Political Economy 103 (5): 903–37.
Binswanger, H. P., K. Deininger, and G. Feder. 1995. “Power, Distortions, Revolt and Reform in Agricultural Land Relations.” In Handbook of Development Economics, Vol. 3B, by J. Behrman and T.N. Srinivasan, pp. 2659–772. Amsterdam: North-Holland.
Cain, M. 1981. “Risk and Insurance: Perspectives on Fertility and Agrarian Change in India and Bangladesh.” Population and Development Review 7 (3): 435–74.
Carter, M. and R. Salgado. 2001. “Land Market Liberalization and the Agrarian Question in Latin America.” In Land Access, Rural Poverty and Public Action, edited by A. de Janvry, J. P. Platteau, and E. Sadoulet. Cambridge: Oxford University Press.
Klaus deininger and Hari K. nagarajan 277
Coelli, T. J. 1995. “Recent Developments in Frontier Modelling and Efficiency Measurement.” Australian Journal of Agricultural Economics 39 (3): 219–45.
De Meza, D. and J. Gould. 1992. “The Social Efficiency of Private Decisions to Enforce Property Rights.” Journal of Political Economy 100 (3): 561–80.
de Soto, H. 2000. The Mystery of Capital: Why Capitalism Triumphs in the West and Fails Everywhere Else. New York: Basic Books.
Debroy, B. 2000. “Some Issues in Law Reform in India.” In Governance, Decentralization and Reform in China, India and Russia, edited by J. J. Dethier. Kluwer: Dordrecht.
Deininger, K. 2003. Land Policies for Growth and Poverty Reduction. World Bank Policy Research Report series. World Bank: Washington, D.C.; Oxford and New York: Oxford University Press.
Deininger, K. and R. Castagnini. 2006. “Incidence and Impact of Land Conflict in Uganda.” Journal of Economic Behavior & Organization 60 (3): 321–45.
Deininger, K. and S. Jin. 2005. “The Potential of Land Markets in the Process of Economic Development: Evidence from China.” Journal of Development Economics 78 (1): 241–70.
———. 2007. “Land Rental Markets in the Process of Rural Structural Transformation: Productivity and Equity Impacts in China.” Policy Research Working Paper 4454. The World Bank: Washington.
———. 2008. “Land Sales and Rental Markets in Transition: Evidence from Rural Vietnam.” Oxford Bulletin of Economics and Statistics 70 (1): 67–101.
Deininger, K., S. Jin, and H. K. Nagarajan. 2008. “Efficiency and Equity Impacts of Rural Land Market Restrictions: Evidence from India.” European Economic Review 52 (5): 892–918.
———. 2009. “Determinants and Consequences of Land Sales Market Participation: Panel Evidence from India.” World Development 37 (2): 410–21.
Dreze, J., P. Lanjouw, and N. Sharma. 1997. “Palanpur 1957–1993: Economic Development and Social Change.” CSD Paper Series V. Mussoorie: Lal Bahadur Shastri National Academy of Administration.
Feder, G. and D. Feeny. 1991. “Land Tenure and Property Rights: Theory and Implications for Development Policy.” World Bank Economic Review 5 (1): 135–53.
Foster, A. D. and M. R. Rosenzweig. 1996. Comparative Advantage, Information and the Allocation of Workers to Tasks: Evidence from an Agricultural Labor Market. Philadelphia, PA: University of Pennsylvania.
———. 2004. “Agricultural Productivity Growth, Rural Economic Diversity, and Economic Reforms: India, 1970–2000.” Economic Development and Cultural Change 52 (3): 509–42.
Frisvold, G. B. 1994. “Does Supervision Matter? Some Hypothesis Tests using Indian Farm-Level Data.” Journal of Development Economics 43 (2): 217–38.
Glaeser, E. L. 2002. “Does Rent Control Reduce Segregation?” HIER Discussion Paper 1985, Harvard University, Cambridge, MA.
278 Ind Ia pol Icy forum, 2009–10
Government of India. 2008. 11th 5-Year Plan Volume III: Agriculture, Rural Development, Industry, Services and Physical Infrastructure. New Delhi: Planning Commission, Yojana Bhavan.
Gyourko, J. and P. Linneman. 1990. “Rent Controls and Rental Housing Quality: A Note on the Effects of New York City’s Old Controls.” Journal of Urban Economics 27 (3): 398–409.
Jeon, Y. D. and Y. Y. Kim. 2000. “Land Reform, Income Redistribution, and Agricultural Production in Korea.” Economic Development and Cultural Change 48 (2): 253–68.
Joireman, S. F. 2008. “The Mystery of Capital Formation in Sub-Saharan Africa: Women, Property Rights and Customary Law.” World Development 36 (7): 1233–46.
Kaushik, A. 2005. Nature of Land Market Interventions in India. Noida: Institute for Sustainable Development.
Kranton, R. E. and A. V. Swamy. 1999. “The Hazards of Piecemeal Reform: British Civil Courts and the Credit Market in Colonial India.” Journal of Development Economics 58 (1): 1–24.
Kumar, K., P. R. Choudhury, S. Sarangi, P. Mishra, and S. Behera. 2006. “Contested Landscapes, Dispossessed People: Land, Forests, and Tribals in Orissa.” Paper presented at the MoRD/World Bank workshop on “Land Policies for Accelerated Growth and Poverty Reduction in India.” New Delhi, January 5 and 6, 2006.
Lanjouw, P. and N. Stern. 1998. Economic Development in Palanpur over Five Decades. Oxford and New York: Oxford University Press, Clarendon Press.
Lobo, A. and S. Balakrishnan. 2002. “Report Card on Service of Bhoomi Kiosks: An Assessment of Benefits by Users of the Computerized Land Records System in Karnataka.” Working Paper. Bangalore: Public Affairs Centre.
Lueck, D. and T. Miceli. 2006. “Property Law.” Arizona Legal Studies, Discussion Paper 06–19. Tuscon, AZ: Universrity of Arizona.
Malik, A. and R. M. Schwab. 1991. “Optimal Investments to Establish Property Rights in Land.” Journal of Urban Economics 29 (295): 309.
Mani, G. and V. P. Gandhi. 1994. “Are Land Markets Worsening the Land Distribution in Progressive Areas? A Study of Meerut District in Western Uttar Pradesh.” Indian Journal of Agricultural Economics 49 (3): 330–38.
Moog, R. S. 1997. Whose Interests are Supreme? Organizational Politics in the Civil Courts in India. Ann Arbor, Michigan: Association for Asian Studies.
Munch, J. R. and M. Svarer. 2002. “Rent Control and Tenancy Duration.” Journal of Urban Economics 52 (3): 542–60.
Mundlak, Y. 1961. “Production Functions Free of Management Bias.” Journal of Farm Economics 43 (3): 414–35.
Panagariya, A. 2008. India: The Emerging Giant. New York: Oxford University Press.
Quisumbing, A. R. and J. A. Maluccio. 2003. “Resources at Marriage and Intrahousehold Allocation: Evidence from Bangladesh, Ethiopia, Indonesia, and South Africa.” Oxford Bulletin of Economics and Statistics 65 (3): 283–327.
Klaus deininger and Hari K. nagarajan 279
Rawal, V. 2001. “Agrarian Reform and Land Markets: A Study of Land Transactions in Two Villages of West Bengal, 1977–1995.” Economic Development and Cultural Change 49 (3): 611–29.
Rosenzweig, M. R. and H. P. Binswanger. 1993. “Wealth, Weather Risk and the Composition and Profitability of Agricultural Investments.” Economic Journal 103 (416): 56–78.
Sarap, K. 1995. “Land Sale Transactions in an Indian Village: Theories and Evidence.” Indian Economic Review 30 (2): 223–40.
Shavell, S. 2003. “Economic Analysis of Property Law.” National Bureau of Economic Research, Inc, NBER Working Papers: 9695.
Stiglitz, J. E. and A. Weiss. 1981. “Credit Rationing in Markets with Imperfect Information.” American Economic Review 71 (3): 393–410.
Thorat, S., P. Hazell, and S. Fan. 2008. Land Holding, Agricultural Growth and Rural Poverty in India. Washington, D.C.: International Food Policy Research Institute.
Transparency International India. 2005. India Corruption Study 2005. New Delhi: Transparency International.
Udry, C. 1996. “Gender, Agricultural Production, and the Theory of the Household.” Journal of Political Economy 104 (5): 1010–46.
Wadhwa, D. 1989. “Guaranteeing Title to Land—A Preliminary Study.” Economic and Political Weekly 24 (4l): 2323–34.
Wadhwa, D. C. 2002. “Guaranteeing Title to Land: The Only Sensible Solution.” Economics and Political Weekly 23 (50): 30–65.
World Bank. 2004. Doing Business in 2004: Understanding Regulation. Washington, D.C.: World Bank, International Finance Corporation, and Oxford University Press.
———. 2007. India: Land Policies for Growth and Poverty Reduction. New Delhi: World Bank Agriculture and Rural Development Sector Unit South Asia Region and Oxford University Press.
Zimmerman, F. J. and M. R. Carter. 1999. “A Dynamic Option Value for Institutional Change: Marketable Property Rights in the Sahel.” American Journal of Agricultural Economics 81 (2): 467–78.
———. 2003. “Asset Smoothing, Consumption Smoothing and the Reproduction of Inequality under Risk and Subsistence Constraints.” Journal of Development Economics 71 (2): 233–60.