land reform and agricultural productivity in...
TRANSCRIPT

1
Land Reform and Agricultural Productivity in India
Economics Honors Seminar
Final draft
Amy Basu
Faculty Sponsor: Jay Mandle
Abstract: This thesis aims to review and contribute to the literature on land reform
and economic development. It does so by evaluating the impact of land reforms in
India on agricultural modernization in twelve states over the years 1961-1987. The
main findings are although there is limited evidence of the successful
implementation of land reforms, adoption of tenancy reforms seems to have a
significant positive association with some measures of modernization, and
fragmentation arising from land ceiling laws is negatively correlated to
modernization.
Acknowledgements: I would like to thank Professor Jay Mandle, Professor Carolina
Castilla, Professor Takao Kato and Professor Dean Scrimgeour for their advice and
guidance in completing this work.
2
1. Introduction
Land reform in its broadest terms usually refers to redistribution of land
from the rich to the poor. It may include regulation of ownership, operation, leasing,
sales, and inheritance of land. There are various economic, egalitarian, and political
motives often used to justify the need for redistributive land reforms1. Its main
economic rationale lies in a presumed inverse-farm productivity relationship. It is
motivated by the assumption that, for given technology levels, small farms are more
efficient than large farms due mainly to fewer problems of supervision.2 Moreover,
since the utility gains realized by the poor are larger than the corresponding losses
by the rich, redistributive land reforms can lead to distributional welfare gains.
Equity considerations can also create the need for land reform, especially in
countries where a significant proportion of the population relies on agriculture for
its subsistence. In countries with a history of social injustice or exclusion from land
ownership, political motives may be used to justify redistributive land reforms.
While there is widespread support for reforming agricultural property
rights3, there have been few attempts to evaluate the consequences on agricultural
modernization. The explanation for this gap in the literature may be the fact that
there are few examples of large-scale changes in property rights that were not
accompanied by major social unrest, which would entail consequences affected by
factors outside the analysis. Moreover, analyzing the impact on efficiency is difficult
because of data limitations and the fact that the structure of property rights is itself
endogenous i.e. factors that affect the success of land reform are also likely to affect
the variable of interest.
This paper attempts an analysis of the effect of land reform legislation on
agricultural modernization in India. Agricultural technology affects farmers' income
through its effect on factor demands and factor prices, which, in turn, induce
changes in the allocation of farmers' own resources to different uses. The
investigation involves an analysis of land reform legislation at the state level and
the impact they have on various measures of agricultural modernization in thirteen
states. The time period involved in the analysis is 1961-1987, a period that captures
the impact of the Green Revolution in India, a revolution that involved the adoption
1Maitreesh Ghatak and Sanchari Roy. "Land reform and agricultural productivity in India:
a review of the evidence." Oxford Review of Economic Policy 23, no. 2 (2007): 251-269. 2 Klaus Deininger and Paul Mpuga. "Land Markets in Uganda: Incidence, Impact, and
Evolution over Time." World Bank Policy Research Working Paper, Washington DC (2002). 3 Klaus Deininger and Hans P. Binswanger. "Rent seeking and the development of large-
scale agriculture in Kenya, South Africa, and Zimbabwe." Economic Development and Cultural Change 43, no. 3 (1995): 493-522.

3
of High-Yielding Varieties (HYV) seeds, advanced methods of irrigation and the
introduction of agricultural mechanization.
The plan of the paper is as follows. In section 2, I draw from the literature on
development economics in order to give an overview of scholarship in the field of
land reforms and their economic consequences. Although my focus is the impact of
land reform on agricultural modernization, I also mention evidence on other
outcome variables of interest, such as poverty and productivity as well as discussing
the effect of land reform on distribution of landholdings. In section 3, I give a brief
history of land reforms in India, highlighting motives for implementing the reforms
and notable successes and failures. In section 4, I cite the sources for the data I use
in the analysis and provide a brief description of the major variables. In section 5, I
present the model I evaluate and discuss the limitations of the model. In section 6, I
present the results of my analysis. In section 7, I discuss the evidence presented in
the results section and the inferences to be drawn from them. In section 8, I make
concluding remarks and discuss policy implications.
2. Literature Review
Empirical studies of the impact of land reform are rare since reliable
estimation requires data from the pre- and post-reform periods. With regard to the
impact on agricultural modernization, most studies indicate that the
implementation of land reform is positively associated with yield growth made
possible by the adoption of modern seed-fertilizer technology. A major reason
underlying such association is considered to be an increased economic interest of
tenants in land following redistributive land reform.
In the Philippines, Keijiro Otsuka finds that land reform was successfully
implemented and had a positive effect on the adoption of agricultural technology,
mainly the use of advanced varieties of seeds and fertilizers. He imputes this effect
to the increased interest of tenants in their land due to the difference in rental
value of land.4
In Korea, Kim and Jeon claim that land reform was utilized to decrease
transaction costs (of tenancy negotiations) in order to improve the functioning of the
4 Keijiro Otsuka. "Determinants and consequences of land reform implementation in the
Philippines." Journal of Development Economics 35, no. 2 (1991): 339-355.
4
tenancy system. They find that policy that demolished the tenancy system
contributed positively to agricultural productivity as well as economic growth.5
In India there are numerous case studies of land reform, but few attempts to
look at the overall picture. Discussion of the theoretical impact of land reform has
been dominated by the frequently found inverse farm size-productivity relationship,
where small farmers are supposed to achieve higher yields.6 This suggests that
finding means of evening the distribution of landholding should lead to productivity
gains in addition to redistributive benefits.
Banerjee et al. construct a micro-level study of the effects of tenancy reform
in several districts of West Bengal, India and find that tenancy reform had a
positive impact on agricultural productivity of labor.7 This study is referred to and
explained further in the discussion section, where I build a theoretical foundation of
the potential effects of land reform. Bardhan and Mookherjee use a village level
data set to demonstrate a positive relationship between land reform and
agricultural productivity.8 Deininger et al. also find a significant effect of land
reforms on the accumulation of human and physical capital of the beneficiary
households.9
Village level studies also offer a very mixed assessment of the poverty impact
of different land reforms.10 There seems to be a heterogeneity in the impact of
different reforms in different areas, thus rendering overall analysis difficult. Some
consensus exists that the abolition of intermediaries achieved a measure of success.
Although this effect was evident in both redistribution of land as well as increasing
tenurial security, it was variable and limited.11 Successes in tenancy reform are
5 Yoong‐Deok Jeon and Young‐Yong Kim. "Land reform, income redistribution, and
agricultural production in Korea." Economic Development and Cultural Change 48, no. 2
(2000): 253-268. 6 Hans P. Binswanger, Klaus W. Deininger, and Gershon Feder. Power, distortions, revolt, and reform in agricultural land relations. Vol. 1164. World Bank Publications (1993). 7Abhijit V. Banerjee, Paul J. Gertler, and Maitreesh Ghatak. "Empowerment and efficiency:
tenancy reform in West Bengal." Journal of Political Economy 110, no. 2 (2002): 239-280. 8 Pranab Bardhan and Dilip Mookherjee. "Land Reform and farm productivity in West
Bengal.” Unpublished manuscript, Boston University (2007). 9 Klaus Deininger, Songqing Jin, and Hari K. Nagarajan. "Efficiency and equity impacts of
rural land rental restrictions: Evidence from India." European Economic Review 52, no. 5
(2008): 892-918. 10 Raji Jayaraman and Peter Lanjouw, ‘‘Living Standards in Rural India: A Perspective
from Longitudinal Village Studies,’’ Cornell University and World Bank (1997). 11 S. S. Wadley and B. W. Derr, ‘‘Karimpur 1925–1984: Understanding Rural India through
Restudies,’’ in Pranab Bardhan, ed., Conversations between Economists and Anthropologists. New Delhi: Oxford University Press (1990).
5
prevalent in areas where tenants are organized and powerful; however, there have
been cases documented where the prospect of reforms led to landlords forcing mass
eviction on tenants. Thus, in these cases, land reform actually contributed to a
decrease in tenurial security.12 Similarly, Chattopadhyay finds that land ceiling
legislation in a number of villages induced joint family landowners to evict tenants
and fragment the landholding into smaller proprietary units owned by family
members.13 Due to the differences in land quality, land consolidation reform has not
been found to be effective in progressively redistributing land, since richer farmers
use their power to obtain better-quality landholdings.14
Besley and Burgess use state-level data for the 16 major Indian states from
1958 to 1992 and exploit the variation across states and over time in land-reform
legislation to identify the effect of land reform on productivity and poverty. They
identify a robust positive correlation between land reform and poverty reduction.
However, this effect is not due to redistribution of land, but rather the change in the
terms of tenancy contracts.15 Ghatak and Roy use the same database of land
reforms and find that land reform had an overall negative effect on agricultural
productivity.16 I use the same database and classification of state-level land reforms
in this study.
3. Land Reform in India: An Overview17
Equity and political considerations have been the driving motives for
redistributive land reforms in India. In an agrarian economy such as India, with an
unequal distribution of land coupled with a large mass of the rural population below
the poverty line, it received top priority on the policy agenda at the time of the
Indian Independence in 1947.
In the decades following Independence, India passed a significant body of
land reform legislation. The 1949 Constitution left the adoption and
12 Kathleen Gough, Rural Change in Southeast India: 1950s to 1980s (Delhi: Oxford
University Press, 1989). 13 S. N. Chattopadhyay. ‘‘Historical Context of Political Change in West Bengal: A Study of
Seven Villages in Bardhaman, Economic and Political Weekly, March 28, 1992. 14 Jean Dreze and Amartya Sen, India: Economic Development and Social Opportunity (Oxford, Clarendon Press, 1995). 15 Timothy Besley and Robin Burgess. "Land reform, poverty reduction, and growth:
evidence from India." The Quarterly Journal of Economics 115, no. 2 (2000): 389-430. 16 Maitreesh Ghatak and Sanchari Roy. "Land reform and agricultural productivity in
India: a review of the evidence." Oxford Review of Economic Policy 23, no. 2 (2007): 251-269. 17 B. N. Yogandhar, K. Gopal Iyer, and P. S. Dutta. Land Reforms in India. New Delhi: Sage
Publications, 1995. Print.

6
implementation of land and tenancy reforms to state governments. This led to much
variation in the execution of these reforms across states and over time, a fact that
has been used in empirical studies trying to understand the causes and effects of
land reform.
Land reform legislation in India consists of four main categories—tenancy
reform, abolition of intermediaries, land ceiling, and land consolidation. The first
category of land reform, namely tenancy reform, imposes regulation that attempted
to improve the contractual terms faced by tenants, including crop shares and
security of tenure. Under the British land-revenue system, large feudal landowners
(zamindars) received the rights to collect tributes from peasants in exchange for a
land tax paid to the state. Almost half of the land was under this system at the time
of Independence. This system was considered exploitative, and abolition of
intermediaries is aimed at curtailing the power of these large landowners and
ensuring that the cultivator of the land was in direct contact with the government,
which minimized unjust extraction of surplus by the landowner. The third form of
land reform is the imposition of a ceiling on landholdings that aimed to redistribute
surplus land to the landless. Finally, consolidation of landholdings constitutes the
fourth kind of land reform, which ensures that small bits of land belonging to the
same small landowner but situated at some distance from one another can be
consolidated into a single holding to boost viability and productivity. Because of
variation in land quality across plots, this measure has been difficult to implement.
This is further discussed in the later in this section.
The general assessment on land reforms in the Indian context is rather
negative. For example, the report of the Task Force on Agrarian Relations of the
Planning Commission of India (1973) had the following overall assessment of land
reforms in India: ‘The programs of land reform adopted since Independence have
failed to bring about the required changes in the agrarian structure.’ The report
directly blames the political will of the state governments for this failure:
The lack of political will is amply demonstrated by the large gaps
between policy and legislation and between law and its
implementation. In no sphere of public activity in our country since
Independence has the hiatus between precept and practice, between
policy pronouncements and actual execution been as great as in the
domain of land reforms.
7
For instance, under the ceiling law only 1.7 per cent of total cultivated area has
been declared surplus and only 1 per cent of it has been distributed.18
Indeed, the two states in which land reform is widely considered to have been
successful are West Bengal and Kerala, and in both cases it was pushed forward by
left-wing administrations. These two states accounted for 11.75 and 22.88 per cent,
respectively, of the total number of tenants conferred ownership rights (or protected
rights) up to 2000, despite being home to only 7.05 and 2.31 per cent of India’s
population, respectively As regards implementation of land ceiling laws, West
Bengal’s share of total surplus land distributed was almost 20 per cent of the all-
India figure, although the state accounts for only about 3 per cent of India’s land
resources.19 Despite this consensus, until very recently there have been very few
rigorous attempts to study the impact of land reforms. This is not surprising as
there are serious conceptual issues in trying to measure the impact of land reform.
The amount of land area directly affected by the reform is not the appropriate
measure of its success: for instance, measures may be taken in anticipation of or in
reaction to the reform (e.g. eviction of tenants, or land sales) whose impact must be
considered when studying the aggregate effects of the reform. Also, implementation
of land reform is likely to be correlated with other government policies and economic
trends, which in turn are likely to be correlated with outcome measures of interest,
such as agricultural productivity and poverty. This makes causal inference difficult.
The colonial rulers had introduced a land consolidation program in then
British India as early as 1905, and it continued after India's independence in
1947.20 After independence, an ambitious land consolidation program was initiated
since the beginning of the First Five-year Plan in 1950 to boost agricultural
production. However, this program could not make satisfactory headway due to the
resistance of the landowners, interpersonal disputes and weak land revenue
administration. Out of 325 million acres projected, only 23 million acres could be
consolidated during the period of one decade. Particularly, small farmers and
tenants feared that they would ultimately be evicted and become jobless due to farm
mechanization facilitated by land consolidation. Because their tenancy rights were
not legalized, the tenants were also concerned about the security of their rights, as
land consolidation may be a pretext for their eviction by landlords. Farmers were
18 S. K. Misra, and V. K. Puri. Indian Economy Development Experience. Bombay:
Himalaya House, 2000. Print. 19 Govt. of India, (2000): Annual Report of the Ministry of Rural Development, Annexures
XXXII & XXXV. 20 J.P. Bonner, Land Consolidation and Economic Development in India: A Study of Two Harayana Villages, Allied Publishers, New Delhi (1987).

8
also hesitant to change the existing arrangements due to their strong sentimental
attachment to land parcels.21
Frustrated with the little progress made, elements of compulsion were
included in the Land Consolidation Act of 1980 to expedite the process of land
consolidation. This is because voluntary consolidation in India has been a failure.22
The previously-mentioned Act entrusted authorities with power, where necessary,
to undertake compulsory consolidation in the public interest. Operations were
initiated only when one-third of the villagers holding at least one-third of the land
requested assistance for consolidation. In Punjab, consolidation was undertaken in
any village where two-thirds of the landowners possessing not less than three-
fourths of the cultivated area requested consolidation. Despite widely introduced
legislation in 16 states, land consolidation programs were effectively implemented
only in Uttar Pradesh, Punjab and Haryana. Little achievement was made in
Madhya Pradesh, Gujarat, Rajasthan and Karnataka.23 Several factors, including
heterogeneous land quality, constrained land consolidation.24 Farmers did not want
to lose any fertile parcel of land because they were not quite sure about the quality
of land to be allocated to them. This problem was not confronted in those states
where land consolidation was successfully implemented, as there was not much
variation in land quality. Lack of scientific land records, corrupt bureaucracy, legal
loopholes and lack of technical skill on the part of officials were other causes of
failure of land consolidation in India.25
4. Data and Sources
Detailed district-level data from the Indian Ministry of Agriculture and other
official sources on yearly agricultural production, output prices and acreage planted
and cultivated for 271 districts in thirteen states over the period 1956-1987 have
been collected into the “India Agriculture and Climate Data Set” by a World Bank
research group, allowing computation of yield (revenues per acre) and total output
(Sanghi et al., 1998a). This data set covers the major agricultural states with the
21 B.S. Khanna, Rural Development in South Asia—India, Deep and Deep Publications,
New Delhi (1991). 22 R. King and S. Burton, “Structural change in agriculture the geography of land
consolidation”, Progress in Human Geography 5 (1983) (7), pp. 471–501. 23 J.P. Bonner, Land Consolidation and Economic Development in India A Study of Two Harayana Villages, Allied Publishers, New Delhi (1987). 24 R. Mearns, Access to Land in Rural India Policy Issues and Options, World Bank,
Washington (1999). See also R. Mearns and S. Sinha, Social Exclusion and Land Administration in Orissa—India, World Bank, Washington (1999). 25 S.R. Singh, Land Reforms in India, Kitab Mahal, Allahabad (1987).
9
exceptions of Kerala and Assam. Also absent, but less important agriculturally, are
the minor states and Union Territories in northeastern India, and the northern
states of Himachal Pradesh and Jammu-Kashmir. In this particular analysis, I
concentrate on the years 1961-1987 (since data on modernization variables is only
available for those years) and drop Haryana since it was created in 1966 and
determination of policy effects is difficult for a new state.
From this data set, I obtain variables relating to high-yielding varieties seed-
cultivation, fertilizer use, and tractor use to demonstrate agricultural
modernization. Since the data is district-level (but the district coverage is
exhaustive), I obtain state-level measures by summing the district-level values for
each of these variables. In order to control for state size and level of agricultural
cultivation, I obtain proportions by dividing area under HYV cultivation by total
area of cultivation in the state, and similarly find an indicator of fertilizer use by
dividing the amount of fertilizer used by the cultivated area. I do the same to get a
measure of mechanization by looking at the concentration of tractors with respect to
cultivated area.
I also use this data set for information on control variables such as the price
of inputs. For agricultural wages, I obtain a state-level variable for the mean
agricultural wage per month by taking the average over each district weighted by
the population of that district. I use the same method for price of fertilizer and price
of tractors, except that I weight the average by area of the district rather than
population. All prices are reported in Indian rupees (valued in the year 1961) and
deflated to real values using the Indian Consumer Price Index.
For policy variables, I use the Besley and Burgess data set on land reforms in
India. They divide land reforms into four main categories. The first category is acts
related to tenancy reform. These include attempts to regulate tenancy contracts
both via registration and stipulation of contractual terms, such as shares in share
tenancy contracts, as well as attempts to abolish tenancy and transfer ownership to
tenants.26 The second category of land reform acts includes attempts to abolish
intermediaries. This refers to intermediaries who worked under feudal lords
(Zamindari) to collect rent for the British and supposedly allowed a larger share of
the surplus from the land to be extracted from tenants. Most states had passed
legislation to abolish intermediaries prior to 1958. However, five (Gujarat, Kerala,
Orissa, Rajasthan, and Uttar Pradesh) did so during this data period (1961-1987).
The third category of land reform acts concerned efforts to implement ceilings on
26 Timothy Besley and Robin Burgess. "Land reform, poverty reduction, and growth:
evidence from India." The Quarterly Journal of Economics 115, no. 2 (2000): 389-430.
10
landholdings, with a view to redistributing surplus land to the landless. Finally,
there are acts that attempted to allow consolidation of disparate landholdings. Only
two states implemented these during the time period: Orissa and West Bengal.
In most analyses using this land reform data, simple dummy variables
signifying the presence or absence of a particular type of reform were found to have
no effect. It is unlikely that land reforms would have an instantaneous effect; hence
Besley and Burgess construct cumulative variables that aggregate the effects of
each reform over time. However, since several states enacted multiple reforms of
the same type over the given time period, this may lead to a confounding effect.
Besley and Burgess assume that the effect is identical regardless of whether the
legislation is the first, second or the last reform of that type adopted by the state. It
ignores the possibility that subsequent reforms may have been enacted because the
prior ones were unsuccessful or had an adverse effect. Hence, using a cumulative
variable does not seem to be justified in this case.
Therefore I restrict my analysis to the first reform of each type adopted by a
state and analyze its impact on my variables of interest. I code a dummy variable
that takes a default value of 0 and changes to 1 in the year that the first reform of a
particular type is adopted. Hence, I capture the change associated with the first
passage of a particular type of reform in a state within my time period. Evidently,
this excludes analysis of how subsequent reforms affect the variables of interest,
but it succeeds in not conflating potentially incommensurate effects of subsequent
reforms. Although the Besley and Burgess data set comprises sixteen states over
the years 1950-1992, I restrict the data set to correspond to the limitations of the
Agriculture and Climate Data set.
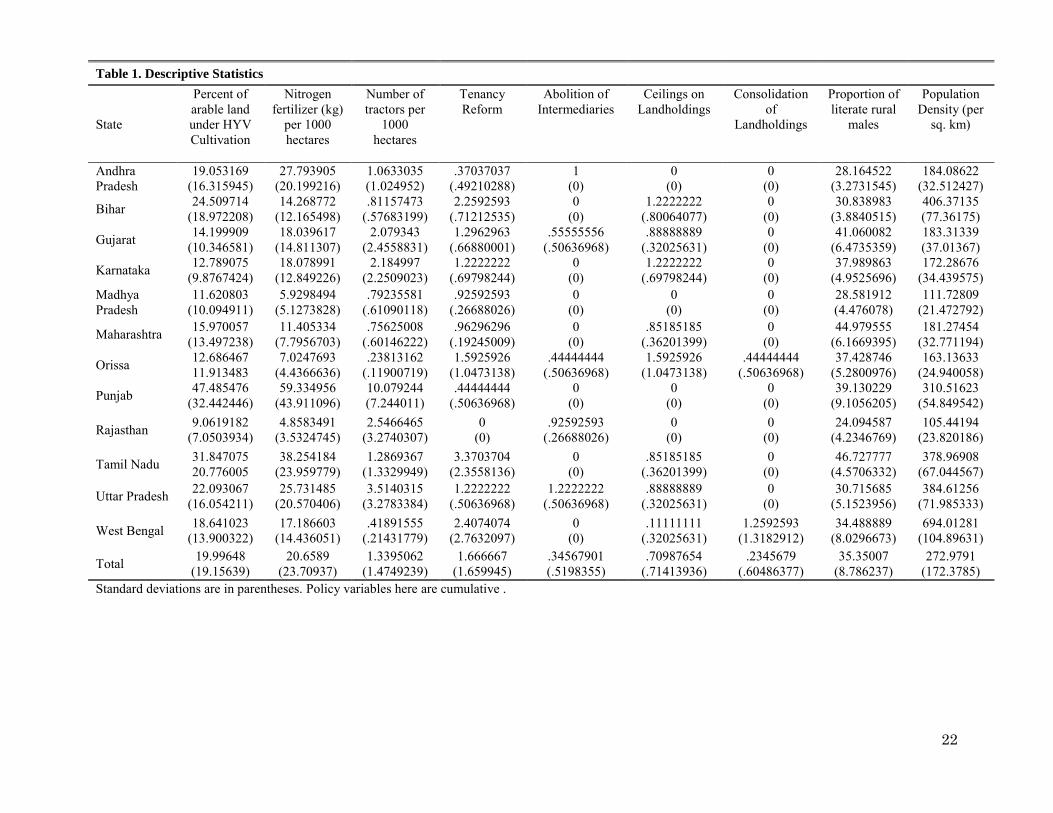
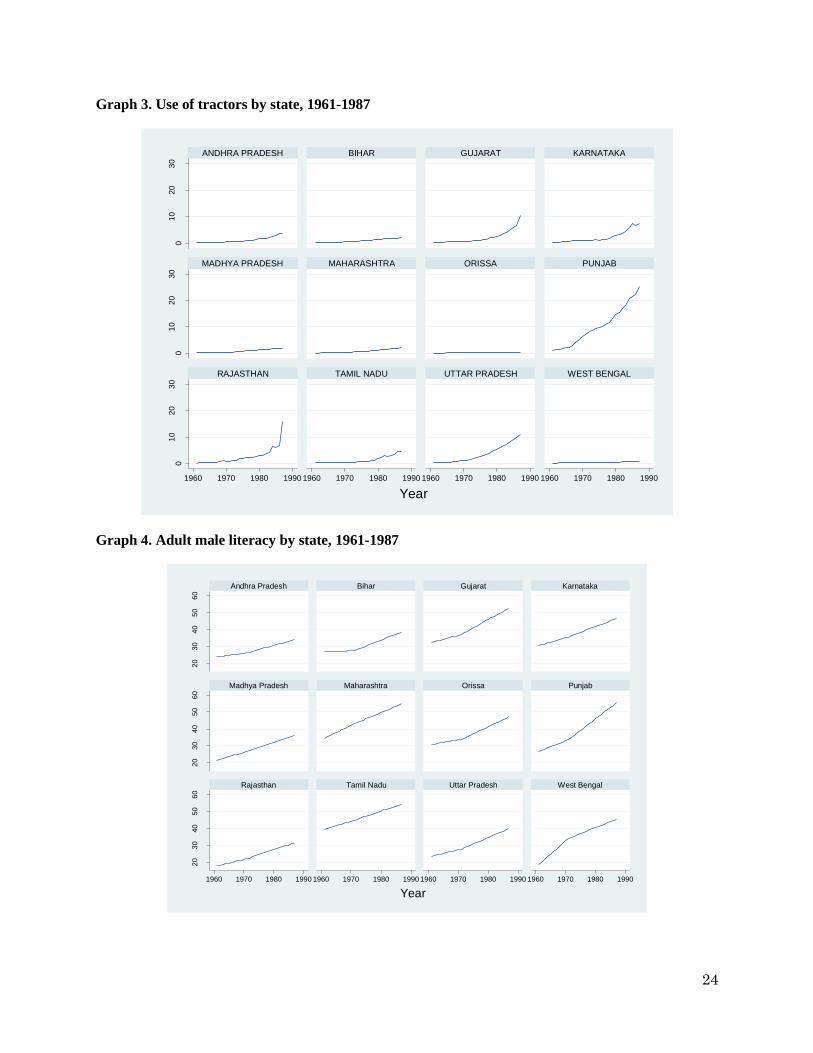
Table 1 in Appendix A lists summary statistics for each variable in the
analysis. It is followed by graphs (Graph 1, Graph 2 and Graph 3) that demonstrate
the variation in the level of HYV cultivation, fertilizer use and tractor use for
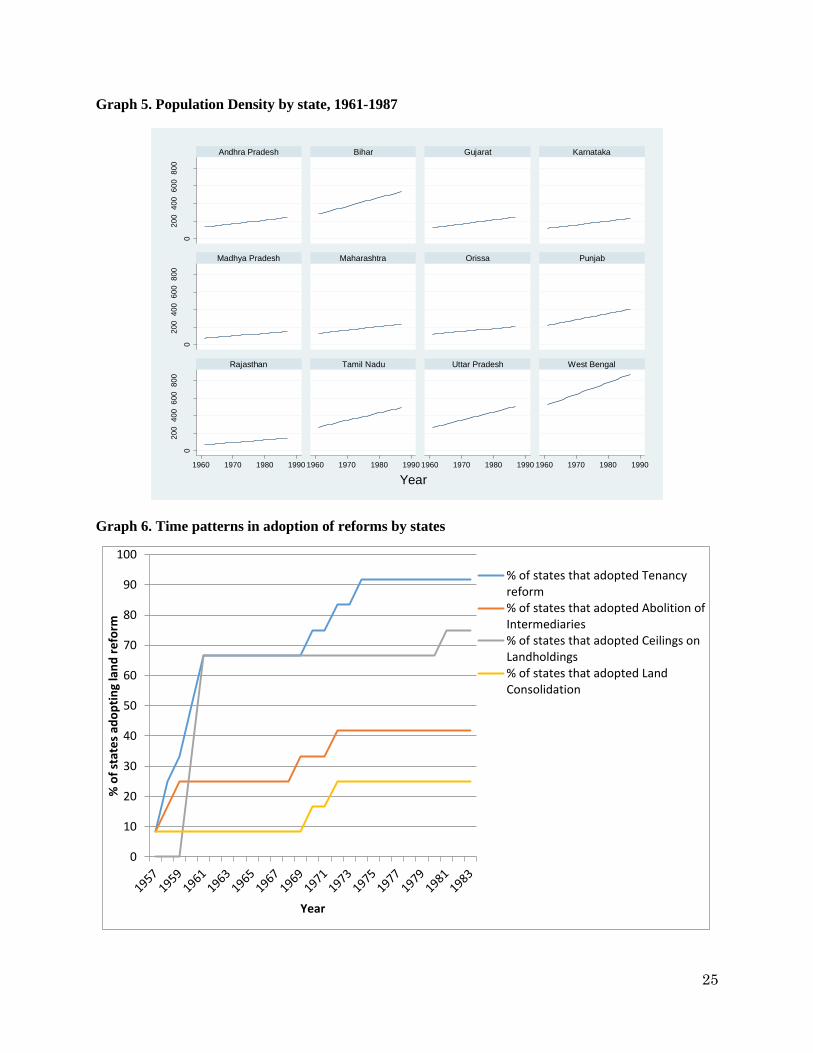
different states. I also include visual representations of the variation over time of
population density and adult literacy by state (Graph 4 and Graph 5). It is evident
from these representations that Punjab is somewhat of an outlier when it comes to
modernization. This is because Punjab was the first state to implement Green
Revolution agricultural practices and has remained a pioneer in agricultural
technology since.
In order to provide an idea of the time patterns in adoption of particular
reforms, Graph 6 illustrates the increasing adoption of various reforms by states
over time. Nearly all states (~ 92%) adopted tenancy reforms, with land ceiling
legislation being next in popularity: 75% states had passed the corresponding

11
legislation by the end of the analytical period. Less than half (~42%) of states
passed reforms intended for abolition of intermediaries. Only three states adopted
land consolidation reforms, and of those, only two did so during the analytical time
frame.
5. Methodology
Following Besley and Burgess’ analysis, I estimate a state-level panel data
regression with the following specification:
Where is the measure of agricultural modernization, is a state fixed effect,
is a year dummy variable, is a vector of controls that vary by state and year,
is a vector of cumulative land reform measures lagged by 3 years,27 and is an
error term which I model as AR(1) process where the degree of autocorrelation is
state-specific; i.e. | | | | . Estimation via generalized least squares
will also allow for heteroskedasticity in the error structure with each state having
its own error variance.
In this model, I use three different measures of agricultural modernization:
HYV cultivation, use of fertilizers and tractor usage. Using different measures tests
the robustness of the model against different specifications of the dependent
variable i.e. agricultural modernization. In addition, I use a set of controls that
account for factors other than the main independent policy variables. The model
includes two categories of controls: exogenous factors and input
substitution/complement controls.
The exogenous factors controlled for in this model are population density and
literacy of rural adult males. Population density may affect demand for modern
agricultural technology since it exerts pressure on agricultural production.28 Since
modern agricultural techniques require some degree of skill to utilize, it is expected
that education level will be related to adoption of agricultural technology.
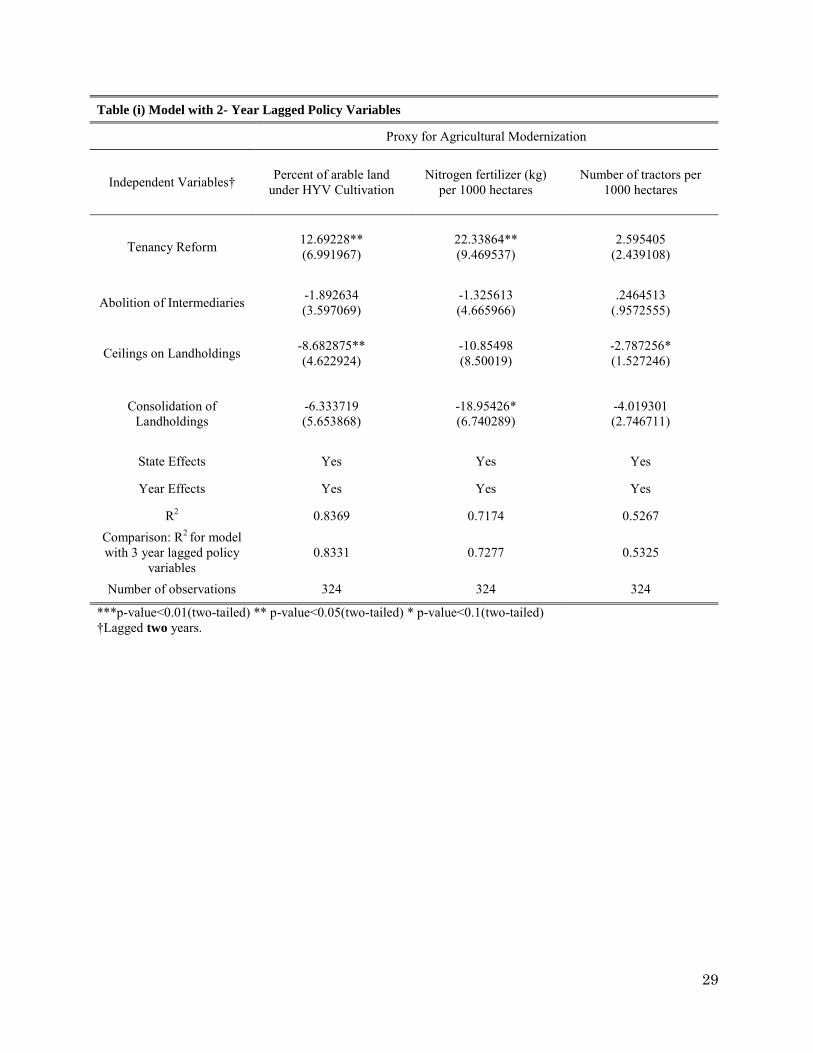
27 Both Besley and Burgess as well as Ghatak and Roy lag the land reform variables by four
years. This stands to reason as reforms are unlikely to have an immediate effect. I also
estimate models with lesser time lags (two years) and greater lags (four years) and the
results were similar for a two-year lag and lacked explanatory power for the four-year lag. I
also experimented with longer lags but everything beyond four years lacked explanatory
power. These results are reported in Appendix B, Table (i) and (ii). 28 Oded Stark. "The asset demand for children during agricultural modernization."
Population and Development Review (1981): 671-675.
12
The model also controls for potential input substitution or complementary
effects by including prices of inputs as control variables. There are three such
variables used: agricultural wages, price of fertilizers and price of tractors. These
inputs may be used in conjunction with modern agricultural technology or instead
of technology, so it is necessary to control for the effect of price variations in inputs.
The key empirical problem while evaluating the impact of land reform is to
separate the effect of land reform from the effect of all other economic and policy
variables, given that they all vary over time. Here, I try to exploit the over-time
variation in the passing of land reform legislation across states. This has the
advantage of controlling for state fixed effects and, also, year fixed effects.
Therefore, to the extent that fixed state-specific factors (e.g. land inequality) drive
the extent of these reforms, these methods are able to separate the effect of reforms
from the direct effects of these factors. This is also why I do not control for the
inequality in land distribution by including a Gini coefficient on land (apart from
the fact that is sometimes causally related to land reform). Analogously, to the
extent that time-varying shocks that apply to all states affect the outcome variables
of interest, controlling for year fixed effects accounts for the fact that the land
reform measure is not picking up the effects of these other common time-varying
factors.
To check the model for a reverse causality problem, I estimate the model with
policy variables leading by the same time as the lags and find no significance on the
lead variables. The results are reported in Appendix B, Table (iii).
5.1 Limitations of the model
The model is limited by the fact that at the state level, there is no data about
the actual level of implementation of the passed land reform legislation. As the
discussion section shows, most land reform was imperfectly adopted and therefore
the actual impact is very difficult to measure. This is especially problematic in the
cases of the land reform designed specifically for land redistribution, i.e. land
ceilings and land consolidation.
Considering that land reform is often implemented by changing the size of
landholdings, the analysis should ideally include landholding size in the analysis in
order to properly identify the mechanism of change. However, data for the relevant
years on landholding size and whether changes in landholding size occurred as a
result of these reforms is unavailable. This essentially means that we can only
conjecture the effect of the reforms but no causal inferences can be drawn.
13
As mentioned before, this particular analysis focuses only on the effect of the
first reform of a particular type adopted by a state. This necessarily ignores the
potential cumulative effect or interference effect of multiple reforms of the same
type. Further research is needed to refine this analysis and determine whether
multiple reforms of the same type have similar effects or counteract each other.
In addition, the effect of land reforms may be complicated by other reforms
occurring at the same time which have similar effects. Due to the high level of
correlation between land reforms and poverty alleviation policy, these could not be
included in the model. Hence the results reported here can only conjecture how
much of the measured impact can be truly attributed to land reforms, since the
potential effect of other reforms cannot be included.
6. Results
6.1 Simple model without controls
First, I estimate the model without any control variables to see if land policy
reforms have any impact on agricultural modernization, measured by the extent of
adoption of HYV seeds, fertilizers and tractors. The summary statistics in Table 1
show that land consolidation reforms were adopted only in two states during the
time period (Orissa and West Bengal). Hence I also estimate the model on a
restricted sample omitting those states (which can be conceptualized as outliers) to
see if the results are robust. In this restricted sample, I also exclude Punjab as an
outlier since its performance on most indicators of agricultural modernization far
outstrips that of other states, so it may be skewing the results. Therefore, I estimate
two models for each measure of agricultural modernization: unrestricted (12 states)
and restricted (9 states). In this section I briefly summarize the significant results
obtained, concentrating on the restricted model, although I report results for both
models in the table. As the restricted model omits outliers, it may be perceived as
the more robust of the two.
Tenancy reform is significantly positively correlated with both HYV
cultivation and use of nitrogen fertilizer, and this effect is robust to data set
restriction. Table 2 shows that upon omitting outlier states (9-state model), the first
tenancy reform adopted by a state (independent of other reforms) is associated with
an increase in HYV cultivation by 11.03 percentage points. It is also associated with
an increase of 11.94 kg of nitrogen fertilizer per sq. km.
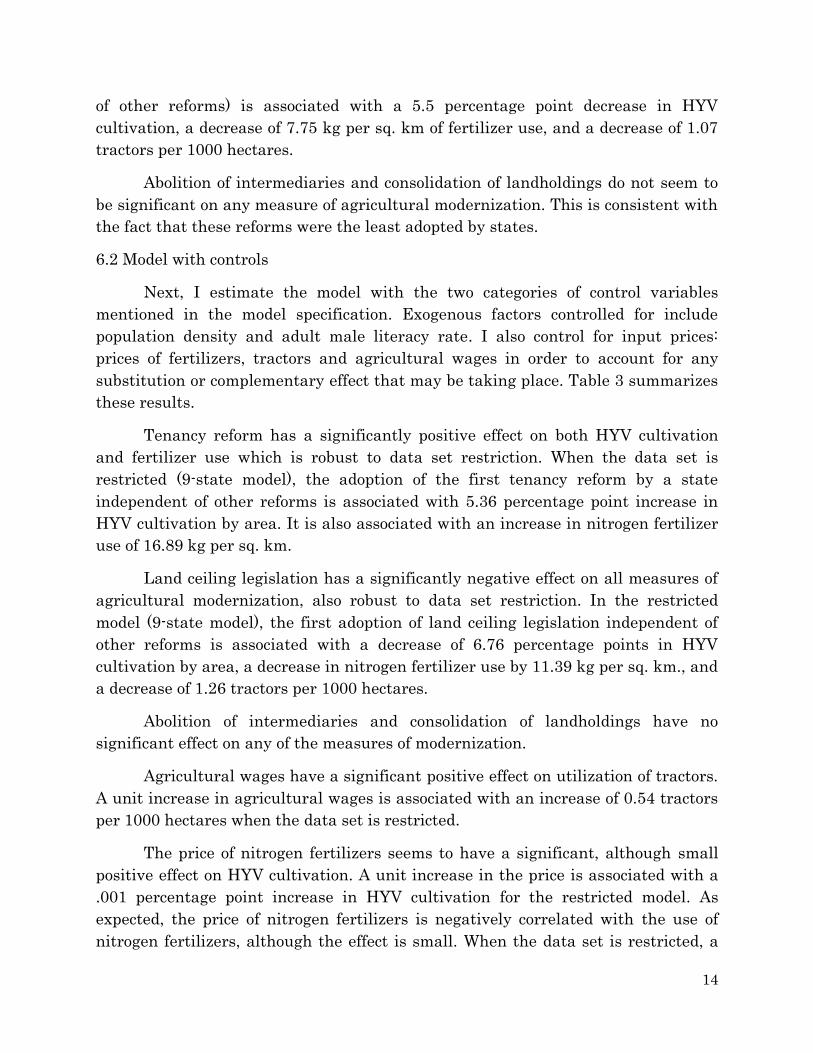
Reforms that impose ceilings on landholdings have a significant, robust
negative effect on all measures of agricultural modernization. In the restricted
model (9 states), we see that the first such reform adopted by a state (independent
14
of other reforms) is associated with a 5.5 percentage point decrease in HYV
cultivation, a decrease of 7.75 kg per sq. km of fertilizer use, and a decrease of 1.07
tractors per 1000 hectares.
Abolition of intermediaries and consolidation of landholdings do not seem to
be significant on any measure of agricultural modernization. This is consistent with
the fact that these reforms were the least adopted by states.
6.2 Model with controls
Next, I estimate the model with the two categories of control variables
mentioned in the model specification. Exogenous factors controlled for include
population density and adult male literacy rate. I also control for input prices:
prices of fertilizers, tractors and agricultural wages in order to account for any
substitution or complementary effect that may be taking place. Table 3 summarizes
these results.
Tenancy reform has a significantly positive effect on both HYV cultivation
and fertilizer use which is robust to data set restriction. When the data set is
restricted (9-state model), the adoption of the first tenancy reform by a state
independent of other reforms is associated with 5.36 percentage point increase in
HYV cultivation by area. It is also associated with an increase in nitrogen fertilizer
use of 16.89 kg per sq. km.
Land ceiling legislation has a significantly negative effect on all measures of
agricultural modernization, also robust to data set restriction. In the restricted
model (9-state model), the first adoption of land ceiling legislation independent of
other reforms is associated with a decrease of 6.76 percentage points in HYV
cultivation by area, a decrease in nitrogen fertilizer use by 11.39 kg per sq. km., and
a decrease of 1.26 tractors per 1000 hectares.
Abolition of intermediaries and consolidation of landholdings have no
significant effect on any of the measures of modernization.
Agricultural wages have a significant positive effect on utilization of tractors.
A unit increase in agricultural wages is associated with an increase of 0.54 tractors
per 1000 hectares when the data set is restricted.
The price of nitrogen fertilizers seems to have a significant, although small
positive effect on HYV cultivation. A unit increase in the price is associated with a
.001 percentage point increase in HYV cultivation for the restricted model. As
expected, the price of nitrogen fertilizers is negatively correlated with the use of
nitrogen fertilizers, although the effect is small. When the data set is restricted, a
15
unit increase in the price of nitrogen fertilizer is associated with a decrease of
0.0027 kg of nitrogen fertilizer per sq. km.
Population density is positively correlated with HYV cultivation and fertilizer
use. A unit increase in population density is associated with a 18.32 percentage
point increase in HYV cultivation by area and an increase of 25.35 kg of nitrogen
fertilizer per sq. km when the data set is restricted.
For all the independent variables, restricting the data set decreases the beta
coefficients on each variable by a minor amount. This shows that the results are
mostly robust to data set restriction, since variables do not lose significance or have
different effects when the restricted model is estimated.
7. Discussion of results
7.1 Tenancy Reform
According to the reported results, tenancy reform has a significant positive
relationship that is robust to the exclusion of certain states with two measure of
agricultural modernization, HYV cultivation and the use of fertilizers. It is
plausible to infer that these results may indicate that tenancy reform has an effect
on tenurial security. Assuming that tenancy reform is successfully implemented, it
may lead to changes in landlord-tenant relationships such that tenurial security is
increased. By altering the terms of the landlord-tenant contract, tenancy reform
may enable tenants to gain security against eviction. Thus tenurial security may
have two effects; increasing bargaining power and increasing the stake in land
utilization of the tenant. When the tenants’ bargaining power increases, they
receive a larger share of revenue from the agricultural yield and this, coupled with
the assurance that they will stay on the land long enough to reap the benefits of
advanced techniques, may lead to increased investment by the tenants in modern
agricultural technology.29
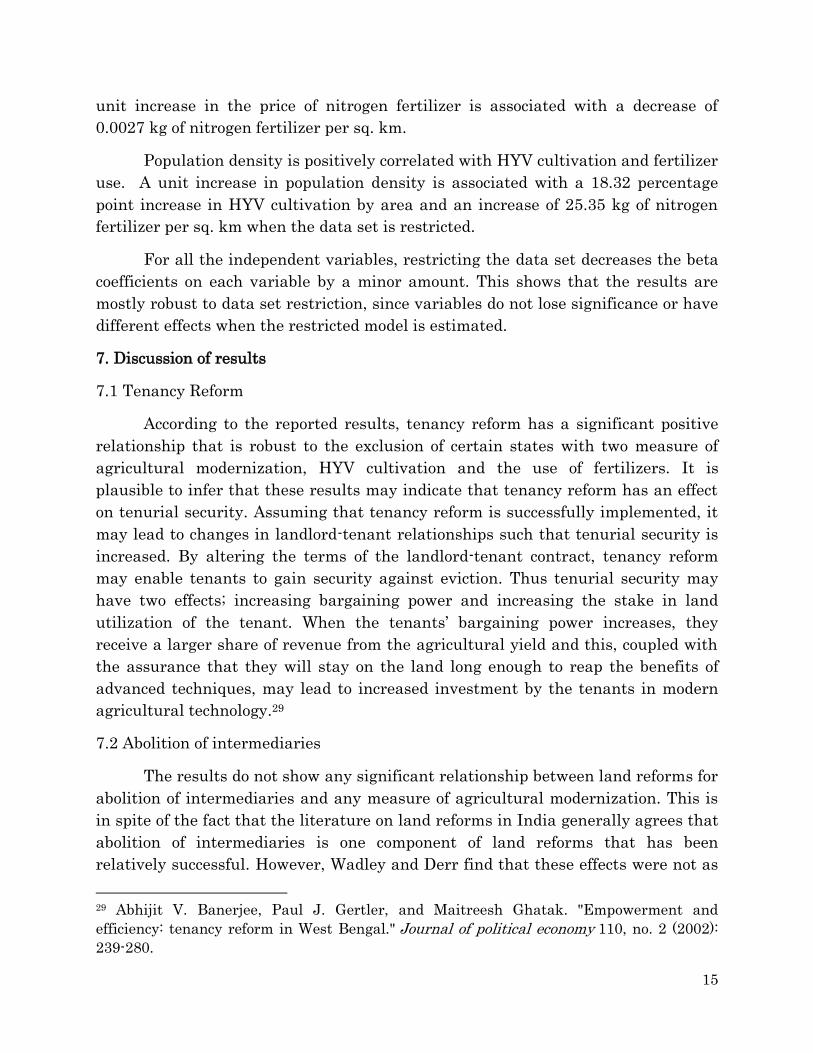
7.2 Abolition of intermediaries
The results do not show any significant relationship between land reforms for
abolition of intermediaries and any measure of agricultural modernization. This is
in spite of the fact that the literature on land reforms in India generally agrees that
abolition of intermediaries is one component of land reforms that has been
relatively successful. However, Wadley and Derr find that these effects were not as
29 Abhijit V. Banerjee, Paul J. Gertler, and Maitreesh Ghatak. "Empowerment and
efficiency: tenancy reform in West Bengal." Journal of political economy 110, no. 2 (2002):
239-280.

16
prevalent as expected. Although in most cases they increased tenurial security and
progressively impacted land distribution, the effect was not uniform.30 Also, in this
model, we see that only five states out of twelve enacted these reforms in the
relevant time period. This may explain why it is not very significant in the analysis.
7.3 Land Ceilings
The results show a significant negative relationship between reforms
imposing land ceilings and all three measures of agricultural modernization.
Assuming that land ceilings were implemented, this type of policy may have
affected landholding sizes. Even if land ceiling legislation is not effective in its
objective of progressive redistribution, it may have contributed to land
fragmentation. Even if landowners attempt to evade the law by registering smaller
parcels of land under relatives’ names, the size of the landholdings decreases as
bigger plots are divided among multiple owners. If landholding size decreases, it is
possible that adoption of modern agricultural technology will be negatively affected.
It may be difficult to implement mechanization such as tractors and use fertilizers
over the resulting smaller pieces of land.
In addition to potentially increasing land fragmentation, ceilings on
landholdings may have a negative effect on tenurial security. Historically,
landowners resisted the implementation of these reforms by using their political
clout and various methods of evasion and coercion, which included registering their
own land under names of different relatives to bypass the ceiling, shuffling tenants
around different plots of land so that they would not acquire incumbency rights as
stipulated in the tenancy law, and possibly even outright eviction. As mentioned
before, a decrease in tenurial security may decrease the likelihood of a tenant
investing in modern agricultural technology since long-term use of the land is not
assured.
7.4 Land Consolidation
For all measures of agricultural modernization, land consolidation has a
negative effect, even if it is not significant. This is contrary to the expectation that
land consolidation, in working against land fragmentation would lead to scale
effects that are essential for the adoption of agricultural technology. However, we
see that only two states out of twelve implemented land consolidation measures in
30 S. S. Wadley and B. W. Derr, ‘‘Karimpur 1925–1984: Understanding Rural India through
Restudies,’’ in Pranab Bardhan, ed., Conversations between Economists and Anthropologists (Delhi: Oxford University Press, 1990).

17
the time period, so the coefficient may simply have been capturing the effect of the
extensive margin (i.e. demonstrating the difference between states with the policy
and the majority of states without.) In addition, the presence of negative coefficient
of land consolidation on measures of agricultural modernization may be partially
explained by the fact that land consolidation was extremely poorly implemented
even in the only two states that adopted the policy.31
7.5 Control variables
The results indicate a positive relationship between population density and
two measures of agricultural modernization: HYV cultivation and use of nitrogen
fertilizers. The correlation of population density with agricultural modernization
falls in line with most of the literature on this subject. Binswanger et al. find that
technological change is generally associated with increased labor requirements per
hectare of cultivated area. In addition, increased population density may indicate
the existence of diminishing returns to labor. This may provide farmers with an
incentive to substitute labor for technology and thus utilize modern agricultural
techniques.
The proportion of literate rural males does not have a significant relationship
with any measure of agricultural modernization except use of tractors in the
unrestricted model. The direction of the coefficient is in line with the expectation
that a more educated population will be more able to adapt to and adopt advanced
technology. Since adult male literacy rate is not a very good indicator of education
level, its effects are not significant even though its direction is borne out by the
literature.
The results on the relationship between input prices indicate that input
substitution takes place to a small degree. There exists a positive relationship
between agricultural wages and use of tractors. This may indicate that farmers use
mechanization (i.e. tractors) as a substitute for agricultural labor. As the price of
labor increases, it is possible farmers tend to use tractors instead.
Similarly, the price of nitrogen fertilizers is positively correlated with HYV
cultivation, although the effect is small. This may indicate that farmers substitute
HYV cultivation with usage of fertilizers. However, fertilizers are often used in
conjunction with HYV cultivation, so fertilizers may act as a complement to HYV
31 J.P. Bonner, Land Consolidation and Economic Development in India: A Study of Two Harayana Villages, Allied Publishers, New Delhi (1987).
18
cultivation. In such cases, we would expect the sign of the coefficient to be negative.
If the substitution and complement effects counteract each other, it may be a
possible explanation of the small size of the coefficient. The price of nitrogen
fertilizers is negatively correlated with the usage of nitrogen fertilizers. As expected
by conventional economic theory, the price of an input is negatively correlated with
the use of that input.
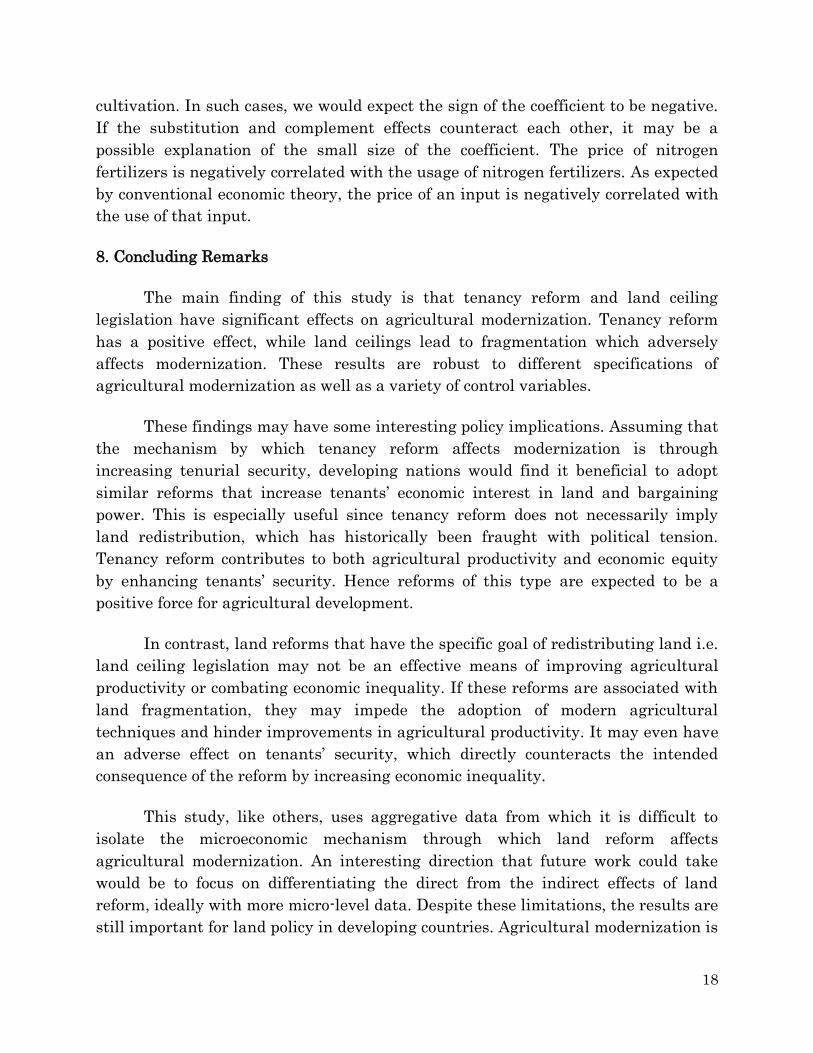
8. Concluding Remarks
The main finding of this study is that tenancy reform and land ceiling
legislation have significant effects on agricultural modernization. Tenancy reform
has a positive effect, while land ceilings lead to fragmentation which adversely
affects modernization. These results are robust to different specifications of
agricultural modernization as well as a variety of control variables.
These findings may have some interesting policy implications. Assuming that
the mechanism by which tenancy reform affects modernization is through
increasing tenurial security, developing nations would find it beneficial to adopt
similar reforms that increase tenants’ economic interest in land and bargaining
power. This is especially useful since tenancy reform does not necessarily imply
land redistribution, which has historically been fraught with political tension.
Tenancy reform contributes to both agricultural productivity and economic equity
by enhancing tenants’ security. Hence reforms of this type are expected to be a
positive force for agricultural development.
In contrast, land reforms that have the specific goal of redistributing land i.e.
land ceiling legislation may not be an effective means of improving agricultural
productivity or combating economic inequality. If these reforms are associated with
land fragmentation, they may impede the adoption of modern agricultural
techniques and hinder improvements in agricultural productivity. It may even have
an adverse effect on tenants’ security, which directly counteracts the intended
consequence of the reform by increasing economic inequality.
This study, like others, uses aggregative data from which it is difficult to
isolate the microeconomic mechanism through which land reform affects
agricultural modernization. An interesting direction that future work could take
would be to focus on differentiating the direct from the indirect effects of land
reform, ideally with more micro-level data. Despite these limitations, the results are
still important for land policy in developing countries. Agricultural modernization is

19
an essential tool for economic growth, and this evaluation of the different impacts of
land reform on modernization may provide a direction for future research.
Works Cited
Banerjee, Abhijit V., Paul J. Gertler, and Maitreesh Ghatak. "Empowerment and
efficiency:tenancy reform in West Bengal." Journal of Political Economy 110,
no. 2 (2002): 239-280.
Bardhan, Pranab, and Dilip Mookherjee. "Land Reform and farm productivity in
West Bengal.” Unpublished manuscript, Boston University (2007).
Besley, Timothy, and Robin Burgess. "Land reform, poverty reduction, and growth:
evidence from India." The Quarterly Journal of Economics 115, no. 2 (2000):
389-430.
Binswanger, Hans P., Klaus W. Deininger, and Gershon Feder. Power, distortions, revolt, and reform in agricultural land relations. Vol. 1164. World Bank
Publications, 1993.
J.P. Bonner, Land Consolidation and Economic Development in India: A Study of Two Harayana Villages, Allied Publishers, New Delhi (1987).
Chattopadhyay, S. N., ‘‘Historical Context of Political Change in West Bengal: A
Study of Seven Villages in Bardhaman, Economic and Political Weekly, March 28, 1992.
Deininger, Klaus, and Paul Mpuga. "Land Markets in Uganda: Incidence, Impact,
and Evolution over Time." World Bank Policy Research Working Paper, Washington DC (2002).
Deininger, Klaus, and Hans P. Binswanger. "Rent seeking and the development of
large-scale agriculture in Kenya, South Africa, and Zimbabwe." Economic Development and Cultural Change 43, no. 3 (1995): 493-522.
Deininger, Klaus, Songqing Jin, and Hari K. Nagarajan. "Efficiency and equity
impacts of rural land rental restrictions: Evidence from India." European Economic Review 52, no. 5 (2008): 892-918.
Dreze, Jean, and Amartya Sen, India: Economic Development and Social Opportunity (Oxford, Clarendon Press, 1995).
Ghatak, Maitreesh, and Sanchari Roy. "Land reform and agricultural productivity
in India: a review of the evidence." Oxford Review of Economic Policy 23, no.
2 (2007): 251-269.
Gough, Kathleen, Rural Change in Southeast India: 1950s to 1980s (Delhi: Oxford
University Press, 1989).
Government. of India, Annual Report of the Ministry of Rural Development, Annexures XXXII & XXXV (2000).
Jayaraman, Raji, and Peter Lanjouw, ‘‘Living Standards in Rural India: A
Perspective from Longitudinal Village Studies,’’ Cornell University and
World Bank, 1997.
Jeon, Yoong‐Deok, and Young‐Yong Kim. "Land reform, income redistribution, and

20
agricultural production in Korea." Economic Development and Cultural Change 48, no. 2 (2000): 253-268.
Khanna, B.S. Rural Development in South Asia—India, Deep and Deep
Publications, New Delhi (1991).
King, R. and S. Burton, “Structural change in agriculture the geography of land
consolidation”, Progress in Human Geography 5 (1983) (7), pp. 471–501.
Mearns, R. Access to Land in Rural India Policy Issues and Options, World Bank,
Washington (1999).
Mearns, R. and S. Sinha, Social Exclusion and Land Administration in Orissa— India, World Bank, Washington (1999).
Misra, S. K., and V. K. Puri. Indian Economy Development Experience. Bombay:
Himalaya House, 2000. Print.
Otsuka, Keijiro. "Determinants and consequences of land reform implementation in
the Philippines." Journal of Development Economics 35, no. 2 (1991): 339-
355.
Pingali, Prabhu L., and Hans P. Binswanger. "Population density and agricultural
intensification: a study of the evolution of technologies in tropical
agriculture." (1987): 27-56.
Singh, R. Land Reforms in India, Kitab Mahal, Allahabad (1987).
Stark, Oded. "The asset demand for children during agricultural modernization."
Population and Development Review (1981): 671-675.
Wadley, S. S., and B. W. Derr, ‘‘Karimpur 1925–1984: Understanding Rural India
through Restudies,’’ in Pranab Bardhan, ed., Conversations between Economists and Anthropologists (Delhi: Oxford University Press, 1990).
Yogandhar, B. N., K. Gopal Iyer, and P. S. Dutta. Land Reforms in India. New
Delhi: Sage Publications, 1995. Print.

21
Appendix A
22
Table 1. Descriptive Statistics
State
Percent of
arable land
under HYV
Cultivation
Nitrogen
fertilizer (kg)
per 1000
hectares
Number of
tractors per
1000
hectares
Tenancy
Reform
Abolition of
Intermediaries
Ceilings on
Landholdings
Consolidation
of
Landholdings
Proportion of
literate rural
males
Population
Density (per
sq. km)
Andhra
Pradesh
19.053169
(16.315945)
27.793905
(20.199216)
1.0633035
(1.024952)
.37037037
(.49210288)
1
(0)
0
(0)
0
(0)
28.164522
(3.2731545)
184.08622
(32.512427)
Bihar 24.509714
(18.972208)
14.268772
(12.165498)
.81157473
(.57683199)
2.2592593
(.71212535)
0
(0)
1.2222222
(.80064077)
0
(0)
30.838983
(3.8840515)
406.37135
(77.36175)
Gujarat 14.199909
(10.346581)
18.039617
(14.811307)
2.079343
(2.4558831)
1.2962963
(.66880001)
.55555556
(.50636968)
.88888889
(.32025631)
0
(0)
41.060082
(6.4735359)
183.31339
(37.01367)
Karnataka 12.789075
(9.8767424)
18.078991
(12.849226)
2.184997
(2.2509023)
1.2222222
(.69798244)
0
(0)
1.2222222
(.69798244)
0
(0)
37.989863
(4.9525696)
172.28676
(34.439575)
Madhya
Pradesh
11.620803
(10.094911)
5.9298494
(5.1273828)
.79235581
(.61090118)
.92592593
(.26688026)
0
(0)
0
(0)
0
(0)
28.581912
(4.476078)
111.72809
(21.472792)
Maharashtra 15.970057
(13.497238)
11.405334
(7.7956703)
.75625008
(.60146222)
.96296296
(.19245009)
0
(0)
.85185185
(.36201399)
0
(0)
44.979555
(6.1669395)
181.27454
(32.771194)
Orissa 12.686467
11.913483
7.0247693
(4.4366636)
.23813162
(.11900719)
1.5925926
(1.0473138)
.44444444
(.50636968)
1.5925926
(1.0473138)
.44444444
(.50636968)
37.428746
(5.2800976)
163.13633
(24.940058)
Punjab 47.485476
(32.442446)
59.334956
(43.911096)
10.079244
(7.244011)
.44444444
(.50636968)
0
(0)
0
(0)
0
(0)
39.130229
(9.1056205)
310.51623
(54.849542)
Rajasthan 9.0619182
(7.0503934)
4.8583491
(3.5324745)
2.5466465
(3.2740307)
0
(0)
.92592593
(.26688026)
0
(0)
0
(0)
24.094587
(4.2346769)
105.44194
(23.820186)
Tamil Nadu 31.847075
20.776005
38.254184
(23.959779)
1.2869367
(1.3329949)
3.3703704
(2.3558136)
0
(0)
.85185185
(.36201399)
0
(0)
46.727777
(4.5706332)
378.96908
(67.044567)
Uttar Pradesh 22.093067
(16.054211)
25.731485
(20.570406)
3.5140315
(3.2783384)
1.2222222
(.50636968)
1.2222222
(.50636968)
.88888889
(.32025631)
0
(0)
30.715685
(5.1523956)
384.61256
(71.985333)
West Bengal 18.641023
(13.900322)
17.186603
(14.436051)
.41891555
(.21431779)
2.4074074
(2.7632097)
0
(0) .11111111
(.32025631)
1.2592593
(1.3182912)
34.488889
(8.0296673)
694.01281
(104.89631)
Total 19.99648
(19.15639)
20.6589
(23.70937)
1.3395062
(1.4749239)
1.666667
(1.659945)
.34567901
(.5198355)
.70987654
(.71413936)
.2345679
(.60486377)
35.35007
(8.786237)
272.9791
(172.3785)
Standard deviations are in parentheses. Policy variables here are cumulative .

23
Graph 1. Cultivation of high-yielding varieties by state, 1961-1987
Graph 2. Use of nitrogen fertilizers by state, 1961-1987
050
100
050
100
050
100
1960 1970 1980 1990 1960 1970 1980 1990 1960 1970 1980 1990 1960 1970 1980 1990
ANDHRA PRADESH BIHAR GUJARAT KARNATAKA
MADHYA PRADESH MAHARASHTRA ORISSA PUNJAB
RAJASTHAN TAMIL NADU UTTAR PRADESH WEST BENGAL
Per
cent
of a
rabl
e la
nd u
nder
HY
V c
ultiv
atio
n
YearHYV Cultivation by State
050
100
150
050
100
150
050
100
150
1960 1970 1980 1990 1960 1970 1980 1990 1960 1970 1980 1990 1960 1970 1980 1990
ANDHRA PRADESH BIHAR GUJARAT KARNATAKA
MADHYA PRADESH MAHARASHTRA ORISSA PUNJAB
RAJASTHAN TAMIL NADU UTTAR PRADESH WEST BENGAL
Nitr
ogen
fert
ilise
r (k
g) p
er 1
000
hect
ares
Year
24
Graph 3. Use of tractors by state, 1961-1987
Graph 4. Adult male literacy by state, 1961-1987
010
2030
010
2030
010
2030
1960 1970 1980 1990 1960 1970 1980 1990 1960 1970 1980 1990 1960 1970 1980 1990
ANDHRA PRADESH BIHAR GUJARAT KARNATAKA
MADHYA PRADESH MAHARASHTRA ORISSA PUNJAB
RAJASTHAN TAMIL NADU UTTAR PRADESH WEST BENGAL
Num
ber
of tr
acto
rs p
er 1
000
hect
ares
Year
2030
4050
6020
3040
5060
2030
4050
60
1960 1970 1980 1990 1960 1970 1980 1990 1960 1970 1980 1990 1960 1970 1980 1990
Andhra Pradesh Bihar Gujarat Karnataka
Madhya Pradesh Maharashtra Orissa Punjab
Rajasthan Tamil Nadu Uttar Pradesh West Bengal
Pro
port
ion
of li
tera
te r
ural
mal
es
Year
25
Graph 5. Population Density by state, 1961-1987
Graph 6. Time patterns in adoption of reforms by states
0
200
400
600
800
0
200
400
600
800
0
200
400
600
800
1960 1970 1980 1990 1960 1970 1980 1990 1960 1970 1980 1990 1960 1970 1980 1990
Andhra Pradesh Bihar Gujarat Karnataka
Madhya Pradesh Maharashtra Orissa Punjab
Rajasthan Tamil Nadu Uttar Pradesh West Bengal
Pop
ulat
ion
Den
sity
per
sq.
km
Year
0
10
20
30
40
50
60
70
80
90
100
% o
f st
ate
s ad
op
tin
g la
nd
re
form
Year
% of states that adopted Tenancyreform% of states that adopted Abolition ofIntermediaries% of states that adopted Ceilings onLandholdings% of states that adopted LandConsolidation

26
Table 2. Model without controls
Proxy for Agricultural Modernization
Independent
Variables†
Percent of arable land under
HYV Cultivation
Nitrogen fertilizer (kg) per
1000 hectares
Number of tractors per 1000
hectares
All States
Omitting
Orissa,
Punjab, WB
All States
Omitting
Orissa,
Punjab, WB
All States
Omitting
Orissa, Punjab,
WB
Tenancy
Reform
11.02662*
(6.051959)
8.61807*
(6.782836)
10.82407**
(3.512668)
11.93709**
(3.761345)
2.357949
(2.222792)
-.619595
(.6818102)
Abolition of
Intermediaries
-2.471248
(2.900267)
-7.960314
(5.37688)
-3.000275
(3.262293)
-3.527083
(3.727334)
.0386495
(.7577602)
.1350503
(.6065539)
Ceilings on
Landholdings
-8.819762*
(4.687376)
-5.471219*
(2.774833)
-8.587642***
(2.379117)
-7.749901**
(2.57471)
-2.793975**
(1.588853)
-1.067678**
(.3481266)
Consolidation
of
Landholdings
-7.334357
(5.534906)
-.1144846
(2.912232)
-13.25483*
(5.318045)
-20.51412
(13.472397)
-3.901378
(2.640635)
-.526847
(.3348079)
State Effects Yes Yes Yes Yes Yes Yes
Year Effects Yes Yes Yes Yes Yes Yes
Number of
observations 324 243 324 243 324 243
***p-value<0.01(two-tailed) ** p-value<0.05(two-tailed) * p-value<0.1(two-tailed)
†Lagged three years.

27
Table 3. Model with controls
Proxy for Agricultural Modernization
Independent
Variables
Percent of arable land under
HYV Cultivation
Nitrogen fertilizer (kg) per
1000 hectares
Number of tractors per 1000
hectares
All States
Omitting
Orissa,
Punjab, WB
All States
Omitting
Orissa,
Punjab, WB
All States
Omitting
Orissa, Punjab,
WB
Tenancy
Reform†
8.363175***
(2.401633)
5.360868**
(2.389562)
17.79742***
(2.769908)
16.89981***
(2.067662)
1.207804
(.8574283)
.0686771
(.4632467)
Abolition of
Intermediarie
s†
1.17856
(6.188628)
-1.501876
(2.373807)
3.707263
(8.212468)
-2.082197
(1.219252)
-.2735785
(1.251748)
-.6670788
(.5612403)
Ceilings on
Landholdings
†
-9.728503***
(3.13531)
-6.758019***
(1.873321)
-10.02601**
(4.024114)
-11.39708***
(2.894311)
-1.449762**
(.6470855)
-1.2618089**
(.3906323)
Consolidation
of
Landholdings
†
-12.31301
(7.62311)
1.346743
(2.202735)
-25.65707
(19.635247)
-7.776746
(6.719468)
-3.340897**
(1.371805)
-.7520823
(.572114)
Agricultural
wages
.0314224
(.7013172)
-.0922043
(.2579142)
1.097835
(1.166794)
-.000029
(.8629584)
.6269102***
(.1213772)
.5375249***
(.1303203)
Price of
nitrogen
fertilizers
.0015644**
(.0005371)
.0010504**
(.0005601)
-.0024999**
(.0010933)
-.0026909**
(.0010193)
.000106
(.000169)
-.0000409
(.0001488)
Price of
tractors
-.0009761
(.0007122)
.0002135
(.000609)
.0006995
(.0011461)
.0011005
(.0008012)
-.0002728
(.0001825)
-.0000903
(.0001519)
Adult male
literacy rate
.8409483
(.9182304)
-.0183283
(.664608)
1.756633
(1.270786)
1.380318
(.8606877)
.4148198*
(.2079895)
.1715536
(.1748927)
Population
Density
12.87902*
(4.280222)
18.32071*
(3.017439)
16.9945**
(6.436987)
25.3438**
(7.245422)
-.4161889
(1.125384)
.8203281
(1.491791)
State Effects Yes Yes Yes
Year Effects Yes Yes Yes
Number of
Observations 324 243 324 243 324 243
***p-value<0.01(two-tailed) ** p-value<0.05(two-tailed) * p-value<0.1(two-tailed)
†Lagged three years.

28
Appendix B
29
Table (i) Model with 2- Year Lagged Policy Variables
Proxy for Agricultural Modernization
Independent Variables† Percent of arable land
under HYV Cultivation
Nitrogen fertilizer (kg)
per 1000 hectares
Number of tractors per
1000 hectares
Tenancy Reform 12.69228**
(6.991967)
22.33864**
(9.469537)
2.595405
(2.439108)
Abolition of Intermediaries -1.892634
(3.597069)
-1.325613
(4.665966)
.2464513
(.9572555)
Ceilings on Landholdings -8.682875**
(4.622924)
-10.85498
(8.50019)
-2.787256*
(1.527246)
Consolidation of
Landholdings -6.333719
(5.653868)
-18.95426*
(6.740289)
-4.019301
(2.746711)
State Effects Yes Yes Yes
Year Effects Yes Yes Yes
R2 0.8369 0.7174 0.5267
Comparison: R2 for model
with 3 year lagged policy
variables
0.8331 0.7277 0.5325
Number of observations 324 324 324
***p-value<0.01(two-tailed) ** p-value<0.05(two-tailed) * p-value<0.1(two-tailed) †Lagged two years.

30
Table (ii) Model with 4- Year Lagged Policy Variables
Proxy for Agricultural Modernization
Independent Variables† Percent of arable land
under HYV Cultivation
Nitrogen fertilizer (kg)
per 1000 hectares
Number of tractors per
1000 hectares
Tenancy Reform 9.056904
(5.970666)
21.09048**
(9.454282)
2.205381
(2.032204)
Abolition of Intermediaries -4.675932
(2.884371)
-5.436394
(3.15911)
-.0283578
(.63801)
Ceilings on Landholdings -8.339821
(5.321976)
-16.22744*
(8.490054)
-2.951244
(1.735175)
Consolidation of
Landholdings -5.345691
(5.370843)
-18.02254
(9.802707)
-3.830753
(1.829802)
State Effects Yes Yes Yes
Year Effects Yes Yes Yes
R2 0.4985 0.5831 0.3968
Comparison: R2 for model
with 3 year lagged policy
variables
0.8331 0.7277 0.5325
Number of observations 324 324 324
***p-value<0.01(two-tailed) ** p-value<0.05(two-tailed) * p-value<0.1(two-tailed) †Lagged four years.

31
Table (iii) Testing for endogeneity
Proxy for Agricultural Modernization
Independent Variables† Percent of arable land
under HYV Cultivation
Nitrogen fertilizer (kg)
per 1000 hectares
Number of tractors per
1000 hectares
Tenancy Reform lagged 3
years 8.771338
(5.116476)
21.07495**
(8.125317)
1.774308
(1.820989)
Abolition of Intermediaries
lagged 3 years -3.121611
(3.322412)
-3.340185
(4.789142)
.5888951
(.970375)
Ceilings on Landholdings
lagged 3 years -6.992334**
( 2.958452)
-13.51829*
(6.194977)
-2.369238*
(1.250229)
Consolidation of
Landholdings lagged 3
years
-5.258115
(5.661358)
-20.85578
(17.719391)
-4.495018
(3.892056)
Tenancy Reform leading 3
years
7.140596
(6.598919)
.2458572
(6.427783)
1.096318
(1.317986)
Abolition of Intermediaries
leading 3 years
.7081478
(2.855594)
5.940865
(4.858494)
5663996
(.900467)
Ceilings on Landholdings
leading 3 years
-3.167559
(3.924375)
7.687453
(5.134966)
.
2.116129
(1.327421)
Consolidation of
Landholdings leading 3
years
omitted omitted omitted
State Effects Yes Yes Yes
Year Effects Yes Yes Yes
Number of observations 324 324 324
***p-value<0.01(two-tailed) ** p-value<0.05(two-tailed) * p-value<0.1(two-tailed) †Lagged four years.