land policies, strategies and guidelines to … · land policies, strategies and guidelines to...
TRANSCRIPT

LAND POLICIES, STRATEGIES AND GUIDELINES TO STRENGTHEN INDONESIAN AGRARIAN REFORM
FINAL REPORT
SUBMITTED TO
THE NATIONAL LAND AGENCY – BADAN
PERTANAHAN NATIONAL REPUBLIC INDONESIA (BPN-RI)
and
THE WORLD BANK
UNDER ASUPICES OF LAND MANAGEMENT AND POLICY DEVELOPMENT PROGRAM
(LOAN/CREDIT NO. 4731/3884 - IND) FISCAL YEAR 2009
prepared by
Gerhardus Schultink
with Akhmad Safik
2010

2
Table of Contents Table of Contents 2 List of Figures 4 List of Tables 6 Ringkasan eksekutif 7 Executive summary 12 Foreword: Challenging opportunity 17 Acknowledgement 17 1. Introduction 18 1.1. Scope and objectives of this report 21 1.2. Development Planning and Quality of Life – Demand and Supply 22 1.3. Integrated rural development planning and sustainable land policies 26 1.4. Rural development planning and sustainable land use: Ind. Challenges 31 2. Concepts, principles, and guidelines for land policy formulation and development
planning 33 2.1. Focusing land policy and development initiatives: Applying the concept of
unrealized production potential 37 2.2. Land information system and indicators for land policy and development initiatives
39 2.3. Land evaluation and suitability assessment for land policy and development
planning 45 2.4. Land information system functions for suitability assessment, land policy
formulation and development planning 46 2.4.1. LIS components and analytical capabilities 47 2.4.2. Cadastral and LIS information 52 2.4.3. Institutional role of LIS/GIS in public policy 56 2.5. Integrated survey capacity 58 2.6. Land surveys for integrated data base development and land development 59 2.7. Guidelines and regulatory frameworks for land use policy and planning 63 2.7.1. Planning in the Netherland 64 2.7.2. Planning in the New Zealand 74 2.8. Guidelines and indicators for monitoring and evaluation 92 2.9. Agrarian reform, crop diversification and import substitution opportunities for rural
development in the Republic of Indonesia 98 2.10. Defining prototype homestead agro-forestry system and potential land utilization
system in pilot agrarian reform schemes 104 3. Indonesian land policy context 111 3.1. Land policy and BPN’s mandate 118 3.2. Recent BPN institutional policy initiatives 123 4. Framing the land policy and agrarian reform debate 125 5. Agrarian Reform in Indonesia 132 5.1. Land use and ownership 133 5.2. Land rights 139 5.3. The judiciary and land dispute 142

3
5.4. Local government 145 6. Land policy guidelines for Indonesian agrarian reform and rural economic
development 150 6.1. Challenges in Indonesian land reform 150 6.2. General guidelines for Indonesian land reform 154 6.3. Structuring agrarian reform 160 6.4. Selecting beneficiaries 162 6.5. Procuring land for distribution 164 6.6. Land tenure and administration alternatives 166 6.7. Land available for distribution 168 6.8. Prototyping land utilization for agrarian reform 173 6.9. Procedures of land acquisition 178 6.10. Some final issues 179 APPENDICES Appendix A: BPN Counterpart group – agrarian reform/land policy 182 Appendix B: Asian Development Bank meeting – 18 May 2009 183 Appendix C: List of Attendees BPN Needs Assessment meeting – 19 May 2009 184 Appendix D: List of Attendees meeting with the Directorate of Spatial Planning and
Land Affairs 186 Appendix E: Work schedule 187 Appendix F: List of attendees of the draft inception report review meeting, 4th floor of
the Central BPN office, 25 June 2009 188 Appendix G: Priority of land policy administrative issues as identified in qualitative
BPN staff survey and informal feedback 189 Appendix H: Recent BPN agrarian reform project 190 Appendix I: Case study survey on recent land reform initiatives, including land
sources, recipients, and aspects of implementation on Java, Lampung, Sulawesi (Celebes) and Kalimantan (Borneo) 192
Appendix J: List of attendees of the draft inception review meeting, 3th floor of the Central BPN office, September 4, 2009 195
Appendix K: List of attendees final draft report meeting, Dec 4, 2009 196 Appendix L: Case studies on recent land distribution projects 197

4
List of Figures
1.1. Impacts of environmental stress and degradation on natural resource, production capacity, social equity and security 24
1.2. Contextual policy linkages among quality of life, and the supply and demand of natural resource good and services 25
1.3. Fundamental linkages and effects among natural resources, quality of life and public policies associated with the use of natural resources 27
2.1. Relevant indicators, derived indices and linkages in natural resource production capacity assessment 34
2.2. Sustainable environmental management and planning using descriptive suitability indicators and composite indices of social preferences 36
2.3. The concept of unrealized production potential 38 2.4. Hierarchical information flow and use of basic data, indicators and indices in
development planning and public policy information 40 2.5. Major system linkages of resource assessment, land evaluation, economic
development planning and land use policy formulation 43 2.6. Three major components of a land information system. 47
2.6.1. Distribution of earthquake events 51 2.6.2. Earthquake events organized according to depth and impact 51
2.7. Land use and general parcel map of Ambon 52 2.8. Example of modern, large-scale cadastral map 54 2.9. National GIS-support functions 52 2.10. Institutional mandates for spatial planning in the Netherlands 68 2.11. Local planning unit (major municipality with minor towns or villages and
surrounding rural areas) 65 2.12. Municipal income sources 71 66 2.13. The ARGS Development Process 82 2.14. The growth concept: 2050 84 2.15. Structural and functional elements of pekarangan 106 2.16. Poultry pens situated over fishpond – efficient nutrient recycling in small scale,
subsystem, agro-forestry system 108 3.1. Land use distribution and regional land use intensity 111 3.2. Declining sawah areas on Kalimantan 112 3.3. Basic structure of BPN 119 4.1. Land policy analysis and formulation through land laws, regulations, planning and
economics incentives 125 5.1. The (US) “Bundle of private property right principle” 139 6.1. General outline of the Proposed agrarian reform process 160 6.2. Structural models for agrarian reform 161 6.3. Eligibility criteria for land distribution 163

5
6.4. Land acquisition and tenure arrangements for agrarian reform 164

6
List of Tables
2.1. Government organization of the Netherland 65 2.2. Land use policy institutions of the Netherland 66 2.3. Comparative world development indicators linked to the Eight Millennium
Development Goals for Indonesia (Source: the World Bank) 95 2.4. Indonesia fruits import (in tons) 99 2.5. Trend in Indonesia vegetable imports over a 13-year period 100 2.6. Fruits production in Indonesia, 1998-2007 (in tons) 101 2.7. Vegetable production in Indonesia, 1998-2007 (in tons) 102 2.8. Total and per square meter income originated from homestead plot 109 2.9. Homestead farmers’ response to the availability of credit 110 3.1. Progress of issuance of certificates in Indonesia 113 3.2. Target and realization of land certification in major regions 115 3.3. Land registration schemes and funding source in 2007 116 3.4. Cropland distributed in Indonesian land reform 121 3.5 Families receiving land in Indonesian land reform 122 5.1. Distribution of farming activities in Indonesia (1983-1993) 135 5.2. Distribution of agricultural land holdings in Indonesia (1993) 136 5.3. Profile of villages in Kecamatan Sumbang, Banyumas Regency 148 6.1. Size distribution of pekarangan land in agricultural provinces 174

7
RINGKASAN EKSEKUTIF
Dalam konteks pembangunan pertanian dan reformasi agraria, laporan ini membahas masalah-masalah yang berkaitan dengan reformasi pertanian dan penggunaan sumber daya alam, manajemen dan faktor sosial ekonomi dan dampak lingkungan di perdesaan dan penduduknya. Laporan ini mencakup aspek-aspek terkait peluang dan kendala produksi seperti tercermin dalam akses terhadap sumber daya agraria, hak kepemilikan, penggunaan dan hak eksploitasi, biaya input dan ketersediaan, dinamika pemanfaatan lahan, praktek manajemen, dan kemakmuran pedesaan serta keadilan sosial. Cakupan yang dibahas meliputi hukum dan peraturan yang ada, pengawasan tata guna lahan yang bersifat informal dan pemberian insentif yang membentuk dinamika penggunaan lahan di wilayah Republik Indonesia, serta dampak kebijakan mengenai distribusi manfaat yang diperoleh dan pengaruhnya kepada masyarakat. Pembangunan pertanian adalah salah satu agenda yang paling penting dari pemerintahan SBY yang baru. Prioritas kebijakan RI baru diidentifikasi meliputi ketahanan pangan, swasembada pangan di daerah, meningkatkan produktivitas pertanian, memperkuat hubungan intra-sektoral, peningkatan pendapatan masyarakat perdesaan, evaluasi subsidi, dan keadilan dalam perdagangan internasional. Dengan dominannya petani yang tidak memiliki lahan dan pertanian skala kecil, reformasi agraria merupakan elemen penting dalam mencapai tujuan-tujuan kebijakan ini. Hal ini memerlukan inisiatif kebijakan yang terfokus dan berdedikasi, yang tidak hanya menyelesaikan persoalan akses dan keamanan atas tanah, tetapi juga harga faktor-faktor produksi dan kebijakan yang efektif dalam upaya meningkatkan kelangsungan hidup perekonomian usaha tani berskala kecil. Skenario harga yang menguntungkan produsen harus dikombinasikan dengan peningkatan produktivitas untuk meningkatkan pendapatan masyarakat perdesaan, pengolahan pasca panen dan pemasaran. Dalam proses ini, peran dan kapasitas penyuluh pertanian dalam meningkatkan pengelolaan lahan sangat penting yaitu dengan menyediakan bantuan teknis yang efektif. Untuk mengembangkan kebijakan pertanahan nasional yang layak secara ekonomi dan ramah terhadap lingkungan, dokumen ini mendorong pengembangan kerangka perencanaan pemanfaatan lahan yang bersifat jangka panjang, transparan, hirarki, proaktif dan dapat dilaksanakan. Pelaksanaannya didasarkan pada biaya mobilisasi aset-aset sumberdaya alam secara efektif dan kapasitas produksi yang berkelanjutan untuk menghasilkan barang dan jasa. Hal ini memerlukan adanya konsolidasi, harmonisasi dan memusatkan kembali perhatian undang-undang dan peraturan yang ada untuk memobilisasi peluang produksi yang masih terpendam dan target pengembangan kembali tata guna tanah dan pembatasan, termasuk penggunaan yang efektif untuk mengontrol penggunaan lahan, serta insentif dan perpajakan. Perencanaan penggunaan tanah tersebut adalah prasyarat untuk pembentukan program pembangunan ekonomi pedesaan yang layak dalam upaya untuk mengoptimalkan peluang produksi, meningkatkan kemakmuran perdesaan dan mengurangi resiko dan dampak lingkungan.

8
Badan Pertanahan Nasional (BPN), dalam kerjasamanya dengan Badan Perencanaan dan Pembangunan Nasional (BAPPENAS) memiliki posisi yang baik dalam memimpin kebijakan pertanahan. Kebijakan pertanahan yang dilaksanakan mencakup berbagai aspek kepemilikan dan penggunaan tanah, manajemen konflik, dinamika penggunaan akses terhadap lahan. Dengan menggabungkan suatu perencanaan tata ruang secara sistematis, dengan masukan dari, dan dalam kemitraan dengan berbagai instansi pemerintah terkait lainnya (dengan menggunakan infrastruktur informasi dan data spasial nasional), agregat preferensi sektor ekonomi dapat dikaitkan dengan prioritas spasial di tingkat nasional, propinsi dan lokal (kabupaten). Hal ini akan menyediakan unsur-unsur penting dari provinsi dan rencana penggunaan lahan di daerah yang dirancang untuk mengoptimalkan penggunaan lahan, kebutuhan dan peluang produksi sumber daya alam, sekaligus mengurangi degradasi sumber daya alam dan melindungi lingkungan. Khususnya mencakup upaya pencegahan lebih lanjut terhadap degradasi sumberdaya agraria dan sumber daya air untuk kesejahteraan generasi mendatang dan melestarikan keanekaragaman hayati yang masih ada, tidak hanya membuat Indonesia menjadi unik, tetapi juga menyediakan potensi sumberdaya farmasi dan ekowisata yang sangat besar. Di Indonesia, Reforma Agraria didefinisikan sebagai Land Reform (LR) + Access Reform (AR). Komponen pertama berhubungan dengan aspek-aspek ketersediaan lahan, kepemilikan, hak, jaminan atas hak dan pemanfaatan tanah, sedangkan yang terakhir membahas faktor yang mempengaruhi produktivitas lahan, ketersediaan faktor-faktor produksi, biaya dan kelangsungan hidup ekonomi (laba bersih per hektar). Kelangsungan hidup ekonomi berhubungan dengan kualitas tanah - seperti yang didefinisikan dalam kapasitas produksi agro-ekologi, yang dikombinasikan dengan kesesuaian lahan – lahan. Ketika penggunaan pilihan-pilihan khusus dievaluasi, dalam konteks biaya faktor-faktor produksi dan harga produk, akan menunjukkan potensi hasil bersih yang dapat diperoleh. Untuk membuat reformasi agraria sebuah kemungkinan yang nyata, disarankan agar evaluasi tanah secara sistematis (penilaian biofisik atas kesesuaian lahan dan sosial ekonomi dengan kriteria pemanfaatan lahan) dilakukan untuk: (1) Memfasilitasi pembangunan tingkat nasional, menetapkan prioritas makro-sektoral,
dan membangun prioritas rencana pembangunan ekonomi 10 tahunan yang mencakup perumusan dan artikulasi yang jelas dan prioritas kebijakan sektor (pertanian, kehutanan, pariwisata, perikanan, pembangunan ekonomi, pertumbuhan manajemen, kontrol populasi, perumahan, manufaktur, layanan dan infrastruktur fisik, sumber daya ekstraktif, pengelolaan lingkungan, dll) dan menghasilkan hubungan spasial dengan zonasi penggunaan lahan nasional berdasarkan penilaian keunggulan komparatif daerah yang obyektif;
(2) Merumuskan Master Plan Tata Guna Tanah tingkat provinsi yang lebih detail dan
identifikasi secara spasial prioritas sektor dan zonasi di tingkat provinsi, dan akhirnya;
(3) Mengembangkan Master Plan Tata Guna Tanah tingkat kabupaten dan peraturan
zonasi yang secara hukum harus ditegakkan untuk memperjelas pengertian pembangunan (jenis dan intensitas), konservasi lahan dan kawasan lindung serta
9
prioritasnya, sambil menggunakan kriteria evaluasi lahan dan kriteria keberlanjutan untuk menerjemahkan konsep menjadi kenyataan.
Kerangka kerja perencanaan penggunaan lahan yang hierarkis seperti itu saling memperkuat dengan menghubungkan prioritas nasional - dipandu oleh potensi aset sumber daya yang terdefinisi dengan baik (misalnya agro-ekologi dan pertimbangan kesesuaian lingkungan dan ekonomi evaluasi tanah) - untuk prioritas provinsi dan penggunaan lahan di tingkat kabupaten, harus didefinisikan secara spasial. Perumusan rencana tata guna tanah tingkat propinsi dan kabupaten juga harus mencakup pemerintah yang secara hukum memeiliki mandat dan tinjauan perencanaan publik (dengan berbagai stakeholder, input dan prosedur) dan mengizinkan proses (transparansi dan tinjauan pembangunan yang obyektif, konsesi dan izin bangunan) yang memastikan bahwa rencana penggunaan lahan provinsi dan kabupaten mencerminkan, memperkuat dan memberikan gambaran detail secara berurutan, prioritas nasional dan propinsi, di tingkat implementasi. Dalam kerangka perencanaan tata ruang, berikut adalah rekomendasi tindakan utama (100 hari, 1 - 5 tahun) yang disarankan: • Integrasi formal antar lembaga yang memiliki fungsi perencanaan tata ruang (seperti
yang diselenggarakan oleh Badan Pertanahan Nasional (BPN), Badan Perencanaan dan Pembangunan Nasional (BAPPENAS), Departemen Pekerjaan Umum, Badan Koordinasi Survey dan Pemetaan Nasional (BAKOSURTANAL), dan berbagai kementerian yang mencakup sumber daya alam - seperti pertanian, kehutanan dan lingkungan, dalam suatu gugus tugas inter-institusi yang memprioritaskan, mengartikulasikan dan memiliki inisiatif untuk mengembangkan program secara langsung dengan tujuan untuk merumuskan Rencana Spasial Pembangunan Ekonomi Nasional 10 Tahunan (100 hari - 2 tahun, masing-masing). Proses ini akan mencakup tinjauan dan pembaharuan atas rencana tata ruang wilayah yang ada (menggunakan informasi yang selalu diperbaharui) untuk memastikan konsistensi dengan prioritas nasional dan daerah yang berdekatan.
• Mempercepat konsolidasi dan restrukturisasi hukum dan kebijakan pertanahan untuk
menyelaraskan dan memperjelas sektoral, nasional, regional dan mandat lokal dan kewenangan secara hukum untuk merencanakan tata ruang dan tanggung jawab untuk mengembangkan master plan penggunaan lahan secara nasional 10-tahun, regional dan lokal selama 5 tahun. dan perencanaan tata guna tanah di tingkat dan pelaksanaan dalam bentuk peraturan hukum yang konsisten dengan rencana regional dan nasional (1-2 tahun). Ini harus mencakup klarifikasi dan diundangkannya peraturan yang bersangkutan serta sertifikasi hak atas tanah (misalnya hak milik) dan hak-hak pakai untuk individu dan perusahaan yang bersifat permanen, idealnya harus disederhanakan dan direstrukturisasi ke rezim freehold dan leasehold.
• Mempercepat program-program pendaftaran tanah melalui pengembangan kapasitas
kelembagaan dan mengurangi hambatan untuk pendaftaran, termasuk menurunkan (mempertimbangkan kemampuan membayar) atau penghapusan biaya pendaftaran pertama kali. Hal ini harus meliputi perampingan dari sistem pendaftaran tanah dan

10
pengurangan biaya transaksi dalam bentuk digital dan konsolidasi dengan catatan pajak untuk menjamin pengkajian pajak di masa mendatang dan meningkatkan pendapatan pajak yang akan lebih besar dari biaya subsidi pendaftaran percetakan.
• Mempertimbangkan formalisasi penguasaan tanah masyarakat (keamanan tanah adat
di masyarakat) bersama-sama dengan hak atas tanah tanah pribadi yang didasarkan pada kepentingan keamanan dalam jangka panjang untuk membantu mobilisasi aset, modal dan investasi dan produktivitas yang belum tergali. Izin penyampaian kepemilikan tanah secara formal jangka panjang yang terbatas dan terbarukan dengan menggunakan kriteria seleksi dan prosedur yang objektif dan transparan.
• Memperjelas otoritas hukum untuk mengambil hak milik pribadi untuk barang publik
( hak mencabut hak atas tanah/eminent domain) sambil menyediakan tinjauan umum yang transparan dan tidak memihak, prosedur banding dan kompensasi yang adil pada nilai pasar yang wajar yang ditentukan oleh penilai independen (1 tahun).
• Menetapkan Multi-institusi Gugus Tugas Identifikasi Aset Pertanahan dengan
tanggung jawab utama untuk melakukan inventarisasi lahan yang tersedia untuk distribusi secara sistematis, akurat dan lengkap sesuai dengan wilayah sasaran (penduduk berdasarkan kebutuhan, lihat di bawah). Inventarisasi ini harus meliputi aspek kualitas tanah bio-fisik dan pemeringkatan produktivitas pertanian dengan irigasi dan tadah hujan yang menghasilkan pembentukan Bank Tanah daerah. Ketersediaan tanah dan kriteria seleksi akan mencerminkan kategori yang didefinisikan secara hukum, seperti menganggur, kelebihan maksimum dan tanah absentee yang dimiliki oleh entitas publik dan swasta, termasuk seluas 7 juta hektar lahan yang telah diidentifikasi oleh BPN (1-2 tahun)
• Menetapkan Lembaga Multi-akses suatu Gugus Tugas untuk Memobilisasi Akses
Terhadap Tanah dengan tanggung jawab utama untuk memobilisasi produktivitas lahan yang belum tergali dengan memastikan adanya akses terhadap tanah yang aman (keamanan hak atas tanah dan jaminan) dan ketersediaan biaya efektif modal mikro dan biaya faktor-faktor produksi bagi pemilik tanah skala kecil, bantuan teknis untuk pengelolaan pertanian, koperasi usaha, produk dan pengembangan rantai pemasaran (1-2 tahun).
• Menetapkan lembaga Multi-institusi dengan Gugus Tugas untuk Penilaian Kebutuhan
dengan tujuan utama untuk mengidentifikasi prioritas daerah penerima program distribusi tanah berdasarkan kriteria penerima manfaat secara hukum yang jelas dan ketersediaan bank tanah regional. Pastikan bahwa kriteria yang ada diartikulasikan dengan baik, dipahami dan dilaksanakan secara objektif dan transparan dalam program distribusi tanah di daerah. (1 tahun)
• Pembentukan lembaga multi-institusi Gugus Tugas Sistem Informasi Pertanahan
dengan tujuan utama untuk mengembangkan Sistem Informasi Spasial yang terintegrasi yang meliputi catatan pajak atas properti dan bidang tanah terbaru, dan data survei bidang tanah yang terhubung dengan identitas kepemilikan tanah # untuk

11
membantu penilaian lahan, perpajakan, pengumpulan, pengelolaan lahan, transaksi pertanahan dan pendaftaran hak atas tanah. Sistem ini harus terhubung dengan jaringan (dengan protokol keamanan) secara nasional, regional dan kantor lokal dan kompatibel dengan penutup lahan / penggunaan lahan dan data evaluasi tanah, termasuk topografi, tanah, hidrologi, iklim dan data kependudukan. (5 tahun)
• Tetapkan Gugus Tugas Penguasaan dan Administrasi Pertanahan dengan tanggung
jawab untuk menentukan jenis penguasaan tanah dan hak pakai dari sistem non-tradisional dan masyarakat adat, dengan tujuan untuk menentukan dan memastikan hak pakai jangka panjang atas tanah, mempromosikan pemanfaatan tanah yang berkelanjutan dan mencegah spekulasi tanah dan eksploitasi sumber daya, sambil mengurangi dampak lingkungan dan resiko atas manusia. Hal ini harus meliputi program percontohan untuk mengidentifikasi parameter optimal daerah untuk pekarangan yang mewakili sistem pertanian skala rumah tangga sebagai tambahan pendapatan dan sumber-sumber nutrisi yang didasarkan pada penggunaan lahan yang mengintegrasikan agro-forestry, ternak dan perikanan (1 - 5 tahun)
• Tetapkan Gugus Tugas Manajemen Konflik Pertanahan dengan tujuan untuk
meninjau ulang, menurunkan dan mengurangi konflik pertanahan dengan meningkatkan manajemen dan praktek resolusi konflik, merekomendasikan praktek dan prosedur untuk menjamin akuntabilitas publik dan pelaksanaan penegakan hukum yang tidak memihak dan transparan. Ini harus mencakup standar pembuktian untuk tanah dan identifikasi hak atas tanah dengan standar yang jelas dan aturan untuk untuk melakukan klaim atas tanah (sedang berlangsung)
• Meningkatkan kerjasama dalam pengembangan sumber daya manusia dan kapasitas
kelembagaan seperti yang ada saat ini dengan Swedia, Belanda, Australia dan kalangan akademik dan profesional dari Amerika Serikat, yang terkait analisis dan formulasi kebijakan pertanahan, desain dan pengelolaan sistem informasi pertanahan, dan perencanaan pembangunan ekonomi melalui training pasca-sarjana atau kursus pelatihan singkat. (sedang berjalan)
• Untuk menarik investasi asing, dengan mempertimbangkan secara terbuka dan
selektif untuk memungkinkan dan merangsang kepemilikan properti asing yang kini sering dilakukan dengan menggunakan perusahaan lain (yang diajukan) atau nominator yang menghasilkan biaya transaksi yang lebih tinggi, ketidakpastian dan membatasi investasi.
• Untuk mengurangi korupsi dan kolusi dalam urusan tanah, memperjelas dan
menyederhanakan semua kriteria alokasi lahan dan prosedur untuk distribusi tanah, sertifikasi, akuisisi, dan transformasi (dan rezoning) kepentingan atas tanah dengan menyediakan regulasi yang transparan, dokumen publik dengan tanah dan informasi pajak yang bersifat online yang bersifat online, dan menyediakan proses hukum (prinsip-prinsip dasar keadilan) untuk gugatan oleh publik dan upaya banding.
12
EXECUTIVE SUMMARY
In the context of agricultural development and agrarian reform, this report addresses issues associated with the reform of agricultural and natural resource use, management and resulting socio-economic and environmental impacts on rural areas and their populations. Related aspects include production opportunities and constraints as reflected in land resource access, tenure regimes, use and exploitation rights, input cost and availability, land use dynamics, management, rural prosperity and social justice. Boundary conditions discussed include the existing legal and informal land use controls and incentives that shape land use dynamics in the Republic of Indonesia, and the policy effects on the distribution of associated benefits for and impacts on its people. Agricultural development is one of the most vital agendas of the new SBY administration. New RI policy priorities identified include food security, regional food self-sufficiency, improving agricultural productivity, strengthening intra-sectoral linkages, improving rural incomes, evaluation of subsidies, and fairness in international trade. With the dominance of land-less and small-scale farming, agrarian reform is a critical element in addressing these policy objectives. This will require a focused and dedicated policy initiative that not only addresses land access and security but also input and pricing policies that are effective in improving the economic viability of small-scale farms. Price scenarios that benefit producers have to be combined with increases in productivity to improve rural incomes, post-harvest processing and marketing. In this process, the role and capacity of agricultural extension in improving farm management by providing effective technical assistance, is also essential. To foster economically viable and environmentally sustainable national land policies, this document encourages the development of a long-term, transparent, hierarchical, pro-active and enforceable land use planning framework. Its implementation is based on the cost-effective mobilization of natural assets and their sustainable production capacity to generate natural resource goods and services. This will require, foremost a consolidation, harmonization and refocusing of existing laws and regulations to mobilize latent production opportunities and target land use (re)development and restrictions, including the use of effective land use controls, incentives and taxation. Such land use planning is the precondition to the establishment of a viable rural economic development program that seeks to optimize production opportunities, promote rural prosperity and reduces environmental impacts and risk. The National Land Agency (BPN), in close cooperation with the National Development Planning Agency (BAPPENAS), is well-positioned to provide land policy leadership in this effort. Its Land Affairs programs address various aspects of ownership and use rights, conflicts management, land use dynamics and access. By incorporating a systematic Spatial Planning Program with input from, and in partnership with, other relevant government agencies (using the appropriate National Spatial Data Information Infrastructure), aggregate economic sector preferences can be related to spatial priorities

13
at the national, provincial and local (regency) level. This will provide the essential elements of provincial and local land use plans that are designed to optimize land use benefits, given natural resource production opportunities and needs, while reducing resource degradation and protecting the environment. This specifically should include the prevention of further degradation of land and water resources to safeguard the well-being of future generations, and preserve the remaining biodiversity that not only makes Indonesia unique, but also provides enormous ecotourism and pharmaceutical potential. In Indonesia, Agrarian Reform is defined as Land Reform (LR) + Access Reform (AR). The first component deals with the aspects of land availability, tenure, title security and use rights, while the latter addresses the factors affecting land productivity, input availability, cost and economic viability (net returns per hectare). The economic viability relates to land qualities - as defined in agro-ecological production capacity, combined with land suitability – when specific land use options are evaluated in term of input cost and product prices, denoting potential net returns. To make real agrarian reform a possibility, it is recommended that a systematic land evaluation (land suitability assessment using biophysical and socioeconomic land use criteria) be conducted to: (1) Facilitate the development of national-level, macro-sectoral priorities and define a 10-year economic development plan that includes the formulation and clear articulation of sector and policy priorities (agriculture, forestry, tourism, fisheries, economic development, growth management, population control, housing, manufacturing, physical and service infrastructure, resource extraction, environmental management, etc.) and resulting spatial linkages with national land use zoning based on an objective assessment of regional comparative advantages; (2) Formulate Provincial Master Land Use Plans to further detail and spatially identify sectoral priorities and priority zones at the provincial level; and finally (3) Develop Local or Regency Land Use Master Plans and Legally Enforceable Zoning Ordinances to clearly define development (type and intensity), land conservation and preservation zones and priorities, while using land evaluation and sustainability criteria to translate development concepts into reality. Such hierarchical land use planning framework is mutually reinforcing by linking national priorities -- guided by well-defined resource assets potential (e.g. agro-ecological and environmental suitability considerations and economic land evaluation) -- to provincial and local land use priorities, spatially-defined. This formulation of provincial and regency plans should also include legally mandated government and public planning reviews (with various stakeholder inputs and procedures) and permitting processes (transparent and objective reviews of development, concessions and building permits) that ensure that provincial and local land use plans reflect, reinforce and detail respectively, national and provincial priorities, at the levels of implementation.
14
Within this Spatial Planning framework, the following major Action Recommendations (100 days, 1 - 5 years) are suggested:
A formal integration of current inter-agency spatial planning functions (such as held by BPN, BAPPENAS, the Ministry if Public Works, the national mapping agency and the various natural resources ministries - such as agriculture, forestry and environment, within a multi-agency task force to prioritize, articulate and direct programmatic initiatives with the ultimate goal to formulate a 10-year National Spatial Economic Development Plan (100 days – 2 years, respectively). This process would include a review and updating of existing regional spatial master plans (using up-to-date information) to ensure consistency with national priorities and adjacent regions.
Accelerate the consolidation and restructuring of land policy laws to harmonize
and clarify sectoral, national, regional and local mandates and legal authorities for spatial planning and responsibilities for developing 10-year national and 5-year Regional and Local Land Use Master Plans and their local implementation in the form legal ordinances, and consistent with regional and national plans (1-2 years). This should include the clarification and promulgation of pertinent regulations and certification of land titles (e.g. hak malik) and permanent use rights to individuals and companies, ideally to be simplified and restructured into freehold and leasehold regimes.
Accelerate land registration programs by institutional capacity development and
reducing impediments to registration, including the lowering (payment capacity consideration) or elimination of initial registration fees. This should include a streamlining of the land registration system and reduction of transaction cost in digital form and consolidation with tax records to assure future tax assessment and enhance tax revenues that will more than off-set registration subsidies
Consider the formalization of community land holdings (land security in adat
communities) together with private land titles based on long-term security interest to help mobilize assets, capital and investments and latent productivity. Permit the formal conveyance of land titles that are long-term limited and renewable using objective and transparent selection criteria and procedures.
Clarify Public Legal Authority to take private property for the public good
(“eminent domain”) while providing for transparent and impartial public review, appeal procedures and just compensation at fair market values as determined by independent arbitration. (1 year)
Establish a multi-agency Land Asset Identification Task Force with the major
responsibility to conduct a systematic, accurate and complete inventory of available land for distribution in targeted (population need-based, see below) areas. This inventory should include bio-physical aspects of land quality and agricultural productivity ratings under irrigated and rain-fed conditions, and result

15
in the establishment of Regional Land Banks. Land availability and selection criteria will reflect the legally defined categories, such as idle, excess and absentee-land held by private and public entities, including the currently 7 million hectares already identified by BPN (1-2 years)
Establish a multi-agency Land Access Mobilization Task Force with the major
responsibility to mobilize latent land productivity by ensuring secure access to land (title security and insurance) and the cost-effective availability of micro-capital and material inputs for small-scale landowners, technical assistance for farm management, cooperative ventures, product and value-chain development. (1-2 years)
Establish a multi-agency Needs Assessment Task Force with the major goal to
identify priority recipient areas for land distribution based on clear legal beneficiary criteria and regional land bank availability. Ensure that criteria are well-articulated, understood and implemented in an objective and transparent manner in regional land distribution programs. (1 year)
Establishment a multi-agency Land Information System Task Force with the
major goal to develop an integrated Spatial Information System that includes complete and current property and parcel tax records, and parcel survey data linked by ownership ID # to facilitate land valuation, taxation, collection, land management, property transactions and title registration. This system should be networked (with security protocols) with national, regional and local offices and compatible with land cover/use and land evaluation data, including topography, soils, hydrology, climate and population data. (5 year)
Establish a Land Tenure and Administration Task Force with the responsibility to
define the most appropriate land tenure and use rights regimes in non-traditional and adat communities with the goal to define and ensure long-term individual use rights, promote sustainable use and prevent land speculation and resource exploitation, while reducing environmental impacts and human risk. This should include a pilot program to identify the optimum regional parameters for homestead garden or “Pekarangan” systems representing small household farming systems as supplemental income and nutrition sources based on land use that integrates of agro-forestry, live stock and fisheries (1 – 5 year)
Establish a Land Conflict Management Task Force with the goal to review,
reduce and mitigate land conflicts by improving management and resolution practices and recommend procedures to ensure public accountability, and the impartial and transparent implementation of the rule of law. This should include evidentiary standards for land and title identification and clear standards and rules for land claims (on-going)
Expand existing cooperation in human resource and institutional capacity
development such as currently existing with Swedish, Dutch, Australian and US
16
academic and professional institutions related to land policy analysis and formulation, land information system design and management, and economic development planning though post-graduate training an short courses. (on-going)
To attract foreign investments, consider openly and selectively allowing and
stimulating foreign property ownership, now frequently accomplished by the use of shell companies or nominees that result in higher transaction cost, uncertainty and restrict investments.
To reduce corruption and collusion in land affairs, clarify and streamline all land
allocation criteria and procedures for land distribution, certification, acquisition, and transformation (and rezoning) of interest in land by providing regulatory transparency, on-line public records with land and tax information, and provide due process (fundamental principles of justice) for public review and appeal.

17
A CHALLENGING OPPORTUNITY With the advent of the newly inaugurated administration of the Republic of Indonesia in the fall
of 2009, Land Policy and Economic Development enters into a new era of challenges and
opportunities. Challenges are many. They include the traditional socio-economic, cultural and
political challenges, but also the various needs for legislative and executive reform. These
challenges come with an even greater set of opportunities; to mobilize the enormous and diverse
natural assets of the nation and create a better quality of life for all, while recognizing
environmental carrying capacity constraints, and thereby ensuring a prosperous future for its
citizens
Therefore, the overarching framework is the paradigm of sustainable development--integrating
natural resources capital with economic and social capital, to define and select land use
alternatives that are socio-economically viable and acceptable, while preserving ecological
integrity and productivity. The overall goal of such a strategic planning initiative is to create
solutions that are ecologically restorative and socially just, and that promote a reliably prosperous
society, long-term.
The staff of the various key government agencies referred to in this document are instrumental in
meeting these challenges: the formal responsibility, as envisioned in the tasks of talented
professionals to achieve these goals with commitment and dedication within their institutional
mandates; and the informal intergenerational responsibility, shared by many in Indonesian
society, namely to fashion a sustainable and equitable future for its people.
ACKNOWLEDGEMENTS We thank the staff of BPN for their dedicated support associated with this project. Names are too
many to cite and are listed in the various appendices. They include staff from the central BPN
offices in Jakarta, the various field offices involved in coordinating the case study field visits
listed in the various project locations. We also thank the academic staff from Lampung University
and Bogor Agricultural Universities. In particular, we like to thank the team members of the BPN
Land Policy Working group and our colleagues from the various other components of the Land
Management and Policy Development Project, including BAPPENAS.

18
INTRODUCTION Agrarian Reform, as an effective land policy program with the goal to improve
performance and societal benefits of the agrarian sector, is part of coordinated, long-term
economic development planning. Its primary goal is to encourage productive and
sustainable land uses that enhance benefits and societal prosperity. As such, it
encompasses various policy components. They include:
Natural resources assessment to define the sustainable production capacity of the
land resource base -- the complex of resources assets available for the production of
food and cash crops and the provision of other goods and services, based on the long-
term agro-ecological capacity to sustain production opportunities.
Land use planning and zoning to promote economic development -- the development
of guidelines and regulations to allocate land resources to sustainable land uses that
are socio-economically viable and environmentally acceptable (and in harmony with
the long-term agro-ecological production capacity)
Land policy reform by restructuring land policies and laws to optimize tenure
regimes and land rights to promote sustainable use, social equity and prosperity --
the utilization of the land resource base to promote the optimum allocation of human,
capital and land resources to promote household and societal welfare
Access reform to improve the conditions of land resource allocation in combination
with fixed and variable capital inputs, transportation, processing and marketing
infrastructure to maximize profitability.
For national agencies, such as BPN and BAPPENAS to carry out this mandate in
cooperating with sector partners such as the Ministries of Agriculture and Forestry, a
comprehensive and systematic program design is required together with a sustained and
effective implementation capacity. This not only requires the institutional capacity to
carry out such responsibilities but also monitoring and evaluation to assess program
effectiveness and assure the timely attainment of goals and objectives using key
performance indicators.

19
This report addresses the components listed above with respect to the strategic and
programmatic initiatives. First, it introduces highly-relevant concepts, analytical
procedures, guidelines and essential survey and information systems capabilities for land
use planning, policy formulation and development planning. Then, it addresses specific
agrarian reform issues related to the mandates of BPN and partner institutions. As such,
the report also includes:
a) A review of existing RI policies affecting agrarian reform issues based on literature
study, field research, and personal discussions, in particular relevant national policies
associated agricultural sector policies. It also suggests cross-institutional cooperation
related to land policy. The analysis provides a review of the major policies affecting land
use and land use conflicts, while suggesting future policy directions;
b) A comparative perspective on land policy and land use planning with model regulatory
frameworks from other countries, such as the Netherlands and New Zealand, is provided.
It is expected that these example may be used to help to ultimately structure a long-term
regulatory framework that seeks to establish economically viable and environmentally
acceptable land use at the national, regional and local levels; and
c) Suggested strategic initiatives and actions to address key issues/problems related to
land policy and agrarian reform (with an executive summary).
The research framework -- the context of land management and land use planning,
includes the legal and economic development dimensions of relevant land policy issues
and strategic initiatives, associated with an effective agrarian reform program. Emphasis
is placed on program guidelines, operational characteristics and potential benefits of an
outcome-oriented agrarian reform program, including the reduction or elimination of
implementation constraints.
Case studies were completed by reviewing the most significant Agrarian reform projects
recently conducted by BPN, such as on South Sulawesi, Lampung and locations on Java
(Appendix H) using interviews with stakeholders and BPN staff guided by questions
identified in Appendix I
20
The implied objectives of an agrarian reform program in the RI include:
improved social wellbeing of the rural poor and disenfranchised – including
improved income, employment, nutrition and social status
reduced social inequity as manifested in improved land access, control and
title security, use rights, income distribution, education opportunities, health
care and other public services
increasing productivity of idle or underutilized land
formalization of ownership and use rights through accelerated, transparent and
cost-effective land certification
reduction of legal ambiguity and duplicity through review, harmonization and
consolidation of land laws, regulations, and associated implementation and
institutional mandates
reduction of land disputes and conflicts through effective, transparent and
objective title certification and arbitration
the mobilization of latent capital assets in land holdings through ownership
formalization to stimulate capital access, productivity and regional economic
development
improved collateral leverage to reduce interest rates on farm loans to secure
operating capital and finance capital improvements
increased land productivity for food and cash crops and related import-
substitution opportunities including the benefits of potential value chains
associated with small-scale, cooperative fruits and vegetable production
increased tax revenues for rural infrastructural improvement resulting from
improved productivity and land administration
agro-ecological zoning, land suitability assessment and spatial planning to
articulate economic development guidelines based on land evaluation
improved spatial data management and analysis capacities to generate
comprehensive, accurate, net-worked, secure and timely information
accelerated, long-term economic growth based on sustainable land
management and conservation practices
reduced social unrest, and

21
improved political stability
improved administrative capacity and effectiveness of key agencies, such as
BPN and BAPPENAS through human resource and infrastructural
development, including integrated cadastral and Land Information Systems
(LIS).
1.1 Scope and Objectives of this Report This land policy advisory note seeks to assist the BPN in developing policies, strategies and
program proposal to (a) foster a proposed Agrarian Reform program; and (b) develop a suitable
Land Information System. The assistance provides advice on the following:
a. Sharpening the land policy focus towards a more detail formulation of approaches for implementing policies, strategies, impact and risk analyses, and develop a program proposal to strengthen agrarian reform and economic development;
b. Initiating pilot activities related to land policy implementation;
c. Planning and implementing capacity building to strengthen NLA-RI institutional capabilities in above areas.
Analytical elements include:
a. Analysis of existing RI policies affecting agrarian reform issues, in particular national land policies, directly-related sector policies, and required cross-institutional cooperation;
b. A review of current status and policies directions for the future; c. Assistance to BPN in formulating a coherent and comprehensive guidelines and strategies
for implementing the agrarian reform policy, in line with BPN and other GOI’s institutional mandates and principles, and in coordination with BPN management and senior officials and with outside stakeholders as identified and invited by BPN;
d. Assistance to BPN to develop an operational proposal for a related BPN Strategic Plan and Land Information System (LIS) in particular on agrarian reform (in line with broader LIS design). This task has to be linked to broader monitoring and evaluation (M&E) required for the agrarian reform and established linkages in data-base management;
e. Support to plan, implement and manage capacity building programs, in coordination with BPN, to strengthen technical capacity in related areas of expertise. The capacity building reflects policy analyses, exchange of experiences and M&E.
Outputs include:
a. This analytical policy note based on a comprehensives review as indicated above.
22
b. Draft guidelines and strategies to support implementation of an agrarian reform program, including aspects of monitoring and management strategies along with a list of suggested key activities/programs;
c. Proposed capacity building to develop a core team in NLA-RI capable of guiding agrarian reform efforts.
1.2 Development Planning and Quality of Life – Demand and Supply Considerations
The primary goal of development planning is to improve the quality-of-life of human
populations by means of a systematic evaluation, selection and implementation of
sustainable development alternatives (the so-called Land Utilization Types of LUTs) that
reflect both environmental constraints and opportunities. Here, sustainable development
means the promotion of development policies and plans with carefully-defined goals and
objectives that aim to achieve a sustainable flow of goods and services that enhance
human quality-of-life. More precisely, sustainable development must ensure that public
policies are based on the selection of development alternatives that are both ecologically
and politically sustainable and socio-economically viable. As such, sustainable
development addresses the development and management of environmental resources to
ensure or enhance the long-term productive capacity of the resource base with the goal
to improve long-term societal wealth and individual quality-of-life.
A primary challenge in this public policy formulation process is to balance the
environmental capacity (production rates) and the derived supply of natural resource
goods and services with demographic demand and, thereby, ensuring that sustainable
production capacities are not exceeded, and natural resources degradation is prevented. In
a policy analysis context, determining supply means a systematic assessment of the
resource production capacities by location and over time. This assessment must result in
quantitative indicators, which directly reflect expected resource production outputs
(complex goods and services) using production scenarios based on the long-term
production capacity and environmental quality of the natural resources. Demographic or
societal demand needs to reflect to the available supply of natural resource and its
performance – its capacity to deliver goods and services, specifically the ability to affect
23
quality of life by creating a better place to live -- more capable, productive and efficient
in meeting human needs.
The notion of developing comprehensive policies that promote sustainable use of natural
resources, maintain resource production capacity and prevent resource degradation was
adopted by various UN conferences and supported by many international development
agencies. This is especially critically important to nations with lesser discretionary income
to meet national demand with the import of essential food commodities or other natural
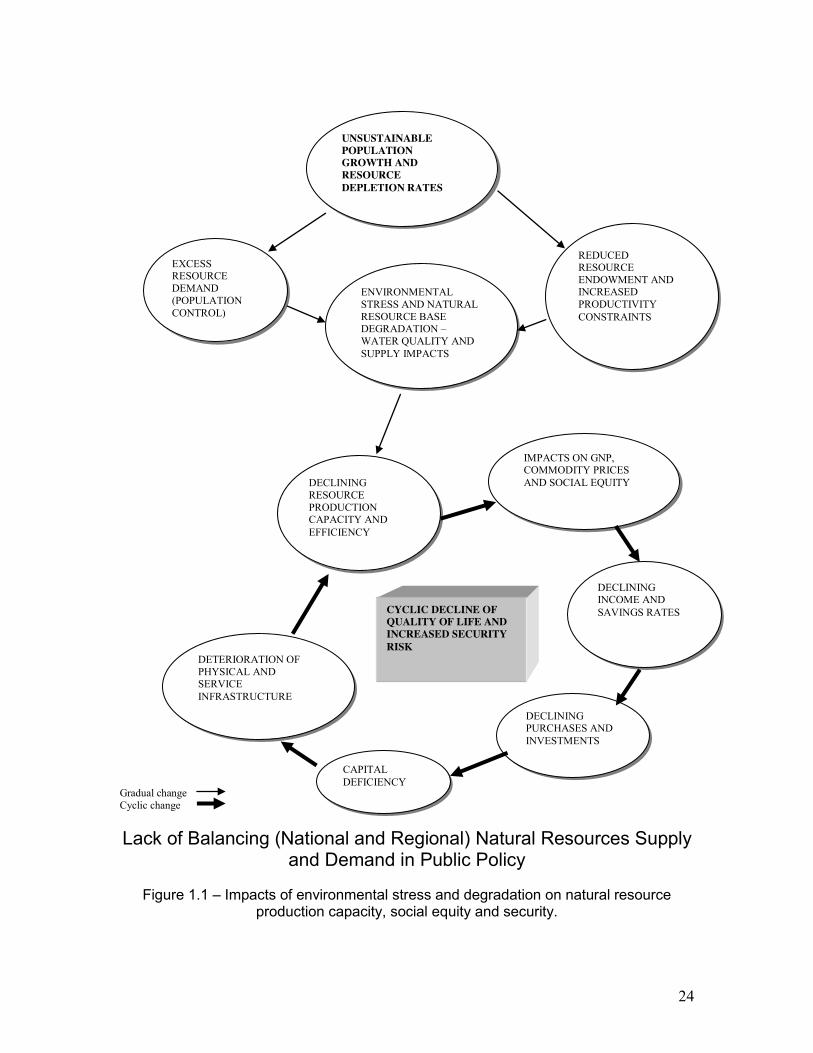
resource products. For these nations, this translates into policies that prevent declining
production capacity or reverse trends in environmental degradation, thereby preventing
spiraling effects of economic decline, as depicted below (Figure 1.1).
On the demand side, concerns about population growth and its impacts were not only
expressed at the aggregate national levels but also in terms of population distribution and
dispersion. High population growth concentrated in metropolitan areas has, in many nations,
caused crises of food security and deteriorating conditions in urban agglomerations where
rapid population increases and service demands have outpaced even the most basic
infrastructural needs, such as a safe drinking water supply, sewage disposal and treatment,
and general education and health care facilities.
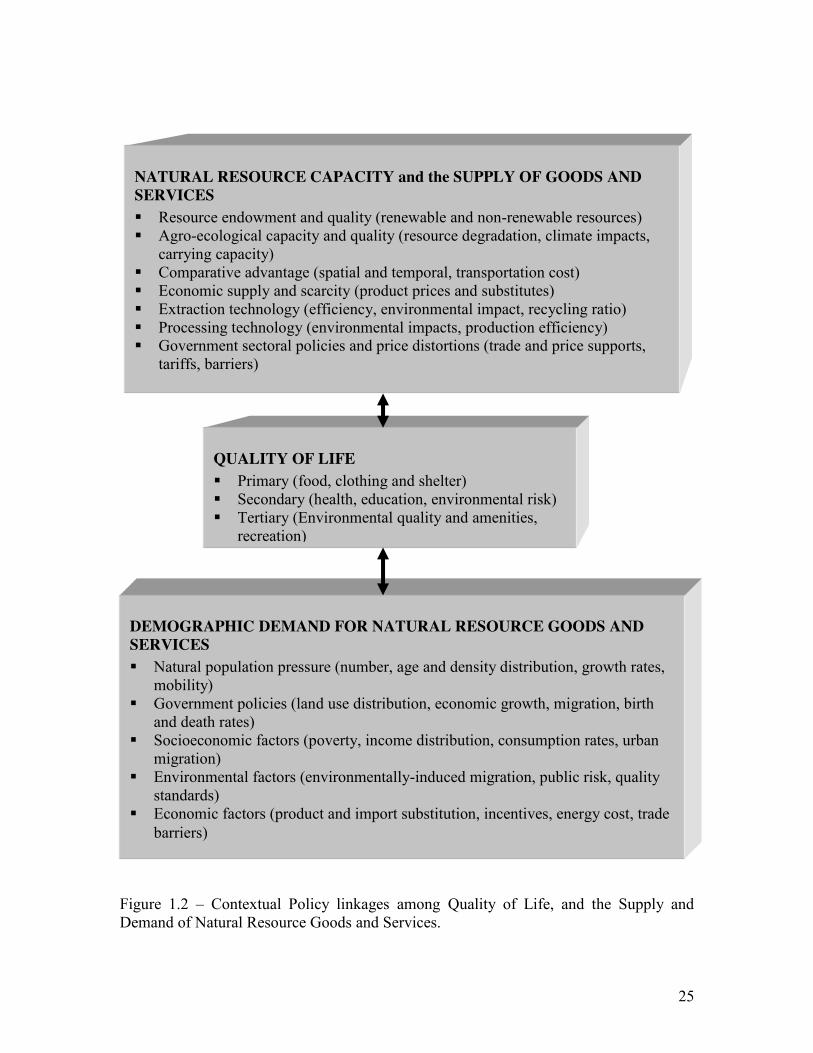
Fundamentally, quality of life must reflect the continuum of basic human needs to health
risks, environmental quality and resource amenities. A great number of factors affect
natural resources production supply and demographic demand. Some of the basic factors
are identified below (Figure 1.2). Because the natural endowment and its capacity to
produce goods an services is limited -- especially when realistically considering
environmental impacts and resource scarcity, nationally and globally, the fundamental
need arises to address the notion of national and regional carrying capacities. The
fundamental questions for the Republic of Indonesia is: which level of population growth
can be sustained long-term without compromising long-term health, public risk, and the
environmental quality (water, air, watershed condition, biodiversity, etc.) on which those
conditions depend? Which near-term legacy will current generations leave behind?
24
Gradual change Cyclic change
Lack of Balancing (National and Regional) Natural Resources Supply and Demand in Public Policy
Figure 1.1 – Impacts of environmental stress and degradation on natural resource production capacity, social equity and security.
EXCESS RESOURCE DEMAND (POPULATION CONTROL)
REDUCED RESOURCE ENDOWMENT AND INCREASED PRODUCTIVITY CONSTRAINTS
ENVIRONMENTAL STRESS AND NATURAL RESOURCE BASE DEGRADATION – WATER QUALITY AND SUPPLY IMPACTS
DECLINING RESOURCE PRODUCTION CAPACITY AND EFFICIENCY
DECLINING INCOME AND SAVINGS RATES
DECLINING PURCHASES AND INVESTMENTS
CAPITAL DEFICIENCY
DETERIORATION OF PHYSICAL AND SERVICE INFRASTRUCTURE
IMPACTS ON GNP, COMMODITY PRICES AND SOCIAL EQUITY
CYCLIC DECLINE OF QUALITY OF LIFE AND INCREASED SECURITY RISK
UNSUSTAINABLE POPULATION GROWTH AND RESOURCE DEPLETION RATES
25
Figure 1.2 – Contextual Policy linkages among Quality of Life, and the Supply and Demand of Natural Resource Goods and Services.
NATURAL RESOURCE CAPACITY and the SUPPLY OF GOODS AND SERVICES Resource endowment and quality (renewable and non-renewable resources) Agro-ecological capacity and quality (resource degradation, climate impacts,
carrying capacity) Comparative advantage (spatial and temporal, transportation cost) Economic supply and scarcity (product prices and substitutes) Extraction technology (efficiency, environmental impact, recycling ratio) Processing technology (environmental impacts, production efficiency) Government sectoral policies and price distortions (trade and price supports,
tariffs, barriers)
DEMOGRAPHIC DEMAND FOR NATURAL RESOURCE GOODS AND SERVICES Natural population pressure (number, age and density distribution, growth rates,
mobility) Government policies (land use distribution, economic growth, migration, birth
and death rates) Socioeconomic factors (poverty, income distribution, consumption rates, urban
migration) Environmental factors (environmentally-induced migration, public risk, quality
standards) Economic factors (product and import substitution, incentives, energy cost, trade
barriers)
QUALITY OF LIFE Primary (food, clothing and shelter) Secondary (health, education, environmental risk) Tertiary (Environmental quality and amenities,
recreation)
26
Given current population pressures and its distribution, the issue of population control
seems paramount when safeguarding the health of well-being of future generations in the
formulation of a comprehensive land use policy. With the current population growth rate,
distribution and concentrations, this is a serious question for the new RI administration
to consider – and will form the basis for successful long-term public policies that
realistically consider sustainable growth, societal prosperity and social equity and
justice.
1.3 Integrated Rural Development Planning and Sustainable Land Policies
Within the range of public policy concerns, environmental impacts are increasingly
viewed as a fundamental trade-off to economic growth, especially in rapid
industrializing nations, such as the BRIC (Brazil, Russia, India and China) economies.
Similar questions concerns arise in Indonesia. This perspective is not necessarily
correct. The fundamental issue is not to restrict economic growth and thereby reduce
environmental pollution, but to make informed public choices about the type of
economic growth to promote, under which circumstances, at which locations, with what
environmental controls, and which negative impacts to accept.
In an agrarian reform program that seeks to restructure production efficiencies and
improve rural welfare, this also means making informed choices about which land
utilization types (variations of farming and cropping system) to select and matching
sustainable land production capabilities with crop requirements. It means conducting
land suitability studies that consider both production capacities and economic viability
using clearly defined input-output scenarios. This may include the continuum from
small-scale, labor intensive, locally-adapted, “farms” with nutrient recycling in
densely-populated areas dominated by highly productive soils (providing marginal
farming households with calories, cash and nutritional value) to large-scale cash crop
plantations with higher capital inputs, including capital expenditures for mechanization

27
and processing, and located at more distant locations from rural communities, possibly
on lesser-productive marginal soils. Such approach would require the demarcation and
promotion of small-scale village agricultural zones and large-scale plantation zones in
the context of regional development plans.
The fundamental linkages outlined below (Figure 1.3) may be used to schematically
outline these evaluation linkages as describe above, and in the context of sustainable
policy analysis and regional planning.
Figure 1.3 - Fundamental Linkages and Effects among Natural Resources, Quality of Life and Public Policies associated with the Use of Natural Resources The systematic evaluation of natural resource production opportunities and potential
opportunities for creating rural prosperity, while considering environmental equality
QUALITY OF LIFE: HUMAN DEMAND, CONSUMPTIVE USES AND IMPACTS
ENVIRONMENTAL QUALITY: PRODUCTIVE CAPACITY AND ECOSYSTEM FUNCTIONALITY
ECOLOGICAL AND SOCIO-ECONOMIC EFFECTS: QUALITY AND COSTS OF GOODS AND SERVICES
PUBLIC POLICY: LAWS, REGULATIONS AND ECONOMIC INCENTIVES

28
implications, are fundamental in this public policy analysis. An example of such debate
can be found in the expanding and integrating European Community (EC), where
policy initiatives address agricultural management practices and environmental impacts,
deteriorating water and air quality, restoration of ecosystem functions, and nature
preservation. Although EC legislation has already achieved a considerable degree of
harmonization, significant differences remain among member states as to their
economic ability and political willingness to create an effective environmental policy
agenda. Resolving socioeconomic disparities (especially between northern and southern
Europe) in rural regions, and addressing the viability of agricultural subsidies and
impacts on environmental quality resulting from agricultural subsidies -- such as
nutrients, heavy metals and pesticides -- are fundamental issues.
These disparities are not unlike the situation in the Republic of Indonesia (RI). Higher-
income regions are observing an agricultural sector in transition. On a regional basis,
the reduced GNP- share of the agricultural sector with a lower percentage of
employment, environmental impact by plantations, intensive farming systems and bio-
industry, and a shift in societal land use perspectives, require a review of land use
policies. In addition, countries around the world are increasingly recognizing the
critical importance of preserving natural resource assets and ecosystem functions;
include their role in water supply and quality management, fisheries and eco-tourism.
Such land use policy focus may be formulated into a strategic action program that sets
“sustainable” land use goals and provides more universal access to land resources to
increase productivity and address socio-economic disparities. . The action agenda may
include policies and objectives that explicitly:
improve human quality of life by meeting primary, secondary and tertiary needs
provide equitable access to and availability of natural resources and their products and services
prevent environmental damage and resource degradation

29
promote sustainable development that addresses present needs without compromising future natural resource production capacity and ecosystem functions and bio diversity
While in the RI the urgency to enhance quality-of-life is high for a large portion of the
population, the principles to avoid lasting environmental damage are also urgent given
the state of environmental quality in many urbanized areas, and increasingly so in area
subject to intensive land use pressures and surface mining. This urgency must be
recognized in a pro-active land policy agenda that seeks to avoid environmental disaster,
and reduce environmental impacts and human health risk.
Achieving these long-term objectives depends on the sustainability of land use policies
related to industry, energy, transport, agriculture and regional community and rural
development. It should be stressed that success depends on two key principles:
a) the integration of the environmental dimension in all major land use policies
and by establishing environmental protection targets to address causes of
resource degradation and environmental deterioration, and
b) a shared responsibility among the various government agencies, industries
and public institutions and well-articulated and clearly-regulated mandates to
gain commitments and agreed-upon policy measures to be achieved, as
defined by specific targets and specific progress indicators that can be
monitored
A sustainable land use strategy includes a wide range of policy instruments, including:
legislation to set and enforce environmental standards, monitor performance and
progress, specifically related to water and air quality, and human health risks
economic incentives and regulations to increase productivity, and encourage the
production and use of economically viable and environmentally-friendly products
and processes;
development of an effective agricultural research, education and information
infrastructure; and
an adequately-funded and efficient rural extension service that addresses
agricultural production technologies, community develop support, family health

30
and nutrition, financial assistance and farm budget analysis, and value chain
development.
A rural development strategy should include the following target sectors: Agriculture
(food and cash crops, processing and marketing), Industry (incl. small communal-based
manufacturing and repair facilities), Rural Electrification and Communication, Physical
Infra-structure (roads, bridges, water supply and treatment), Services Infrastructure
(education, health care, land tenure and financial services), and Tourism.
Long-term target themes for rural development should include: watershed and water
resource management, waste and water quality management, climate change impacts,
acidification and air quality, coastal zone management, land resource conservation and,
finally the preservation of critical ecosystems and bio-diversity in the form of national
parks and ecosystems reserves.
Public risk assessment and management should include comprehensive, 3-dimensional
risk modeling, risk management (mitigation) and natural disaster emergency
management, and address:
a) flood protection and mitigation including risk assessment associated with the structural
integrity of water containment structures (e.g. dams, dikes and flood gates) and potential
impacts on downstream catchment areas with flooding and mud slide risk;
b) volcanic and seismic risk factors, including volcanic slope stability assessment,
tsunamis early warning systems and coastal zone risk analysis, and associated emergency
management response schemes
c) forest fire protection and community risk assessment, and
d) health risk assessment associated with environmental impact and human exposure
specifically related to water (untreated waste and pesticides) and air contamination.
Policy instruments should include: a) comprehensive environmental information systems
addressing the primary policy themes and key diagnostic, performance and monitoring
indicators; b) applied research and spatial analysis indicators; c) sectoral and spatial

31
planning, d) realistic pricing that does not distort comparative advantage and seeks to
encourage market-based approaches and reflect environmental externalities; e) public
outreach, information and education, f) human resource development; and g) carefully-
structured financial support with targeted environmental incentives and production
subsidies; and h) effective policy implementation and enforcement through focused and
simplified legislation. The latter is especially important in the RI given the current state
of agrarian sector legislation.
1.4 Rural Development Planning and Sustainable Land Use: Indonesian Challenges It is outside the scope of the report to provide a detailed assessment of the environmental
challenges associated with land use and economic development in Indonesia. However,
with respect to Agrarian Reform, we also need to take stock of the basic challenges and
trade-offs the GOI faces in guiding rural development, land use choices and
environmental impacts -- and emphasize TWO BASIC FACTS:
Many ENVIRONMENTAL AND ECOSYSTEM RESOURCES AND
SERVICES are UNIQUE and are VIRTUALLY IRREPLACEABLE – certainly
in light of the time span of recent human evolution, settlements and impacts in the
region. This not only includes critical habitat and biodiversity loss but also
impacts on critical sources of water supply and water and soil quality, agricultural
and fisheries potential and other critical “renewable” resources
OPPORTUNITIES TO PREVENT ENVIRONMENTAL DAMAGE and disaster
NOW are much MORE COST EFFECTIVE THAN REMEDIATION AFTER
THE FACT (if the practical and economic possibility exists, at all) and do not
only come at a much higher cost but at significantly greater PUBLIC RISK AND
HEALTH consequences. ACTING URGENTLY IS ESSENTIAL – especially in
light of global warming causes and effects that will have dramatic consequences
for coastal environments, coastal settlements and current land use, agricultural
production potential, and water scarcity and quality.
32
These issues are especially urgent in Indonesia. Examples include:
Rapid and uncontrolled development, such as on Kalimantan with new road
construction into restricted forest areas, inducing further unplanned and uncontrolled
growth
Illegal logging practices throughout Indonesia affecting water availability and quality
and critical wildlife habitat
Conversion of highly productive and critical farmland for non-agricultural use
Conversion of important forest wildlife habitat into plantations sometimes
underutilized or later abandoned.
Intrusion in the form of illegal logging, mining, forest squatting and hunting in
national parks, such as Java’s largest mountain park “Mount Halimum Salka National
Park in West Java.
Rapid deterioration of water quality of interior lakes and some coastal areas as a
result of over-fertilization (agricultural subsidies), use of pesticides and discharge of
untreated sewage (none of Indonesian’s interior lakes contain any potable water any
more)
Lack of enforcement of reforestation provisions for forest concessionaires.
Significant environmental impacts associated with legal and illegal mining operation
(water quality impacts associated with the discharge of toxic substances including
heavy metals)
Deforestation rates at as high as 2.8 million per year, between 1998-2000, and about
1.8 million hectares, more recently.
At the interface of al these issues is the interaction between modern man and the
environment, how public policy provides access to our renewable and non-renewable
resources, which limitation are imposes on use rates and impacts and which legacy we
wish to leave behind for future generations. The central role of PBN in this public policy
debate is evident.

33
2. CONCEPTS, PRINCIPLES, AND GUIDELINES FOR LAND POLICY FORMULATION AND DEVELOPMENT PLANNING
Any systematic attempt to address sustainable development planning should include
baseline performance indicators and representative productivity indices. In rural areas,
this means defining the productivity of the renewable land resource base and its derived
uses, such as represented by the products and services from the agricultural, forestry, and
tourism sectors, as well as outputs (ecological functions and derived social values) from
natural ecosystems. Realistically, this should reflect both sustainable resource production
capacity and economic feasibility. In rural sector planning, this may include the following
assessment phases:
1. Assessment of basic agro-ecological production capacity on a cropping system or
commodity-specific basis;
2. Assessment of sustainable productivity levels using adjustment for locally relevant
production opportunities and input constraints (e.g. irrigation, fertilization,
technology, capital); and the
3. Economic viability of production options (input costs and product prices).
This relationship is further identified in figure 2.1, below.
An example of assessing basic productivity and its long-term sustainability in the form of
relevant indicators can be provided in the form of crop productivity or farming systems
analysis. For instance, in agro-ecological production capacity assessment, the genetic
potential of crops grown under specific water supply (deficit) conditions is predicted. The
agro-ecological parameters that primarily affect this biophysical production function are
soil type (texture), climate (rainfall, temperature, relative humidity, solar radiation, wind
speed), and local topography (slope gradient and aspect or orientation).
This initial estimate of crop productivity does not assume limitations with regard to farm
management practices -- nutrient deficits, salinity impacts or mulching -- or land
degradation considerations.

34
Figure 2.1 – Relevant indicators, derived indices and linkages in natural resource production capacity assessment. This basic relationship is identified by the crop yield response formula as theoretically
detailed in adapted computer-based crop yield models (such as the MSU-CRIES-YIELD
model) reflecting soil moisture availability, such as:
ya ETa (1 - ) = ky ( 1 - ) ym ETm
where: ya = actual harvested crop yield
AGROECOLOGICAL RESOURCE PRODUCTION CAPACITY INDICES SOIL RESOURCES Soil physical and chemical properties Topography CLIMATE RESOURCES Use-specific carrying capacity index (e.g. rangeland) Length of growing period Crop moisture availability Crop-specific productivity index Use-specific (farming system) suitability indices AQUATIC RESOURCES Irrigation potential Aquatic Ecosystem properties (biotic and abiotic) Water quality indices (organic and inorganic) Eutrophication index Wetland resources and productivity indices Aquifer vulnerability and recharge indices Surface and subsurface supply and cost PLANT RESOURCES Ecosystem classes and productivity indices Vegetation association and biomass productivity Biodiversity indices (species) Genetic resource indices (biomedical) WILDLIFE RESOURCES Ecosystem and carrying capacity indices Species, environment and human resource competition indices NON-RENEWABLE RESOURCES Mineral Resource Oil an gas resources Strategic mineral index (for all, calculate self-sufficiency and economic supply index
SOCIOECONOMIC NEED AND SUITABILITY INDICES Resource Status, Depletion Rates,
Supplies (stock and flow resources) Projected Resource Quality, Physical and
Economic Scarcity and Prices Mix of Resource Products and Services Political /Administrative District Impacts Natural Systems (e.g. ecosystem,
agroecological zone, watershed) Impacts Planning districts – Integrated Impacts
HUMAN-INDUCED LAND AND ECOSYSTEM DEGRADATION IMPACTS AND INDICES LAND DEGRADATION IMPACTS Soil erosion (wind, water) and compaction Desertification index Salinization (Irrigation and saltwater intrusion)
WATER RESOURCE IMPACTS (In)Organic pollution Use rates and water scarcity ECOSYSTEM QUALITY AND BIODIVERSITY Ecosystem productivity, diversity and stability
35
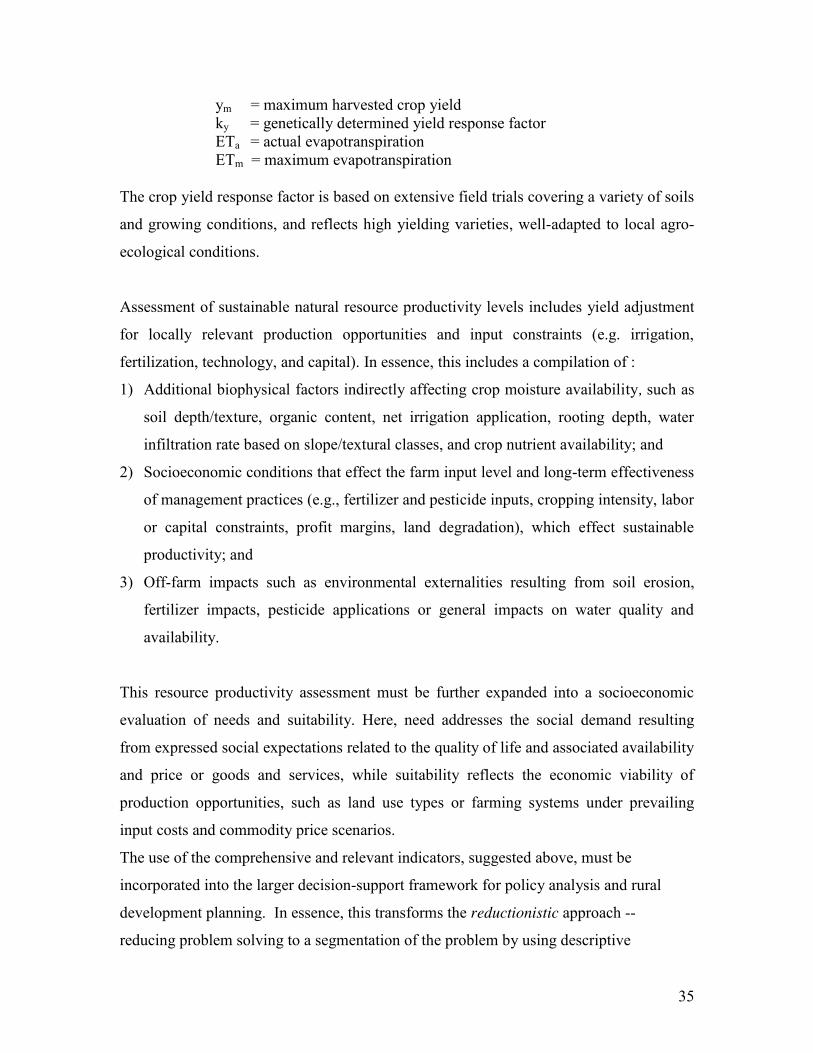
ym = maximum harvested crop yield ky = genetically determined yield response factor ETa = actual evapotranspiration ETm = maximum evapotranspiration
The crop yield response factor is based on extensive field trials covering a variety of soils
and growing conditions, and reflects high yielding varieties, well-adapted to local agro-
ecological conditions.
Assessment of sustainable natural resource productivity levels includes yield adjustment
for locally relevant production opportunities and input constraints (e.g. irrigation,
fertilization, technology, and capital). In essence, this includes a compilation of :
1) Additional biophysical factors indirectly affecting crop moisture availability, such as
soil depth/texture, organic content, net irrigation application, rooting depth, water
infiltration rate based on slope/textural classes, and crop nutrient availability; and
2) Socioeconomic conditions that effect the farm input level and long-term effectiveness
of management practices (e.g., fertilizer and pesticide inputs, cropping intensity, labor
or capital constraints, profit margins, land degradation), which effect sustainable
productivity; and
3) Off-farm impacts such as environmental externalities resulting from soil erosion,
fertilizer impacts, pesticide applications or general impacts on water quality and
availability.
This resource productivity assessment must be further expanded into a socioeconomic
evaluation of needs and suitability. Here, need addresses the social demand resulting
from expressed social expectations related to the quality of life and associated availability
and price or goods and services, while suitability reflects the economic viability of
production opportunities, such as land use types or farming systems under prevailing
input costs and commodity price scenarios.
The use of the comprehensive and relevant indicators, suggested above, must be
incorporated into the larger decision-support framework for policy analysis and rural
development planning. In essence, this transforms the reductionistic approach --
reducing problem solving to a segmentation of the problem by using descriptive

36
indicators -- to a holistic or systems approach. A holistic approach uses composite
indicators of social preferences and performance and can, therefore, accommodate a
variety of social assumptions, opinions, and group desires, accounting for public policy
tradeoffs involving complex costs, benefits, and risk.
A key requirement in this process is that environmentally-referenced indicators,
reflecting economic productivity opportunities and environmental impacts, by agro-
ecological zones, watersheds or major ecosystems, must be directly related to political or
administrative regions for the comparative analysis of relevant socioeconomic impacts,
and as the basis for strategic planning and implementation. As pointed out earlier, this
relationship (figure 2.2) among indicators is reflected in the hierarchy of planning and
Figure 2.2 – Sustainable Environmental Management and Planning using Descriptive Suitability Indicators and Composite Indices of Social Preferences, Performance and Impact management and may also be illustrated in the analytical sequence of single issue
resource management or comprehensive planning. The key challenge, then, is to define
specific management objectives at each level that operationalize private and public
SUSTAINABLE AGRO-ECOLOGICAL ASSESSMENT AND CROP PRODUCTION MANAGEMENT
SUSTAINABLE AGRICULTURAL SECTOR MANAGEMENT (CROPPING SYSTEMS AND
LIVESTOCK)
SUSTAINABLE ECOSYSTEM AND (TERRESTRIAL AND AQUATIC) BIODIVERSITY MANAGEMENT
SUSTAINABLE NATURAL RESOURCE MANAGEMENT
SUSTAINABLE ECONOMIC DEVELOPMENT PLANNING
SUSTAINABLE SOIL MANAGEMENT (LAND DEGRADATION, SOIL MOISTURE AND NUTRIENT BALANCE)
RED
UC
TION
ISM
HO
LISM
37
development goals. This involves seeking complimentarity of socioeconomic and
environmental goals that are specifically identified as indicators representing needs and
opportunity, as well as measures of performance and impact. For example, in sustainable
land management and policy formulation this involves indicators that measure land
degradation trends and quality, and denote intervention needs and development
opportunities, representing various land use types as natural or managed production
ecosystems.
Fundamentally, resource use capacity is reflected in land quality indicators representing a
potential sustainable use condition of landscape units on a comparative basis and may
also expressed at the aggregate level at the local, regional or national scales. Given a
specific level of scale, land capacity or quality may include indicators of nutrient and
water balance, crop and forest yield trends, unrealized production potential (see below)
based on certain land use type and management intensity, natural grassland (range)
carrying capacity, land cover and biological diversity, and various indicators of
environmental quality.
2.1 Focusing Land Policy and Development Initiatives: Applying the Concept of Unrealized Production Potential
Comparative advantage, expressed as relative measure of productivity or economic
performance, can be defined on an agro-ecological zone basis. An agro-ecological zone
reflects a relatively homogeneous mapping unit -- based on soil characteristics (primarily
soil texture or particle size reflecting soil moisture holding capacity), climate and
topographic variables. This so-called Resource Production Unit (RPU) will provide a
given level of crop productivity (output) based on its agro-ecologically defined
production capacity for specific cropping options and its associated inputs. The
theoretical maximum is based on local agro-ecological constraints. This maximum can be
compared with the actual productivity level and the difference expressed as Unrealized
Production Potential (UPP). Where the UPP is the largest (figure 2.3) the largest set of
local production constraints exist (e.g. input availability, cost, land access, technology,
etc.) and the greatest opportunity exist to increase productivity in the context of an

38
agrarian reform program. This provides the spatial analytical framework for the
prioritization of integrated rural development and planning initiatives at the regional or
national level.
Figure 2.3 - The Concept of Unrealized Production Potential -- the Difference between Current Constrained Land Use Outputs (Total Production of Goods and Services subject to Input and Performance Constraints) and the Theoretical Maximum (Unconstrained) Outputs. Were the Difference is the Greatest, the largest Constraint Conditions exists and the Greatest Potential exists to improve Productivity.
NET SOCIO-ECONOMIC BENEFITS CURRENT LAND USE
NET SOCIO-ECONOMIC BENEFITS MAXIMUM MAXIMUM POTENTIAL SUSTAINABLE LAND USE
UNREALIZED PRODUCTION POTENTIAL
PUBL I C BENEF I TS
DEVELOPMENT STRATEGY – PLANNING TIME FRAME

39
2.2 Land Information Systems and Indicators for Land Policy and Development Initiatives One of the most significant challenges in development planning is to derive information
cost-effectively and ensure that it is thematically, spatially, and temporally relevant in
supporting policy analysis and decision making. Beyond the traditional data quality
standards of precision and accuracy, it is important to identify the MINIMUM
information content necessary to meet decision-support objectives, at a given point in
time. It may be argued that any redundant information constitutes inefficient use of
human and capital resources.
In the process of compiling information a distinction has to be made with regard to the
sequence and characteristics of basic data capture and analysis and the use and
distribution of relevant information. This process sequence is illustrated below (figure
2.4). It is especially important to differentiate among the various information compilation
steps, namely:
The use of relevant, descriptive qualitative and quantitative diagnostic indicators in
the problem identification;
Problem-oriented fact finding involving the use of primary and secondary data sets
compiled in a spatially referenced information system (GIS), linked with analytical
performance assessment models, such as agronomic productivity forecasting and
socioeconomic impact assessment models;
The compilation of single indicators or composite prescriptive indices that identify
potential solutions and alternative problem solving approaches; and
The selection of planning and implementation alternatives based on composite
performance indices that reflect planning impacts, intended public policy
consequences, and the aggregate impact on the quality of life over time, by location
and the populations affected. The formulation of the latter two categories - involving the identification of potential
solutions, the selection of preferred alternatives, and implementation strategies - must be
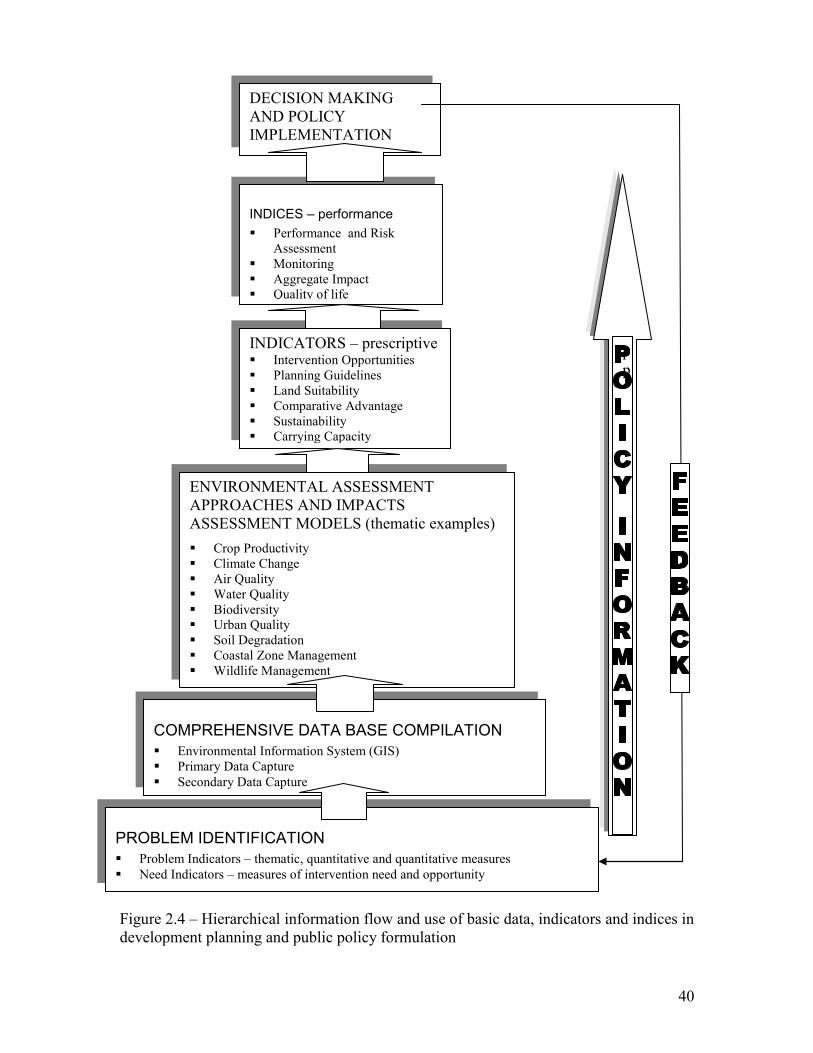
40
Figure 2.4 – Hierarchical information flow and use of basic data, indicators and indices in development planning and public policy formulation
INDICES – performance Performance and Risk
Assessment Monitoring Aggregate Impact Quality of life
INDICATORS – prescriptive Intervention Opportunities Planning Guidelines Land Suitability Comparative Advantage Sustainability Carrying Capacity
ENVIRONMENTAL ASSESSMENT APPROACHES AND IMPACTS ASSESSMENT MODELS (thematic examples) Crop Productivity Climate Change Air Quality Water Quality Biodiversity Urban Quality Soil Degradation Coastal Zone Management Wildlife Management
COMPREHENSIVE DATA BASE COMPILATION Environmental Information System (GIS) Primary Data Capture Secondary Data Capture
DECISION MAKING AND POLICY IMPLEMENTATION
PROBLEM IDENTIFICATION Problem Indicators – thematic, quantitative and quantitative measures Need Indicators – measures of intervention need and opportunity
pp

41
addressed effectively by the compiled information. To this end, consideration should be
given to the formulation of a National Spatial Data Infrastructure (NSDI) that may be
viewed as a network of Spatial Data Infrastructures (SDI) linked to address specific
applications by specific government agencies. The primary purpose of a SDI is to
provided improved access to spatial data (reflecting time, cost, quality, relevancy, and
standardization issues) and support NSDI policy analysis needs on a economic sector or
issue basis (e.g. environmental impact analysis, rural development planning,
transportation planning or agricultural or tourism sector analysis). This involves the
identification of critical qualitative and quantitative indicators and derived indices, as
viewed from the perspective of the various national or regional agencies with associated
mandates in economic development and environmental protection.
Composite indices designed to meet decision support requirements may reflect traditional
economic measures of economic efficiency and also measures of public risk of the impact
of human activities or development actions on the environment. Rather then viewing risk
solely as a physical health factor, it is suggested that risk in policy formulation reflects
the broader view of human well-being or quality of life. More recently, the issue of social
equity in involuntary environmental risk exposure has received increased attention.
Elements that may be included into this assessment are water and air pollution,
environmental disease vectors and their controls, occupational health, food safety, and
traffic safety. A modified risk equation can be used in this process to assess the
composite indicator of environmental risk as: n
Rn = rn x pn x vn - tn i=1
where r = is the expected value of the magnitude or degree of risk (expressed as social cost) p = the exposure probability (expressed as frequency or probability of occurrence (%) (this factor may be weighted for large impact areas where significant spatial decay of impacts is anticipated)
v = the vulnerability of the target population (e.g., age and weight factors) t = the potential risk reduction factor (e.g., prevention or mitigation policies)
n = the number of risk variables involved
42
Risk assessment must be viewed as a distinctly different component in public policy
studies than risk management. The former is a scientific assessment of potential health
risk that may result from development impacts on the environment, while the latter
addresses concerted public policy efforts to reduce risk through education, regulation,
and mitigation. Risk management uses the scientific results of risk assessment as
expressed in comparative indices, while assessing the implications using economic, social
and legal considerations to formulate policy decisions and regulatory interventions.
Environmental quality and public health risk are directly associated with the impacts of
land use policy on quality of life and are receiving increased attention, world-wide.
Land policy initiatives should not only address economic development but also deterio-
rating air and water quality, restoration of ecosystems functions, and nature
preservation needs. It is important to seek legislative agreement and support for these
initiatives in the early stages of environmental degradation. We view this as critically
important in Indonesia. Intervention scenarios will be much more cost efficient that
retroactive mitigation efforts. This represents a critical opportunity for the RI to address
significant environmental concerns, particularly in land and water quality management
The primary need exists to establish harmony among laws and regulations, and to
develop the political willingness to create an effective environmental policy agenda for
the 2010, and beyond. Environmental and land use policy should be primarily directed
toward the prevention of water and air pollution and reflects proactive, comprehensive
laws and regulations regarding the impacts of land use (including deforestation and
mining) on environmental quality.
The challenge is to evolve an integrated systems approach to natural resource evaluation
and impact assessment that fosters the development of a decision support system which
is effective in making informed public policy choices. Such a policy analysis system, as
outline below (figure 2.5) consists of three major functional components, comprising

43
diagnostic, prescriptive, and performance (monitoring) indicators and their derived
resulting indices. It includes:
A comprehensive Resource Evaluation System – to assess primary production capacities (agro-ecological productivity)
A Land Use Evaluation System – the assess land suitabilities (economic viability and public risk variables), and
A Public Policy Analysis System – to conduct macro socio-economic analysis
Figure 2.5 – Major system linkages of resource assessment, land evaluation, economic development planning and land use policy formulation
NATURAL RESOURCE SYSTEM Bio-physical diagnostic and prescriptive indicators: ecological resource base quality, production capacities and constraints
LAND USE SYSTEM (viable) Land Use Types (LUTs) evaluated on the basis of resource capacity and socio-economic performance and prognostic indicators - development guidelines and strategies
PUBLIC POLICY SYSTEM (EVALUATION OF QUALITY-OF-LIFE IMPACTS)
AGGREGATE SOCIOECONOMIC PERFORMANCE MODELS AND SPATIAL INDICATORS
LAND USE SELECTION BASED ON SOCIOECONOMIC PERFORMANCE AND ENVIRONMENTAL CAPACITY AND QUALITY INDICATORS
POLICY IMPLEMENTATION THROUGH SELECTIVE DEVELOPMENT STRATEGIES, INCENTIVES, LAND USE PLANS AND CONTROLS
SUSTAINABLE PRODUCTIVITY CONSTRAINTS: Agro-ecological, Technological, Socioeconomic, Institutional, Cultural, and Political. COMPARATIVE OPPORTUNITY INDICATORS (e.g. crop yields and economic return
44
Public interests largely reflect the long-term environmental stewardship principle that
includes public interests in resource conservation and environmental quality. Private
interests largely reflect more short-term economic interests that are directly affected by
ownership rights, laws, and regulations. In this regard, the goal of public land use policy
is to balance public and private interest (reduce human risks, preserve environmental
quality and stimulate economically viable production opportunities) by the formulation of
multi-jurisdictional (e.g. national regional and local), resource policy systems that include
the institutional controls and capacity to:
a) Identify the comparative advantage of resource use opportunities (e.g., resource
endowment, use capacity and use efficiencies) in the context of environmental constraints (e.g., carrying capacity and resource depletion rates) – the resource evaluation framework
b) Evolve guidelines and decision-support systems to evaluate public and private sector
benefits (e.g., benefit/cost, benefit/risk) of land use alternatives and associated environmental impacts – the policy analysis framework
c) Development implementation and evaluation through effective development
strategies, land use plans, laws and regulations, and performance monitoring – the policy implementation framework
In general, public development policy attempts to guide the identification and selection of
“best resource use” options reflecting both public land use alternatives and the aggregate
socioeconomic and environmental impacts of private land use choices. It aims to
mobilize the production of goods and services as resource outputs to meet societal needs
and to improve resource productivity, input, and management efficiency, while
attempting to optimize product distribution and availability. In this context, natural
resource assessment is a systematic process of fact finding, interpretation, and
identification of development alternatives and associated impacts. This process is by
nature holistic and multidisciplinary, reflecting the best fundamental understanding of the
structure and dynamics of ecosystems and the linkages among a complex set of biotic and
abiotic factors. Sustainable development fundamentally reflects this understanding and,
therefore, the perceived opportunities and environmental limits that provide guidelines
for improved decision making, environmental management, and development planning.
45
This understanding is never absolute, lacking essential knowledge about complex
ecological relationships, complicated by spatial and temporal inaccuracies, affected by
adaptive impacts and policy changes, and influenced by changing valuations of public
benefits, costs and, risks.
To effectively challenge this decision-making complexity, a systems approach to
economic development and environmental assessment is needed. The approach should
be:
1) Issue-oriented to improve the RI ability to identify the qualitative and quantitative
dimensions of the problem(s),
2) Diagnostic in its analytical approach to identifying potential solutions that are
sustainable and economically viable , and
3) Focus on problem solving by providing the minimum information needed to make
informed decisions.
2.3 Land Evaluation and Suitability Assessment for Land Policy and Development Planning
The critical analytical process that determines the comparative land suitabilities
associated with different production options if referred to as Land Evaluation for
Development Planning. Land evaluation is designed to:
Identify inappropriate land uses that lead to inefficient use or exploitation of
natural resources resulting in the degradation or destruction of land resources and
undermine the long-term productive capacity of our natural resources based, and
eventually lead to poverty and scarcity of products and ecosystem services;
identify the best land use alternatives for a given parcel of land given prevailing
inputs, costs, technology and public preference, thereby seeking the long-term
creation and preservation of prosperity
develop rational land use planning and select appropriate and sustainable uses of
natural and human resources on a parcel and administrative district basis

46
Land evaluation is the assessment of land performance for a specified land use – the land
use objective or alternative – the so-called Land Utilization Type (LUT) subject to local
constraints and input regimes
Land evaluation reflects the notion that land (and its use) varies in its bio-physical and
socio-economic properties and that for each use a suitability determination can be made
and expressed in physical and/or economic terms. Basic suitability differences can be
systematically evaluated based on agro-ecological properties. These suitabilities based on
the variation of physical, economic and social variables, and the performance of the land
for a given land use can be predicted with a degree of certainty, given the variability of
data and production assumptions.
This suitability assessment for agricultural, forestry (or any other land use including
industrial or tourism) provide a parcel-based and aggregate (political or administrative
district-based) comparative framework that provide users and decision makers -- such as
land use planners, state institutions, politicians and agricultural support services – with
spatial information to make predictions and guide land use decisions and policy
formulation..
2.4 Land Information System Functions for Suitability Assessment, Land Policy Formulation and Development Planning
The basic role of Land Information Systems (LIS) to support land suitability and impact
assessment is critical (Fig. 2.6). Increasingly, these spatial analytical functions are
combined with mapping systems that can be used to identify property ownership by
parcel descriptions (cadastral maps) used to demarcate property boundaries, land use
rights and land valuation for tax assessment. Significant improvements have been made
in computer-assisted (automated digitizing) input, compatibility with satellite data input
and rectification, spatial analytical and modelling software, and mapping output.

47
Figure 2.6 - Three major components of a Land Information System. These components consist of input devices, computer hardware and software, and output subsystems. A Land Information System (LIS) is a uniquely adapted system with (automated) digitizer input, mapping output and dedicated spatial analytical and display capability, including cadastral information.
2.4.1 LIS Components and Analytical Capabilities
A LIS consist of the capabilities if a Geographic Information System (GIS) with the
cadastral mapping and relational data base components of a land registration and taxation
system. Ideally, it should included protocols to link the GIS components with applied
models, such crop yield and econometric or optimizing models. The real power of this
combination is that aggregate analysis results can be converted to spatially-referenced
output. For instance, the output of an optimizing linear programming model that seeks to
identity a specific crop mix to be produced in a certain province to meet food an export
goals, can be translated into the ideal crop mix per agro-ecological zones for economic
planning purposes.

48
Operationally, a GIS can be divided into five components: People, Data, Hardware,
Software, and Procedures. All of these components need to be well-designed and
operationally-integrated to serve a public function cost-effectively. They include:
People
The people are the component largely-determine operational efficiency. They include
positions like GIS managers, database administrators, application specialists, systems
analysts, and application programmers. They are responsible for maintenance of the
geographic database and provide technical support. GIS staff needs to be educated in
systems capacity and applications. BPN should develop a long-term systems
development that includes a human resource development plan based on institutional
priorities and resource availabilities. One suggested educational institution to meet BPN’s
need is ITC in the Netherlands that provides dedicated system and application training
financed by Dutch technical assistance programs.
Procedures
Procedures include how the data will be archived and retrieved, input into the system,
networked, transformed, analyzed, and presented in a different form. The analytical
procedures reflect the information needs (from data to analysis to information). The
ability of a GIS to perform these spatial functions cost-effectively and accurately to meet
the institutional mandate determines it functionality.
Hardware
Hardware consists of the technical equipment needed to run a GIS including a computer
system with enough power to run the software, enough memory to store large amounts of
data, and input and output devices such as scanners, digitizers, GPS data loggers, media
disks, and printers.
Software
There are many different GIS software packages available. All systems must be capable
of effective data input, storage, management, transformation, analysis, and output.
Dedicated systems functions such as found in an LIS will reflect additional capabilities,
methods, system resources, and ease of use. Modern GIS systems permit the storage of
49
both graphical and descriptive in a single database, known as the object-relational model.
They also include protocols to develop mathematical equations that guide a series of
spatial analyses, such as useful in overlay and suitability analysis.
Data
One of the most time consuming and costly aspects of a GIS is database creation and
maintenance. The inherent aspect of spatial data is that they most are dynamic and need
frequent updating, such as is the case for cadastral records and land cover/use changes.
Here temporal and spatial accuracy are critical both in the source and use of secondary
and during input and conversion. Institutional protocols in this regard should be carefully
reviewed.
In general terms, a GIS combines computer cartography with a database management
system. The major components common to a GIS are three subsystems: (1) an input
system that allows for the collection of data to be used and analyzed for some purpose.
This typically includes digitizing devices that permit the transformation of analog maps
to digital form; (2) computer hardware and software systems that stores data, allow for
data management and analysis, and can be used to display data manipulations on a
computer monitor; and (3) an output system that generates hard copy maps, images, and
other types of output.
Historically, two major GIS systems evolved, raster (or cell-based) systems and polygon
systems. The first type had the advantage of being directly compatible with satellite data
and facilitated map overlay analysis at the compromise of spatial accuracy. The second
being more capable of storing map data, initially compromised overlay and image
analysis. Examples of the first type are SYMAP developed at Harvard in the 60s, the
CRIES-GIS develop at MSU (70s and 80s) and ERDAS (80s), initially developed at
Georgia Tech. The evolution of polygon systems was accelerated by the development
INTERGRAPH and ARC-INFO by ESRI, California, The latter has almost evolved to an
international standard in GIS applications. Polygon systems are also typical for stand-
alone, cadastral information systems.
50
Two basic data types are normally entered into a GIS. The first type consists of real
world phenomena and features that are mapped. Usually, these data elements (attributes,
such as soil or climate data) are stored points, lines, or polygons that are referenced
geographically in a coordinate system that is replicated in the data base. These mapped
data are entered into the GIS by devices like scanners, digitizers, Global Positioning
Systems (GPS), air photos, and satellite imagery. The associated attribute values (such as
soil types with their physical and chemical properties or census information) are then
referenced by these spatial identifiers (points, lines, or polygons mapped in the GIS).
These data sets can then be analyzed to determine spatial relationships such as
frequencies, co-occurrences or unique combination of attributes to identify unique spatial
locations (e.g. land suitabilities - physically or economically).
The geo-database is the common data storage and management framework for an LIS. It
combines spatial data with a relational data base to create a central data repository for
spatial data storage and management. It can be leveraged in desktop, server, or mobile
environments and allows store of GIS data in the field and net-worked locations, while
providing central location data access, management and security.
A unique capability of the GIS component of a LIS is the ability to take secondary data,
conduct analysis of uniquely interest to a specific region and to derive tertiary data that
may be extremely helpful in certain policy application. An example is provided in the 2
figures below. The first map indicates distribution of earthquake events and the second
relative surface depth. These inputs can be used to develop input into a tsunami risk
analysis model that seeks to ascertain relative risk by location as part of the development
of an Emergency Management Program (EMP).

51
Figure 2.6.1 - Distribution of earthquake events that have occurred over the last century. (Source: PhysicalGeography.net)
Figure 2.6.2 - Earthquake events organized according to depth and impact(yellow (shallow) = surface to 25 kilometers below the surface, red (intermediate) = 26 to 75 kilometers below the surface, and black (deep) = 76 to 660 kilometers below the surface). (Source: PhysicalGeography.net)

52
2.4.2. Cadastral and LIS Information
Examples of basic land use and cadastral maps date back many years, such as in the
example provided below (Fig. 2.7) - the city map of Ambon (1726). Cadastral surveys
document the boundaries of land ownership, by the production of documents, diagrams,
sketches, plans (plats in USA), charts, and maps. Originally, they were originally used for
land valuation and taxation. Rectified cadastral survey or topographic maps (representing
a true orthographic projection of the land surface) can be used as a base map in
Geographic/Land Information systems used to compile other thematic map overlays, such
as land use, soils, infrastructure, etc. The depiction of land ownership can be an important
element in land evaluation or impact studies
A cadastral map shows the boundaries and ownership of land parcels. Some cadastral
maps show additional details, such as district names, parcel ID and tax numbers,
Figure 2.7 – Land Use and General Parcel Map of Ambon (1726) (Souce: Van Keulen Atlas, Amsterdam)
53
certificate of title numbers, positions of existing structures, section area and/or lot
numbers, street names, boundary dimensions and references to prior maps.
An example of a modern cadastral map is provided, below (Fig. 2.8). Cadastral maps
should reveal the national grid, cadastral boundaries, parcel-identifiers, street addresses,
buildings, house numbers, and geodetic control points. Parcel related attributes can be
visualized on the cadastral map. Cadastral parcel data should be stored in one separate
layer, buildings in a different overlay.
Spatial data are represented in the database using geometric data types such as 'point',
'line' and 'box'. In addition to the use of these data types, some important capabilities
could be build in such as topology and historic information. Furthermore, nation-wide
unique identifiers should be all geographic objects, e.g. boundaries, topographic lines
(buildings) and unified surveying and mapping attributes.
The following data base system is utilized in the Dutch cadastre and may serve as an
example of a modern system:
“Data tables include boundary (cadastral boundaries), parcel (parcel identifiers), symbol (cartographic symbols), GCP (Geodetic Control Point), line (topographic lines) and text. The spatial extension of the objects in the table includes boundary, parcel and line and is indicated with a minimal bounding rectangle of type 'box'. The box covers a boundary or a topographic line or a complete parcel. The box can be spatially indexed and is useful for efficient retrieval purposes based on rectangle selections. There is no need for the geometric data type 'polygon', because the area features are stored topologically in the parcel table and boundary table using the so-called 'CHAIN-method'. The edges in boundary table contain references to other edges according to the winged edge structure, which are used to form the complete boundary chains. From this data structure polygons can be generated on demand. Currently, topology is only maintained for the cadastral data and is being introduced for the topographic data, based on demand.
This approach allows calculations on correctness of topology after adjustment of the surveyed new boundaries to the cadastral data. Furthermore it opens the possibility to relate attributes to the boundaries between parcels, e.g. relation to the source documents of surveying, date of survey, names of persons locating the boundary, etc. If each parcel would be represented in the database by a closed polygon, it would be complicated to represent the basic object of cadastral surveying: one boundary between two neighbor parcels. Closed polygon representation would lead to double (or triple or even more)
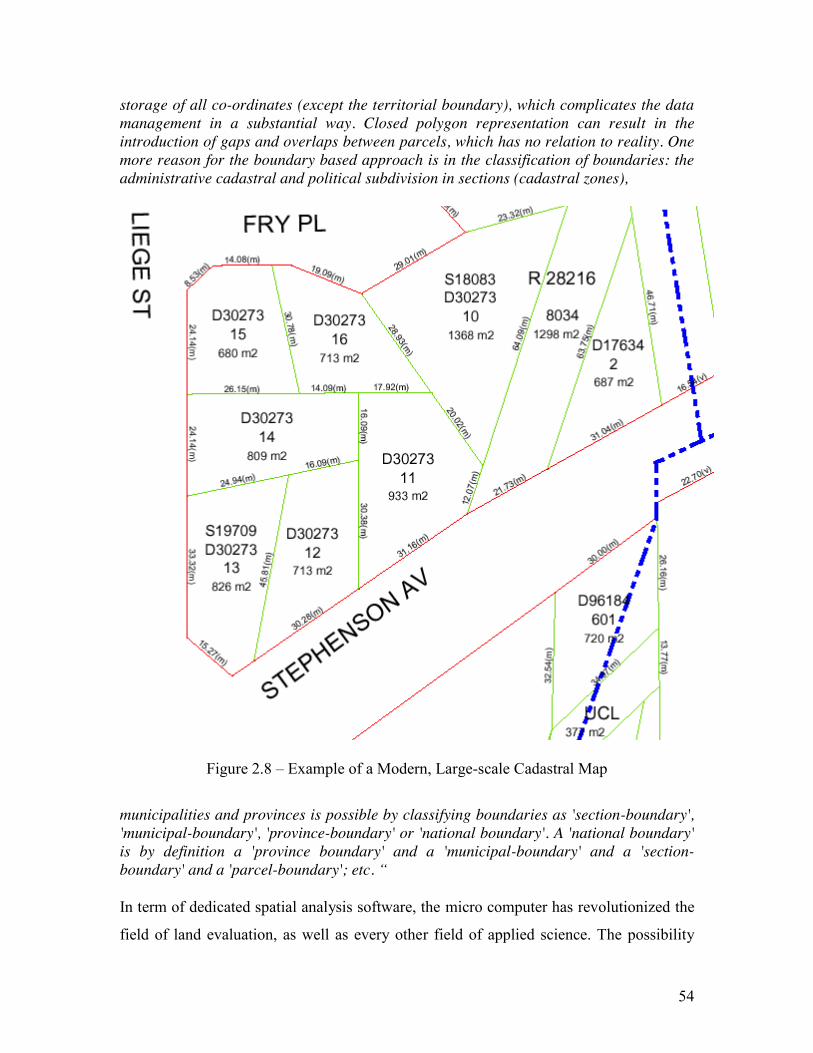
54
storage of all co-ordinates (except the territorial boundary), which complicates the data management in a substantial way. Closed polygon representation can result in the introduction of gaps and overlaps between parcels, which has no relation to reality. One more reason for the boundary based approach is in the classification of boundaries: the administrative cadastral and political subdivision in sections (cadastral zones),
Figure 2.8 – Example of a Modern, Large-scale Cadastral Map
municipalities and provinces is possible by classifying boundaries as 'section-boundary', 'municipal-boundary', 'province-boundary' or 'national boundary'. A 'national boundary' is by definition a 'province boundary' and a 'municipal-boundary' and a 'section-boundary' and a 'parcel-boundary'; etc. “
In term of dedicated spatial analysis software, the micro computer has revolutionized the
field of land evaluation, as well as every other field of applied science. The possibility

55
exists to distribute highly detailed spatially-referenced data and conduct distributed
analysis within institutions and field offices at the district, local or project level. It is
feasible to have a regional-level land information system, including remote sensing
analysis capability, with PC-based hardware and software, together with centrally-shared
data storage, digitizers, plotters, and laser color printers. At a more sophisticated level,
national organizations and universities may use LIS and centralize automated data input
and storage while providing powerful analytical workstations.
Land Information Systems should include standard productivity operations such as report
writing, area calculations, cross-tabulation and other statistical analysis on land records
and parcels (reference the occurrence of 2 or more thematic variables) and produce this
output is tabular (spreadsheet) and graphic form (histograms and maps). LIS capabilities
should include data base operations based on address and parcel IDs, for updating land
registration and taxation records, thematic overlays and proximity analysis, conditional
queries, permit 3-dimensional modeling and linkages with aggregate models
(econometric, yield modeling, risk, simulation and impact models). The base reference
coordinates should permit input of rectified ortho-photoquads and satellite image data.
An image analysis capability to update land cover/use data and derive other thematic
maps such as vegetation and coastal zone dynamics is an important asset.
The multi-purpose functionality of LIS makes it an ideal tool to support spatial planning
and impact assessment. The land registry and cadastre equally serves a multi purpose. It
should provide and register information on legal transfer of title or use rights, the right of
disposal of the seller, the agreement between buyer and seller, title rights and restrictions
(easements). The official public registry should reflect certified ownership rights and the
deed should suffice to give substantial evidence of ownership. The registers and cadastral
maps therefore guarantee in practice legal land tenure security, and security in the land
market. The same is valid for securing loans by mortgages. Information on taxable
persons, taxable objects, and taxable values, should be derived from the files of the
National Land Agency, and on regular basis supplied to the municipalities as main source
data for their land taxation. All local data should be stored centrally and updated of a

56
regular basis for safekeeping. All land information from the files of the National Land
Agency should be available for legitimate use by government bodies and be available for
public inspection and retrieval at cost.
Typically, public registers are registers in which official (notarized) deeds are recorded as
they are submitted. In the Civil Code (Roman-French law) older real estate rights have
priority over recent rights. The moment of recording can therefore be of crucial
importance, e.g. by legal foreclosure and execution. Public registers by consequence are
not easy accessible. The administering agency may provide title extracts on request and at
cost. The essential elements from the deed are the same as used for input into the
cadastral registers and maps, providing registers on name, parcel (both administrative
description and map), and street address. In essence, the cadastral registers and maps are
auxiliary registers to provide access to the public registers. The public registers are kept
in analogue format: books with paper deeds, and should be copied in microfiche and
secured at a save location. Both cadastral registers and cadastral maps should be digitized
for net-worked file sharing and security.
Some specific recommendations for the RI include: a) the specific identification of
individual ownership and land use rights on title certificates (deeds) based on a
restructured and transparent system of land ownership rights; b) work toward the future
use of digital records and the electronic submission of deed to the regency and central
office; c) develop a full integration of a centralized land data base, including topographic
base, cadastral map and legal/administrative data; including quality control (verification)
and archiving; d) consider consolidation of regional data compilation at the provincial
level to redue cost and facilitate networking and archival operations with the national
office of BPN
2.4.3 Institutional Role of LIS/GIS in Inter-agency Collaboration and Public Policy Support Above, a number of applied uses for GIS-supported spatial analysis are discussed, as they
are throughout this report. Some of these major national support functions include the
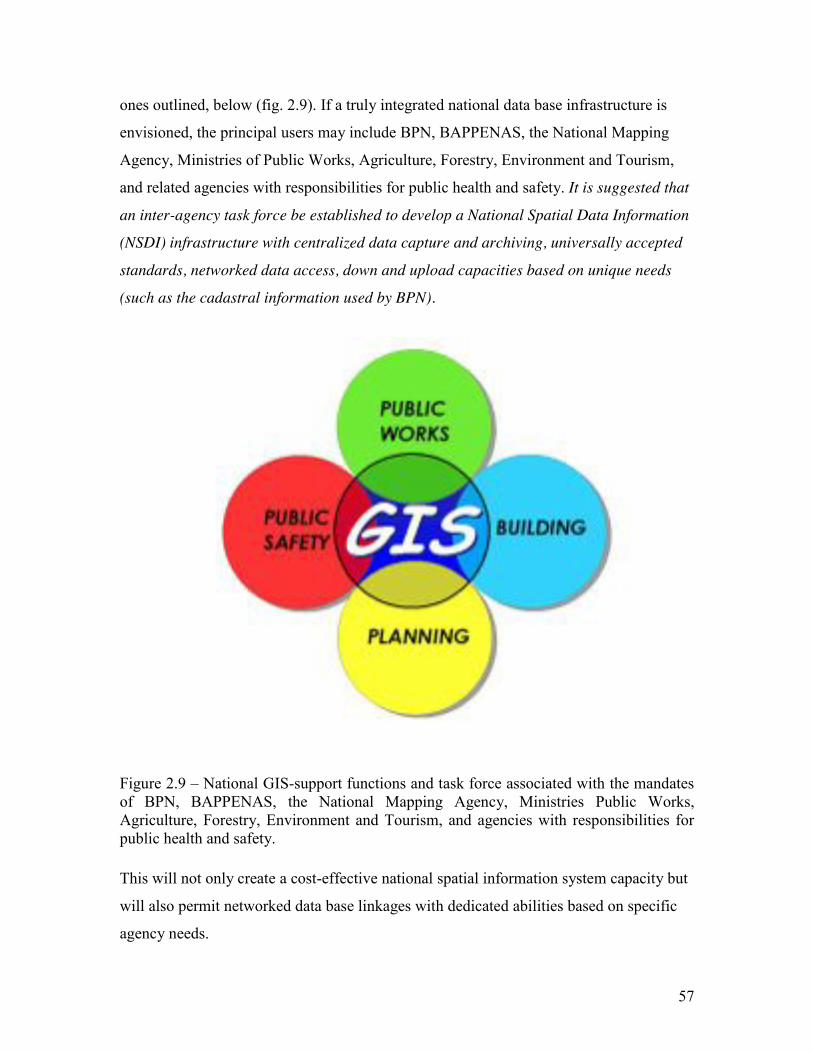
57
ones outlined, below (fig. 2.9). If a truly integrated national data base infrastructure is
envisioned, the principal users may include BPN, BAPPENAS, the National Mapping
Agency, Ministries of Public Works, Agriculture, Forestry, Environment and Tourism,
and related agencies with responsibilities for public health and safety. It is suggested that
an inter-agency task force be established to develop a National Spatial Data Information
(NSDI) infrastructure with centralized data capture and archiving, universally accepted
standards, networked data access, down and upload capacities based on unique needs
(such as the cadastral information used by BPN).
Figure 2.9 – National GIS-support functions and task force associated with the mandates of BPN, BAPPENAS, the National Mapping Agency, Ministries Public Works, Agriculture, Forestry, Environment and Tourism, and agencies with responsibilities for public health and safety. This will not only create a cost-effective national spatial information system capacity but
will also permit networked data base linkages with dedicated abilities based on specific
agency needs.
58
2.5 Integrated Survey Capacity for Mapping and Land Evaluation
The most fundamental capacity is the ability to develop reliable topographic maps with
geographic coordinates (Universal Transverse Mercator) that serve as reference for the
national cadastre and base maps for the development of analog thematic maps (land
cover/use, soils, infrastructure, water resources, climate variables, etc.) depicting various
land attributes used in land evaluation. Until recently, the basic tools used in planar
surveying were a tape measure for determining shorter distances, a level for determine
height or elevation differences, and a theodolite used to measure angles (horizontal and
vertical), combined with triangulation. Starting from national primary, secondary and
tertiary reference positions (benchmarks) with known location and elevation, the distance
and angles to the unknown point are measured and mapped.
A more modern instrument is a theodolite with an electronic distance measurement
device (EDM) data processor. Modern “total” stations are fully robotic, can e-mail point
data to an office computer and connect to satellite positioning systems, such as a Global
Positioning System (GPS). Though real-time differential GPS systems have increased the
speed of surveying, they are still only horizontally accurate to about 20 mm and vertically
accurate to about 30-40 mm. However, GPS systems do not work well in areas with
dense tree cover or construction obstacles. These “total” stations are used widely, along
with other types of surveying instruments. One-person, robotic-guided total station allows
surveyors to gather precise and rapid measurements. A faster way to measure large areas
with less detail without many visual obstacles is with a helicopter equipped with a laser
scanner, combined with a differential GPS to determine the position and elevation of the
helicopter. To increase precision, beacons are placed on the ground (about 20 km apart).
This method reaches precisions tolerances of 5-40 cm, depending on flight height.
Today’s capacity makes it possible for a single surveyor to accomplish in a day what
used to take weeks with an entire team, and with a higher level of spatial accuracy.

59
2.6 Land Surveys for Integrated Data Base Development and Land Development Various land survey can be carried out to establish base reference maps and track real
estate transaction and land development. These capabilities should be part of the various
government agencies responsible for the development planning, implementation and
monitoring and evaluation. They also form the basis for building cadastral and tax
records related to real estate property and transactions. They include:
Topographic Survey: a survey that measures the elevation of points on a particular
piece of land, and presents them as contour lines on a plot. The resulting
topographic maps with spatial reference points, such as using the Universal
Transverse Mercator (metric) projection, and surface features such as roads,
waterways, built-up areas (for detailed maps individual structures), forested and
wetland areas, these map are the base reference map for Land Information
Systems on which thematic information may be draped as several digital overlays
in a digital data base, such as land cover/use. soils, hydrology, vegetation types,
political/administrative boundaries, climate, ecosystems, population density,
census tracks, etc.
A comprehensive survey that incorporates elements of the boundary survey,
mortgage survey, and topographic survey. In the US, such survey meeting
American Congress on Surveying and Mapping standards is referred to as the
ALTA/ACSM Survey and is often required to formalize real estate transactions.
An archaeological survey used to accurately assess the spatial references points
relationship of archaeological sites in a landscape or to accurately record finds on
an archaeological site. In many nations these surveys are require if the presence of
archaeological features is identified and prior to site development can be
authorized
Project or “As-built” Survey is a survey conducted several times during various
stages of a construction project to verify, for local and state planning boards
(USA), that work authorized was completed to the specifications set on the Plot
Plan or Site Plan. This usually entails a complete survey of the site to confirm
that the structures, utilities, and roadways proposed are built in the proper

60
locations as authorized in the Plot Plan or Site Plan by local planning authorities.
These surveys are usually done 2-3 times during the building of a house; once
after the foundation has been completed; once after the walls are put up; and at
the completion of construction.
Boundary Survey: a survey to establish the boundaries of a parcel using its legal
description which typically involves the setting or restoration of monuments or
markers at the corners or along the lines of the parcel, often in the form of iron
rods, pipes, or concrete monuments in the ground, or nails set in concrete or
asphalt. In the past, wooden posts, blazes in trees, piled stone corners or other
types of monuments have also been used. A map or plat is then drafted from the
field data to provide a representation of the parcel surveyed.
Construction surveying (otherwise "lay-out" or "setting-out"): the process of
establishing and marking the position and detailed layout of new structures such
as roads or buildings for subsequent construction. Surveying is regarded as a sub-
discipline of civil engineering all over the world. All Degree and Diploma level
Engineering institutions have detailed items of Surveying in the curriculum for
undergraduate courses in the discipline of Civil Engineering. It is suggested that
al relevant PBN staff meet these criteria.
Deformation Survey: a public safety survey to determine if a structure or object is
changing shape or moving. The three-dimensional positions of specific points on
an object are determined, a period of time is allowed to pass, these positions are
then re-measured and calculated, and a comparison between the two sets of
positions is made. Such surveys are routinely conducted in areas subject to
volcanic or seismic activity such as along fault zones, slopes or dams
Engineering Surveys: those surveys associated with the engineering design
(topographic, layout and as-built) often requiring geodetic computations beyond
normal civil engineering practice and precision.
Erosion and Sediment Control Plan: a plan that is drawn in conjunction with a
Subdivision Development Plan that denotes how upcoming residential or
commercial construction activities will effect the movement of stormwater and
sediment across the construction site and onto adjacent properties and how

61
developers must adjust grading and site preparation activities to limit the
depositing of more stormwater and sediment onto adjacent properties as a result
of the construction project.
Foundation Survey: a survey done to collect the positional data on a foundation
that has been poured and is cured. This is done to ensure that the foundation was
constructed in the location authorized in the Plot Plan, Site Plan, or Subdivision
Plan. When the location of the finished foundation is checked and approved the
building of the remainder of the structure can commence. This is different than
the “As-Built” Survey, above, which is not to be done until all work or phases
thereof are completed.
Geological Survey: generic term for a survey conducted for the purpose of
recording the geologically significant features of the area under investigation. In
the past, in remote areas, there was often no base topographic map available, so
the geologist also needed to be a competent surveyor to produce a map of the
terrain as a spatial reference for geological information. More recently, satellite
imagery or aerial photography is used as a base, where no published map exists.
Such a survey may also be highly specialist - for instance focusing primarily on
hydro geological, geochemical or geomagnetic themes.
Hydrographic Survey: a survey conducted with the purpose of mapping the
coastline and seabed for navigation (nautical charts), engineering, or resource
management purposes. Coastal zone mapping (navigation) and the monitoring of
coastal dynamics and risk analysis (flood protection, tsunami early warning
system, etc.) should be interrelated elements of government mapping programs.
Mortgage Survey or Physical Survey: a simple survey that generally determines
land boundaries and building locations. Mortgage surveys are required by title
companies and lending institutions when they provide financing to show that
there are no structures encroaching on the property and that the position of
structures is generally within zoning and building code requirements. Some
jurisdictions allow mortgage surveys to be done to a lesser standard, however
most modern minimum standards require the same standard of care for mortgage
surveys as any other survey.

62
Plot Plan or Site Plan: a proposal plan for a construction site that include all
existing and proposed conditions on a given site. The existing and proposed
conditions always include structures, utilities, roadways, topography, and
wetlands delineation and location if necessary. The plan might also, but not
always, include hydrology, drainage flows, endangered species habitat,
emergency management issues; multi-year flood plans (e.g. 50 or 100 year flood
event to avoid building in flood prone areas) traffic patterns and capacities for
emergency response planning.
Soil survey, or soil mapping, is the process of determining the soil types or other
properties of the soil cover over a landscape, and mapping them for others to
understand and use. A detailed soil survey lists the primary physical (texture or
particle size) and chemical properties of soils to about a 2 meter depth.
Hydrological survey is designed to map surface and subsurface phenomena
associated with the presence of water such as water bodies, stream flows, aquifers
and associated groundwater supplies and dynamics.
Subdivision Plan: a plot or map based on a survey of a parcel of land. Boundary
lines are drawn inside the larger parcel to indicate the creation of new boundary
lines and roads . The number and location of plats, or the newly created parcels,
are usually discussed back and forth between the developer and the surveyor until
they are agreed upon. At this point monuments, usually in the form of square
concrete blocks or iron rods or pins, are driven into the ground to mark the lot
corners and curve ends, and the plat is recorded in the cadastre (USA, elsewhere)
or land registry (UK). In some jurisdictions, the recording or filing of a
subdivision plat is highly regulated. The final map or plat becomes, in effect, a
contract between the developer and the city or county, determining what can be
built on the property and under what conditions. Always upon finally completion
of a subdivision an As-Built Plan is required by the local government. This is
done so that the roadway constructed therein will pass ownership from the
developer to local government by way of a contract called a Covenant. When this
stage is completed the roadways will now be maintained, repaved and serviced by

63
local government. In the US, this is funded by local property taxes levied or a
parcel basis.
Tape Survey: this type of survey is the most basic and inexpensive type of land
survey. Popular in the middle part of the 20th century, tape surveys while being
accurate for distance lack substantially in their accuracy of measuring angle and
bearing. Considering that a survey is the documentation of one-half (1/2)
distances and one-half (1/2) bearings this type of survey is no longer accepted
amongst local, state, or federal regulatory committees for any substantial
construction work. However for determining the extent of property boundaries
this type of survey is the least expensive, least time consuming and least invasive,
while being nowhere close to accurate for the standards that are practiced by
professional land surveyors.
Wetlands Delineation & Location Survey: a survey that is completed when
construction work is to be done on or near a site containing defined wetlands.
Building permits should avoid construction in wetland areas and preserve the
critical wetland functions such as flood protection, water quality protection by
reducing sedimentation and chemical recycling, preservation of ecosystem
functions such as fish spawning and wildlife habitat, etc. Depending on local,
regional, or national regulations, wetlands are usually classified on the basis
temporary inundation and boundaries are determined by observing the soil type
(organic matter), vegetation type, erosion patterns or scour marks, hydrology, and
morphology. A survey is done to drawn reference boundaries to ensure
construction outside wetland habitat.
2.7 Guidelines and Regulatory Frameworks for Land Use Policy and Planning To offer an example of a hierarchical planning system with integration of National,
Regional and Local Planning, the example of the Netherlands and New Zealand are
introduced.
64
2.7.1 Planning in the Netherlands Planning policy in the Netherlands may be viewed as more proactive than Michigan’s -
combating land use pressures and conflicts, and managing economic growth and
environmental impacts associated with intensive land use patterns and a capital- and
technology-intensive agricultural sector associated with relatively high nutrient and
pesticide loadings. Dutch land use intensities, both agricultural and industrial, is high –
especially in the west, and environmental impacts and land scarcity are historically
reflected in land use planning and policy.
During the early part of the 1900s, one could characterize Dutch land use policy as
reactive and agricultural sector-oriented, and more proactive and comprehensive since the
1950s. This approach received considerable international acclaim as a viable and
resourceful approach to land use planning and economic development. As part of this
regulatory framework, policy mandates and planning instruments have been developed to
direct urban development and control sprawl. These demonstrate a significant political
commitment, leadership and institutional capability to effectively address growth
management pressures.
The Netherlands is considered a decentralized unitary state. The national government and
national parliament legally determine the decision-making authority of its 12 provinces
and 496 municipalities.
Table 1 provides an overview of the governmental levels. In Europe, a decentralized
unity state means that government powers are divided among various entities with right
and duties specified in the constitution. These entities should pursue policies consistent
with those promulgated by higher government units.

65
Table 2.1 – Governmental organization of the Netherlands
This division of administrative responsibilities - national, regional (provincial) and local
(municipal districts with surrounding rural areas) - delegates a high degree of authority to
the regional and municipal levels within the framework of a hierarchical planning
system. In many respects, this system may be compared to the U.S. system of state,
county and local administration – however, with in the Netherlands the municipal level
representing a combination of major and minor municipalities and their surrounding rural
townships. Current political discussions take place to replace the appointed major with an
elected position.
Comparatively speaking, the European Union may increasingly be viewed as the fourth
or federal layer, with the obligation to translate directives of the European Union into
national legislation. This hierarchical planning system is administratively enforced by the
allocation of national tax revenues, directly and indirectly via the European Union. The
Dutch government contributes on balance about 3 billion Euros of national tax revenues
to the European Union to support development assistance to other EU nations or for other
aspects of European policy implementation, such as agricultural subsidies. This is, on a
per capita basis, the highest of all member states. In 2005, both the Netherlands and Great
Britain are trying to negotiate a substantial revision of this net capital contribution to the
E.U.
The E.U. also provides funds to implement specific directives such as agricultural
policies and the revitalization of nature preserves or ecosystem networks. Institutions
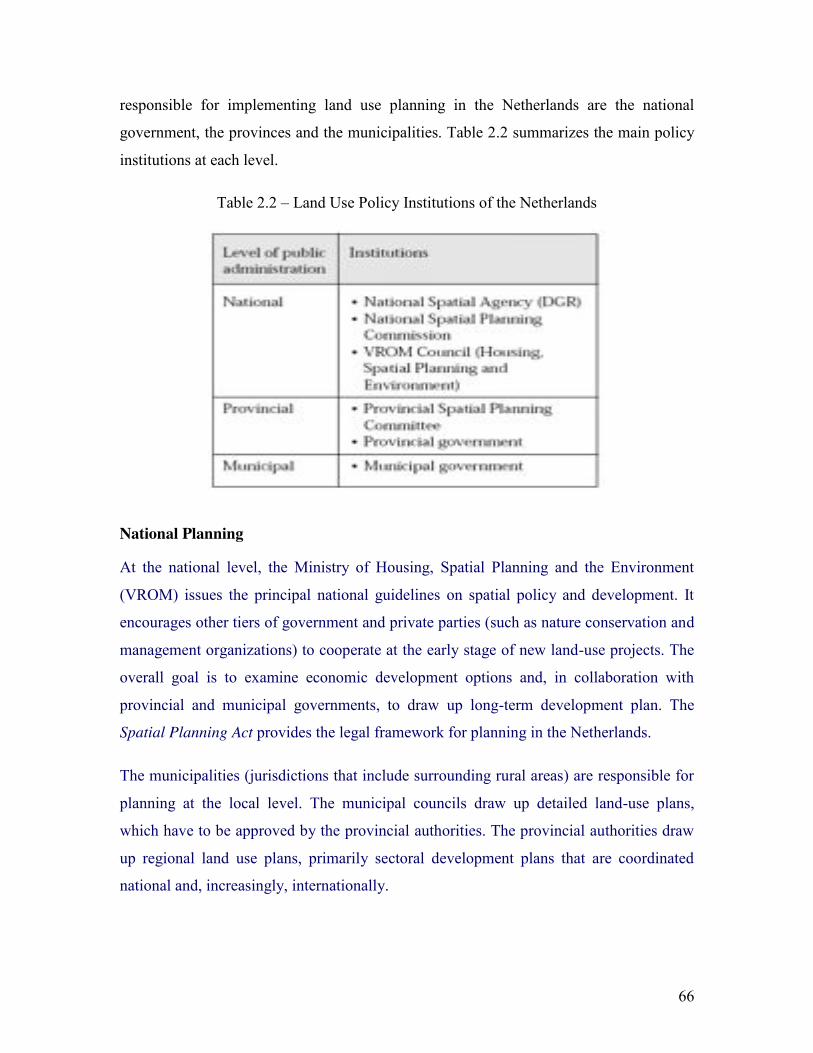
66
responsible for implementing land use planning in the Netherlands are the national
government, the provinces and the municipalities. Table 2.2 summarizes the main policy
institutions at each level.
Table 2.2 – Land Use Policy Institutions of the Netherlands
National Planning At the national level, the Ministry of Housing, Spatial Planning and the Environment
(VROM) issues the principal national guidelines on spatial policy and development. It
encourages other tiers of government and private parties (such as nature conservation and
management organizations) to cooperate at the early stage of new land-use projects. The
overall goal is to examine economic development options and, in collaboration with
provincial and municipal governments, to draw up long-term development plan. The
Spatial Planning Act provides the legal framework for planning in the Netherlands.
The municipalities (jurisdictions that include surrounding rural areas) are responsible for
planning at the local level. The municipal councils draw up detailed land-use plans,
which have to be approved by the provincial authorities. The provincial authorities draw
up regional land use plans, primarily sectoral development plans that are coordinated
national and, increasingly, internationally.

67
This general framework is further defined in the outline of institutional responsibilities
provide below (Fig. 2.10).
Adherence to national strategic plans is ensured by the States General1 by exercising the
right of approval. The minister is advised by the following institutions:
The Governmental Commission of Planning — the highest level commission for
coordinating the planning policies of the national government.
The Ministerial Council (VROM) — an independent council that advises the
national government and represents many outside constituencies.
The National Spatial Planning Agency — assists the minister of VROM in
developing spatial planning policy.
National land use planning is promulgated by a national plan composed of major spatial
planning decisions of four types:
National planning policy document (“nota ruimtelijke ordening”) — a document
(revised every 10 years) that articulates spatial policy directives for provincial and
municipal governments on a sectoral basis, including aspects of the types and
location of housing, urban development, nature and landscape preservation, water
management and infrastructural development.
National structure plan — a spatial outline of national land use policy, such as
regional urban growth, environmental preservation or industrial development
directives.
Structure scheme — a national structure plan for a single policy sector.
Particular projects of national importance
In the latest and Fifth National Policy Document, land use development guidelines are
formulated through 2020, with additional perspectives for the period up to 2030. Topics
include needs for residential development, including the mix of private and social
housing, preferred locations for residential development and urbanization, nature and
landscape development and preservation, watershed management and the spatial
requirements to accommodate economic growth. It is a legally binding document that 1 The State General (Parliament) consists of 2 policy chambers: the Second Chamber of Parliament with 150 members, directly elected for 4 years; and the Senate, elected by members of the provincial authorities.

68
outlines regional development guidelines to be refined by provincial and municipal
government land use plans.
Figure 2.10 – Institutional mandates for spatial planning in the Netherlands. National spatial policy is presented in structural outline plans (with general locational
preferences) and national policy documents. These documents contain the main
principles of the spatial policy, further reinforced and detailed in spatial allocation plans
at the provincial and municipal levels. Each key decision specifies its duration and is

69
(mostly) directive or legally binding. Projects of national importance can be legally
binding, such as those associated with the development or augmentation of major
infrastructural facilities or networks. To assure cooperation among various jurisdictions
or levels of government in the implementation of key decisions, the national government
may issue:
Directives on what a province should include in its regional plans and what a
municipality should include in its allocation plan (a specific land use designation
plan).
Orders that regional plans or allocation plans be revised.
In addition, these directives and orders may but need not be based on key spatial planning
decisions.
This division of administrative responsibilities - national, regional (provincial) and local
(municipal district, including surrounding rural area) - delegates a high degree of
authority to the regional and municipal levels within the framework of a hierarchical
planning system. Institutions responsible for implementing land use planning in the
Netherlands are the national government, the provinces and the municipalities.
Provincial Planning Provincial land use planning responsibilities include:
The detailing of relevant aspects of national land use planning policy at the
provincial level — in the form of provincial(or regional) plans.
The implementation of provincial planning policy.
The supervising of spatial planning policy implementation by the municipalities
within the province — in the form of local structure plans and land use
destination (in fact detailed land allocation) plans.
The provincial governmental powers are divided constitutionally among:
The crown's commissioner.
The provincial council, which promulgates spatial policy.

70
The provincial executive, which prepares and develops policy through plans and
memoranda.
The provincial executive is assisted by the provincial spatial planning agency. The
provincial planning committee is advisory to the provincial executive and coordinates
departmental actions and policies. It also plays a key role in the vertical coordination and
detailing of national and local land use planning. To this end, the provincial (regional)
council develops a regional plan — enabled by the Spatial Planning Act — that is
revised every 10 years. It identifies desired future development in the province and,
although not directly legally binding for citizens or local jurisdictions, identifies generally
desired future developments at the municipal level, to be subsequently detailed in local
structure plans and local land use destination plans (see below). The provincial executive
has the authority to approve local land use plans on the basis of their compatibility with
the regional plan. To enforce compliance, the province may issue specific orders and
directives to municipalities.
Local Planning Provinces or regions are subdivided into municipalities (“gemeentes”), which include a
municipal seat in the major town and minor towns or villages with their surrounding rural
areas (Fig. 2.11). They possess similar authority, but their autonomy is subordinate to
provincial and national land use policies.
Figure 2.11 - Local planning unit — Includes major municipality with minor towns or villages and surrounding rural areas (this could be compared to a major incorporated U.S. city and its surrounding townships or county).

71
The Spatial Planning Act mandates that municipalities prepare and implement local land
use policy and plans. They may also implement special national and provincial land use
policies on the basis of funded mandates. Policies are typically further detailed at the
local level by means of structure plans and destination (land allocation) plans (see
below). For implementation of national planning objectives at the regional and local
levels, provincial and municipal government funding largely originates from national
government sources in the form of general or specific grants based on the number of
inhabitants. Funding allocations to the provinces and municipalities reflect the nature and
magnitude of development priorities as identified in the national plan. Therefore, this
funding provides a significant land use control mechanism at the local level.
National revenue is largely raised through national income and sales taxes. Taxation at
the provincial and municipal level is very limited. This is an important difference
between the Netherlands and the United States because it eliminates the major incentive
for local governments to pursue development solely for the purpose of expanding the
local tax base. In the Netherlands, local taxes include a limited form of real estate tax (the
major source) and a levy for municipal services such as water and energy (natural gas)
consumption, and sewage and solid waste services. Local tax revenue amounts to about
16 percent of local funding (Fig. 2.12).
Figure 2.12 - Municipal income sources (1999). (Source: European Union, Committee of the Regions)
Major capital improvements may be financed by bond issues. Municipal councils may
determine local property tax rates subject to national government-imposed limits. Non-
profits such as church organizations and agricultural land are exempt from property tax.

72
Special taxing authority is provided to local water boards, which may proportionally
assess beneficiaries for drainage services and flood protection. Very little tax revenue
comes from provincial levies.
The local administrative powers are constitutionally divided among the appointed mayor
(discussions on changing this to an elected position are currently taking place), the
municipal executive and the elected municipal council. The municipal council is
principally charged with the approval and implementation of local land use planning
policy. The mayor and executive branch (principally the Department of Public Works and
City Development) are responsible for the preparation of plans and supporting
memoranda. The major local planning implementation tools are the structure plan, the
allocation plan, the urban renewal plan and the living conditions ordinance, the latter for
use in urban areas.
The Structure (“Structuur”) Plan The structure plan outlines the future structural development of the municipality with its
rural hinterland and is to be revised every 10 years. It is comparable to the master or
comprehensive plans of Michigan townships, but it is more detailed in defining the
desired planning objectives and general locations of major land uses. It also outlines the
direction and limitations of urban expansion into the surrounding rural area. Sometimes it
reflects interjurisdictional plans if jointly prepared and approved by an adjacent
municipality — the so-called intermunicipal structure plan. The function of the plan is to
determine prospective spatial and socioeconomic development, and to serve as a
reference for the formulation of municipal planning policy by merging national and
regional land use policies with local preferences.
The Spatial Planning Act gives the municipal council the right, but not the obligation, to
adopt a structure plan. It is not legally binding but may have legal and potentially
financial consequences for certain actions, such as the identification of areas for urban
renewal, land acquisition, expropriation and urban expansion. It is also the basis for the
approval of the land allocation plan by the provincial government.
73
The Land Allocation (“Bestemmings”) Plan The allocation plan is a legally binding document, much like the zoning and wetland
preservation ordinances used in Michigan. The Spatial Planning Act mandates that each
municipality establish an allocation plan subject to revision every 10 years for the
territory outside the built-up areas. For urbanized areas, the development of an allocation
plan is optional. The allocation plan effectively designates specific land use for a 10-year
time span, demarcating urban growth and service boundaries and the detailed location,
specific land use and density of residential, institutional, recreational and industrial land
development. All building permits are issued in compliance with the allocation plan.
Subject to reviews and approvals, exemptions may be granted with cause, analogous with
the zoning variances in Michigan.
However, exemptions are rarely granted and are subject to extensive approval
proceedings. Allocation plans are generally quite detailed in their designation of land
uses, including detailed maps with the specific type, the land use mix and the height of
development permitted for a given location. Local jurisdictions have some latitude in
determining the specific land use plan details, including use regulations.
The Urban Renewal Plan This plan has the same legal status as the allocation plan and addresses the revitalization
of urban areas. It is mandated by the Town and Village Renewal Act and is
implementation-oriented, whereas the allocation plan is prescriptive in nature.
Living Conditions Ordinance This urban development tool is also mandated by the Town and Village Renewal Act. It is
a proactive ordinance designed to prevent urban deterioration specifically associated with
living and working conditions, or aesthetics. With this ordinance, intervention takes place
more quickly and permits a municipality to influence urban revitalization more
effectively than would be case in an allocation plan or an urban renewal plan. This
ordinance may specify use rules to prevent or reverse deterioration of residential or
commercial buildings. It is designed to enforce standards rather than improve conditions.
74
Growth Management and Open Space Preservation The structure and allocation plans reflect national and regional growth priorities in
aggregate land use categories (space allocated, housing units, commercial and industrial
acreage, etc.). The implied hard growth boundaries for a designated time period
encourage concentrated development patterns of compact urban agglomerations.
The planning instruments outlined above are instrumental and effective in directing and
controlling growth. First, they focus on the development of the “compact city model”: the
creation of mixed land uses (living, working, education, recreation and public services)
reachable by various modes of public transportation, a constant revitalization of the
central city including its housing and retailing sectors, and the promotion of walkable
communities enhanced by easy access to schools and recreational facilities. Second, the
local government is an active participant in the development process, buying land and
controlling infrastructural development and defining access to basic services such as
water, sewer and utilities. This amounts to precisely defined growth boundaries over
time, prevents significant land speculation, and directs and controls residential
development in green space as necessary to accommodate urban expansion where it is
most suitable or desirable. The notion of development rights held by private landowners
is therefore limited by the growth zones identified in local allocation plans and modified
for future time periods, as necessary, to serve the public interest and development
priorities. Both planning practices and fiscal policies reinforce long-term planning at the
national, regional and local levels while effectively preserving open space. 2.7.2 Planning in New Zealand
More than 90 percent of New Zealanders are urban dwellers even though the country’s
economy is reliant on exporting primary products to distant global markets. A majority of
the population lives in and around the five metropolitan regions: Auckland, Hamilton,
Wellington, Christchurch and Dunedin. The drivers of urban growth in New Zealand are
much the same as in Indonesia even though the scale of the problem is relatively much
smaller. Contemporary urban growth trends through out New Zealand reflect long

75
standing cultural preferences for low density living in peri-urban settings dependent on
easy access to private transport. These forces have encouraged population dispersal,
which, if not managed well, could become sprawl. The growth pressures in New Zealand
cities, as elsewhere, are focused on the suburban and fringe locations while a number of
the inner city areas are in relative decline in terms of population and economic activity.
Metropolitan Auckland, a large part of the North Island north of Taupo and Christchurch
in the South Island face many of the same pressures and potential problems as urban
areas in many industrialized nations.
With a population of just over a million, Auckland is a relatively small metropolis by
global standards. However, its population is distributed over a large land area equivalent
to that of European and Asian cities with populations two to three times that of Auckland.
Until recently, the metropolitan form and function of Auckland had evolved since the
1870s in an incremental ad hoc fashion. Overlapping, fragmented local government
jurisdiction was considered a major constraint on effective governance. The cumulative
impact of shortsighted decisions has become manifest during the last decade. Auckland
has suffered a series of serious crises that have been attributed to an overburdened and
aging water, transport and power infrastructure.
Local government authorities within Auckland embarked on a strategic metropolitan
growth management initiative about a decade ago that has the potential to significantly
enhance the institutional capacity for regional governance. A number of other provincial
metropolitan cities in New Zealand, including Christchurch and Tauranga, have also
recently embarked on strategic planning initiatives that have been motivated by the
apparent success of Auckland. The new Local Government Act, enacted in 2002,
envisages elected local government authorities in New Zealand taking a lead role to
formulate and implement strategies for sustainable development in collaboration with
other stakeholders.
The following section will review the significance of the Auckland initiative from a
wider perspective of collaborative planning. Lessons from around the world suggest that

76
sticking to an agreed vision over the longer term is crucial to achieving community
objectives for promoting urban sustainability. In Auckland, New Zealand’s largest
metropolitan city, the region’s councils have finally decided to work together, in co-
operation with central government and other stakeholders, to implement the growth
strategy and meet regional needs. They have been compelled to do this in response to the
growth crisis facing the metropolitan community.
The Institutional Framework
Most of the responsibility for urban growth management in New Zealand is devolved to
elected regional and city and district councils. Central government has refrained from
taking a strong proactive role to provide policy direction in this sphere. Thus, New
Zealand does not have a national urban growth strategy or a national land use strategy.
The apparent rationale for this policy stance on the part of successive central
governments has been that the land use regulation function is deemed primarily a local
government responsibility, arguably a reflection of the ideological importance attached to
private property ownership in New Zealand. This situation may bear a distant
resemblance to the ”home rule” ideology in some states in the US. However, in contrast
to the more voluntary and sometimes limited pro-active planning role of local
government in the US, in New Zealand elected urban territorial local authority
jurisdictions have been required by the Parliament since the 1950s to undertake land use
planning and regulation under the town and country planning legislation.
However, developing capability for planning at a metropolitan regional level has proved
more problematic. In the metropolitan regions of Auckland, Wellington, Christchurch
and Dunedin, fragmented local government, parochialism and fiscal competition for
growth amongst contiguous authorities have constrained regional cooperation in the past.
Two particular objectives of the wide ranging local government reforms under the Local
Government Act 1988 were to amalgamate small territorial jurisdictions into larger units
to provide economies of scale and stronger capability for governance at the local level
and at the regional level to amalgamate special purpose ad hoc jurisdictions such as river
77
catchment (watershed) boards with overlapping jurisdictions into elected regional
authorities.
The principal legislative instrument for urban planning in New Zealand is the Resource
Management Act 1991 (RMA)2, which has several positive attributes as an environmental
planning statute. It provides a statutory framework for a holistic and integrated approach
to environmental planning and management based on ecological and democratic
principles. It replaces a large number of formerly separate and sometimes inconsistent
overlapping environmental statutes to provide a relatively integrated focus on natural
resources and the built environment.
The purpose of the Act is defined in terms of the principle of sustainability. The Act
recognizes that government has an important role in environmental planning and defines
a hierarchical, three-tier planning framework. This hierarchy is based on the assumption
that decisions should be made as close as possible to the level of community of interest
where the effects and benefits accrue. Within this hierarchy, regional councils have a
pivotal role in integrated resource management while the role of city and district councils
is focused more explicitly on land use planning. While there have been difficulties in
securing cooperation between the local and regional government tiers in some
metropolitan communities such as Christchurch, local government authorities in
Auckland have been relatively more successful in developing a collaborative approach to
address issues of urban growth management, as discussed in the next section.
The more recently enacted Local Government Act of 2002 significantly widens the
political mandate of local government (territorial and regional councils) in New Zealand
to empower it to promote the objective of sustainable development encompassing social,
economic, cultural and environmental well-being of communities. A key instrument to
achieve this objective will be the preparation and implementation of Long Term Council
Community Plans (LTCCPs), based on wide ranging community consultation and input
2 The Resource Management Act 1991 combined the Town and Country Planning Act; 1977 with several other environmental statutes.
78
by stakeholder groups. The LTCCPs are expected to become the key strategic planning
and public accountability document for all council activities. With specific reference to
urban growth management, the LTCCPs are expected to provide the long term policy
direction for regional policy statements and district plans prepared under the RMA. How
well these two planning statutes will succeed in working together to address problems of
urban growth management in New Zealand communities’ remains to be seen.
The Auckland Experience 3
Burdened by a historical legacy of lack of political leadership and poor planning,
Auckland has recently manifested a stronger political commitment to address issues of
urban growth management within the metropolitan region. Urban growth pressures and
associated congestion and pressures on services are most severe in Auckland compared to
elsewhere in New Zealand:
The Auckland region is home to almost 1.2 million people and has grown by
90,000 people (8.4 percent) since 1996.
The region has 30 percent of New Zealand’s population of 3.8 million.
54 percent of population growth over the last two decades was due to natural
increase and the balance due to domestic and international migration.
32 percent of New Zealand's workforce is in the Auckland Region.
The region is projected to reach 2 million people by 2050 (an average increase of
20,000 people per year).
Much of the region's infrastructure needs upgrading to meet increasing demand
and higher environmental standards. Over $2 billion needs to be spent in the next
25 years on water supply, drainage and transport alone.
Car use is growing by around 4 percent per year.
The Auckland Regional Council was established following local government reforms in
1988. Its predecessors had not proved particularly effective in addressing issues of
3 The following review is based on information obtained from the website for the Auckland Regional Growth Forum (www.growthforum.govt.nz) and interviews with two senior staff members of the Auckland Regional Council.
79
growth management on account of local parochialism and pressures from vested
development interests. The Regional Council’s urban growth strategy is for regional
urban containment matched by urban intensification policies at the local authority level.
This strategy has been developed during the last ten years and is being implemented
through a two-pronged approach. The first is via the Regional Policy Statement prepared
in 1994 within the statutory context of the RMA. The second is a non-statutory
collaborative strategic planning initiative which commenced in 1997 to bring together the
technical and political interests of the Auckland Regional Council and the constituent
local authorities and other public and private sector stakeholders. This initiative is known
as the Auckland Regional Growth Forum.
The Regional Policy Statement
The Metropolitan Urban Limits (MULs) is a technique used in the operative Auckland
Regional Policy Statement to define the boundary between the urban area and the rural
part of the region. The notion of controlling the outward spread of Auckland through an
urban growth boundary type mechanism has been a policy in Auckland regional planning
documents for nearly 50 years. The reasons for doing this have changed over time.
Originally, the primary objective was to sequence growth so that infrastructure could be
provided more efficiently and to protect highly productive agricultural land. More
recently, the main objectives of the MULs have been broadened to protect sensitive rural
and coastal environments from peripheral growth and to achieve containment and
intensification of the urban area.
The method by which the metropolitan urban limits have been determined and
implemented in Auckland has also changed over time. Earlier, under former town and
country planning legislation, the determination and implementation of the MULs was left
primarily in the hands of the individual territorial local authorities (TLAs), which was not
very effective. Under the RMA, the location of MULs has been defined in the Regional
Policy Statement (RPS) by the Auckland Regional Council. The RMA stipulates that
district plans must not be inconsistent with regional policy statements. Thus, the MULs
within the RPS have a controlling effect on land development policies of individual

80
territorial local authorities. For this reason, the role of the Auckland Regional Council to
determine urban growth limits was initially contested by some territorial local authorities
but subsequently affirmed by the Courts.
The Auckland Regional Growth Forum (ARGF)
The Auckland Regional Growth Forum (ARGF), established in 1996, is a cooperative
partnership between the Auckland Regional Council, the region’s territorial local
authorities and other stakeholder groups to further develop and implement the strategy for
managing the effects of growth in the Auckland region as set out in the Regional Policy
Statement. The ARGF was established to examine the options and alternatives for future
growth and to manage its effects on the environment, infrastructure and local
communities. Faced with a rapidly growing population, a demand for 300,000 more
dwellings by 2050 and huge infrastructure costs, the councils were compelled to work
more closely to resolve urban growth issues, a significant political departure from the
situation hitherto.
The Auckland Regional Growth Forum has 10 political members (mayors and
councilors), three from the Auckland Regional Council and one each from the seven
territorial local authorities. A "Steering Group" comprised of senior officers from the
same authorities, plus the Ministry for the Environment, provides overall technical
direction. The Auckland Regional Growth Forum is a standing committee of the
Auckland Regional Council. It is funded by the Auckland Regional Council through the
regional land rate. Other participating councils also fund the time of their elected
representatives and staff to support the Growth Forum. A 1998 amendment to the Local
Government Act 1974 formalized the existence and role of the Growth Forum and
established Infrastructure Auckland to make grants for land, passenger transport and
storm water infrastructure projects in the region.
The Regional Growth Forum has developed a Regional Growth Strategy looking ahead to
the year 2050 , which is now in the process of being implemented (Figure 2.13).
81
The need for such a strategy reflects the councils’ desires to work more collaboratively to
resolve urban growth issues. The Auckland Regional Growth Strategy is a product of
over three years’ planning involving technical investigations, political workshops and
extensive consultation with public and private sector organizations in the region, as well
as the general public and central government agencies. It builds on a draft strategy
published in 1998 and takes account of comments to that document. The Regional
Growth Strategy emphasizes an integrated approach to the long-term management of the
Auckland region. The strategy brings together a wide range of important policy directions
for the region, encompassing a partnership approach between Growth Forum members
and close consultation with their stakeholders and communities.
The Auckland Regional Growth Strategy was formally adopted in November 1999. It
provides a vision for what Auckland could look like in 2050 with a population of 2
million (Figure 2.14). It promotes quality compact urban environments and identifies,
among other things:
Areas in the region where urban development should not occur;
Opportunities for peripheral urban development and intensification in the future;
Appropriate locations for further employment growth; and
The implications for transport and other regional infrastructure.
Chapter 2 of the Growth Strategy provides a list of the values that the regional
community has said they want to protect and enhance over the next 50 years. These
desired regional outcomes include improving air and water quality, protecting the coastal
environment, habitat and heritage, and ensuring employment and housing choice and
business opportunity. Chapter 3 of the Growth Strategy outlines how these outcomes will
be achieved and what will be important for successful implementation of the strategy.

82
Figure 2.13 – The ARGS Development Process (Source: Regional Growth Forum 1999).
83
The key outcome areas relate to:
social infrastructure
housing choice and affordability
amenity and design
business and employment opportunities
transport
regional transport needs
servicing employment areas
transport needs of rural and coastal towns and suburban areas
transport needs of intensive urban areas
environment
physical infrastructure.
Implementation Process
When the region’s councils signed the Memorandum of Understanding in November
1999, they affirmed their support for and commitment to the implementation of the
Auckland Regional Growth Strategy.
The process for implementing the Growth Strategy has five themes:
partnerships and relationships;
the need for alignment of policy and funding;
long term vision and identified short term actions;
wide and adaptable range of implementation mechanisms; and
a process to keep the vision alive.
Keeping the vision alive is a key role of the Regional Growth Forum. It is also
responsible for coordinating the implementation of the strategy, as well as its monitoring
and review.

84
Figure 2.14 – The growth concept: 2050. (Source ARGF 1999)

85
Growth Forum partners (the ARC and the territorial local authorities) are developing a
strong advocacy role. They are principally responsible for ongoing participation and for
aligning their own policy and funding to support the strategy. The ARC is also
responsible for the Regional Land Transport Strategy, environmental management,
regional plans and purchasing passenger transport services from public transport
operators. The territorial local authorities are responsible for local land use planning and
infrastructure provision. Implementing the sector agreements involves participatory
community processes and a close working relationship with infrastructure providers, land
owners and the development industry.
A range of policy mechanisms is being used to implement the Auckland Regional
Growth Strategy, as shown in Figure 2.15.
Figure 2.15 – Policy mechanisms to implement the regional growth strategy (Source:
ARGF, 1999)

86
It is expected that policy approaches and tools will inevitably evolve and change over
time and around the region through an adaptive learning process. Some of the key drivers
of the implementation process are as follows:
Translating vision into action
The key planning approach is to provide more detail about the timing, sequencing and
form of growth and associated infrastructure through Sector Agreements (discussed
below). This process seeks to bring the broad vision of the Regional Growth Strategy
down to action and to fine tune what the strategy means on the ground.
Aligning policy and funding
The region’s councils are committed under the Memorandum of Understanding to align
their own corporate policy and funding priorities and processes to support the strategy.
This means that councils have agreed to initiate changes, within three years, to regional
and district plans under the Resource Management Act 1991, to ensure consistency with
the Regional Growth Strategy, and to implement the endorsed sector agreements. They
have also agreed that by no later than 2003/4 financial year their individual strategic, long
term financial and asset management plans and funding policies will clearly identify and
support the implementation of the Regional Growth Strategy.
Sector Agreements give more of the detail
A sector agreement identifies capacities for growth in each of the regional sectors and the
timing and sequencing of the release of that capacity to 2021. It also identifies the
provision of associated infrastructure, when statutory processes to release will commence
and how these processes will be funded. Sector agreements have now been developed and
endorsed for all parts of the region.
The Southern Sector Agreement (covering sequencing, timing and capacity for urban
development for Manukau City, Papakura and Franklin Districts) was endorsed by the
Growth Forum in March 2001. Consequently, the councils have notified changes to
87
district and regional plans to adjust the metropolitan urban limits (MUL) and to
incorporate new greenfield areas in Flatbush and Takanini. Planning is also underway for
more intensive nodal development focused initially on Papakura Central, the Glenora and
Spartan Roads of Takanini, Pukekhoe Central, Papatoetoe/Hunters Corner, Manukau City
Centre and Manurewa. The sector will accommodate a further 106,000 population in the
next 20 years, and 275,000 population over 50 years through greenfield, nodal and infill
development. The southern sector councils are now working on a rural sector agreement
in order to understand more clearly the capacity and demand for rural growth and its
implications, both in the rural areas and on the take-up of urban development
opportunities.
The Central Sector Agreement was endorsed by the Growth Forum in September 2001.
The central sector, which falls entirely within Auckland City, will accommodate up to a
further 94,000 people by 2021. Priority areas for growth include the Central Area and
Western and Eastern Strategic Growth management Areas (SGMAs) identified in the
Liveable Communities 2050 Strategy. This includes centres such as Avondale, Panmure,
Glen Innes and Newmarket, as well as new development areas such as Sylvia Park.
A joint North-West Sector Agreement (covering North Shore and Waitakere Cities and
Rodney District) was endorsed by the Growth Forum in September 2001. The North-
West Sector Agreement will add population capacities of 76,000 to North Shore City,
74,000 to Waitakere City and 71,000 to Rodney District, by 2021. In Waitakere, the
council is working through more detailed planning matters associated with intensification
within the existing urban area, the sequencing of development and MUL changes for the
future growth areas in the northern part of the city, as well as resolving outstanding
District Plan appeals.
Getting the transport network right
A doubling of the population will have major impacts on the transport system – major
transport improvements are needed. These will have significant community and
environmental implications.

88
An effective transport system is a key component of the Growth Strategy. The strategy
sees a shift in land use patterns to focus growth in more intensive mixed use centers
associated with access to the northern, western and southern passenger transit corridors,
as well as the main arterial roads. The growth strategy recognizes that transport
requirements and priorities for employment and residential areas (rural, suburban and
intensive) will differ.
The concentration of more people in an urban area gives more opportunities for better
passenger transport – more choice of routes and higher frequencies. Passenger transport
investment can also be a catalyst for achieving urban intensification. Significant
improvements will be needed to support the mixed use more intensive centers and
corridors. Careful design will be essential to maintain and improve liveability in these
areas and to manage the conflicting needs of pedestrians, cyclists, buses, cars and
passenger transit systems. Future roading investment will also be needed to maintain
accessibility on the region’s arterial network and to the port and airport.
The Regional Land Transport Strategy is the key mechanism to develop the transport
system. Released in 1999, it is currently under review. The region’s Passenger Transport
Action Plan identifies passenger transport investment required to help achieve transport
and growth objectives.
Cost sharing arrangements
Much of the Auckland region’s infrastructure is already under pressure and needs
upgrading to meet increasing demand and higher environmental standards: wastewater
and storm water treatment, water supply, transport, energy, refuse disposal, as well as
providing for education, health, community services and open space. Over $7 billion
needs to be spent in the next 25 years on water supply, drainage and transport alone.
While a mixture of land tax and user charges will continue to meet the bulk of those
costs, development levies and other funding mechanisms are expected to feature more
prominently (e.g. congestion pricing). Other funding bodies such as Infrastructure
Auckland (transport and stormwater), the government’s road funding agency

89
(Transfund), and service delivery companies such as Watercare and private companies,
such as Telecom, will also be important in the mix. The coordination of this investment is
crucial.
Monitoring
A monitoring program has been developed with a threefold focus: measuring growth in
the region, measuring the effects of that growth on valued aspects of the region, and
measuring the implementation efforts of the Forum partners (ARGF, undated). A crucial
part of the Regional Growth Strategy is the concept that the document will change as
circumstances change. Such changes might include central government policy reforms or
significant market shifts. Like wise, periodic monitoring may indicate that strategy
outcomes are not being achieved over time. Some key indicators being monitored are: is
the Growth Strategy promoting strong supportive communities, a high quality living and
natural environment and good accessibility? Are more people living in intensive mixed
use areas? Do they like it? Are they traveling less for work and leisure and have travel
choices improved? Can new and expanding businesses find suitable premises or land, in
the right locations and with the appropriate infrastructure? Are the beaches any cleaner?
Are people happy with local parks, shops, health, recreational and education facilities?
How do they rate Auckland as a place to live?
The Growth Strategy is also subject to an annual audit of performance. This focuses on
whether each of the Growth Forum partners (the region’s councils) are pulling their
weight in terms of their own responsibilities for implementing and supporting the Growth
Strategy. Certain commitments are outlined in the Memorandum of Understanding and in
the sector agreements, endorsed by all councils.
The results of the monitoring program are used to assess whether or not the outcomes of
the strategy are being met and whether changes to implementation methods or the policy
itself are needed when the strategy is reviewed. The strategy looks out 50 years and the
achievement of some of the desired regional outcomes will only be measurable in that
longer term. The Growth Strategy will be reviewed every five years. The first major
90
review will be in 2004/5, when there will be an opportunity for wide public and
stakeholder input to complement research and monitoring data.
Conclusions on New Zealand’s Planning
In contrast to the other metropolitan cities in New Zealand, Auckland has manifestly been
more successful in crafting workable institutional arrangements for developing and
implementing a strategy for addressing wide ranging and inter-related concerns related to
Auckland’s urban form and structure sustainability framework. These issues have been
recently addressed in Auckland through a process of public dialogue and research in the
context of the preparation of the Auckland Regional Policy Statement and the parallel
Urban Growth Forum. The Forum considered strategic growth issues for the next 50
years. More significantly, this Forum brought the councils together and, as an important
milestone, led to the signing by both Mayors and Chief Executives in November 1999 of
a joint Memorandum of Understanding (MoU). Central government has played a key role
in encouraging collaborative planning.
That memorandum also identified the urban growth related issues to be covered by all
councils and service agencies in three Sector Agreements covering the whole region. This
work was undertaken during 2000/2001and included a program for staging of the
development, management of the urban limits and provision of utility services. Sector
Agreements have been prepared by the local councils in consultation with the regional
council, service providers, central government agencies, land owners and the private
sector. Each Sector Agreement also defines a means of monitoring the programme to
ensure it meets the targets of the Regional Growth Strategy.
After the signing of the Urban Growth Forum’s MoU, the Sector Agreements were
adopted within the second three year electoral term of the councils. Thus, the whole of
this non-statutory exercise that binds the political and technical arms of the city/district
councils together with the regional council took only six years and was free from major
Environment Court (and High Court) actions, in significant contrast to the experience
with the Regional Policy Statement during the mid-1990s. It could be argued that such a

91
public information and consultation process is essential for all of the five metropolitan
regions in New Zealand. It provides leadership and guidance on sustainable development
and lays the groundwork for managing cumulative effects of urban growth and change
within the context of the RMA.
However, on account of contextual differences, it would be unrealistic to expect that the
Auckland growth management model can be read across elsewhere in New Zealand or,
indeed, overseas. Inevitably, tensions continue to surface in the negotiations amongst the
different Auckland stakeholders during the course of implementing the growth strategy.
What the Auckland case study clearly demonstrates, nevertheless, is that in a plural land
owning democracy such as New Zealand or Michigan, an urban metropolitan region
cannot be planned by a single regional authority alone. Cooperation, mutual respect and
collaboration must be achieved between district and regional councils as planning
authorities, other statutory and community stakeholder groups and central government.
An agreement or Memorandum of Understanding (MoU), outside the statutory RMA
process, as emerged from the Auckland Regional Growth Forum, can be an effective
political catalyst and a foundation for a statutory regional plan. The MoU was necessary
to the development of an agreed Regional Growth Strategy and management of the
Metropolitan Urban Limits (MUL). The outcomes of these consultative processes can
then be embedded in the more explicit statutory provisions of the Regional Policy
Statement (RPS) for a regional settlement strategy and in the more detailed district plan
provisions for land use regulation by territorial local authorities.
The relationship between the LTCCPs, required to be completed by all local authorities
by 2006 under the provisions of the new Local Government Act 2002, and the Auckland
Regional Growth Strategy still remains to be clarified. It is likely that the Regional
Growth Strategy will sit under the umbrella of the LTCCP for the Auckland region as
may the reviewed Regional Land Transport Strategy and possibly other regional
strategies for affordable housing, open space, the coast and for recreation.

92
2.8 Guidelines and Indicators for Monitoring and Evaluation The principal goals of monitoring and evaluation is to ensure that (clearly defined)
program or project objectives are reached by means of monitoring and evaluation at
intermediate and final stages of implementation. Resulting feedback is used to make the
necessary implementation adjustments, assuming that it is still realistic to achieve basic
goals and related objectives. Goals and objectives should be well-articulated and
expressed in qualitative or (ideally) in quantitative terms: objective target indicators that
can be measured and evaluated.
Base line studies are part of this process. They help to diagnose issues and problems and,
therefore can be used to express the current state or problems in terms of diagnostic
indicators. As such, base line studies or resource inventories represent the first phase of
economic development planning and project feasibility studies. The inventory identifies
the status of principal components of the four ecosystem components -- soil, water, plants
and wildlife, as well as non-renewable resources such as minerals, but also identifies
current land cover/use patterns and trends. Most base line studies define the bio-physical
parameters of the resource base and, therefore, may be used to derive composite
biological productive indices. Examples include wetland ecosystem productivity or the
agricultural productivity of certain agro-ecological zones.
For instance, a comparative crop productivity index may be derived, using a combination
of soil types (e.g., textural classes), climate parameters (soil water balance) and
topography (impacts on surface recharge and evapotranspiration) to depict relative
production (moisture) constraints by agro-ecological zones or administrative district. In
the case of food security concerns, this provides an example of a diagnostic (problem)
index, which may be used to identify the comparative advantage of alternative locations
to meet national or regional food production needs. Similarly, current use intensity and
trends may be used to identify potential conflicts, now and in the future, where existing
carrying capacity may be exceeded or where harvest/depletion rates exceed reproductive
capacity.
93
Such diagnostic demand analysis framework, including some relevant diagnostic
indicators, is suggested to systematically identify needs, opportunities and targets in the
form of biophysical and socioeconomic indicators.
Performance and monitoring indicators are primarily intended to evaluate the degree of
success (or failure) in reaching development objectives, measured in the form of specific
standards or policy targets. Below, several examples are introduced which attempt to
illustrate the use of composite indicators in this regard. It is important to realize that
development of these indicators is not an objective in itself, rather the intent is to design
effective measures that can be used to evaluate program or project performance and
adjust policies and their implementation. The following grouping of major policy target
areas is suggested with a focus on relevant measures with respect to:
a) the status and quality of the resource base – emphasizing supply-side policy issues or
supply indicators,
b) the resource capacity, use rates and trends – emphasizing demand-side policy issues
or demand indicators,
c) natural and human-managed ecosystems, their relative exposure and vulnerability to
human intervention and use – emphasizing life support indicators, and
d) land use policy and quality of life impacts – with an specific emphasis on human
exposure and risk - emphasizing impact indicators.
The following examples of aggregate target indicators that can be measured and
monitored are provided:
Resource Capacity and Quality. Here various composite indicators may be used to
define the productive status (supply, availability and quality) of renewable and non-
renewable resource, including soils, minerals, air and water. For instance, the
following composite environmental indicators may be used to describe air, water or
soil quality:
a) Climate change – including single concentration indicators for CO2, CH4 and N2O
b) Ozone depletion – including CFC-11 and - 12 emissions
94
c) Acidification of the environment – SOx, NOx, NH3 emissions and concentrations
d) Eutrophication of the Environment – N, P concentrations in water and soil
e) Dispersion of toxic substances – including heavy metals and known carcinogens
f) Dispersion of toxic substances Indicator – pathways and dispersal rates effecting
risk,
g) Generation and disposal of solid waste, and
h) Composite pollution indicator – the latter a composite of 6 indicators each
measured in units of environmental pressure equivalents, including environmental
change, acidification, eutrophication, toxic dispersion, waste disposal and
disturbance.
Resource Depletion. This composite indicator can be formulated for countries and
regions, measuring the ratio of resource depletion and the gross capital formulation. It
illustrates how human activities based on natural resources production or extraction
can be sustained. This includes typical examples of mineral and fossil fuel extraction
and also those of renewable resources (the supporting resource base), including
managed ecosystems such as agriculture, fisheries and forests, and groundwater
systems. Examples include water resource use/demand and quality, forest biomass
regeneration, reforestation and harvest rates, aquatic resources including fishery
stocks and harvest rates, soils resources and degradation rates. The ratio with capital
formation illustrates the value of the decline of the resource stocks (or capital)
relative to the value of investments in human-made capital. This ratio identifies
sustainable use policies as those creating new fixed assets equal or of greater value
than those depleted by resource use.
Ecosystem Protection and Vulnerability. This composite indicator is designed to
represent the degree of protection that essential and critical ecosytems are accorded
through national environmental policies, laws and regulations. It may reflect the type,
degree and areal extent of ecosystem protection and the vulnerabilities of ecosystems
and the composing species. Biodiversity, as a measure expressing the number of
species per area unit, can be used as an effective indicator in this process. However,
policies should not focus simply on this single performance indicator but rather
attempt to measure integral ecosystem characteristics, including their functional

95
capacities, connectivity and fragmentation (critical size). Vulnerability must address
the degree of protection through buffer zones and other management practices, which
may threaten the long-term viability of ecosystems.
Human quality of life conditions. This include the basic notion of primary needs
(food, shelter and clothing and related measures of employment and income), the
secondary needs such as more discretionary measures as education, health care and
environmental risk factors (e.g. water quality and sanitation), and the tertiary needs or
wants, such as access to recreational opportunity, other community services and other
aspects of environmental / ecosystem quality.
An example of a systematic framework to develop specific indicators by linking
indicators to specific development goals is provided in the table (2.3), below.
Table 2.3 - Comparative World Development Indicators linked to the Eight Millennium Development Goals for Indonesia (Source: World Bank). MILLENNIUM DEVELOPMENT GOALS YEAR
1990
1995
2000
2007
Goal 1: Eradicate extreme poverty and hunger Employment to population ratio, 15+, total (%) 63 62 63 62 Employment to population ratio, ages 15-24, total (%) 46 43 45 41 GDP per person employed (annual % growth) 4 7 3 2 Income share held by lowest 20% .. .. .. 7.1
Malnutrition prevalence, weight for age (% of children under 5) 31.0
27.4
24.8 24.4
Poverty gap at $1.25 a day (PPP) (%) .. .. .. .. Poverty headcount ratio at $1.25 a day (PPP) (% of population) .. .. .. .. Prevalence of undernourishment (% of population) 19 13 .. 17 Vulnerable employment, total (% of total employment) .. 63 65 63 Goal 2: Achieve universal primary education Literacy rate, youth female (% of females ages 15-24) 95 .. .. 96 Literacy rate, youth male (% of males ages 15-24) 97 .. .. 97 Persistence to last grade of primary, total (% of cohort) 78 .. 86 79 Primary completion rate, total (% of relevant age group) 94 96 95 99 Total enrollment, primary (% net) .. .. 97 97 Goal 3: Promote gender equality and empower women Proportion of seats held by women in national parliaments (%) 12 13 8 11 Ratio of female to male enrollments in tertiary education .. .. 76 79

96
Ratio of female to male primary enrollment 96 96 97 96 Ratio of female to male secondary enrollment 83 .. 95 100 Share of women employed in the nonagricultural sector (% of total nonagricultural employment)
29.2
29.0
31.7 29.3
Goal 4: Reduce child mortality Immunization, measles (% of children ages 12-23 months) 58 63 72 80 Mortality rate, infant (per 1,000 live births) 60 48 36 25 Mortality rate, under-5 (per 1,000) 91 66 48 31 Goal 5: Improve maternal health Adolescent fertility rate (births per 1,000 women ages 15-19) .. 52 49 40 Births attended by skilled health staff (% of total) 32 37 64 .. Contraceptive prevalence (% of women ages 15-49) 50 55 .. 61 Maternal mortality ratio (modeled estimate, per 100,000 live births) .. .. .. 420 Pregnant women receiving prenatal care (%) 76 82 .. 93 Unmet need for contraception (% of married women ages 15-49) 14 11 .. .. Goal 6: Combat HIV/AIDS, malaria, and other diseases Children with fever receiving antimalarial drugs (% of children under age 5 with fever) .. .. 1 ..
Condom use, population ages 15-24, female (% of females ages 15-24) .. .. .. ..
Condom use, population ages 15-24, male (% of males ages 15-24) .. .. .. .. Incidence of tuberculosis (per 100,000 people) 343 304 270 228 Prevalence of HIV, female (% ages 15-24) .. .. .. 0.1 Prevalence of HIV, male (% ages 15-24) .. .. .. 0 Prevalence of HIV, total (% of population ages 15-49) .. .. 0.1 0.2 Tuberculosis cases detected under DOTS (%) .. 1 20 68 Goal 7: Ensure environmental sustainability CO2 emissions (kg per PPP $ of GDP) 0.6 0.5 0.6 0.6 CO2 emissions (metric tons per capita) 0.8 1.2 1.4 1.9 Forest area (% of land area) 64 59 54 49 Improved sanitation facilities (% of population with access) 51 51 52 52 Improved water source (% of population with access) 72 74 77 80 Marine protected areas, (% of surface area) .. .. .. .. Nationally protected areas (% of total land area) .. .. .. 11.2 Goal 8: Develop a global partnership for development Aid per capita (current US$) 10 7 8 4 Debt service (PPG and IMF only, % of exports, excluding workers' remittances) 26 17 11 6
Internet users (per 100 people) 0.0 0.0 0.9 5.8 Mobile cellular subscriptions (per 100 people) 0 0 2 36 Telephone lines (per 100 people) 1 2 3 8 Other Fertility rate, total (births per woman) 3.1 2.7 2.4 2.2 GNI per capita, Atlas method (current US$) 620 1,0 590 1,65
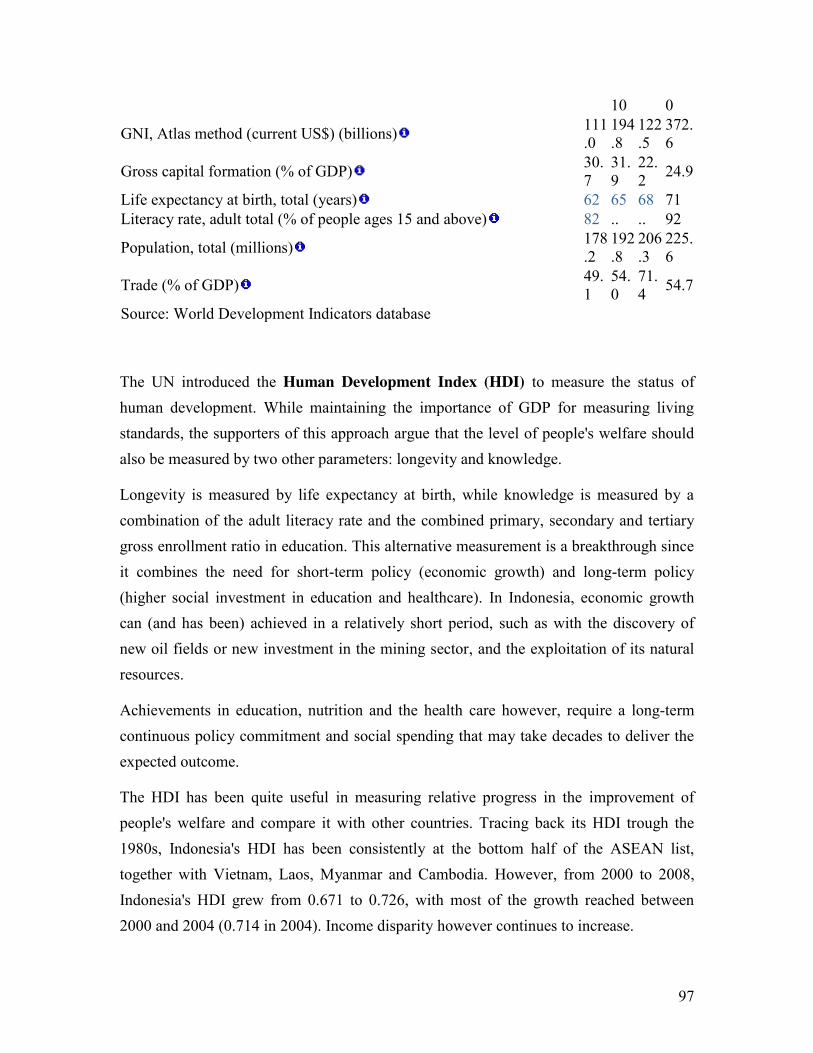
97
10 0
GNI, Atlas method (current US$) (billions) 111.0
194.8
122.5
372.6
Gross capital formation (% of GDP) 30.7
31.9
22.2 24.9
Life expectancy at birth, total (years) 62 65 68 71 Literacy rate, adult total (% of people ages 15 and above) 82 .. .. 92
Population, total (millions) 178.2
192.8
206.3
225.6
Trade (% of GDP) 49.1
54.0
71.4 54.7
Source: World Development Indicators database
The UN introduced the Human Development Index (HDI) to measure the status of human development. While maintaining the importance of GDP for measuring living standards, the supporters of this approach argue that the level of people's welfare should also be measured by two other parameters: longevity and knowledge.
Longevity is measured by life expectancy at birth, while knowledge is measured by a combination of the adult literacy rate and the combined primary, secondary and tertiary gross enrollment ratio in education. This alternative measurement is a breakthrough since it combines the need for short-term policy (economic growth) and long-term policy (higher social investment in education and healthcare). In Indonesia, economic growth can (and has been) achieved in a relatively short period, such as with the discovery of new oil fields or new investment in the mining sector, and the exploitation of its natural resources.
Achievements in education, nutrition and the health care however, require a long-term continuous policy commitment and social spending that may take decades to deliver the expected outcome.
The HDI has been quite useful in measuring relative progress in the improvement of people's welfare and compare it with other countries. Tracing back its HDI trough the 1980s, Indonesia's HDI has been consistently at the bottom half of the ASEAN list, together with Vietnam, Laos, Myanmar and Cambodia. However, from 2000 to 2008, Indonesia's HDI grew from 0.671 to 0.726, with most of the growth reached between 2000 and 2004 (0.714 in 2004). Income disparity however continues to increase.

98
In the HDI only income and gross enrolment are somewhat responsive to short term
policy changes. For that reason, it is important to examine changes over time. The human
development index trends tell an important story in that respect. Between 1980 and 2007
Indonesia's HDI rose by 1.26% annually from 0.522 to 0.734 today. The 5 columns
below summarize the relative world ranking of Indonesia by composite HDI, Life
Expectancy, Literacy, Combined Educational Enrollment and GDP4.
HDI value Life expectancy at birth (years)
Adult literacy rate (% ages 15 and above)
Combined gross enrolment ratio (%)
GDP per capita (PPP US$)
111. Indonesia (0.734)
99. Indonesia (70.5)
61. Indonesia (92.0)
115. Indonesia (68.2)
121. Indonesia (3,712)
2.9 Agrarian Reform, Crop Diversification and Import Substitution Opportunities for Rural Development in the RI One fundamental objective of rural development is to optimize crop production
opportunities given existing production practices and evolve these practices and cropping
systems over time to meet domestic and export needs. Given the small scale, subsistence
agriculture of areas considered for priority agrarian reform initiatives, it is essential to
look at crop diversification and expansion opportunities for small scale producers that
could meet domestic needs. It is well-know that large amount of products are imported to
meet domestic demand, such as from China.
In this context, the potential role of small-scale producers, aided by potential cooperative
input, harvesting, processing, and marketing arrangements should be investigated. Small
scale producers could focus specifically on fruits and vegetables, grown on existing or
new homesteads as part of a land distribution scheme, or could cultivate larger areas held
as communal land and given land use rights on substantial hectares to cultivate. The
4 For a complete listing of measures included in Indonesia’s 2009 world rank of 111 see: http://hdrstats.undp.org/en/countries/data_sheets/cty_ds_IDN.htmlhttp://hdrstats.undp.org/en/countries/data_sheets/cty_ds_IDN.html
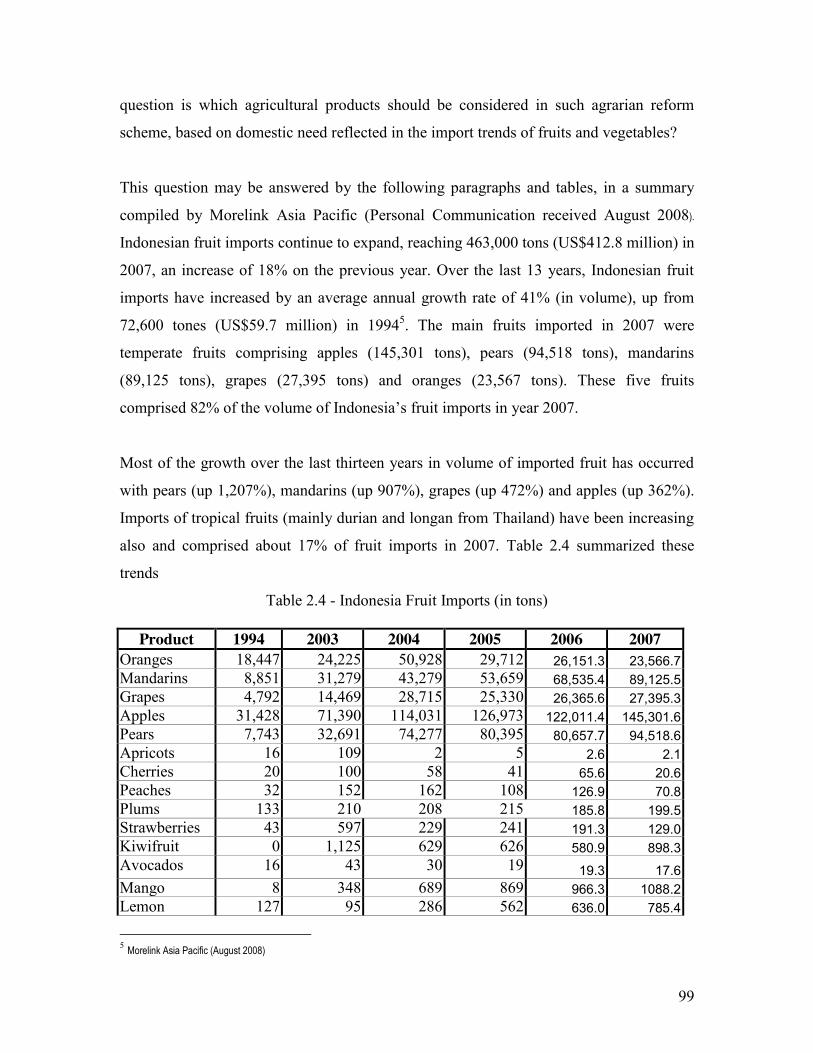
99
question is which agricultural products should be considered in such agrarian reform
scheme, based on domestic need reflected in the import trends of fruits and vegetables?
This question may be answered by the following paragraphs and tables, in a summary
compiled by Morelink Asia Pacific (Personal Communication received August 2008).
Indonesian fruit imports continue to expand, reaching 463,000 tons (US$412.8 million) in
2007, an increase of 18% on the previous year. Over the last 13 years, Indonesian fruit
imports have increased by an average annual growth rate of 41% (in volume), up from
72,600 tones (US$59.7 million) in 19945. The main fruits imported in 2007 were
temperate fruits comprising apples (145,301 tons), pears (94,518 tons), mandarins
(89,125 tons), grapes (27,395 tons) and oranges (23,567 tons). These five fruits
comprised 82% of the volume of Indonesia’s fruit imports in year 2007.
Most of the growth over the last thirteen years in volume of imported fruit has occurred
with pears (up 1,207%), mandarins (up 907%), grapes (up 472%) and apples (up 362%).
Imports of tropical fruits (mainly durian and longan from Thailand) have been increasing
also and comprised about 17% of fruit imports in 2007. Table 2.4 summarized these
trends
Table 2.4 - Indonesia Fruit Imports (in tons)
Product 1994 2003 2004 2005 2006 2007 Oranges 18,447 24,225 50,928 29,712 26,151.3 23,566.7 Mandarins 8,851 31,279 43,279 53,659 68,535.4 89,125.5 Grapes 4,792 14,469 28,715 25,330 26,365.6 27,395.3 Apples 31,428 71,390 114,031 126,973 122,011.4 145,301.6 Pears 7,743 32,691 74,277 80,395 80,657.7 94,518.6 Apricots 16 109 2 5 2.6 2.1 Cherries 20 100 58 41 65.6 20.6 Peaches 32 152 162 108 126.9 70.8 Plums 133 210 208 215 185.8 199.5 Strawberries 43 597 229 241 191.3 129.0 Kiwifruit 0 1,125 629 626 580.9 898.3 Avocados 16 43 30 19 19.3 17.6 Mango 8 348 689 869 966.3 1088.2 Lemon 127 95 286 562 636.0 785.4
5 Morelink Asia Pacific (August 2008)

100
Grapefruit 150 64 352 350 657.3 302.1 Water melon 140 39 148 668 441.8 921.2 Other melon 0 142 656 171 207.3 111.0 Other berries 1 749 98 23 15.2 33.0 Durian 432 3,099 11,087 11,351 16,334.2 23,149.0 Other Tropical Fruit
281 18,378 34,073 42,275 47,067.6 55,504.6
Total 72,661 199,304 359,935 373,594 391,219.6 463,140.1 Source: BPS (Bureau of Statistics Indonesia)
Similarly, Indonesian vegetable imports increased by an average of 65% per year since
1994 to reach 505,000 tonnes (US$193 million) in 2007, up from 54,000 tonnes in 1994
(US$33 million). The main vegetables imported in 2007 were garlic (341,102 tonnes),
shallots (107,649 tons), onions (25,448 tonnes) and carrots (20,433 tonnes). These four
vegetables comprised 98% of the volume of Indonesia’s vegetable imports in year 2004.
(Table 2.5)
The major suppliers of the four main imported vegetables are as follows:
Garlic - China (99%) Shallots – Thailand (76%), Philippines (11%) Onions – New Zealand (40%), Netherlands (33%), India (12%), China (8%) Carrots – China (91%)
Table 2.5 – Trends in Indonesia Vegetable Imports over a 13-year Period
Total of Indonesia's Imports of Selected Fresh Vegetables, by Volume, 1994 – 2007 (Tons) Commodity Descripton 1994 1996 1998 2000 2002 2006 2007
Potatoes, Fresh or Chilled Seed 866.0 1,209.7 362.9 1,255.2 1,435.7
1,487.2
1,392.7
Potatoes, Fresh/Chilled other than Seed 332.1 894.4 682.3 4,569.1
2,336.4
4,210.6
5,559.2
Tomatoes 219.0 141.5 108.9 606.8 1,710.6
227.5
207.8
Onions 6,340.0 10,242.6 10,392.9 13,357.9 12,913.1
21,247.3
25,448.8
Shallots 15,213.3 42,057.4 43,016.8 53,710.8 32,928.8
78,462.1
107,649.2
Garlic 29,625.6 59,893.1 138,492.5 174,035.7 226,084.9
296,475.8
341,102.0
Leeks 90.6 159.0 281.0 163.8 2,021.6
959.4
929.1
Cauliflowers & Head Broccoli 160.5 179.0 166.8 172.1
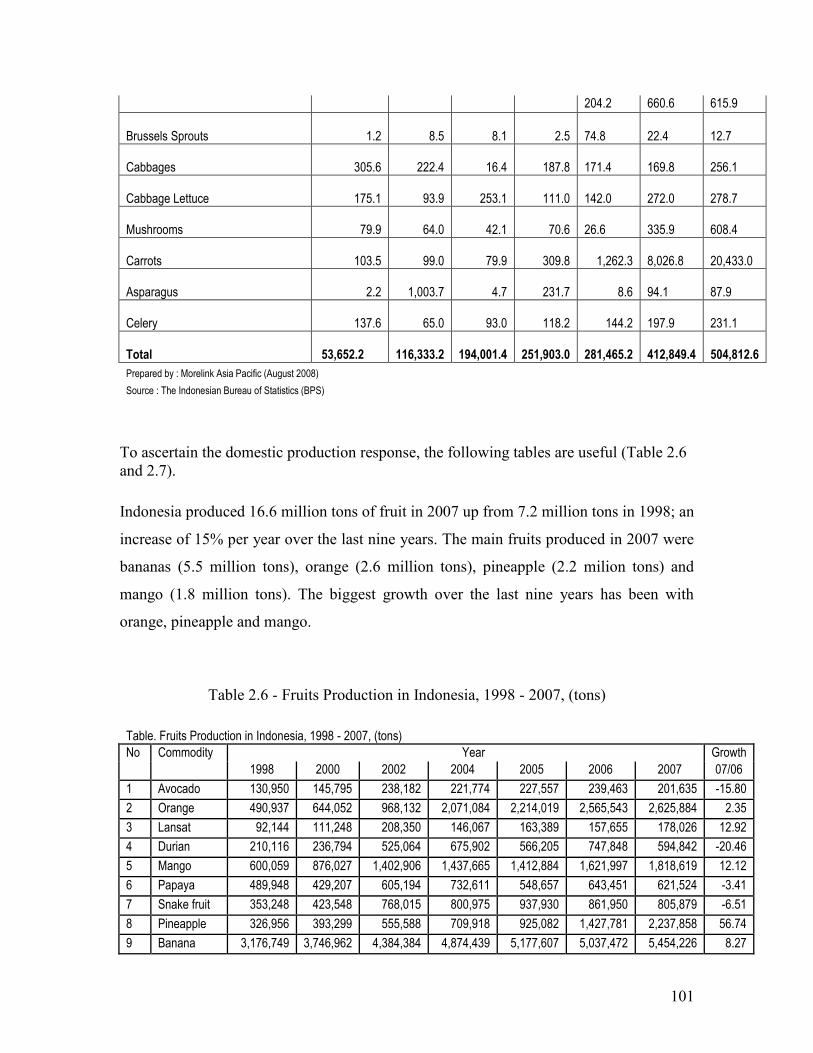
101
204.2 660.6 615.9
Brussels Sprouts 1.2 8.5 8.1 2.5 74.8
22.4
12.7
Cabbages 305.6 222.4 16.4 187.8 171.4
169.8
256.1
Cabbage Lettuce 175.1 93.9 253.1 111.0 142.0
272.0
278.7
Mushrooms 79.9 64.0 42.1 70.6 26.6
335.9
608.4
Carrots 103.5 99.0 79.9 309.8 1,262.3 8,026.8
20,433.0
Asparagus 2.2 1,003.7 4.7 231.7 8.6 94.1
87.9
Celery 137.6 65.0 93.0 118.2 144.2 197.9
231.1
Total 53,652.2 116,333.2
194,001.4
251,903.0
281,465.2
412,849.4
504,812.6
Prepared by : Morelink Asia Pacific (August 2008) Source : The Indonesian Bureau of Statistics (BPS)
To ascertain the domestic production response, the following tables are useful (Table 2.6 and 2.7). Indonesia produced 16.6 million tons of fruit in 2007 up from 7.2 million tons in 1998; an
increase of 15% per year over the last nine years. The main fruits produced in 2007 were
bananas (5.5 million tons), orange (2.6 million tons), pineapple (2.2 milion tons) and
mango (1.8 million tons). The biggest growth over the last nine years has been with
orange, pineapple and mango.
Table 2.6 - Fruits Production in Indonesia, 1998 - 2007, (tons)
Table. Fruits Production in Indonesia, 1998 - 2007, (tons) No Commodity Year Growth 1998 2000 2002 2004 2005 2006 2007 07/06 1 Avocado 130,950 145,795 238,182 221,774 227,557 239,463 201,635 -15.80 2 Orange 490,937 644,052 968,132 2,071,084 2,214,019 2,565,543 2,625,884 2.35 3 Lansat 92,144 111,248 208,350 146,067 163,389 157,655 178,026 12.92 4 Durian 210,116 236,794 525,064 675,902 566,205 747,848 594,842 -20.46 5 Mango 600,059 876,027 1,402,906 1,437,665 1,412,884 1,621,997 1,818,619 12.12 6 Papaya 489,948 429,207 605,194 732,611 548,657 643,451 621,524 -3.41 7 Snake fruit 353,248 423,548 768,015 800,975 937,930 861,950 805,879 -6.51 8 Pineapple 326,956 393,299 555,588 709,918 925,082 1,427,781 2,237,858 56.74 9 Banana 3,176,749 3,746,962 4,384,384 4,874,439 5,177,607 5,037,472 5,454,226 8.27
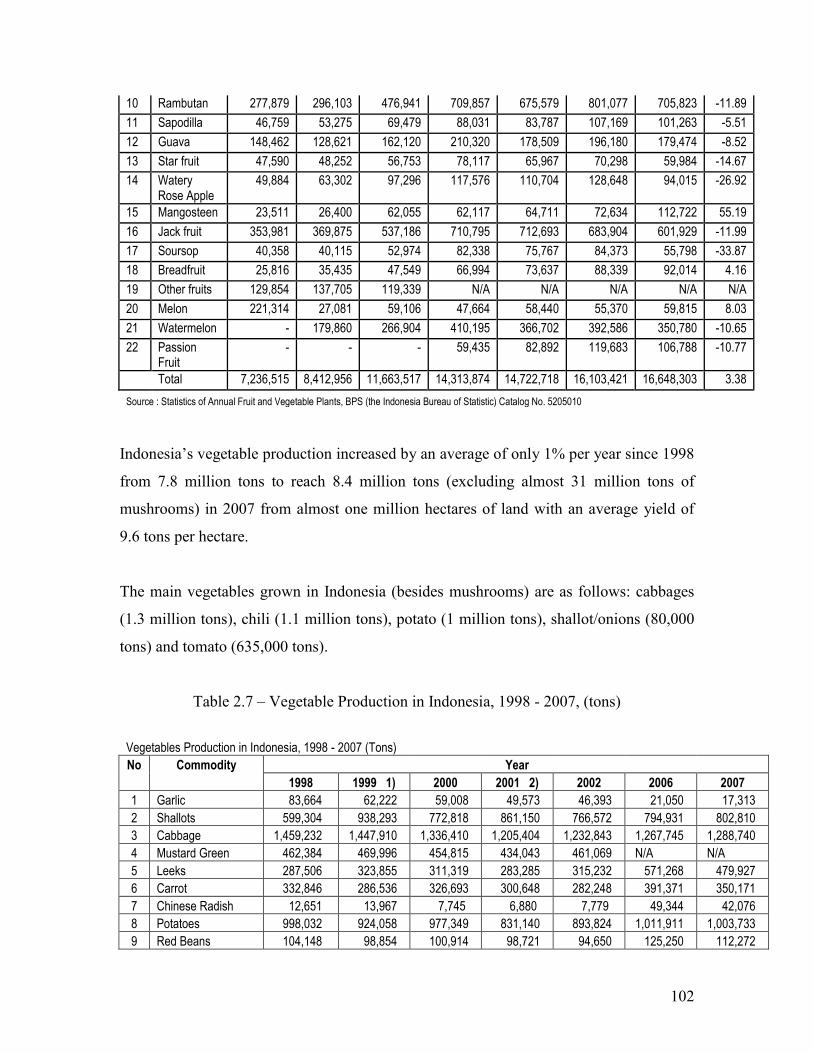
102
10 Rambutan 277,879 296,103 476,941 709,857 675,579 801,077 705,823 -11.89 11 Sapodilla 46,759 53,275 69,479 88,031 83,787 107,169 101,263 -5.51 12 Guava 148,462 128,621 162,120 210,320 178,509 196,180 179,474 -8.52 13 Star fruit 47,590 48,252 56,753 78,117 65,967 70,298 59,984 -14.67 14 Watery
Rose Apple 49,884 63,302 97,296 117,576 110,704 128,648 94,015 -26.92
15 Mangosteen 23,511 26,400 62,055 62,117 64,711 72,634 112,722 55.19 16 Jack fruit 353,981 369,875 537,186 710,795 712,693 683,904 601,929 -11.99 17 Soursop 40,358 40,115 52,974 82,338 75,767 84,373 55,798 -33.87 18 Breadfruit 25,816 35,435 47,549 66,994 73,637 88,339 92,014 4.16 19 Other fruits 129,854 137,705 119,339 N/A N/A N/A N/A N/A 20 Melon 221,314 27,081 59,106 47,664 58,440 55,370 59,815 8.03 21 Watermelon - 179,860 266,904 410,195 366,702 392,586 350,780 -10.65 22 Passion
Fruit - - - 59,435 82,892 119,683 106,788 -10.77
Total 7,236,515 8,412,956 11,663,517 14,313,874 14,722,718 16,103,421 16,648,303 3.38 Source : Statistics of Annual Fruit and Vegetable Plants, BPS (the Indonesia Bureau of Statistic) Catalog No. 5205010
Indonesia’s vegetable production increased by an average of only 1% per year since 1998
from 7.8 million tons to reach 8.4 million tons (excluding almost 31 million tons of
mushrooms) in 2007 from almost one million hectares of land with an average yield of
9.6 tons per hectare.
The main vegetables grown in Indonesia (besides mushrooms) are as follows: cabbages
(1.3 million tons), chili (1.1 million tons), potato (1 million tons), shallot/onions (80,000
tons) and tomato (635,000 tons).
Table 2.7 – Vegetable Production in Indonesia, 1998 - 2007, (tons)
Vegetables Production in Indonesia, 1998 - 2007 (Tons) No Commodity Year 1998 1999 1) 2000 2001 2) 2002 2006 2007 1 Garlic 83,664 62,222 59,008 49,573 46,393 21,050 17,313 2 Shallots 599,304 938,293 772,818 861,150 766,572 794,931 802,810 3 Cabbage 1,459,232 1,447,910 1,336,410 1,205,404 1,232,843 1,267,745 1,288,740 4 Mustard Green 462,384 469,996 454,815 434,043 461,069 N/A N/A 5 Leeks 287,506 323,855 311,319 283,285 315,232 571,268 479,927 6 Carrot 332,846 286,536 326,693 300,648 282,248 391,371 350,171 7 Chinese Radish 12,651 13,967 7,745 6,880 7,779 49,344 42,076 8 Potatoes 998,032 924,058 977,349 831,140 893,824 1,011,911 1,003,733 9 Red Beans 104,148 98,854 100,914 98,721 94,650 125,250 112,272
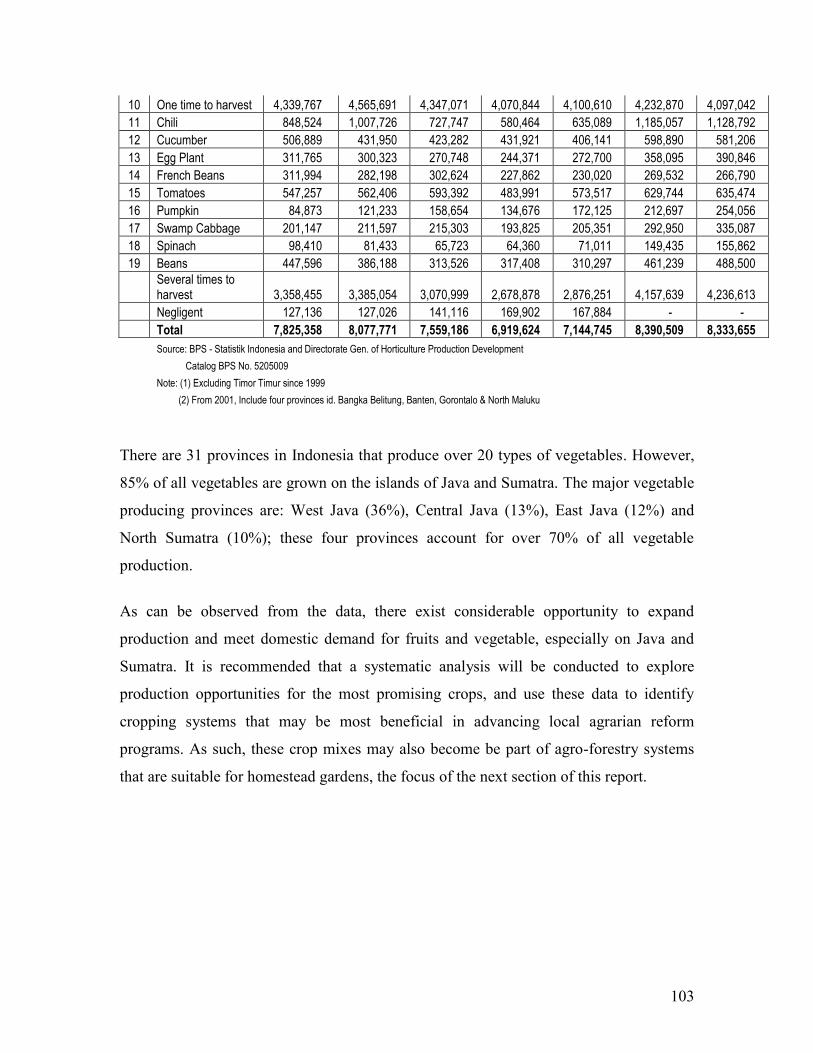
103
10 One time to harvest 4,339,767 4,565,691 4,347,071 4,070,844 4,100,610 4,232,870 4,097,042 11 Chili 848,524 1,007,726 727,747 580,464 635,089 1,185,057 1,128,792 12 Cucumber 506,889 431,950 423,282 431,921 406,141 598,890 581,206 13 Egg Plant 311,765 300,323 270,748 244,371 272,700 358,095 390,846 14 French Beans 311,994 282,198 302,624 227,862 230,020 269,532 266,790 15 Tomatoes 547,257 562,406 593,392 483,991 573,517 629,744 635,474 16 Pumpkin 84,873 121,233 158,654 134,676 172,125 212,697 254,056 17 Swamp Cabbage 201,147 211,597 215,303 193,825 205,351 292,950 335,087 18 Spinach 98,410 81,433 65,723 64,360 71,011 149,435 155,862 19 Beans 447,596 386,188 313,526 317,408 310,297 461,239 488,500
Several times to harvest 3,358,455 3,385,054 3,070,999 2,678,878 2,876,251 4,157,639 4,236,613
Negligent 127,136 127,026 141,116 169,902 167,884 - - Total 7,825,358 8,077,771 7,559,186 6,919,624 7,144,745 8,390,509 8,333,655 Source: BPS - Statistik Indonesia and Directorate Gen. of Horticulture Production Development Catalog BPS No. 5205009 Note: (1) Excluding Timor Timur since 1999 (2) From 2001, Include four provinces id. Bangka Belitung, Banten, Gorontalo & North Maluku
There are 31 provinces in Indonesia that produce over 20 types of vegetables. However,
85% of all vegetables are grown on the islands of Java and Sumatra. The major vegetable
producing provinces are: West Java (36%), Central Java (13%), East Java (12%) and
North Sumatra (10%); these four provinces account for over 70% of all vegetable
production.
As can be observed from the data, there exist considerable opportunity to expand
production and meet domestic demand for fruits and vegetable, especially on Java and
Sumatra. It is recommended that a systematic analysis will be conducted to explore
production opportunities for the most promising crops, and use these data to identify
cropping systems that may be most beneficial in advancing local agrarian reform
programs. As such, these crop mixes may also become be part of agro-forestry systems
that are suitable for homestead gardens, the focus of the next section of this report.
104
2.10 Defining Prototype Homestead Agro-forestry Systems and Potential Land Utilization Systems in Pilot Agrarian Reform Schemes. As indicated earlier, the primary objective of land evaluation is to determine the
suitability of land use alternatives given prevailing agro-ecological conditions. In the
context of potential large land distribution schemes, the question is how to define Land
Utilization Types (LUTs) that reflect the most promising farming system or agro-forestry
mix that could represent a series of best land use alternatives and derived household
production systems. Such LUTs would ideally be the focus of agrarian reform pilot
schemes based on well-defined tenures and land rights arrangements based on private or
communal property rights or a mix, thereof, and potential cooperative arrangements on
input, harvesting, processing, packages and transportation within the new or existing
community development program.
A recent evaluation of homestead agro-forestry systems on Java indicated that small
households cultivating as little as 120-1000 square meters may already benefit for such
land use arrangements, even if the primary source of income is outside the household6.
A survey of very small scale homestead farming systems in three Javanese provinces was
conducted to analyze the potential beneficial effects on household’s quality of life.
Aspects included: (1) diet and nutrition, (2) income, (3) level of goods and material
assets, (4) family status, (5) credit access, and (6) the role of women in managing
production and marketing.
The survey encompassed sites on West , Central and East Java, representing a wide range
of agro-ecological, 6 watersheds, elevation, socio-cultural conditions and stages of
development. The plot sizes evaluated ranged from < 120 m2 with no other agricultural
land (OAL) to 120-400 m2 with < 1,000 m2 OAL. The average household plot size was
about 240 m2 (with open space of at least 140 m2) and OAL of 500 m2. Around 5.7% of
the sample villages were, by national standards, considered to be at an advanced
6 Arifin et al., 2009. IPB.

105
development state, with 82.9% at medium state, and the rest least developed. On the
average, very small homestead plots contributed little to household diet in terms of
reduced food expenses (9.9%). Nutritional benefits are primarily in the form of vitamin A
and C - 2.4% and 23.6% of recommended dietary allowance (RDA), respectively and
only 1.9% of either carbohydrates or protein. These small plots contributed around 11%
to household income, about 80% derived from animal products i.e. chicken, eggs, fish
and meat. As expected, plot size and value of household assets appear closely correlated
and increase based on access to other agricultural land. About 55% of the households feel
that social status will decline as a result of loss of access to land and their ability to use
small scale homestead plots. The need for credit access is especially critical for the
smallest lot owners. Women play the most important role in plot maintenance and plant-,
animal- and fish production, while also managing family expenses for food, clothes, child
health care and education. It appears that their role is less significant in managing family
debt, the purchase of agricultural inputs or other family expenditures. Overall, homestead
gardens also perform an important social function. They help establish family and
territorial identity, and provide for neighborhood cohesion and beneficial communal
interaction. It is suggested that an agrarian reform program that includes the distribution
of land to land-less people and small-scale homestead farms is carried out in relation to
the prevailing agro-ecological conditions and associated land carrying capacity and
productivity ratings. Overall, such initiative should be within the framework of a
sustainable community development project and a well-defined regional economic
development strategy. A minimum household plot size should be defined to
accommodate an acceptable, future standard of living. This may be accomplished
uniquely at the individual household level or in combination with large scale communal
garden systems with shared titles, individual plots and with associated benefits of
economies of scale by reducing costs of capital-, material- and mechanized inputs, and
harvesting, processing and marketing.
Experience indicates that there is significant benefit in integrating diverse production
system, such as food and cash crops, animal and fish production, especially in a closed-
loop nutrient recycling system in combination with organic farming. Coupling

106
PEKARANGAN: Human, Organism, Vegetation, Animal
Pekarangan as: Self-propagating function Self-nourishing function Self governing function Self-fulfilling function
Domain of pekarangan
Typology of Sustainable pekarangan
Family Status
Wealth Assets
Income
Diet
PEKARANGAN: Human Activities, Spatial Management, Land Use
Access Land / Credit
Control Production & Marketing
Process Landscape: Watershed
Habitat: Elevation
Boundary of attributes
agricultural with non-farm activities, including value-added enterprises, would provide
for increased economic stability and potentially, higher household revenues. In this
approach, credit access and the role of adaptive species selection, cooperative input
acquisition, processing and marketing should be considered together with access to
effective rural extension services. Research findings also show that some pekarangan
owners have access to additional land cultivated to support household needs, and that this
may be an important factor in land use intensification and the provision of sustainable
income levels. The sustainability of pekarangan depends, in part on the land use interface
between biophysical (agro-ecological) regions and socio-economic-cultural domains.
Ideally, they represent an interconnected micro system that is self-propagating, self-
nourishing, self governing and self-fulfilling (Figure 2.15).
Figure 2.15 - Structural and functional elements of Pekarangan (Arifin et al, 2009)

107
Hence, micro landownership and land use structures (e.g. land cover/use mix, land access
and security, and transformation) define the basic structure, current and future
functionality of pekarangan, including their ability to supplement household needs.
Macro-agroecological (climate, soil, topography and watershed) parameters in
combination with socioeconomic attributes at the community and regional level, such as
employment opportunities, wage rates, credit access, input availability and cost,
production efficiency and marketing, are other important determinants.
Socio-economically, we may distinguish four basic functions of pekarangan.
First, subsistence production, such as a complement to staple crops, producing mainly
fruits, vegetables, spices, and many non-food products. Aside from crops, the system
includes animal production, with high nutritional value in terms of protein, minerals, and
vitamins, also contribute to food security in times or seasons of scarcity.
Second, “commercial” production for supplemental income, particularly in regions with
good market access and a well- functioning market. This includes perennial crops, such
as fruit trees, cacao, and coffee. It may also include vegetables, ornamental pants and
derived ornamental products, such as dried flower arrangements. Earlier research on Java
indicated that this portion of income from pekarangan varied from 1 – 7 % (Arifin,
Chozin, Sarma, and Sakamoto, 2006).
Third, the socio-culture functions. These include varies service functions such as
providing for the exchange of pekarangan products and planting material, its role as
status symbol and its aesthetic and other service functions, such as the children play yard,
a place for neighbors to socialize, its magical value and as a location for religious
ceremonies. For instance, Hindu Balinese families need their pekarangan as a place for
ceremonial sacrifices.

108
Forth, pekarangan fulfill ecological and environmental functions. Its multi-layered
vegetation structure resembles a natural forest and offers a habitat for a diverse
community of wild plants and animals.
The integrated production systems of plants, livestock and fishponds provides for an
efficient use of organic fertilizer and helps to recycle nutrients and reduces runoff and
water contamination. Sometimes this is done especially effectively, such as the
construction of poultry pens over a fish pond, providing for effective nutrient recycling
and reducing potential water contamination by nitrates and phosphates (Figure 2.16)
Figure 2.16 – Poultry pens situated over fish ponds – efficient nutrient recycling in small-
scale, subsistence, agro-forestry systems, (Schultink, 2006)

109
The relative contributions of these homestead agro-forestry system can be significant.
Even the smallest homestead plots show beneficial effects. In the table (2.8) below
Table 2.8 - Total and per square meter income originated from homestead plot (Arafin et al, 2009). G1-G4 represent different size categories by various agro-ecological zones.
Source of income in pekarangan G1 G2 G3 G4 G1&G3 G2&G4 All group
Income (Rp/year) from a pekarangan Crop 33,215 111,458 239,833 160,250 136,524 135,854 136,189 Animal 538,506 679,917 1,275,806 909,083 906,931 794,500 850,715 Sale or leasing goods 38,500 57,778 119,972 252,375 79,236 155,076 117,156 Crop and animal 571,271 791,375 1,515,639 1,069,333 1,043,455 930,354 986,905 Crop, animal and sale or leasing good 609,771 849,153 1,635,611 1,321,708 1,122,691 1,085,431 1,104,061
Income (Rp/year/m2) from a pekarangan Crop 1,294 1,709 10,198 1,523 5,746 1,616 3,681 Animal 17,034 26,500 15,246 6,951 16,140 16,726 16,433 Sale or leasing goods 2,406 3,484 631 2,177 1,519 2,830 2,175 Crop and animal 18,329 28,209 25,444 8,474 21,886 18,342 20,114 Crop, animal and sale or leasing good 20,735 31,693 26,075 10,651 23,405 21,172 22,288
One of the key issues in agrarian reform - and the (re)distribution of land or the
certification of (informal) ownership - is the latent use of “dead assets” tied up in
unregistered land titles. This prevents or limits the use of land or homesteads as collateral
in farm loans and in practice results in excessive interest charges. In Indonesia, it is not
uncommon for farmers to pay interest charges of 10% per month or 30-40% per year on
small farm loans that provide badly needed operating capital or are used for capital
improvements. As can be seen below (Table 2.9), informal credit access is the prevalent
condition for all homestead properties, across agro-ecological zones, resulting in
excessive interest charges and a major constraint in mobilizing latent productivity.
Strong consideration should be made to combine any pilot or future land distribution
scheme with the provision of micro-credit while using land or land use rights as a form of
collateral. To provide clear incentives for land-less people or small land holders to
become part of such scheme, very beneficial farm loan terms should be considered and
the process should be very clear, transparent and objectives. Actual distribution of loans

110
should take place by official or lending institution representatives outside the immediate
area to reduce potential conflict of interest and minimizes the chance for corruption.
Table 2.9 - Homestead farmers’ response to the availability of formal and informal credit
Sources of formal
and informal credit G1 (%)
G2 (%)
G3 (%)
G4 (%)
Average (%)
Formal credit: KUD 30.6 22.2 25.0 27.8 26.4 BRI 25.0 30.6 27.8 27.8 27.8 Village Bank 13.9 11.1 11.1 8.3 11.1 Others 2.8 2.8 5.6 5.6 4.2
Total 72.3 66.7 69.5 69.5 69.4 Informal credit: Informal lender 89.3 61.3 75.0 68.0 73.4 Other 10.7 38.7 25.0 32.0 26.6 Total 100.0 100.0 100.0 100.0 100

111
3. INDONESIAN LAND POLICY CONTEXT Indonesia’s land use context and issues are diverse and reflected in it its land policy
challenges and needs. The most intensive land use is found on Java and Bali. Of the more
than 231 million people (2009) living on about 190 million hectares, the highest
population densities and land intensities are found on Java (more than 134 people per
km2) and Bali, both with almost 89% of developed land. The least developed is Papua
with about 97% of undeveloped land. The major land use categories are summarized
below with land use identities by major regions (Fig. 3.1)
Figure 1 – Major Land Use Categories (BPN, 2009)
Figure 3.1 – Land Use Distribution and Regional Land Use Intensity (BPN, 2009)
FIGURES OF LAND-USE IN INDONESIA
OTHERS9.35%
PLANTATION10.06%
PADDY FIELD4.64%
DRY-LAND AGRICULTURE
9.49%
URBAN LAND1.96%
FOREST64.50%
0
102030405060708090
100
PERC
ENT
I
JAWA & BALI SUMATERA NUSATENGGARA &MALUKU
SULAWESI KALIMANTAN PAPUA
LAND-USE INTENSITY
FORESTDEVELOPED AREA

112
The percentage of forest land includes, according to various sources, recently deforested
areas, degraded forest and scrub forest. These sources suggest that about 55% is a more
realistic estimate.
Sawah land, the system providing the basic food source, is also declining. Below an
example (Fig. 3.2) of 2 provinces on Kalimantan, a decline primarily caused by
expanding mining operations.
Figure 3.2 – Declining Sawah Areas on Kalimantan
The research framework associated with an Agrarian Reform program addresses
prevalent land issues, policies, including land laws and the various aspects of land and
capital access and control, such as use rights, tenure regime, title security and its
implementation.
In Appendix E, the work schedule is provided. Research is being conducted at various
institutions in Jakarta (primarily BPN), the US and field locations focusing on relevant
cases and benefits of land distribution / agrarian reform initiatives. The primary field
focus is on recent land distribution initiatives by the current BPN administration,

113
potentially including Lampung province, Sumatra, East Java, Sulawesi, and Central
Kalimantan.
Indonesia’s land policy context includes a number of critical issues, such as a high
percentage (more than 85%) a small landholders, high poverty and unemployment rates,
widening income disparities, a low percentage of formalized land ownership (estimated at
around 42 % by BPN in 2009) -- indicating that the land is not mapped, certified, and
ownership is not verified and legal rights are not registered, a high percentage of idle or
underutilized land (estimated at more than 7.3 million hectares – although one source
provides an estimate of as much as 11 million hectares – with a total opportunity cost
estimated by BPN in excess of $600 billion/year7), forged land ownership certificates, a
high number of land disputes/conflicts (almost 7500 cases involving almost 608,000
hectares in 2007), a challenging legal framework, a lack of comprehensive spatial
planning and implementation, and a rapid land transformation, especially into plantations
for the production of export commodities.
From a land management perspective, of special concern is the informal economy
associated with the low percentage of certified property titles (out of about 85 million
parcels) and associated title and use rights insecurity (Tables 3.1 and 3.2).
Table 3.1 - Progress of Issuance of Certificates in Indonesia (BPN, 2002. Academic paper)
No. Fiscal Year Total number of Certificates Total
Sporadic Systematic
Adjudication Prona PP10/PP24 Transmigration
1 Up to 1989 7,576,058 2,094,259 1,288,854 10,959,171
2 1990/1991 398,921 58,409 160,538 617,868
3 1991/1992 566,461 84,938 30,727 154,628 836,754
4 1992/1993 604,297 101,067 63,515 105,875 874,754
5 1993/1994 672,209 83,783 26,439 122,953 905,384
6 1994/1995 819,559 1,022 88,831 60,532 49,207 1,019,151
7 1995/1996 875,062 4,236 95,833 58,821 109,995 1,143,947
7 Winoto, J. 2009. “Taking Land Policy and Administration in Indonesia to the next Stage and NLA’s Strategic Plan”. Presentation Washington. D.C. 2009

114
8 1996/1997 1,004,476 211,777 92,158 53,302 106,722 1,468,435
9 1997/1998 995,291 411,231 97,374 35,989 108,393 1,648,278
10 1998/1999 791,067 619,296 97,828 16,120 78,325 1,602,636
11 1999/2000 103,624 519,528 90,920 64,992 105,803 884,867
12 2000 136,180 98,352 12,630 0 87,152 334,314
TOTAL 14,543,205 1,965,442 2,998,030 410,437 2,478,445 22,295,559
This phenomenon results in high real estate transaction cost (both in terms of the number
of required transactions, lack of procedural transparency, time and real costs), loss of
potential tax revenues, and a poor investment climate – specifically low credit
mobilization using real estate collateral and high interest rates associated with land and
real estate investments, and the short-term financing of material inputs, especially in
small land holdings. In concert, this constitutes a major opportunity cost and dramatically
reduces potential economic growth and societal prosperity.
The unfortunate reality is that few smallholders can afford the time and the lump sum
payments necessary to obtain land titling and registration services. Current large-scale
titling and registration projects are unlikely to reach the majority of smallholders in the
30-50 years. Moreover, the majority of certification projects focus only on land titling
and registering, without providing the information or means to use certificates as
collateral for (formal) farm loans. This greatly limits their potential effectiveness in
agrarian reform programs.
As a result, the vast majority of Indonesia’s small farmers obtain necessary production
credit and inputs through informal arrangements at unfavorable terms. Credit and inputs
are obtained from local traders or neighbors, often in exchange for product sales
agreements. Informal arrangements carry much higher interest rates (e.g. 10% per month)
than commercial bank loans and limit the farmers’ options for inputs and choices of
suppliers and purchasers, limiting effective bargaining power. Informal lenders also do
not provide the range of financial services available from banks, nor have the interest in
providing loans for long-term, capital investments. These credit restrictions limit the
farmers’ ability to respond to technical advice to increase crop production and expand or
diversity operations. The inability to obtain formal credit greatly undermines the

115
production capacity of Indonesia’s farmers and the vitality and growth of the agricultural
sector.
BPN target and achieved realization in 2000 is listed below (Table 2) and varies notably
and understandably for various regions8.
Table 3.2 - Target and Realization of Land Certification in Major Regions (BPN, 2002). The 2009 target is estimated at 85 million parcels with about 1 million added per year.
No Region Estimated Total of Land Requiring Certification
Total of Land Already Having Certificates
%
1 SUMATRA 13,331,602 3,673,923 27.56
2 JAVA AND BALI 38,590,894 14,624,694 37.90
3 KALIMANTAN 2,004,817 1,588,577 79.20
4 SULAWESI 4,410,219 1,509,981 34.20
5 NUSATENGGARA 2,160,770 730,335 38.80
6 MALUKU 200,154 168,049 84.00
TOTAL 60,698,455 22,295,559 36.70
In 2007, agrarian reform was carried out in 30 provinces, involving 54,524 parcels.
Principles areas include9:
1. East Java:
a. Blitar Regency: 1,919.46 hectares, 12,001 beneficiaries
2. West Java:
a. Bogor Regency: 1,168.43 hectares, 7,000 beneficiaries
b. Ciamis Regency: 62,93 hectares, 556 beneficiaries
8 Table 2 shows that the estimated total number of land parcels (2002) to be certified, as about 61 million, with about a 37 % success rate. The greatest percentage of land parcels already certified is found in Maluku (84%) and Kalimantan (79.2%). The difference in regional success rate reflects the smaller number of parcels in need of certification and is more or less directly proportional to population density and level of development.
9 Data for 2007-08 provided by BPN.
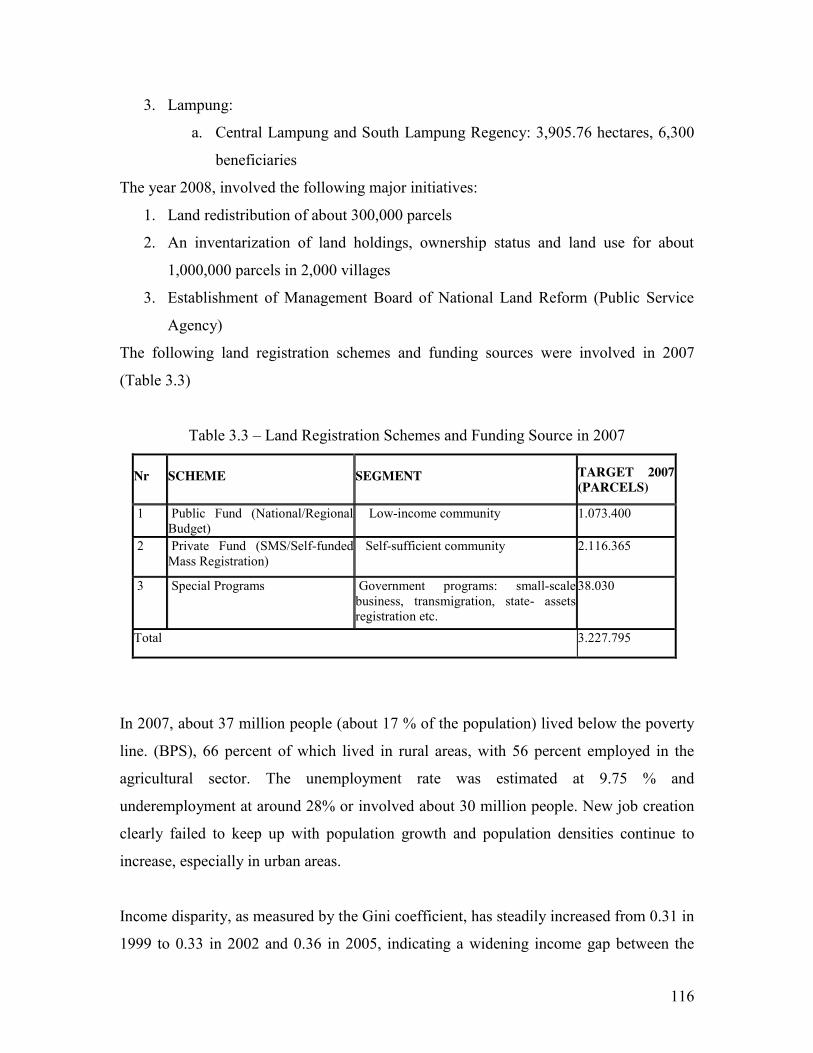
116
3. Lampung:
a. Central Lampung and South Lampung Regency: 3,905.76 hectares, 6,300
beneficiaries
The year 2008, involved the following major initiatives:
1. Land redistribution of about 300,000 parcels
2. An inventarization of land holdings, ownership status and land use for about
1,000,000 parcels in 2,000 villages
3. Establishment of Management Board of National Land Reform (Public Service
Agency)
The following land registration schemes and funding sources were involved in 2007
(Table 3.3)
Table 3.3 – Land Registration Schemes and Funding Source in 2007
Nr SCHEME SEGMENT TARGET 2007 (PARCELS)
1 Public Fund (National/Regional Budget)
Low-income community 1.073.400
2 Private Fund (SMS/Self-funded Mass Registration)
Self-sufficient community 2.116.365
3 Special Programs Government programs: small-scale business, transmigration, state- assets registration etc.
38.030
Total 3.227.795
In 2007, about 37 million people (about 17 % of the population) lived below the poverty
line. (BPS), 66 percent of which lived in rural areas, with 56 percent employed in the
agricultural sector. The unemployment rate was estimated at 9.75 % and
underemployment at around 28% or involved about 30 million people. New job creation
clearly failed to keep up with population growth and population densities continue to
increase, especially in urban areas.
Income disparity, as measured by the Gini coefficient, has steadily increased from 0.31 in
1999 to 0.33 in 2002 and 0.36 in 2005, indicating a widening income gap between the

117
poor and the non-poor. In terms of agricultural land ownership distribution, the disparity
is much worse on Java with around 0.6. (Internal Communication BPN, 2009). Unequal
wealth distribution is further exacerbated by the continued fragmentation of household
agricultural land and issuance of land use rights to large companies already owning ten or
even hundred thousand hectares of land. Farm households with less than 0.5 ha of land
are approximately 56.5 percent of the total, or around 25 million households.
Access to available land has been reduced by land speculation that manifests itself by
absentee land ownership, under-utilization and non-productive land use. Abandoned land
is estimated at 7.3 million hectares (some BPN sources indicate it may be as high as 11
million hectares), resulting in very significant opportunity costs, posing an unacceptable
burden on the poor with no access to or adequate land to cultivate.
Another problem is the growing number of land disputes and conflicts. In 2007, the
number of significant land disputes and conflicts reached 7491 cases covering almost 608
thousand hectares of land.
High poverty and unemployment rates are persistent and growing. While the Indonesian
economy has shown strong and consistent growth and expanded by 4-5 % in the last few
years, and is recognized as the fastest expanding economy in the last 3 month in South-
East Asia (Bloomberg, 2009), this growth failed to trickle down to the poor and
unemployed, especially in rural areas. Here, the fundamental problems include lacking
infrastructure and access to land by small farmers and the landless, lack of sufficient land
for effective material and capital inputs, including access to extension and other public
services. The land access issue is further complicated by uncertainty of landownership.
Lack of title security or (long-term) certified use rights prevents use of the land as
collateral for loans, resulting in no- or limited access to badly needed (micro)capital. To
survive, many small land owners or tenants are required to pay exorbitant interest rates –
as high as in the 30-40% range per year or 5-10%, on a monthly basis, further reducing
family income potential and the opportunity for the rural poor to generate a reasonable
quality of life.

118
All these issues combined require a long-term, well-defined, well-resourced and well-
executed Agrarian Reform Strategy. This will require that the National Land Agency of
the Republic of Indonesia (NLA-RI) provides effective leadership in the implementation
of this strategy, in coordination with other relevant public agencies, such as the National
Development Planning Agency (BAPPENAS). Execution should be based on up-to-date
information, combined with the effective institutional capacity to deliver relevant land
tenure and administration services, such as efficient ownership title transfers and
registration, certification of well-defined land rights, improved access to land, increased
land productivity, and assistance in rural economic development programs supplemented
by rural extension services.
3.1 Land Policy and BPN’s Mandate BPN with its head office in Jakarta and has about 25,000 employees distributed over 33
Provincial Offices and 420 Municipality/Regency Land Offices. There are five deputies
with almost 1000 employees in the head office and their primary functions include (see
also figure 3.3, below):
1. Formulation of national and technical land policy;
2. Coordination of land planning, policy and programs;
3. Organization of the land administration services;
4. Conduct land surveys, mapping and land registration;
5. Issuing land tenure titles and certification;
6. Conduct land use and spatial planning, agrarian reform and special region arrangements;
7. Administration of state/council-owned real estate in cooperation with the Ministry of Finance;

119
Head of BPN
First Inspectorate First Secretariat
Deputy of Surveying and
Mapping
Deputy of Land Title
and Registration
Deputy of Land Policy and Land
Use
Deputy of Land Control and Community
Empowerment
Deputy of Land Dispute and
Conflict Resolution
Center for Land Data and
Information
Center for Legal and Public Relation
Center for Research and Development
Center for Education and Training
National Land College
Figure 3.3 – Basic Structure of BPN
8. Land ownership administration
9. Interagency cooperation;
10. Land use and spatial planning, policy and program development;
11. Community empowerment in land policy matters;
12. Researching and settling land conflicts and disputes;
13. Research and develop of land laws;
14. Human resources development in land administration 15. Manage land data and information;
16. Institutional capacity development;
17. Termination of land ownership as mandated by law;
18. Other functions as mandated by public policy.
According to the BPN Regulation No 3 Yr. 2006, BPN is entitled to provide services in
various land transactions and land valuation. This includes:
1. Contribute to a more transparent land market (individuals, investors, developers)
as a reference for the citizens in land transactions;
2. Control stated prices (PPAT, Notaries) in comparison to market value;
3. Land expropriation (local government, property owners);
4. Land taxation and provision of incentives or disincentives;
5. Resolve land conflicts (BPN, property owners);
120
6. Land use planning (local government);
7. Facilitate valuation for mortgages (banks, property owners);
8. Management of information on land values to monitor the land market;
9. Provide a reference for government tariffs and non-tax fees on lands;
10. Management of state-owned property;
11. Assess opportunity loss (loss of land economic values) caused by abandoned
lands, dispute and conflict lands, and misused lands;
12. Management of land economic values and other land potencies;
13. Provide a reference for spatial decision making, i.e.:
a. city planning
b. any development program that changes the use or the function of an area
c. urban resettlement and land consolidation
d. formulation of spatial economic policy of an area
e. determination of economic potential
f. analysis on economic, ecosystem or environmental impacts;
14. Other uses that need data and information on land and area values and potential
i.e. cost and benefit analysis for Agrarian Reform, development of land or area-
based programs, development of land assets as production factors, etc.
With respect to Presidential Regulation No. 10/2006 concerning the National Land
Agency, it stipulates that BPN shall implement “agrarian affairs reformation” and execute
and implement “policy, planning and a program in the land sector”. In November, 2006,
the President announced the intention to allocate 8.15 million hectares of land to the poor.
Subsequently, this amount was expanded to 9.25 million hectares in May, 2007. It is not
clear to which extent this Decree constitutes a potential controversy with respect to the
mandate provided to Kabupatens (regions or regencies) (Law No. 32/2004 and
Presidential Decree No. 34/2003) granting authority over “land matters” and the
identification of the regional authority in land administration as “designation of land
redistribution subject and object, and compensation of maximum for maximum excess
and absentee lands. As of May 2009, no large scale land distribution had taken place,
although some smaller successful schemes were implemented over the last few years.
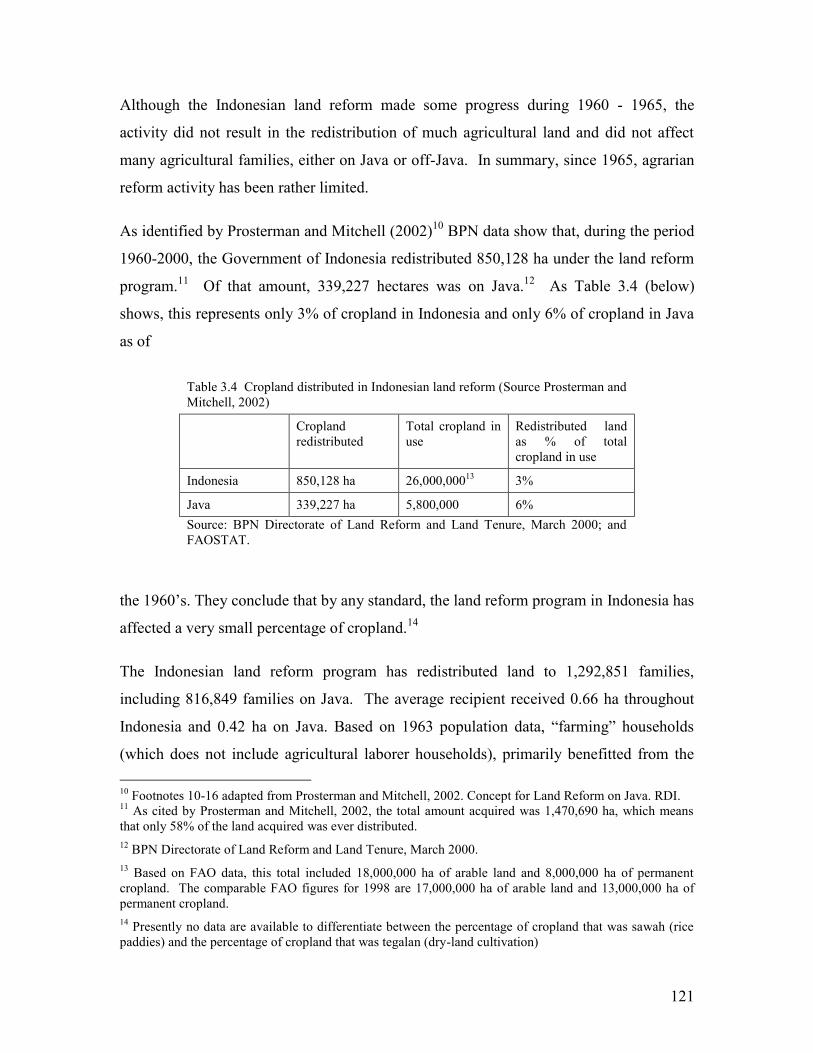
121
Although the Indonesian land reform made some progress during 1960 - 1965, the
activity did not result in the redistribution of much agricultural land and did not affect
many agricultural families, either on Java or off-Java. In summary, since 1965, agrarian
reform activity has been rather limited.
As identified by Prosterman and Mitchell (2002)10 BPN data show that, during the period
1960-2000, the Government of Indonesia redistributed 850,128 ha under the land reform
program.11 Of that amount, 339,227 hectares was on Java.12 As Table 3.4 (below)
shows, this represents only 3% of cropland in Indonesia and only 6% of cropland in Java
as of
Table 3.4 Cropland distributed in Indonesian land reform (Source Prosterman and Mitchell, 2002)
Cropland redistributed
Total cropland in use
Redistributed land as % of total cropland in use
Indonesia 850,128 ha 26,000,00013 3%
Java 339,227 ha 5,800,000 6% Source: BPN Directorate of Land Reform and Land Tenure, March 2000; and FAOSTAT.
the 1960’s. They conclude that by any standard, the land reform program in Indonesia has
affected a very small percentage of cropland.14
The Indonesian land reform program has redistributed land to 1,292,851 families,
including 816,849 families on Java. The average recipient received 0.66 ha throughout
Indonesia and 0.42 ha on Java. Based on 1963 population data, “farming” households
(which does not include agricultural laborer households), primarily benefitted from the 10 Footnotes 10-16 adapted from Prosterman and Mitchell, 2002. Concept for Land Reform on Java. RDI. 11 As cited by Prosterman and Mitchell, 2002, the total amount acquired was 1,470,690 ha, which means that only 58% of the land acquired was ever distributed. 12 BPN Directorate of Land Reform and Land Tenure, March 2000. 13 Based on FAO data, this total included 18,000,000 ha of arable land and 8,000,000 ha of permanent cropland. The comparable FAO figures for 1998 are 17,000,000 ha of arable land and 13,000,000 ha of permanent cropland. 14 Presently no data are available to differentiate between the percentage of cropland that was sawah (rice paddies) and the percentage of cropland that was tegalan (dry-land cultivation)

122
land reform program. It affected approximately 11% of farming families in Indonesia and
approximately 10% of farming families on Java15 (Table 3.5).
Table 3.5. Families receiving Land in Indonesian Land Reform (from Prosterman and Mitchell)
Families receiving land
Total farming families in 1963 (excluding laborer families)
Families receiving land as % of farming families
Estimated total agricultural families (including laborer families)
Families receiving land as % of estimated total agricultural families
Indonesia 1,292,851 12,236,000 11% 17,864,000 7%
Java 816,849 7,935,000 10% 13,013,000 6% Source: Based on BPN Directorate of Land Reform and Land Tenure, March 2000.
Assuming the same ratio of 46 laborer households to 100 farming households in
Indonesia in the 1960s (46:100 on Java), the percentage of “agricultural households”
(farmer plus agricultural laborer households) that received land in Indonesia was 7% and
on Java 6%, respectively. These percentages represent a very small proportion of the
rural families that were landless or land-poor in the 1960’s.
The results of the land reform substantially, did not reach the most vulnerable group,
namely seasonal agricultural laborer families. Such families were the lowest priority of
the eight priority categories of recipients described in Article 8 of Government
Regulation No. 224 of 1961 “On Implementation of Redistribution of Land and
Compensation.” Therefore, it is reasonable to assume that they constitute only a very
small percentage of the agricultural laborers household’s estimate to have received land
in the Indonesian land reform program.16
BPN’s clients and partners are found in central and local government; in the private
sector (notaries, land valuation specialists, real estate brokers, banks, farmer’s 15 Almost all land reform in Indonesia occurred prior to 1965. According to data of the National Statistics Bureau [BPS], in 1963 there were roughly 12,236,000 farming households in Indonesia (excluding East Timor, Maluku and Irian Jaya), of which approximately 7,935,000 farming households were on Java (“farming” households are those that control some cropland). BPS 1993 Agricultural Statistics (as of March 18, 2002 as quoted by Prosterman and Mitchell). 16 Estimate reflects 2002 ratios of agricultural laborer households to farming households, both for Indonesia and for Java alone. The estimate includes about 5 million of these households on Java.

123
organizations and other commercial interests) and amongst the general public, including
NGOs. Major partners at the central level are Ministry of Finance, BAPPENAS (National
Development Planning Agency), State Ministry for Environmental Affair, Taxation
Office, Ministry of Public Works , etc. Local branch offices of BPN cooperate with
Local Government Agencies such as the Regional Planning and Development Agency,
and Public Works Office.
Land tenures and titles are managed by the National Land Agency (BPN), which reports
directly to the President. BPN manages all grants, extensions, renewals of titles as well as
the land registration system, and accepts the resource use titles controlled by other
Ministries. BPN has land offices in all provinces and districts with approximately 25,000
relatively lowly compensated civil servant employees. Many land offices are well
equipped; others need new buildings and facilities. It administrative revisions of staff and
functions to local government reflect the Autonomy Law 22/1999.
About 80 million parcels are on the fiscal (tax) cadastre, whereas only 20 million are on
the legal cadastre (public land register). In terms of land mass, about 1%-3% of the land
is privately owned (hak milik).
3.2 Recent BPN Institutional Policy Initiatives In 2006, the policy focus of BPN reflected the issuance of Presidential Regulation No.
10/2006, with a mandate for land policy formulation at the national, regional and sectoral
levels. Furthermore, Law No.17/2007 on Long Term Development Planning Mandates
that the BPN implements efficient and effective land management; enforces land rights
using democratic, transparant and justice principles; reforms land reform regulations to
improve the occupation, rights, and land use; develops taxation (dis)insentives according
to size of area, location, and landuse; improves land access and land rights for the poor;
improves land law through inventarisation and enhanchement of land regulations with
adat (customary) law taken into consideration; improve land conflict resolution through
administration, justice, alternative dispute resolution; and human resource development.
Current land policy is reformulated by BPN on the basis of four main principles:

124
1. Improvement of welfare; 2. Distributive Justice; 3. Fostering a just and peaceful sustainable society; and 4. Creation of social harmony (resolved land conflicts and disputes). With these principles, 11 policy objectives were formulated. They include:
a. Public Trust building; b. Improvement of land services and land registration; c. Improvement of people land rights; d. Resolution of land problems in areas affected by natural disasters and ethnic
conflicts; e. Systematic handling and settlement of land lawsuits, disputes and conflicts; f. Development of National Land Management Information System and land
document security system; g. Addressing corruption, collusion, nepotism and improvement of people
participation and empowerment; h. Establishment of large scale land use and ownership mapping; i. Consistent implementation of all land laws and regulations; j. Strengthening the BPN; k. Development and reform land laws and policies (agrarian reform).
The cooperation between BPN and World Bank should therefore emphasize these policy objectives, with particular emphasis on: a. Development and reform of land politics, laws and policies (agrarian reform) b. Improvement of land rights; c. Improvement of land services and land registration; d. Systematic processing and settling of land law suits, disputes and conflicts; e. Development of a National Land Information System capacity including a land
mapping, spatial analysis, land information and management infrastructure, together with a secure land cadastral documentation and certification system;
f. Establishment of a large-scale land tenure and land ownership database; g. Consistent, transparent and objective implementation of all land laws and
regulations; h. Strengthening the organizational capacity of the National Land Agency.
This reprt seeks to address some of the critical problem facing Indonesia’s Agrarian Reform and focus the land policy mandate of BPN in cooperation with the World Bank.

125
4. FRAMING THE LAND POLICY AND AGRARIAN REFORM DEBATE
Land policy initiatives should be framed within the broader rubric of economic
development planning and address the primary goal of improving societal prosperity,
while using natural resource sustainably -- guarantee the long-term flow of benefits for
future generations while maintaining or restoring the productive capacity of our natural
resources, considering economic viability, environmental impacts and public risks. The
primary goal of land policy formulation is the mobilization of land assets (natural
resources) through the efficient use of human and capital inputs to create a sustainable
and reliably prosperous society. This context may be framed as illustrated below (figure
4.1).
Figure 4.1 – Land Policy Analysis and Formulation through Land Laws, Regulations, Planning and Economic Incentives
SUSTAINBLE ECONOMIC DEVELOPMENT (mobilization of natural, human and capital assets)
Land Information and Cadastral Systems (Spatial Analytical and Infrastructural Capacity
Resource Inventories and Land Evaluation (Land Suitability and Environmental Risk Assessment)
Land Use Planning (National, Sectoral,
Regional and Local Plans)
Land Tenure and Administration
Institutions
126
Economic development and land tenure – property rights in land or real estate, defined
legally or customary – are two interrelated concepts in land policy. Access to land
resources, and secure property and use rights, is a precondition if not the foundation for
successful economic development and the creation of prosperous societies. The United
Nations, in its formulation of the Millennium Development Goals (Mugs), stresses the
importance of land use issues in addressing development challenges and achieving
sustainable development goals, emphasizing poverty alleviation, environmental
protection, and social justice. The core challenge in land policy is to provide access to
land and formalize an certify land ownership to develop more equitable land distribution,
provide collateral to leverage capital investments and mobilize latent productivity for
food and cash crops, and other sustainable land uses.
The formalization of property ownership or use rights through the provision of land
certificates or titles has three primary effects17. They include:
The security effect - removing disincentives for investment in land and capital
equipment such as machinery
The collateral effect – increased security provides for the use of real estate as
collateral for short- and long-term credit as working capital or long-term
investment, significantly lowering the interest rates and increasing potential net
return per hectare
The transaction cost effect – the formalization of property rights helps to improve
a functioning land market and reduces the transformation costs of real estate,
thereby promoting the most productive and economically viable use
In addition to these direct effects associated with land parcels, the indirect effects include
the formalization of credit and land transactions and increase productivity that helps to
generate potential tax revenues not realized in the underground economy.
17 Feder and Feeny, 1991. Land Tenure and Property Rights: Theory and Implications for Development Policy. World Bank Research Observer. Vol. 5 No.1. pp 135-153

127
The formulation of land use rights is based on legal principles that seek to provide
incentives and controls for land investments through laws and land use regulations, and
informal principles of economics, land conservation or sustainable use. As such, it is a
government’s responsibility to articulate property rights -- determine the scope of these
rights and associated obligations, and provide the regulatory framework to promote its
successful implementation. Private property rights, although the fundamental element of
prosperous societies, should be viewed in the broader context of public policies that
stimulate economic growth and provide societal benefits. As such, private property rights
must also be viewed as exclusive and not absolute rights, given the complexity of public
and other private interests, such as environmental impacts and long-term, sustainable use.
In Indonesia, as in other developing countries, special land policy challenges are evident.
They include:
Real Estate Title Certification, Leveraging Investment, Equitable Taxation and Revenue Generation
As in many developing countries, a large amount of “dead capital” exists -- assets in
real estate (urban and rural land and buildings) that can not be used to the fullest
extent because clear ownership title is not certified. In Indonesia, it is estimated that
about 85 million land parcels exits (with an additional creation of about 1 million per
year) and with less than 40% with certified ownership or use rights. This effectively
prevents using certified ownership as loan collateral and makes long-term capital
investments difficult due to the uncertainty about the time period to recover
investment or profits. These conditions also make it difficult to trace and validate
these assets, pose equitable taxation challenges, use multiple transactions to obtain
surplus value, and pose high transactional cost due to misunderstandings, faulty
recollections and conflicting interpretations of agreements. As pointed out by
Hernando de Soto18 these “dead assets” reflect high proportions of real estate assets in
developing countries, almost 60% of city dwellers and 67% of rural residents in the
Philippines, 53 – 81%, respectively in Peru, 68-97% in Haiti and 68-97 % in Egypt.
18 Hernando de Soto. 2000. The Mystery of Capital.
128
Lack of legal property descriptions poses not only limitations on the provision of
credit, but also on easements, accountability, tax revenue, enforcement, service
delivery, infrastructural improvement and urban revitalization. Legal property
descriptions and certification provides the tool to create surplus value over and above
its physical assets by providing economic development opportunity and prosperity.
Some surveys indicate that without such legal protection, the cost of working and
conducting a business is expensive. De Soto’s work in Peru (2000) cites an extra cost
of 10-15% of annual income to be paid in the form of bribes and commissions to
authorities. The lack of collateral to obtain loans for small farmers in Indonesia forces
them to pay excessive interest rates (30-40% annual rates or 10% monthly rates are
not uncommon)19. Without formal ownership and transaction records, equitable
taxation is difficult and total tax revenues are reduced.
Ownership and Use Rights Clarity, Security, and resulting Land Conflicts
Indonesian land use conditions, in urban and rural areas alike, are characterized by
weak or not existing guarantees that clearly define ownership, tenure regimes or use
rights. This in turn, increases the perceived and real conflicts and disputes associates
with these rights. Sources of conflicts include disputes between the state, investors
and local people. Of specific concern are: a) disputes between plantation interest
based on Right of Exploitation (HGU) – still valid or expired - and occupation of the
land by local people; b) between Adat Communities with Ulayat rights and Forest
Concession Rights (HPH) given to those areas, c) mining interests and (de)forested
areas, d) overlapping border of land rights – such as ownership (“eigendom”) rights
and ex Adat land rights (girik); e) disputes on compensation for land transactions; f)
dispute on the status of land between village authorities and other government unit as
result of implementation of Law No. 5 / 1979; g) private land designations by
19 Personal Communication with BPN and BAPPENAS staff and consultants. May 2009.
129
Colonial Land Law and now controlled by government institutions; and h) disputes
associated with the courts judgment that is difficult or impossible to enforce.20
Conflicting Legal and Regulatory Framework and its Implementation The overlapping and sometimes conflicting role of administrative jurisdictions
associated with the development, articulation and implementation of land use rights,
land use plans, and associated laws and regulations. This includes the associate
mandates - real or perceived - by relevant government institutions, such as BPN,
BAPPENAS, and the Ministries of Agriculture, Forestry, Mining and the
Environment. Therefore a top priority should be to commission a thorough and
systemic legal review to compile all pertinent land use laws and regulations (with
clear definition and consistent use of terms, such as land, agrarian and natural
resources) and consolidate these in a legal framework of internally consistent and
mutual reinforcing laws and regulations pertinent at the national, regional and local
levels, and across the various economic sectors, including agriculture, forestry and
mining. Such review should also include the circumstances under which the state can
exercise eminent domain and either takes property for the public good with just
compensation or uses “right-of-way” to install utilities, such as water -, electric -,
fiber optic - or sewer lines. This should be reinforced by clear institutional mandates
on its implementation and legal enforcement. Such clarity, transparency and objective
implementation will assist in reducing land conflicts and promote the more rapids
resolution of conflicting claims.
Social Justice and Inequity in Land Access and Benefit Distribution The inability of poor people to benefit from access to land, its productive use and
benefits creates a perpetual system of social injustice. A democratic and economically
efficient society should encourage productive ownership and investments. This
includes minimizing absentee landownership and speculative non- or underutilization,
20 BAPPENAS. 2008. The National Land Policy Framework.

130
the equitable distribution of land access, use rights, and promotion of productive use
and the realization of associated employment and income opportunities. In Indonesia,
there is clear evidence of an increasing gap in ownership distribution – concentration
of land ownership and use rights in the hands of a smaller percentage of the
population - and income disparity that is inherently associated with historically-
defined land access limitations that are socially unacceptable. One example includes
Java with a high percentage of land-less people and extreme small landholdings.
Here, almost 7 million families do not control land through ownership of lease. More
than 7 million families control less than 0.5 hectares (BPS, 1993). In combination,
this was about 83% of the 17.3 million households on Java, a figure that has likely
significantly increased in 2009. BAPPENAS (2008) cites the 1993 census data,
indicating that 69% of the agricultural land tenure in rural areas is controlled by 16%
of the rural households, while 31% of agricultural land is controlled by small farmers
or the landless (via use rights/hak garap). The landless that cultivate land as tenant are
sometimes required to pay up to 50% of crop yield as “rent for the use of the land,
reducing household income by the same amount. A fundamental policy challenge will
be to decide if a further marginalization of the poor or underprivileged, as a result of
these conditions, is acceptable.21
Smallholder Land Certification and Access to Credit
It is well understood that lack of property certificates affects credit access, especially
access to formal credit from lending institutions. This is as critic production
constraint because farmers need capital at the beginning of the growing season, and
most farmers rely on informal systems of credit for capital and inputs, which carry
high interest rates and sometimes involve selling crops in advance and pledging land
under unfavorable if not exploitative terms22. Farmers with certificates understand
that the land provides with the means to lower the interest rates paid for capital needs
and inputs. Farmers with little or no socialization on access to finance believe bank
procedures are overly complicated and they do not have a good understanding of how 21 BAPPANAS. 2008. The National Land Policy Framework 22 Nielsen R and A. Safik. Smallholder Land Certification and Access to Credit in Indonesia. RDI, 2007

131
land certificates can be used as collateral. Farmers do not wish to put up their land as
collateral, but farmers who are better informed about access to finance and
government assistance to farmer groups believe that as a group to avoid loan
defaults23. Certification programs are of interest to farmers if at low cost in within a
certain time period (e.g. 5 years) especially if combined with improved access to
credit.
Concerns about Privatization
Privatization has often resulted in the poorest being excluded from primary rights
such as land access and use rights, and secondary rights such as access to water,
forest products or communal grazing rights. Privatization and land titling, unless very
carefully handled in deliberately transparent and objectives ways without significant
financial thresholds (title, registration costs and other administrative burden) has
often benefited the local elites. Land registration and titling programs must be well-
resourced and administered to provide easy access, accuracy, equity and reduce land
disputes. Potential benefits of land titling can be offset by market failure for inputs
and labor. Land titling, especially in rural areas, should ensure continued access to
formal credit at competitive rates (potential government intervention to assure capital
access). Over time, in areas with customary laws and communal rights and where
land becomes increasingly scarce, tenure regimes have historically “modernized” and
evolved into private property regimes.
23 Ibid, 2007

132
5. AGRARIAN REFORM IN INDONESIA As a nation of about 235 million people - culturally and geographically highly diverse, it
also depicts a great variety in land use patterns, population densities and land ownership.
In addition, various tenure regimes and legal systems dominate different parts of the
country.
The principles of diversity are embraced in its Constitution of 1945 and emphasize the
management and use of its natural resources for the common good. Law No.5/1960 on
Basic Agrarian Law stipulates the rights of the people over its land, water, territory and
all natural resources contained therein. It is the State’s duty to realize public welfare for
all people and protect their land rights. The realization of this charge is a great challenge
in a rapidly developing nation with great land use diversity and intensity reflected in
various land use pressures, formal and customary legal systems, conflicting sectoral
interests, and environmental impacts. These conditions also translate into concerns about
environmental quality, public risk associated with environmental pollution, sustainable
land use, and the long-term productive capacity of the natural resource base.
In recognition of this challenge, the GOI ratified MPR Stipulation (Tap MPR) No.
IX/2001 on Agrarian Reform and Natural Resources Management, articulating guiding
principles for agrarian reform and sustainable resource utilization. It calls for land reform
that is fair by giving attention to land ownership for the people and the collection of
systematic data on land through inventory taking and registration of control, ownership
and exploitation of land. The National Land Policy Framework 4-point action plans to
implement MPR Stipulation No. IX/2001 to increase access to land:
Empower poor people to use and own neglected land
Provide opportunities for people to use and own land through redistribution, land
consolidation, etc
Increase control of neglected and not optimally used land
Create information access to government land program
133
The promulgation of Law No. 22/1999 (as revise Law No.32/2004) directs that land
policies support the realistic and responsible autonomy of regional governments. It
outlines, in essence, the same 4 basic principles as identified by BPN (above):
1. Manage land to create of social welfare; 2. Promote social equity in land access, use, tenure and ownership 3. Promote of sustainability 4. Foster social harmony
5.1 Land Use and Ownership
Roughly 20 million hectares, or nearly 10 percent of Indonesia's total land area, were
cultivated in the 1980s, with an additional 40 million hectares of potentially cultivatable
land, primarily in Sumatra and Kalimantan. This percentage increased to about 11%, with
about 7 % in permanent cultivation in 200524. The GOI claims that Indonesia has about
120 million acres of rainforest (or about 60 percent of its land area)25, making it the
world’s third largest forested country after Brazil and the D.R. Congo. Other sources,
based on multiples studies, suggest that natural forest coverage may be around 50%
(1997).26
In spite of the dwindling forest coverage the Forestry Ministry still exercises control over
about 70 percent of the land.27 Evidence suggests continued and rapid deforestation. Most
of the changes are caused by logging (especially since the 70s), transmigration
(especially in the 80s), spontaneous settlements, and the rapid expansion of estate crops.
With an estimated loss of up to 20 million ha of forest over the past decade (or about 10%
of the total land area or about 20% of the remaining forest), deforestation in Indonesia
has come to the forefront of global environmental concerns. From a land policy
perspective, Indonesia is not only one of the most important areas of tropical forests
worldwide, but forests provide a multitude of benefits to traditional villages, including
the provision of many products and services, including as food and energy sources.
Logging benefits are only a limited public benefit. Forests are also critically important in
24 CIA World Factbook (2005) 25 Jakarta Post ( May 23, 2009), quoting GOI sources 26 Pagiola. S. 2000. Land Use Change in Indonesia. Environmental Department, World Bank 27 Personal Discussion with BPN and BAPPENAS officials (May 2009).

134
watershed protection, reducing flood risk by regulating run-off and reducing
sedimentation, thereby improving water quality and fisheries habitat. These forests are
also of global importance because of their biodiversity – with it largely untapped
potential for ecotourism - and their carbon sequestration. Despite the benefits they
provide, Indonesia’s forests have been under considerable threat in past decades, and the
extent of forest cover has continued to decline considerably28. One of the most significant
impacts on forest land has been conversion to large scale palm oil plantations,
increasingly a source of public debate.
The 1999 forestry law stipulates that all forested land is controlled by the state. No
private or community land ownership or land rights are granted in forest areas, only
forest concessions. It is estimated that forty to sixty million people live in “forest areas.
The law allows local communities and indigenous people to “manage the forest and
gather forest products”, but the state retains full “ownership”. Government control of
most “forest land” (estimated or about 70% of the land, which including degraded scrub
and brush land that by current estimates is about 20% of the land) is exercised by the
Ministry of Forestry, mostly irrespective of its current vegetation status. Therefore, 70%
percent of Indonesian land is held under jurisdiction of the Ministry of Forestry and
Estate Crops under the Forestry Law No. 41/1999. Resource tenures are managed by
sectoral ministries rather than the BPN. . BPN only becomes involved in forest land areas
when forest land is converted to “land tenure”.
Smallholder cultivation of both food and estate crops dominates the remaining, non-
urban, landscape, accounting for about 87 percent of total land under cultivation; large
plantations account for the remaining 13 percent. The pattern of land use and landholding
reflects the distinctive ecosystems of Java and the Outer Islands, and the profound impact
of colonial cultivations. Java and Bali were the centers of intensive rice cultivation on
sawah or flooded cropland. This cultivation demanded rich volcanic soils and a fairly low
gradient to permit water control, and supported a dense sedentary population.
Increasingly, more farming activities are concentrated on smaller parcels (Table 5.1).
28 Pagiola. S. 2000. Land Use Change in Indonesia. Environmental Department, World Bank.

135
Table 5.1. Distribution of farming Activities in Indonesia (1983-1993)
No. Category of Farming Activities by extent of land holdings
Distribution of Farm Activities
1983 1993
% of farming activity
Average extent (Ha)
% of farming activity
Average extent (Ha)
1 < 0.5 40.8 0.26 48.5 0.17
2 0.5 – 1.99 44.9 0.94 39.6 0.90
3 2.0 – 4.99 11.9 2.72 10.6 3.23
4 > 5 2.4 8.11 1.3 11.9
Total of farming Activities (million) 15.9 17.9
Total of area (million Ha) 16.7 15.4
Average Extent of farming activity (ha) 1.05 0.74
Source: Agricultural Census of Indonesia, 1993
The distribution of agricultural land holdings in 1993 is very inequitable. Around 70% of
the rural households have land holdings of less than 0.5 Ha, wherein most (43% of the
rural households) belong to the homeless and farmers with land holdings of less than 0.1
Ha. (Table 5.2). Here, 43% of rural households of the "land poor" (homeless and farmers
with land holdings of less than 0.1 Ha) only hold 13% of agricultural land, while 16% of
the rural households "land rich" (farmers with land holdings of greater than 1 Ha) hold
almost 70% of the total of agricultural land. Within the same period (1973-1993) the
inequity has also increased in agricultural land ownership/holdings among the regions.
The 1993 Agricultural Census shows that land ownership/holdings per farm family in
Java is around 0.41 Ha and outside Java is 1.2 Ha. This trend in increasing land inequity
continues due to an increased concentration of population in Java. Such trend may be
deemed soci0economically unacceptable but also has the potential to create political
unrest and security problems.

136
Table 5.2. Distribution of Agricultural Land Holdings in Indonesia (1993)
No. Groups of Extent of Holdings (Ha) Rural Households
% Cumulative % % of land holdings
1 Homeless and farmers with less than 0.1 43 43 13
2 0.1 – 0.49 27 70 18
3 0.5 – 0.99 14 84
4 > 1.0 16 100 69 Source: Agricultural Census of Indonesia, 1993
The Outer Islands ecosystem consists of swidden cultivation, a type of dryland
agriculture known also as slash-and-burn agriculture, practiced on the less fertile forested
land with a diverse range of crops such as cassava, corn, yams, dry rice, other vegetables,
and fruits. In this process forest plots are cleared, harvested for a few seasons until
natural nutrients are exhausted, and then return to the slow process of forest regeneration.
The far lower productivity of this system than sawah can only support low population
densities. Over time, swidden farmers have in some areas adapted to commercial tree
crops such as rubber, coffee and especially palm oil. The recent expansion of palm oil
plantations in this century has raised increasing concern about the rapid forest conversion
and its associated impacts on traditional, low risk (agro-forestry) cropping systems in
many villagers, now depending on mono-cultivations with a higher risk of crop failure.
The impact of colonial agricultural practices in the late nineteenth century has been
characterized as agricultural "involution"--a reduction to former size--centered in areas of
sugar cultivation, primarily in Central and East Java. Here, the dense population supplied
seasonal labor for sugar production and was still able to grow sufficient rice. The village
economy provided an equitable if marginal subsistence for all villagers through such
labor-intensive techniques as double cropping, improved terracing, careful weeding, and
harvesting. At the end of the 20th century, this rice-based economy was able to absorb the
rapidly growing population in part, assisted by the Green Revolution with superior
varieties, improved inputs and pest control. On the Outer Islands, the plantation economy
was far less intrusive, coexisting as an enclave among small-scale, swidden cultivators.

137
There, large expanses of land still remain uncultivated, but increasing cultivation is
limited by the natural characteristics of the tropical forest and soil fertility.
In the early 1960s, the need to increase agricultural output was tackled with highly visible
yet ultimately ineffective land reform. The land reform was part of a larger and more
successful effort to modernize the colonial legal system of landownership. Under the
Dutch, a dual system of land laws permitted non- Indonesians to register and obtain title
for lands on the basis of Western civil law principles, whereas Indonesian ownership was
governed by adat (customary) law, based on unwritten village practices. The dual system
was intended to protect farmers’ land ownership and use rights. However, the more
flexible, communal-based adat system also permitted the Dutch to rent communal village
lands for sugar cultivation by contracting only with the village head (penghula). In 1960,
the proportion of settled land still recognized only under the adat system, with no formal
survey or title, was estimated at 95 percent.
The Basic Agrarian Law (BAL), enacted in 1960, constituted a comprehensive legal
effort to modernize Indonesian landownership. The law sought to decertify land policies
enacted by the Dutch Colonial Government, primarily replacing the Agrarische Wet of
1870 . The Dutch law, sought to certify indigenous ownership rights over cultivated land
with the option to enter into lease agreements with European investors promoting
development of sugar, tobacco, rubber and coffee estates. Uncultivated land could be
given in erfpacht (hereditary lease right) by the state – a 75-year land lease. The Basic
Agrarian Law recognized previous ownership rights under both adat and Western
systems, but provided a new certification process under which land was to be surveyed,
mapped, and registered. All unclaimed land reverted to government ownership. Land
certification, however, was not compulsory and registration progressed very slowly. The
law also set limits on the size of landownership, depending on the population density of
the region and the type of land. In areas with over 400 people per square kilometer, rice
field ownership was limited to a maximum of five hectares and a minimum of two
hectares. Absentee ownership was forbidden.
138
In practice, this maximum field size or absentee ownership limitation may be difficult to
enforce. Field research conducted in 200229, indicated the practice by absentee owners to
isolate themselves from these requirements. Illegal residency cards were being obtained
to certify residency in the jurisdiction of the land parcels and land titles are transferred to
direct family members or relatives. In this specific case, the BPN representative also
believed that the legislature of the kabupaten (regency) has the authority to change
village boundaries and that such would be endorsed by the bupati. (head of the
Kabupatan). In this case, uncertainty existed about how such boundary change would be
formally communicated and registered at the central BPN office.
Also, by the standards of sawah cultivation, a wealthy landholder possessed three to five
hectares. The maximum of five hectares left very little surplus land available for
distribution and only a small amount of land was redistributed before Suharto's New
Order shifted the emphasis of agricultural policy away from land reform towards
increased productivity per hectare. The agricultural census of 1983 showed that about 44
percent of all farm households were either landless or operated holdings too small to meet
more than subsistence requirements. At that time, the average landholding on Java was
0.66 hectares, and ranged from about 1.5 to 3 hectares in other parts of the country.
By the 1980s, the New Order, undoubtedly aided by the Green Revolution, had achieved
undisputed success in expanding rice production. In fact, for a period of time in the late
20th century, it changed Indonesia from a rice importer to a rice exporting nation.
However, the distribution of benefits did not equally benefit the poor. Observers
suggested that only already prosperous farmers benefited from the new technology. By
the late 1980s, sufficient evidence had been gathered to show that the benefits from
increased rice production, together with growing employment opportunities outside
agriculture, had reached even the landless or near landless population, although a
widening income gap became evident in subsequent years.
As a provisional legal framework for a modern state, the 1945 constitution also addressed
the use of natural resources for the public good. It expresses the revolutionary
29 Mitchell, R. 2002. Rural Development International. Field Notes from Karawang Kabupaten

139
expectations about social and economic justice. Article 33 states that the economy shall
be organized cooperatively, that important branches of production affecting the lives of
most people shall be controlled by the state, and that the “state shall control natural
resources for exploitation for the general welfare of the people”
5.2 Land Rights
RI land rights associated with the pluralistic legal system and formally recognized and
registrable interests are consequently rather diverse, inconsistent and constrain
investment and planned development. However, the State controls virtually all land.
While supporters of the BAL claim that such control is less invasive than eminent domain
or complete state ownership, it can be argues that it is overly restrictive. Compared to
other nations, private land law is undeveloped and private land rights are severely
limited. By comparison, in the US a large number of (separable) rights are associated
with private property rights (Fig 5.1)
Figure 5.1 – The (US) “Bundle of Private Property Rights Principle” - Exclusive but not Absolute.
- USE (subject to public regulatory restrictions such as police powers, eminent domain – public taking and just compensation clause, condemnation) - LEASE - MORTGAGE - SUBDIVIDE (zoning regulations) - DEED RESTRICTION (e.g. conservation and other easements, covenant, development rights) - SALE OR BEQUEST - WATER (riparian, prior appropriation or other) - MINERAL (includes oil and gas) - DEVELOPMENT (restrictive covenants and police powers: zoning and other ordinances, environmental nuisance, building codes, and development guidelines) - LIENS (taxes and other)
140
The most significant public right here is the Right of Eminent Domain or the right to
expropriate private for the public, at fair compensation as man dated by the US
constitution. The constitutional hurdle remains high for property owners. First, owners
are not automatically entitled to the most profitable use of their land. Local zoning,
nuisance or wetland ordinances restricting the type and nature of development are
examples of use limitations. Second, diminutions of value caused by government
regulations are uniformly tolerated. Third, virtually all public interests to be served by
environmental laws are legitimate in the eyes of the constitution. Last, such laws are
usually found to substantially advance the public interest.
A listing of land rights is included below (Table 5.2). It should be noted that, in addition,
the Basic Agrarian Law also creates rights to use airspace and water, and the cultivation
and harvesting of fishery resources. Excluded are oil, gas and mineral rights. As currently
formulated, the system of land rights is predominantly time-limited and incompatible
with the modern investment climate and dynamic land markets that require long-term title
security to recoup long-term investments in agriculture, commerce and industry. Feared
land speculation, associated with unlimited land use rights, can be avoided by simply
limiting developing rights through proactive, well-articulated and objectively-enforced
land use plans.
Similarly, other restrictions can be enacted by zoning laws and still promote a sound
investment climate, while preserving public and community interests. This bundle of
(limited) land rights concept – permitting a clear definition of specific use rights and their
limitations – is a widely and successfully employed legal principle in many industrialized
nations to help regulate urban expansion and direct economic development and land use.
One fundamental challenge is to clearly define and administer land use rights associated
with customary or Adat rights as defined in the Basic Agrarian Law. Although rights are
conveyed to the Adat community (“rechtsgemeenschap”), it is unclear how these rights

141
Table 5.3 – Indonesian Private and Community Land Ownership and Use Rights
PERPETUAL RIGHTS
Hak Milik
“Ownership” – the right to own the land. Hereditary right for Indonesians through conversion regulations, government grants or Adat (customary) law. Owner can convey building right, use right, right to rent, pledge the land (hak gadai), share cropping or right of lodging – originates from “landerijenbezitrecht ”
TIME-LIMITED RIGHTS
Hak pakai (HP) Hak guna bangunan (HGB) Hak guna usaha (HGU)
Right to use the land Right to build on the land or use
the building on the land Right to operated a plantation
(exploitation right)
OTHER LAND RIGHTS
Hak sewa Hak membuka tanah Hak memungut-hasil-hutan Hak pengelolaan (HPL)30 Hak ulayat
Right of lease Right to clear and cultivate the
land Right to collect forest products Land management by state
authority Conceptual community property
rights. Under Agrarian Law community titles are subject to state interests and, therefore not considered “land rights”. Consequently, “community land” is for the taking by administrative authority without compensation
MODERN RIGHTS
Hak atas satuan rumah susun
Hak tanggungan
Ownership of strata (e.g. apartments)
Land as secure collateral for mortgages
30 This right is not formally recognized or written in the Basic Agrarian Law

142
specifically convey to its inhabitants. In practice, individual rights are neglected and
many people are marginalized to the benefit of domestic or foreign investors31.
This results in conflicts between the Adat community or some of its people and the
investors in cash crop plantations, forest plantations or lumbering operations, and
government if it involves clearcutting for transmigration projects. Of special note is
Regulation of State Minister for Agrarian Affairs/Chairman of the National Land Agency
No 5 / 1999 that provides guidelines for resolving these conflicts by delegating authority
to local governments. This is largely an unfunded mandate because local authorities do
not have the knowledge or the required capital of human resources to conduct the
necessary research.
Criteria for the identification of Adat communities include: a) the implicit recognition
and implementation of individual use rights by the community; b) the geographic
identification of a location where the individual or community lives and provides for its
daily needs; and c) an informal understanding of the guiding land tenure, management,
use and principles by the community.32 It is argued that overlapping administrative rules
pertaining to the recognition of Adat communities and their rights should be addressed by
means of clarification and harmonizing the vertical and sectoral integration (such as for
forestry and mining) of pertinent laws and regulations. It is further recommended that
Adat communities are spatially identified to permit the certification of land rights,
provide title and tenure security as a means of improving prosperity, preserve cultural
identify and promote social equity and justice.
It can be argued that the Basic Agrarian Law 5/1960 (BAL), needs fundamental reform.
The BAL is "based on adat (customary) law", - principles that reflect a sedentary,
traditional, immobile agrarian society. It does not provide the necessary flexibility to
develop a coherent national land law that seeks to promote responsible investment and
economic development. Under the BAL, land is controlled by the State to achieve
"prosperity of the Indonesian people, Indonesian socialism, and adat philosophy". The 31 BAPPENAS, 2008. Adat Land Tenure, Final Report. Land management and Policy Development Project. 32 Ibid. 2008

143
presumptions are that State control is essential and provides for a better mechanism to
control land rights and allocate capital inputs than well-functioning landmarkets, and that
total private or corporate ownership (as it may be restricted by the proper land use plans,
laws, regulations and enforcement) leads to exploitation and waste. The multi-
institutional control of land rights as exercised directly or indirectly by various GOI
agencies is currently viewed as discretionary, replete with confusing and contradictory
mandates and regulations, with a high transaction cost and low, if any, accountability
5.3 The Judiciary and Land Disputes
The Indonesian legal system is extraordinarily complex, the newly-independent state
having inherited three sources of law: customary or adat law, traditionally the basis for
resolving interpersonal disputes in the traditional village environment; Islamic law
(sharia, or, in Indonesian, syariah), often applied to disputes between Muslims; and
Dutch colonial law. Adat courts were abolished in 1951, although customary means of
dispute resolution are still used. The return to the 1945 constitution in 1959 meant that
Dutch laws remained in force except as subsequently altered or found to be inconsistent
with the constitution. In the 1990s the government continued to review its legacy of
Dutch civil and commercial laws in an effort to codify them in Indonesian terms. The
types of national law recognized include, in addition to the Constitution, various decrees,
statutes and regulations promulgated by the president, and other implementing
regulations such as ministerial regulations and instructions. The executive branch has
considerable discretion in determining what is “law”.
With respect to the administration of justice, Article 24 of the Constitution states that
judicial power shall be vested in the Supreme Court and subordinate courts established by
law, and that the organization and competence of courts shall be established by law33.
While during the Sukarno administration, the justice system became a tool of the
33 William H. Frederick and Robert L. Worden, editors. Indonesia: A Country Study. Washington: GPO for the Library of Congress, 1993.

144
revolution, and any pretense of an independent judiciary was abandoned, one of the goals
of the New Order was to restore the rule of law. A major step in that direction was the
enactment of the Basic Law on the Judiciary Number 14 of 1970, which defined the
independent status of the Supreme Court and emphasized noninterference in judicial
matters by persons outside the judiciary. Theoretically, the Supreme Court stands coequal
with the executive and legislative branches. The president, vice president, and justices of
the Supreme Court are nominated by the legislature and appointed by the president. The
Supreme Court has exclusive jurisdiction in disputes between courts of the different court
systems and between courts located in different regions. It can annul decisions of high
courts on points of law, not fact. On request, it can give advisory opinions to the
government and guidance to lower courts. It is not part of a system of checks and
balances, however, since it does not have the power of judicial review of the
constitutionality of laws passed by parliament. Its jurisdiction is limited to whether or not
implementing administrative regulations conforms to law. Moreover, the Supreme Court
has no control over the integrity of the lower courts, which are under the supervision of
the Department of Justice.
Below the Supreme Court four different court systems can be distinguished34: First, there
are courts of general civil and criminal jurisdiction. District courts are the courts of first
instance, whereas the High Courts are appellate courts. Despite protestations of
independence, the lower courts have shown reluctance to challenge the government,
particularly in political cases. In the view of some observers, these courts routinely
allowed egregious breaches of fundamental civil rights. There are also regular allegations
of corruption in the lower court system in both civil and criminal cases.
Second, are the State Administrative Courts (peridilan tat usaha Negara). The
administration of the first two jurisdictions courts is under the Supreme Court and
supervised by the Judicial Commission.
34 Budiardjo et al., 1997. Law Reform in Indonesia – Diagnostic Assessment of Legal Development in Indonesia. Volume I.

145
Third, there are the military courts (peradilan militer), which have jurisdiction over
members of armed forces or persons declared to be of a similar status. These courts are
supervised by the Department of Defense and Security.
Fourth, there are religious (Islamic) courts (peradilan agama), under the Department of
Religious Affairs, which exist to resolve specific kinds of disputes between Muslims in
matters of marriage, divorce, inheritance, and gifts. These courts base their decision on
Islamic law. To be legally enforceable, however, the religious court's decisions must be
approved by a corresponding secular district court. The Directorate of Religious Justice
within the Department of Religious Affairs has ultimate appellate jurisdiction. One of the
persistent tensions between Islam and the state arises from Muslim efforts to expand the
jurisdiction and autonomy of the Sharia courts.
5.4 Local Government
Government administration is carried out through a hierarchical level of administrative
subunits. Indonesia is made up of 33 provincial-level units (propinsi), including five
special regions (daerah istimewa) such as Aceh, Papua, andYogyakarta--and a special
capital city region (daerah khusus ibukota), Jakarta. The provinces are subdivided into
districts or regencies and city (kabupaten/kota), and below that into subdistricts
(kecamatan). Some forty municipalities or city governments (kotamadya) have equal
administrative status as a kabupaten. At the lowest tier of the administrative hierarchy is
the village (desa and kelurahan). In this evolving structure, Indonesia had currently about
349 districts, 3,625 sub-districts (kecamatan), 91 cities, and 66,979 villages/kelurahan.
Since independence, the nation has been centrally governed from Jakarta in a system in
which the lines of authority, budget, and personnel appointments. In these matters,
regional and local governments enjoy little autonomy. Their role is largely
administrative: implementing policies, rules, and regulations. The political goal is to
maintain the command framework of the unitary state, even at compromising
developmental efficiency. Governments below the national level, therefore, serve
146
essentially as subordinate administrative units through which the functional activities of
Jakarta-based departments and agencies are delegated.
In the early 1990s, there was neither real power sharing nor upward political
communication through representative feedback. Real feedback occurred through
bureaucratic channels or informal lines of communication. Elected people's regional
representative councils (DPRD) at the provincial and district levels had been restored in
1966, after operating as appointive bodies during the period of Guided Democracy.35
However, the DPRDs' participation in the early 1990s governing was extremely
circumscribed because the councils lacked control over the use of resources and official
appointments. Even though 1974 legislation gave provincial DPRDs some voice in
selecting their governors--DPRDs could recommend appointments from a list of potential
candidates submitted by the minister of home affairs--provincial governors were still
appointed by the president. District heads were designated by the Department of Home
Affairs.
The structure of provincial-level and local government in Indonesia is best understood in
terms of the overriding goals of national political integration and political stability. At the
governmental level, integration means control by the central government, a policy that
was in part conditioned by historical experience. At independence, Indonesia consisted of
the short-lived federal Republic of United States of Indonesia (RUSI, 1949-50).
According to some, the RUSI was viewed as a Dutch plot to deny authority over the
entire country to the triumphant Indonesian nationalists. Regional rebellions in the late
1950s confirmed the government's view that Indonesia's cultural and ethnic diversity
required tight central control to maintain the national integrity. Political stability was
equated with centralization and instability with decentralization. Civil control was
maintained through a hierarchy of the army's territorial commands, each level of which
paralleled a political subdivision--from the highest regional command levels down to
noncommissioned officers stationed in the desa for "village guidance." Lateral
coordination of civilian administration, police, justice, and military affairs was provided
at each provincial, district, and sub-district level by a Regional Security Council 35 Ibid. A Country Study
147
(Muspida). The local Muspida was chaired by the regional army commander and did not
include the speaker of the local DPRD.
Added to the political requirement for centralization in the early 1990s was the economic
reality of the unequal distribution of natural resources endowment and the mismatch of
population density to resources. The least populated parts of the country, such as Papua,
were the richest in primary resources. This brought the issue of social equity in the main
stream of the policy debate – ensuring that wealth produced by resource exploitation be
fairly shared by all Indonesians. This goal meant that, in addition to Jakarta's political
control of the national administrative system, the central government also exercised
control over local revenues and finances. The absence of an independent funding base
limited autonomy for provincial and local governments.
About 80 percent of total public expenditures in the provinces was disbursed from the
national budget controlled by departments and agencies headquartered in Jakarta. Of the
20 percent administered by the provinces, about half came from Inpres (Presidential
Instruction) grants for infrastructure and other developmental purposes. Beginning in
1969, the Inpres grant programs at provincial, district, and village levels channeled about
20 percent of the development budget to small-scale projects for local development, with
an emphasis on roads, irrigation, schools, and public health. Only about 10 percent of
regional government revenue was derived from local taxes and fees.
Whereas once the central government's transfer of wealth from resource-rich provinces to
people-rich provinces had been a source of political irritation for the better-endowed
regions, in the 5-year economic development plan (Repelita V - FY 1989-93), the lag in
development investment beyond the Java-Sumatra western core was perceived as
troubling. Suharto's 1992 New Year's message to the nation explicitly addressed this
problem: "We are also aware," he said, "of the fact that there is a wide gap in the progress
achieved by each region in our country, especially between the western and eastern part
of the country." In looking to future policy, he added that there would be stepped-up
efforts to provide autonomy and decentralization. Such steps, however, would require
strengthening the capacity of sub-national units financially and administratively, as well

148
as strengthening local participation in the setting of national goals and policies. To some
government leaders in the early 1990s, making concessions to economic and cultural
claims for autonomy would endanger national unity. Conflicting interests of politics and
administration presented special problems in the Special Regions such as Aceh, Irian
Jaya and Timor.
Of special note is the allocation of land parcels at the Desa (village) level to provide local
revenues for public administration. The so-called “village inventory” land (tanah kas
desa) is allocated to provide for operating cost, while the “Tanah Bengkok” land is
designed to provide funds for village administrative staff salaries. A profile of various
villages located in an administrative district is provided, below (Table 5.3). It is estimated
that Bengkok land constitutes about 10% of the cropland in Central and East Java
Table 5.4 - Profile if Villages in Kecematan Sumbang, Banyumas Regency, Central Java
(source Safik, 200936)
No Village Total Area
of Villa-
ge (Km22005)
Number Heads of HH (2005)
Number of Poor House-holds
(2006)
Total Area of
Bengkok Land (Ha,
2005)
Total Area of Village Inventory Land (Ha,
2005)
Number of
Individual Land
Parcels (Hak
Milik) Registered
(July, 2007)
Total Area of Land
Registered (m2, July
2007)
A B C D E G H I J 1 Karanggintung 1.43 963 409 28 3.375 335 166500 2 Tambaksogra 2.6 1782 682 35.98 4.2 78 179308.81 3 Karangcegak 1.2 674 242 20.65 0.84 347 246965 4 Karangturi 1.77 659 212 20.677 6.174 172 186903.75 5 Silado 1.71 605 265 23.55 8.13 1490 1335465.8 6 Susukan 2.08 1019 540 21.86 8.5 122 214574.35 7 Sumbang 2.35 1411 675 26.025 5.3 50 6148344 8 Kebanggan 1.81 859 527 25.765 2.15 2575 2046552 9 Kawungcarang 0.47 309 148 7.595 1.25 34 29022
10 Datar 0.87 633 345 9.955 1.29 197 310646.79 11 Banjarsari Kulon 2.12 908 444 25.335 2.315 253 355369
36 Safik, 2009. Field Survey Notes

149
12 Banjarsari Wetan 1.92 752 366 20.853 1.225 1530 1884013.4 13 Banteran 3.64 1878 1041 38.255 3.745 395 536334.47 14 Ciberem 2.34 1129 641 16.32 1.43 52 112958.6 15 Sikapat 3.97 960 579 13.84 0.114 380 377180 16 Gandatapa 5.42 1907 1209 23.05 2.799 2823 3808991 17 Kotayasa 5.05 2253 1208 28.595 1.88 182 275329.85 18 Limpakuwus 11.7 1259 669 15.305 2.014 480 787143.84 19 Kedungmalang 0.95 636 258 Na na 207 20066605
150
6. LAND POLICY GUIDELINES FOR INDONESIAN AGRARIAN REFORM AND RURAL ECONOMIC DEVELOPMENT
Fundamentally, agrarian reform means a deliberate strategy to reduce rural poverty and
provide equitable access to common property resources, and clearly recognize these
rights and associated economic opportunities, thereby further contributing to sustainable
development and improve rural well-being. This requires a multi-disciplinary and multi-
sectoral approach to land policy formulation, including facilitating legislation, effective
land administration, equitable distribution of land rights and comprehensive rural
development planning.
Strategic development planning is implemented by effective policies that are based on a
well-defined regulatory framework and supporting incentives. In the context of agrarian
reform, land policies should develop strategies to improve land productivity while, at the
same time, preserve the long-term productive capacity of land. A number of key
strategies and incentives should be considered:
Provide secure access to and rights to use land productively. Ownership and
control enhance the productive capacity of land and develops a stewardship
and conservation ethic. In contrast, sharecroppers, tenants and squatters
pursue short-term gains that lead to exploitation. Tools in this process are
property boundary verification and land registration, creation of an effective
land market, and effective dispute prevention and resolution by impartial
Review and Arbitration Boards.
Develop local land use planning and agricultural zoning. Encourage
preservation of highly productive agricultural land and concentrate labor
intensive production on the most productive soils, and close to communities
and existing infrastructure. Encourage land consolidation and concentration of
small-scale production to create economies of scale and value chain
opportunities. Create biodiversity reserves and avoid encroachment of critical
habitat by creating exclusion zones that can be enforced. Concentrate large
scale production that is less labor intensive away from community centers.

151
Provide economic incentives that help lower input cost and improve
commodity prices. Tools include cooperative procurement of material and
capital inputs, processing and market development, and import substitution.
For critical food commodities, temporary price supports should be considered,
and preferred over input supports (such as fertilizer subsidies) that create
production inefficiency and environmental pollution.
Provide access to inputs and services. Tools include credit and extension
services, establishment of farmers organizations, mechanization, developing
infrastructure (roads, irrigation, markets, storage, community services), and
creating sustainable community services.
Improve farming techniques. Tools include farming techniques that encourage
cultivation practices that conserve soil, water, nutrients, energy, and pesticide
inputs by strip- or contour cropping, intercropping, minimum tillage,
integrated pest management, grassed waterways to direct runoff, etc.
Encourage community and land owner participation. Tools include the
participation of land owners in conservation practices, demonstration sites,
community gardens and extension services.
Eliminate long-term incentives and price supports that discourage
conservation and efficient production and cause environmental
contamination. Tools include the removal of subsidies for fertilizers and
pesticides that increase pollution and increase the resistance of pests. This is a
real concern in Indonesia. Instead, encourage integrated pest management and
biological controls.
6.1 Challenges in Indonesian Land Reform
Historically, increasing rural prosperity through land redistribution in accordance with
Government Regulation (PP) No.224 Year 1961 regarding the Implementation of Land
Redistribution and Compensation has been difficult. Major challenges include the gap in
land use controls, land availability and conflicts, ineffective or irrelevant regulations, lack

152
of comprehensive field data on land-reform, and rejection of compensation by land
owners whose lands are subject to the land-reform provision.
Gap in Land Use Controls
As pointed out by internal BPN research (Background Paper ARP), field experience
indicates gaps in the control of agricultural land ownership. This gap has widened due to
macro economic policies that stressed growth and increased productivity. Data indicate
that 43% of "land poor" rural households (landless and farmers with the control less than
0.1 ha) only control 13% of the total agricultural land, while 16% of the "land rich” rural
households (farmers with the control more than 1 ha) control almost 70% of the total
agricultural land37. Agrarian policies have not focused on the restructuring of small-scale
rural production assets but rather on increasing large-scale agricultural output. As a
result, small-scale production was marginalized and weak tenant farmers or farm
workers, and poor farmers became poorer. This situation was exacerbated by the
transformation of productive farmland to residential and industrial use, urban
infrastructure and other non-agricultural land uses, increasing peri-urban land prices
To address this issue, a systematic farmland preservation program is needed that protects
the most productive farmland - in most cases sawah, and develops effective land use
plans and controls that are consistent with and reinforce existing laws and regulations.
Limited Land Availability and Conflicts
PBN staff indicates that since 1970, one a limited number parcels has been directly
acquired pursuant to PP 224 of 1961. The main land sources available for redistribution
by the State pursuant to article 1 sub-article d of PP 224 of 1961 includes land with
expired, terminated or cancelled Right of Cultivation (HGU), and forest lands for which
control had been transferred to the state and others. The availability and acquisition
mechanism of this land must be clarified. This ambiguity has also resulted in an increased
number of land conflicts between "small" farmers that need essential land, the non-
37 Central Statistics Bureau, 1993 Agricultural Census.

153
agricultural sector, and plantations with HGU rights, intruded by community members
that start cultivations, whether or not abandoned or which HGUs rights expired.
Unrealistic Legal Provisions
BPN staff indicates that some of these issues had been anticipated by the promulgation of
direct and indirect laws and regulations on land-reform, namely Law No.1 Year 1958
regarding the Abolition of Private Lands, Law No.2 Year 1960 regarding Profit Sharing,
Law No. 5 Year 1960 regarding Basic Agrarian Law (UUPA), Government Regulation in
Lieu of Law No. 56 Year 1960 regarding the Determination of Agricultural Lands,
Government Regulation Number 224 Year 1961 regarding the Implementation of Land
Redistribution and Compensation, Government Regulation No. 41 Year 1964 regarding
Amendments and Supplements to PP 224 Year 1961, Government Regulation No.4 Year
1977 regarding Ownership of Absentee Agricultural Lands for former Civil Servants, and
other laws and regulations. The implementation of such laws and regulations was
compromised for various reasons. The land-reform program during the period of 1961 -
1965 may be considered as a "failure" because its provisions were not realistic, while the
administrative and financial conditions at the time were not conducive to successful
implementation, In part, this was the result of an increasing rivalry between communist
and anticommunist political forces, where the communists used the land reform program
to obtain political goals.38
Unavailability of Comprehensive Land-reform Data
During the New Order Administration, the constraint was the Government's lack of
political will and commitment (KPA, 2002) to implement land reform and lack of data
and information on land reform either related to objects (land) or subjects (people) of
land reform. Based on BPN data (source Central Statistic Bureau), during the period of
1961-2002, 1,770,444 Ha became the objects of land reform. Out of that amount, 884,954
38 Rajagukguk, Erman (1995) Hukum Agraria, Pola Penguasaan Tanah dan Kebutuhan Hidup. Jakarta: Chandra Pratama

154
Ha have been distributed to 1,374,214 households. Therefore, there are still 885,490 ha
available for land-reform from that period. However, there is no definite information as
to the location and boundaries of such remaining land, particularly on land acquired in
the 1960s. In 2009, BPN estimated that about 7 million hectares are available for
distribution from various sources.
Refusal of Compensation by Owners
One of the most significant problems encountered in the implementation of land
redistribution is refusal by landowners, whose land is subject to land-reform provisions,
to accept the amount of compensation offered. They demand compensation in accordance
with prevailing land market prices. BPN staff cites absentee land case of 51,400 m2 in
size in Kuta Bumi Village, Pasar Kemis District in Tangerang regency, and other similar
cases. The principle of “fair compensation” should accompany “public takings” for land
distribution and arbitration is suggested in the form of a Board of Review and Arbitration
to minimize conflicts and court challenges. Care should be taken that such boards are
staffed (appointed membership, representing all stakeholders) in such a manor that its
actions are objective, transparent, avoid conflicts of interest and potential corruption. It is
also critical that land acquisition programs are adequately funded to offer fair
compensation.
In Indonesia, it is clear that a transparent, restructured and complementary legal
framework must be combined with an effective institutional framework to ensure
effective implementation of agrarian reform. A successful effort will need strong political
support and “ownership” by stakeholders.
6.2 General Guidelines for Indonesian Land Reform
It is suggested that a participatory approach is used to seek “buy in” from the major
stakeholders and to build social and political momentum in favor of reform to overcome

155
potential opposition. Suggested operational principles, strategies and actions for such
agrarian reform program are to:
Create a national land use planning and agrarian reform task force. The primary
task is to consolidate RI expertise and articulate clear goals associated with food
production, rural development, the forestry sector, wildlife and ecosystem
preservation, tourism, public works – all within the aim of developing a
comprehensive, 10-year national plan that provides the framework for regional,
provincial and local land use plans.
Raise public awareness of the issues and potential solutions. A targeted public
outreach campaign that addresses the issues of idle and underutilized land,
potential for increased productivity, marginalized rural populations, social equity
and the government’s commitment to regional economic development and
community planning. The Central Theme in this public message it the need to
increase productivity and welfare, while conserving natural resources,
combating environmental degradation and restoring environmental quality.
Local communities, industry and mining are not only part of the problem, they
are part of the solution and an active partnership should evolve.
Develop strong political and social support, if not consensus. A systematic effort
to work with other government agencies, under the umbrella of the outreach
effort, above, to work with national, provincial and local authorities to seek
support for the well-articulated goals and objectives of the program and,
specifically, seek multi-institutional participation in its implementation
Create a sustained commitment from the President’s office and the legislature
with funding based on a well-defined implementation process with clear
timelines and goals. This should include the monitoring and evaluation criteria,
such as discussed in Chapter 2.
Formulate and enact enabling legislation to provide institutional and political-
administrative district mandates associated with agrarian reform that are well-
defined, transparent and strongly endorsed. This should include enforcement
through social and legal sanctions.
156
Structure a dialogue with stakeholders. After a regional agro-ecological
assessment and land evaluation process – including evaluation of farming
systems alternatives (see Chapter 2), the pilot areas for innovative land
distribution schemes should be identified, together with the preferred
characteristics of the Land Utilization Types ( LUTs) (such as plot size,
household parameters, cropping or agro-forestry system, etc). This permits the
identifications of target group and broader stakeholders to invite for a dialogue
that can be used to define the broader parameters of the agrarian reform program
and the community develop components
Focus and strengthen the capacity of BPN. A systematic effort should be
undertaking to take stock of all internal capabilities and capacities, structure an
internal task force to lead the agrarian reform initiative. Oversight can be
provided by the Management Board of National Agrarian Reform.
Indentify essential program needs and conduct a GAP analysis (steps to reach
desired state) to prioritize investments by BPN to meet human and capacity needs
and structure a institutional capacity development program to lead this effort
Develop pilot schemes to test land use alternative and land distribution program
options. Programs should reflect agro-ecological potential, community needs and
preferences.
Experience suggests that successful land reform has some indirect effects by improving
the governance system. That is, creating better arbitration mechanisms, guarantying the
ability by the poor to exercise their rights, creating institutional accountability and
installing checks and balances. The implied goal is to systematically address social equity
concerns. As part of process, it is the obligation of the State and donor organizations in
agrarian reform programs to follow the international human rights standards, beyond the
“right to food” pledge. This includes the basic rights by people affected, including the
obligations to Respect, Protect and Fulfill.
The obligation to Respect indicates that “support to land reform should in no case result
in further deprivation for women and poor people from access to and control over land,

157
nor in the dispossession or eviction of ethnic minorities or tribal an indigenous people
from the territory they traditionally occupy”39
The obligation to Protect refers to the notion that economic and social trends tend to
weaken the security of vulnerable groups and thereby emphasizing the requirement to
protect their customary rights against encroachment of the elite who tend to use formal
legal arguments to make and rationalize their land claims.
The obligation to Fulfill encompasses the notion of meeting human welfare needs – the
provision of food and basic needs - to those unable to provide for themselves as a result
of a marginalized existence or from natural disasters or other causes. As such, policies
should be adopted to assure that these needs are met. This issue has of course a more
fundamental origin, namely the UN’s Universal Declaration of Human Rights Article 25
par 1, to which the RI is a signatory, which states that:
…Everyone has the right to a standard of living adequate for the health and well-being of himself and of his family, including food, clothing, housing and medical care and necessary social services, and the right to security in the event of unemployment, sickness, disability, widowhood, old age or other lack of livelihood in circumstances beyond his control..
[ the Bahasa Indonesia version of the Declaration: … “ Setiap orang berhak atas taraf hidup yang menjamin kesehatan dan kesejahteraan untuk dirinya dan keluarganya, termasuk pangan, pakaian, perumahan dan perawatan kesehatannya serta pelayanan sosial yang diperlukan, dan berhak atas jaminan pada saat menganggur, menderita sakit, cacat, menjadi janda, mencapai usia lanjut atau mengalami kekurangan mata pencarian yang lain karena keadaan yang berada di luar kekuasaannya” …]
A number of basic premises are offered to address the needs and realities of private land
use in rural areas for agrarian reform. First, small land holdings provide the opportunity
to a large number of households to have access to income opportunities, thereby
addressing a major policy objective – social equity. Second, small and medium sized
farms tend to be much more efficient in using (abundant) labor as input, thereby
increasing the productive capacity of land as a scarce resource – increasing resource
production efficiency. Third, as a development strategy, the strengthening of the small-
39 European Union. 2004. EU Land Policy Guidelines: Guidelines for the support to land policy design and land policy reform in developing countries.

158
farm sector reduces per unit input cost, increases outputs and the associated opportunities
along the value chain – increasing associated employment and income opportunities.
Forth, left to its own, the current process of liberalization of imports and the increasing
expansion and dominance of export commodities will result in the land concentration at
the exclusion and deprivation of vulnerable households. Therefore agrarian reform is
effective in preserving the viability of small farming systems.
As pointed out in the introduction, am agrarian reform program is a deliberate, long-term
strategic initiative that seeks to restructure and revitalize the agricultural sector, with
well-defined objectives, priorities, and constraints. It should involve the folloing major
phases:
Phase I - Natural resources assessment to define the sustainable production capacity
of the land resource base. This involves a systematic assessment of the agro-
ecological conditions in the potential target (object) area -- the complex of resources
assets available for the production of food and cash crops and the provision of other
goods and services, based on the long-term agro-ecological capacity to sustain
production opportunities. This process involved the identification and evaluation of
potential farming / agro-forestry systems options that represent potential land
utilization types (LUTs) that could be evaluated as small scale farm holdings an
tested as prototypes in a pilot scheme (including land tenure and land use rights
options). This land evaluation process, as identified in Chapter 2, involves the careful
matching of land use requirements with land capabilities and develops an economic
suitability map using prevailing cropping mix, input costs and product prices. This
process will result in the selection of the best land use options for an agrarian reform
program and estimate the socio-economic benefits on a household and aggregate
basis. The land use types can be spatially allocated based on agro-ecological zones
variable and community development needs and opportunities, and translated in a
comprehensive (local or regional) land use plan, in the following phase.

159
Phase II - Land use planning and zoning to promote economic development -- the
development of guidelines and regulations to allocate land resources to sustainable
land uses that are socio-economically viable and environmentally acceptable (and in
harmony with the long-term agro-ecological production capacity) This is the actual
refinement of Phase I implementation, including the clarification of institutional
planning and implementation mandates at the local, regency and provincial level.
Phase III - Land policy reform by restructuring land policies and laws to optimize
tenure regimes and land rights to promote sustainable use, social equity and
prosperity -- the utilization of the land resource base to promote the optimum
allocation of human, capital and land resources to promote household and societal
welfare. The process of restructuring and consolidation of relevant laws and
regulations is currently taking place under auspices of ADB funding in cooperation
with BPN. Recommendations associated with this effort should clarify and facilitate
operational agrarian and access reform, optimizing production opportunities for
smallholders and landless agricultural workers.
Phase IV - Access reform to improve the conditions of land resource allocation in
combination with fixed and variable capital inputs, transportation, processing and
marketing infrastructure to maximize profitability. Access reform should be based on
improving the input availability (while lowering unit cost) of a parcel basis, and the
associated commodity value chain and unit product prices, to increase net returns in a
household basis.
This process is consistent with the summary as identified by BPN below (Fig. 6.1). Care
should be taken that inventory phase includes both up-to-date land cover/use maps and
the identification agro-ecological zones to permit land evaluation and the optimal land
allocation for a given planning horizon. It is strongly suggested to evaluate land use
alternatives in pilot project before larger land redistribution schemes are enacted. The
process should be well-articulated, based on sound and transparent legal principles,
reflect regional needs and production opportunities (using principles of environmental

160
sustainability and economic viability), involve careful land policy formulation and land
use planning, and adequate public funding support as part of an agrarian reform program
that is viewed as a national priority
Figure 6.1 – General outline of Proposed Agrarian Reform Process as defined by BPN (2009).
6.3 Structuring Agrarian Reform
Three basic models are considered by BPN linking the land (Object) with the recipients
(Subjects) (figure 6.2):
Model I – moves “land to the people” by making most land available in target areas by the purchase or expropriation of the land or use rights.
Available Land
Beneficiaries
Model IIIModel II Model I
Land reform Object DETERMINE
STATE LAND BECOME LAND
REFORM OBJECT
OPTIMAL LAND UTILIZATION
ACCESS REFORM STAKE HOLDERS
INVENTORY OF LAND HOLDING,
OWNERSHIP, USE AND
UTILIZATION
State Controlled
Land
DISTRIBUTION

161
In all 3 models, land sources include “idle or underutilized” land, “excess” land, the
maximum parcel size of depending upon the area under consideration, state-owned land
(administered by various Ministries, including Forestry, Agriculture or Defense), and
land acquired by purchase on a voluntary basis.
Figure 6.2 – Structural Models for Agrarian Reform Model II - moves most people to land in target areas, like the transmigration programs in the past. This option is fraught with potential problems. First of all, the relative cost is high on a
per person/hectare basis in resettlement schemes. Second, many transmigration programs
Object(Land)
Subject(Beneficiaries)
Model II(S ? O)
Model III(O ? S)
Basic Models
Model I(O ? S)

162
failed because the quality of land was not suitable for the type of land use envisioned.
Third, unless people are moved over a relatively short distance, many socio-cultural
communal issues may arise, not at least the ethnic and language differences that hamper
adaption. A significant factor in the failure of past transmigration projects was also the
lack of comprehensive government support, specifically the availability of an adequate
physical and service infrastructure - a prerequisite for successful community
development.
Model III - is a hybrid, making more land available to the landless and small farmers in
the target areas and communities where they live, and moving some people from outside
the area to the existing target communities involved in agrarian reform.
This appears an attractive option in some cases because it builds on the existing
community infrastructure and socio-cultural setting, while still permitting the expansion
and allows for the adaptation of new citizens. In combination, it is likely to be the most
flexible in adapting to local needs and preferences, while at the same time, permitting for
a cost-efficient expansion of the physical and service infrastructure of existing
communities. Such model could be crafted to provide communal ownership to newly
allocated land while accommodating expansion opportunities for existing marginal
farmers and land use right on newly available parcels to the new inhabitant. A careful
community and extension support system should be designed and implemented (with
adequate funding) to facilitate this adaption process by new arrivals and help ensure
success.
6.4 Selecting Beneficiaries
The various criteria for selecting are identified in the schematic, below (Fig. 6.3). These
criteria are already defined by law, but care should be taken to ensure that these criteria
are clearly communicated to all stakeholders, are understood and (mostly) accepted to
increase to likelihood of establishing successful programs, as measured by significant
socio-economic benefits and minimal land disputes.

163
Figure 6.3 – Eligibility Criteria for Land Distribution (Source: BPN)
Warga Negara Indonesia
Berusia minimal 18 tahun atau
sudah menikah
Miskin
Kemauan yang tinggi untuk
mendayagunakan tanah
memiliki aset yang bernilai
< 15 juta rupiah
Bertempat tinggal atau bersedia tinggal di kecamatan letak tanahnya
Bertempat tinggal atau bersedia tinggaldi kecamatan letak tanahnya
KRITERIA UMUM
KRITERIA KHUSUS
a. Tidak memiliki tanah (landless), b. Jumlah Tanggungan Keluarga, c. Lamanya bertempat Tinggald. Mata Pencahariane. Pendidikan.
URUTAN PRIORITAS
SKEMA PENETAPAN PENERIMA MANFAAT
Pembobotan
Tanah yang tersedia
Tanah yang belum ada
penguasaan
Tanah yang sudah ada
penguasaan
Warga Negara
Indonesia
Penggarap/ Pengklaim
KRITERIA
Farmers or farmwor-kers
Other criteria

164
6.5 Procuring Land for Distribution
Below, (Figure 6.4) various means are identified for land reform acquisition for
subsequent distribution to smallholders and the land less (mechanism to integrate Object
[land] to subjects [beneficiaries]). Some land will come from private sources, other from
public land currently under control by various ministries.
The various means (M1-M6) include: Figure 6.4 – Land Acquisition and Tenure Arrangements for Agrarian Reform and Distribution (BPN).
Individual ownership
Community ownership
Corporate ownership
V1
V2
V3
Individual ownership
Community ownership
Corporate ownership
V6
V7
V8
Individual ownership
Community ownership
V4
V5
Objects (land)
Subjects (beneficiaries)
Model II(S ? O)
Model III(O ? S)
Delivery of ObjectsMechanism to integrate Objects to SubjectsBasic Models
M1
Land release and acquisition
Obligation of landholder to provide land
Direct exchange of land
Exchange of land to overcome land conflicts
Land acquisition from state-revenue
M2
M3
M4
M5
M7
Indirect exchange of land and overcome
land conflicts
Direct acceptance
Joint company
Through joint
companyNotes:- M = mechanism, V = variant - Mechanism, system and variant may be developed further according to the
characteristics of subjects, objects and localities - Joint company: government, beneficiaries, sister-company
Objects and subjects of Agrarian Reform
is integrated at the same
location
Subjects to objects approach
M6
Model I(O ? S)
P1
P2
P3
165
M1 - Acquisition of land by public purchase. Presumably, this refer
predominantly to the acquisition of ownership rights and the remainder to
“use rights”, where time-limited rights are involved. It should be clarified
if these intended acquisitions are based on a voluntary exchange or on the
basis of eminent domain, such as in the form of a legally enforceable
government purchase order, with fair compensation to be paid using
prevailing land market prices. This needs further clarification and may
require the role of a local Board of Review and Arbitration to minimize
land conflicts and potential court cases
M2 - Land release and acquisition. Presumably this refers to land
currently administered and released by the various ministries, such as
Forestry and Agriculture. If this is the case, it should be clarified if a
public exchange of funds also takes place or if this simply involves a
public transaction where land is provided to BPN (and a local land bank)
and for subsequent distribution.
M3 - Obligation of landholder to provide land. Presumably this refers to
absentee ownership, idle, underutilized or excess land using applicable
legal ownership standards that make this land available for agrarian reform
as part of exercising eminent domain. It should be clarified is fair
compensation would be involved or a public “taking” without
compensation. Here it would be important to clarify the specific laws and
regulations associated with this “obligation” and communicate these
widely to the local jurisdictions affected. This should also be combined
with legal notices communicated by certified mail or signed hand-delivery
to the property owners affected
M4 - Direct exchange of Land. In many cases, differences in either the
size of or the quality of land exchanged would call for arbitration if the
exchange is not based on mutually accepted reciprocity. This may call for
some arbitration mechanism and the role by an impartial Board of Review

166
and Arbitration with the authority to define enforceable terms of
exchange, including financial compensation.
M5 - Exchange of Land to Overcome Land Conflicts. In these cases a
specific conflict exists based on different interpretations of property
boundaries or use rights and associated benefits. Again, here the role of an
impartial Board of Review and Arbitration should be established, with the
authority to define enforceable terms of exchange, and to reduce the
number of court challenges.
M6 - Indirect Exchange of Land to Overcome Land Conflicts. Presumably
this refers to exchange of other land (or parcels) not directly associated
with the land dispute. The same role of an impartial Board of Review and
Arbitration is called for.
6.5 Land Tenure and Administration Alternatives
As identified above (Fig. 6.4), BPN envisions a number of alternative tenure
arrangements that will govern ownership and use rights. The alternatives listed as V1 –
V8, reflect primarily the mechanism of the transfer of the land title (P1-P3 – direct
transfer or via an intermediary step), and the final titles recipients (individual, community
or private corporation). Based on BPN documentation, three beneficiary land
tenure/right categories are envisioned:
Individual land rights - land right controlled by individual ownership with
unrestricted land use. Beneficiaries manage the land supported by farmers training
to enhance production capacity, input (seed) assistance and access to capital and
markets. Farmers may form a cooperative to jointly manage land, cooperate with
state-owned enterprises or regional government-owned enterprises in the form of
shareholders. Beneficiaries – individually or through a cooperative— may make
land management contracts with any business or government entity.
Collective land rights - collective control of land rights or joint ownership is
intended to prevent fragmentation of land into separate individual ownership
parcels. The land may be managed by a cooperative or business entity while

167
beneficiaries may work there. Businesses have the obligation to develop a
plantation company and manage it and beneficiaries may work at the plantation
company either in off-farm activities of on-farm activities. Beneficiaries –
collectively or through a cooperative - may make management contracts with any
business entity or government to manage the land. Beneficiaries may work at the
business entity in on-farm activities, off-farm activities or management.
Business entity or cooperative control of land right. Control of land right is
managed in the name of cooperative or business entity. Beneficiaries are
shareholders and may still be employed at the cooperative or business.
Beneficiaries basically manage land by themselves with assistance to enhance
production capacity, providing seeds and access to capital and market facilities.
Beneficiaries –collectively or through cooperative—may enter into management
contracts with any business entity or government to manage land.
Generally, community land ownership is an option when combined with long-term
individual use rights (households) for clearly demarcated parcels. The advantage is that it
prevents land sale and speculation. The disadvantage of this option is that it tends to
discourage long-term capital investments and is also more likely to discourage soil and
water conservation practices with the potential for land degradation. Cooperatives, if not
managed properly, can be a mix blessing, providing opportunities for collusion and
corruption. In general terms, complete certified private ownership combined with full
rights has the highest likelihood to leverage inputs, conserve resources and increase
productivity. In addition, land “ownership” is viewed as an important element is
attaining social status in the community.
To prevent land speculation associated with this land tenure option, clear title
restrictions should be placed on the property, such as preventing the sale within a certain
(e.g. 30 year) period, and only permit use for the same land use type unless a specific
variance is provide by a planning authority and clearly reflected in the long-term
development plan. It is essential to have this guarantee in place in the form of local land
use plan to preserve agricultural land, promote the “compact community model” –
associated with the efficient delivery of services as successfully practiced in towns and
168
villages in some European countries, and improve the community infrastructure while
reducing per capita cost of service delivery.
6.6 Land Available for Distribution
Land to be distributed or redistributed shall primarily be agricultural land. It includes land
in excess of the regional maximum limit, absentee lands, but also "other state lands" (as
intended in Article 1 sub-article d of PP 224/1961). It is essential to provide updated
land inventories of these potentially available land categories for the target areas under
consideration.
The fundamental justice principle in agrarian reform that land be cultivated by the owners
and benefits are more evenly distributed (Article 10 of UUPA) has, according to BPN
research40, increased the number of new absentee owners. The notion of absentee land,
has become increasingly controversial in light of advancement in communication and
transportation technologies. Consideration should be given to replace the in-district
residential qualification with a distance qualification. In other words, it lack rationale to
disqualify land owners that live, for instance 5 km from their land but in a different
regency, while not disqualifying those who live for instance, 50 km away, but in the same
regency. This distance criterion should also be adapted to various parts of the country
because of the significant differences in regency size between Java and other provinces. It
would advisable to revise the national law to reflect this change, and indicate that
absentee land ownership is determined, in part on a distance function as defined by
regency land use plans, rather than use a standard criterion, country-wide. (Note: RI
Law excludes this distance requirement for land owners living “very close” or with “the
ability to cultivate efficiently”. This requirement is open to arbitrary interpretation and
will be a source of land disputes).
The definition of "absentee" shall also be revised with respect to the "proof of residency"
requirement. It should no longer be based merely on the identity card (KTP) issued by the
Ministry of Home Affairs, easily obtained or falsified, but it should be based on the
40 Parlindungan, 1982; Sumardjono, 1990, 2001; BPN Research and Development, 1991
169
primary residency location and time (.e.g. more than 50% of the 365 days per year) of the
certificate holder. For example, if someone spends 185 days in a year in a certain place,
this should be considered their residence. Also, no household should be able to claim
more then one principal residence for their agricultural land holdings.
As example, the State of West Bengal, India, has the following provisions concerning
absentee landownership:
a. The relevant person spends most of his time living in the area concerned,
b. The main income must be earned from the agricultural land concerned,
c. The distance between the relevant person's residence and land may not be
more than 8 km.
d. The land has not been abandoned for more than 3 years,
The first 3 provisions reinforce the principles of justice and self-cultivation. The last
requirement could be complied with by contracting cultivation with another party and
may, therefore, not be relevant.
Based on existing laws, the maximum land amount to be distributed to increase farm
sizes to 1 or 0.5 hectare is based on the population density. Land that can be used for land
reform includes the following:
a. Excess land (private ownership over the maximum limit that varies from
5-20 hectares, depending upon population density and cultivation type –
for sawah 5-15 hectares or for unirrigated or dryland cultivations 6-20
hectares) (note: private corporate land ownership is not permitted in
Indonesia, but corporations may receive use concessions (cultivation –
“erfpact” for agricultural use) or permits (for logging and mining).
b. Absentee Land (see discussion, above)
c. Former sovereign (“Princedom”) land
d. Land with Rights of Cultivation (HGU or “Erfpacht”), which have expired
and are not extended (typically plantation land)
e. Lands under the Rights of Cultivation which are not cultivated in
accordance with the allotment and purpose of rights granted

170
f. Lands under the Rights of Cultivation which are not cultivated and which
have used by the people for more than 10 (ten)
g. Land with total area larger than the area recorded in the relevant Rights of
Cultivation. (e.g recorded total may 100 hectares, whereas the actual
parcel may be 150 hectares. Consequently, 50 hectares would be
potentially available land distribution)
h. Lands under the Rights of Cultivation, voluntarily handed over by their
right holders.
i. Former village salary lands and other lands of the like set forth in the
conversion provisions of article VI of the UUPA
j. Former gogolan lands, particularly temporary gogolan, pekulen, sanggan
(these categories reflect use rights or “erfpacht” provided to local citizens
under the Dutch administration) and the like mentioned in the Conversion
provisions of article VII paragraph (3) of the UUPA
k. Communal lands, the rights of which have been waived by the customary
law communities.
l. Forest lands released by the forestry parties in accordance with the
applicable laws and regulations.
k. Communal lands, the rights of which have been released by the customary
law communities.
m. Naturally emerging lands
n. Lands other than the lands mentioned above, which will be further
confirmed by the Head of the National Land Agency
The lands complying with the provisions in item d through n shall also become
subject to land reform following the stipulation or confirmation under the provisions
of the applicable laws and regulations. This implies that land defined under d through
n will potentially be subject to land reform with further stipulation or confirmation by
BPN under the provisions of the applicable laws and regulations.
171
The village salary (tanah bengkok) identified under i), above can be considered a local
revenue source (from rent or products sold) and is used to pay compensation to local
officials. This land can also be a significant source for land reform.41 Such land may
constitute 10% or more of the cropland in Central and East Java, (or about 300,000 ha).
Here, tanah bengkok probably exists in a very large majority of villages, and such land is
usually of good quality and located near the village. A complete inventory of tanah
bengkok, cross-reference by administrative district and agro-ecological zone would
greatly assist in developing agrarian reform opportunities and priorities.
Compensation for the acquisition of this local land could be in the form of additional
national government support equal to the amount of local revenue lost and designated as
salaries for local officials. Payment could be in the form of annual government
compensation or in a lump sum deposited in a trust account and in the amount adequate
to generate equivalent annual income based on the average interest rate over the last 10
years. Existing lease holders should receive special consideration in terms of land
distribution or compensation for discontinuation of the lease arrangement.
Former village salary land can be used for land reform if the status of the village has
changed from village to sub-district as part of land transformation or redistricting
Gogolan land, particularly the temporary ones, pekulen, sanggan and the like (land for
which use rights – or “erfpacht” was provided to local officials under the Dutch
administration), can be uses if landowners transfer their rights to the state. This land can
then be redistributed to former holders of gogol, pekulen and sanggan.
One land category identified is “naturally emerging land”. This presumably, refers to land
formed by sedimentation in flood plains and coastal wetlands and becomes become state
land. While unsuitable for rural residential use, this land may be made productive using
reclamation techniques, including dikes and flood gates. Sources indicate that this flood
plain land is quite extensive and becomes subject to land disputes. It would very
41 See E. Rajagukguk, supra note, at pp. 271-72.

172
important to inventory land and evaluate its potential best land use, especially because
coastal wetlands are critical habitat for fish spawning and other ecosystem functions. If it
is decided which areas are suitable for cultivation, this lands can be subject to distribution
using the standard criteria.
Another land category is “lands which can be further confirmed by the Head of the
National Land Agency”. This is a vague category and that makes land subject to
acquisition by the Government or the Regional Government through the following
processes:
a. Acquisition of Lands for public purposes,
b. Regular trading,
c. Barter, and
d. Revocation of rights
To avoid controversy and potential land disputes, it would be advisable to clarify under
which circumstanced a “public taking”, as described under a) or d) would be justified and
permitted, and what compensatory arrangement should be made (e.g. land exchange,
financial compensation, etc.)
BPN documentation suggests the following on the parcel size of land to be redistributed,
depending upon the size of the land available and the number of qualified beneficiaries, a
minimum parcel size for dry lands as 200 m2, whereas for farms is 0.1 (1000 m2) Ha. The
argument is: …”The 200 m2 minimum limit for dry lands is based on the thought that the
received lands can be used as residence and yard for agriculture business purposes in the
context of increasing household revenues. The 1000 m2 or 0.1 Ha minimum limit is based
on the thought that the width of majority farmland possessions in Java has been below
2500 m2 (0.25 Ha), while there are a large number of communities having no land (43%
rural households)…”
And ….” If a landreform object is a plantation land with still productive plants, it shall
not be divided in its redistribution, instead, it shall be distributed for collective
possession: on behalf of joint ownership or in the name of a cooperative, where the

173
beneficiaries of land redistributions can form a cooperative to organize such plantation
(DAR, 1988). Similar is the condition for fish farm..”
6.7 Prototyping Land Utilization for Agrarian Reform
To reach as many poor households as possible (about 5 million households on Java) and
by taking into account the limited availability of lands for landreform, particularly on
Java. Prosterman and Mitchell42 suggest the land parcel size to be redistributed, as 300m2
for use as a residence (small house) and yard (“small plot” or pekarangan – homestead
garden plot – see also Chapter 2.6). The yard can be cultivated with plants that may
significantly contribute to nutrition, income, and social status of poor households in rural
areas. Yards that are intensively cultivated may contribute as much as 25% of the total
household income (Mitchell, Prosterman and Safik, 2004). As discussed in Chapter 2.6,
an integration of fruit trees, vegetables, livestock and fish farming has tremendous
potential to maximize household benefits on very small plots. It is suggested to set up
pilot schemes whereby innovative agro-forestry options, together with livestock and fish
farming are introduced at various parcel sizes, to systematically evaluate potential
household benefits. These pilot schemes should reflect the diverse agro-ecological
settings and opportunities, and local societal needs and preferences.
Potential of Pekarangan as Land Utilization Concept
Prosterman and Michell elaborated on the concept of land reform on Java and specifically
the potential role of pekarangan. They analyzed cropland figures and pekarangan (home-
and-garden land),43 referencing 5,132,000 ha of pekarangan in Indonesia, of which
1,736,000 ha are on Java.44
42 Prosterman, Roy and Mitchell, Robert (2002) Konsep Land reform di Jawa. Paper of Seminar “Rethinking Land Reform in Indonesia,” Jakarta, May 2002. 43 As indicated, the figures in sub-section (a) do not include land of agricultural estates, which occupy 16,543,000 ha in Indonesia, including only 620,000 ha on Java. 44 Statistical Yearbook of Indonesia 2000, Table 5.1.1.
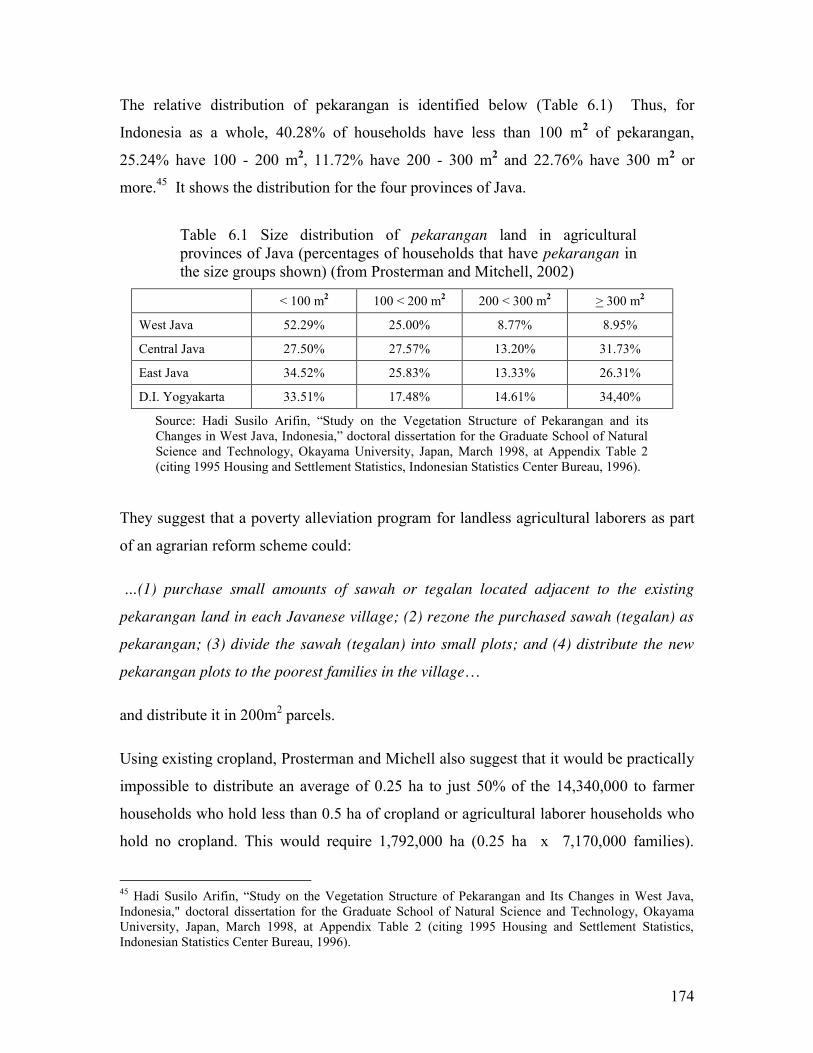
174
The relative distribution of pekarangan is identified below (Table 6.1) Thus, for
Indonesia as a whole, 40.28% of households have less than 100 m2 of pekarangan,
25.24% have 100 - 200 m2, 11.72% have 200 - 300 m2 and 22.76% have 300 m2 or
more.45 It shows the distribution for the four provinces of Java.
Table 6.1 Size distribution of pekarangan land in agricultural provinces of Java (percentages of households that have pekarangan in the size groups shown) (from Prosterman and Mitchell, 2002)
< 100 m2 100 < 200 m2 200 < 300 m2 > 300 m2
West Java 52.29% 25.00% 8.77% 8.95%
Central Java 27.50% 27.57% 13.20% 31.73%
East Java 34.52% 25.83% 13.33% 26.31%
D.I. Yogyakarta 33.51% 17.48% 14.61% 34,40%
Source: Hadi Susilo Arifin, “Study on the Vegetation Structure of Pekarangan and its Changes in West Java, Indonesia,” doctoral dissertation for the Graduate School of Natural Science and Technology, Okayama University, Japan, March 1998, at Appendix Table 2 (citing 1995 Housing and Settlement Statistics, Indonesian Statistics Center Bureau, 1996).
They suggest that a poverty alleviation program for landless agricultural laborers as part
of an agrarian reform scheme could:
…(1) purchase small amounts of sawah or tegalan located adjacent to the existing
pekarangan land in each Javanese village; (2) rezone the purchased sawah (tegalan) as
pekarangan; (3) divide the sawah (tegalan) into small plots; and (4) distribute the new
pekarangan plots to the poorest families in the village…
and distribute it in 200m2 parcels.
Using existing cropland, Prosterman and Michell also suggest that it would be practically
impossible to distribute an average of 0.25 ha to just 50% of the 14,340,000 to farmer
households who hold less than 0.5 ha of cropland or agricultural laborer households who
hold no cropland. This would require 1,792,000 ha (0.25 ha x 7,170,000 families).
45 Hadi Susilo Arifin, “Study on the Vegetation Structure of Pekarangan and Its Changes in West Java, Indonesia," doctoral dissertation for the Graduate School of Natural Science and Technology, Okayama University, Japan, March 1998, at Appendix Table 2 (citing 1995 Housing and Settlement Statistics, Indonesian Statistics Center Bureau, 1996).
175
However, with only 5,135,000 ha of cropland on all of Java, such redistribution would
require the government to redistribute 35% of all cropland on Java.
They propose that a program of poverty alleviation, targeting the most vulnerable part of
the population, could provide basic pekarangan to the poorest agricultural households on
Java using sawah (or tegalan) converted land to pekarangan and redistributes 0.03 ha
(300 m2) of pekarangan to the poorest 5 million households in rural Java. They cite that
research has shown that pekarangan produces 44% of total food calories, 32% of total
proteins and 65% of fuel consumed by rural households.46 If the land is instead used for
intensive production of grain, research has found that irrigated plots as large as 400 m2
can yield enough paddy rice to provide 40 - 60% of the basic yearly nutritional
requirements for a family of four persons.47
As such, they expect that the distribution of pekarangan plots to the landless could
produce enormous economic and social benefits, with modest land requirements. If 0.03
ha would be provided to 5 million households, it would only require 150,000 ha of land,
or only 3% of Java’s cropland. As example, they list the conversion of sawah to
pekarangan with the Government paying an average of Rp. 100 million (US $ 10,000) per
ha for sawah.48 The acquisition of 150,000 ha would cost approximately Rp. 15 trillion
(US $ 1.5 billion). If the Government implemented such a program over 5 years, the
annual cost for the land would be Rp. 3 trillion (US $ 300 million).
Under this plan, the cost of land per family benefited would be approximately Rp. 3
million (US $ 300), which is about 1/10th of per family, and lower than the cost of the
transmigration program. In addition, this scheme would require conversion of only 3%
of the total cropland (exclusive of agricultural estates) on Java.
46 Soemarwoto, supra note;; Leslie Brownrigg, “Home Gardening in International Development: What the Literature Shows, Including an Annotated Bibliography and Inventories of International Organizations Involved in Home Gardening Projects” (League for International Food Education, 1985) 47 William Thiesenhusen, Tim Hanstad, Robert Mitchell and Erman Rajagukguk, “Land Tenure Issues in Indonesia” (report for USAID, 1997) at 38 n. 66. 48 Based on BPN estimates and results of RDI April 2000 fieldwork in East and Central Java, the equivalent of $10,000 per ha is a reasonable price for sawah.

176
The following implementation principles (and reference notes in section 6.6) are provided by Prosterman and Mitchell49:
First, the land reform should give top priority to the poorest households, which are likely to be the seasonal agricultural laborer households that work for various farmers and have no permanent employment. In the earlier land reform, Article 8 of PP 224 of 1961 placed this class of agricultural family at the bottom of the priority list.
Second, the land should be distributed in small plots in order to benefit the maximum number of agricultural families. If the land reform described here were conducted on Java, it would potentially affect 75% of agricultural laborer families on Java.
Third, the Government should pay market value for the sawah (or tegalan) acquired for conversion into pekarangan. The land reform program to date has attempted to acquire land by paying less than market value, which has generated vigorous opposition to the reform.
Fourth, the Government must ensure that there is adequate financing for the land reform. To date, the State has not provided adequate financing for land reform, and the Government has paid for only a portion of the land acquired for redistribution.50
Fifth, as part of program monitoring and administration, the Government must ensure that it redistributes all land that it acquires.51
Sixth, the Government should not focus on excess land and absentee land, but should instead purchase land near the village. If necessary, the law can be amended to define the land reform as a “public purpose” so that the Government can acquire the sawah (or tegalan) by compulsion under the laws related to acquisition of land for public purposes. Because the new pekarangan should be located close to the existing village, the Government should acquire the sawah (tegalan) near the village. For this reason, it is not necessary to acquire such land only from excess owners or absentee owners. The Government should acquire the land located near the village, regardless of the identity of the owner or the size of the owner’s total landholding. (The authors if this report, however, suggest keeping a locally-adapted and maximum size limitations in effect to avoid the risk of land fragmentation and loss of associated economies-of-scale. It would be advisable to define a maximum holding size (excess land threshold) per household to meet the unique needs of targets communities and reflect the variety in land use
49 Excerpts and subsequent notes in this section from Prosterman, Mitchell and Safik, 2004, Land Policy Challenges in Indonesia: Final Project Report on the Land Law Initiative. RDI. 50 Although the 134,558 ha for which the Government paid is only 9% of the 1,470,690 ha acquired for redistribution in Indonesia (according to data of BPN Directorate of Land Arrangement and Land Tenure, March 2000), it is not clear how much of the total was acquired from landowners (as opposed to state land, former land of princes, etc.). 51 Of the 1,470,690 ha the Government acquired in the 1960’s, it apparently distributed only 850,000 ha, which is 58% of the total acquired. It is not clear how that undistributed land is being used today. Perhaps the Government has granted it to plantation companies under HGU, or perhaps state enterprises use the land.

177
population densities among provinces and regencies. The currently maxima defining “excess land” may be too broad to reflect this differences)
Seventh, the land reform program should be focused on Java because that is where the poorest agricultural households are most heavily concentrated. As noted above, if the land reform program distributed pekarangan plots to 5 million agricultural families in Java, it could benefit three-quarters of Javanese agricultural laborer families.52 Five million families would represent approximately six times the 816,000 households on Java that benefited from the previous land reform. (underlining by the authors of this report)
Eighth, the land reform program must be streamlined to avoid unnecessary processes and approvals. In the earlier land reform program, there were at least 15 institutions that had to approve applications to receive land, which indicates an enormously wasteful process.53
Ninth, the land reform program must be carefully monitored through independent sample surveys and Rapid Rural Appraisal interviews54 to ensure that it meets the program’s specific goals. In this kind of program, and to the extent that any donor agency provides financing, it is entirely possible to use the funding only as the program actually achieves results. According to this approach, the financing should be released on a “progress payments” basis as monitoring confirms that the program has achieved each increment of progress in distributing land to families who are in the intended beneficiary group.55
52 This assumes that all, or almost all, of the beneficiaries are agricultural laborer families. 53 E. Rajagukguk, supra note, at page 94. 54 In Rapid Rural Appraisal (RRA) interviews, rural interviewees are not responding to a questionnaire, but actively participate in a semi-structured interview. The researchers use a checklist of issues as a basis for questions, not necessarily addressing all questions in each interview and sometimes departing from the basic questions to pursue interesting, unexpected, or new information. 55 The Government could perhaps consider a second approach for distributing new pekarangan land, which would be a “universal” distribution of additional pekarangan land to rural families. Under this approach, the Government would distribute new pekarangan plots averaging perhaps 200 m2 to all, or nearly all, rural households on Java. Such an approach would take into account several additional factors that might make it a viable alternative to the program just described:
(1) This approach would eliminate the necessity of ensuring that an approach targeted to a smaller number of families -- for example, the “5 million” suggested above -- actually reached the poorest households and that the benefits were not diverted or “intercepted” by families who were wealthier or more powerful.
(2) This approach would take into account the fact that pekarangan can provide unique nutritional and ecological functions even for households that are somewhat better off, but that most of the essential open area of even medium-sized pekarangan plots has been lost in recent years due to widespread fragmentation through inheritance. Such fragmentation leads to building multiple houses on what had been a single parcel of pekarangan. See Hadi Susilo Arifin, supra note 45, at p. 85.
(3)Virtually by definition, such a program would reach all of the rural poor on Java.
If the Government were to distribute pekarangan to all 17.3 million agricultural households on Java, the program would require 346,000 ha (200 m2 x 17,300,000 families). This would represent about 6.7% of the cropland on Java. While this would require more land and would be more expensive than the
178
6.8 Procedures for Land Acquisition
It is essential to identify the type of land (land qualities and potential) in the context of
regional and local (population) needs and program goals and objectives. This requires:
(a) an inventory and evaluation of land available, including the agro-ecological zone
properties, a general assessment of land capability, followed by a (socio-economic)
suitability assessment using the land utilization types under consideration;
(b) potential obligatory public reporting (distribution of public notices and public
meetings defining the land eligibility criteria as locally relevant, with compensation
schemes and timelines); and
(c) engaging landowners to seek voluntary cooperation and compliance of all parties
involved, including individuals, corporation, customary law communities, regional
governments, and relevant agencies and ministries in the forestry, agricultural sector and
mining sector.
Inventories should be conducted for broad target areas (selected based on socio-economic
and cultural/political considerations) and include, topography, soils (agro-ecology),
hydrology, current land cover/use and cadastral and land registration data converted to
digital form, as relevant for the program to be conducted, and may be referenced by
Village/Sub-district Committee-level. If such map sources are unavailable, detailed
parcel sketch should be made to show the relative position of each land parcel. A land
evaluation framework with objective analytical protocols (including exclusionary and
suitability criteria) should be developed and implemented, resulting in a decision-support
system for program implementation. These activities are not covered under existing
government regulations (e.g. No. 224/1961) and will require dedicated BPN and
cooperating agency funding and staff training.
Draft Government Regulations include the provision of obligatory reporting by
landowners, and should be finalized into law. Failure to comply can be verified by the alternative described in sub-section (a), it is possible that such increased costs would be outweighed by the popular support for a universal distribution. Such a program would require approximately Rp. 34.6 trillion (US $ 3.46 billion) for purchase of land, or about Rp. 7 trillion a year if the Government carried out the program over 5 years. Cost of land per family benefited would be about Rp. 2 million (US $200).

179
spatial information collected and should be enforced at the risk of significant penalty. The
provision for data collecting and its associated need and protocols should be included in
the law and reflected into institutional mandates and funding. The Draft Government
Regulation that includes provisions concerning “voluntary landreform”;; the opportunity
for farmland owners (individual or corporate), customary law communities, regional
governments, and relevant agencies such as in the Forestry sector make land available for
agrarian reform to BPN or the Regency/Municipal Committee, should also be included in
Government Regulation No. 224/1961 or other laws an regulations.
6.9 Some Final Issues
A successful agrarian reform project requires a solid political and financial commitment.
First of all it will require that the needs and potential socio-economic benefits are clearly
articulated and conveyed to the legislature, media and the public, at large. Final
agreement and decisions needs to be reached on program goal and objectives, priority
targets (populations and geographic regions), timelines, institutional mandates and
resource allocations.
Key program elements that need additional and specific articulation, a well-structured legal framework and implementation steps and timelines include:
Formulation of overall mandates, financing and program budget allocation at the National agency, Regional and Local levels
Identification of goals and priorities associated with agrarian reform initiatives an beneficiaries by province and regency
Monitoring and evaluation procedures Prioritization and identification of potential land types and qualities to be
acquired for agrarian reform Identification of the process, funding sources (potential cost-sharing with
recipient and administrative districts) and allocations, and mechanisms for acquiring land for distribution
Objective and transparent land distribution, registration and certification protocols, including specific tenure and land rights (and sales restriction) associated with individual land parcels
Objective and transparent oversight (Agrarian Reform Committee and Review and Arbitration Board, and administrative protocols and appeals)
Mobilization of cost efficient inputs, including micro credit, and value-added linkages (role of farmers cooperation, community and marketing organizations)
180
Addressing implied land use planning and economic development Defining geographic priorities over time – and incremental funding scenarios Restructured, focused and transparent legal framework of applicable laws and
regulations Identification of relevant socioeconomic, cultural and political constraints
Identification of relevant socioeconomic, cultural and political constraints
================================

181
APPENDICES
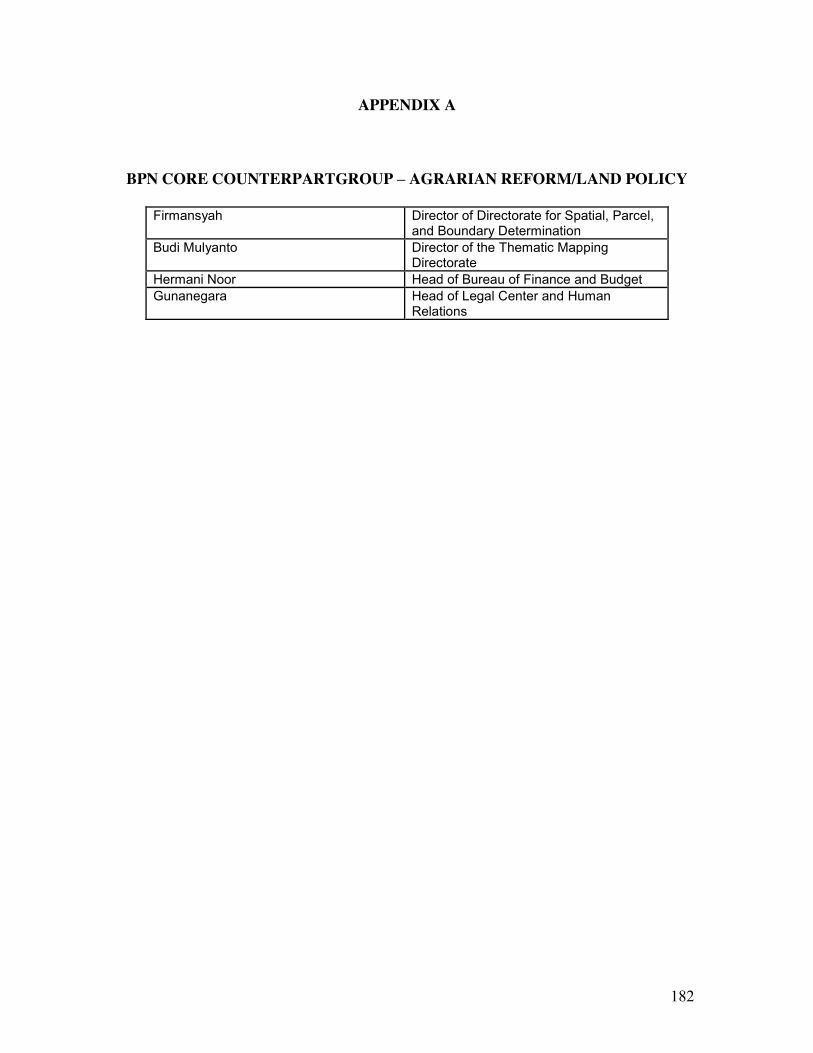
182
APPENDIX A
BPN CORE COUNTERPARTGROUP – AGRARIAN REFORM/LAND POLICY
Firmansyah Director of Directorate for Spatial, Parcel, and Boundary Determination
Budi Mulyanto Director of the Thematic Mapping Directorate
Hermani Noor Head of Bureau of Finance and Budget Gunanegara Head of Legal Center and Human
Relations

183
APPENDIX B
Asian Development Bank Meeting - 18 May 2009
Name Institution Phone number email Naning Mardiniah ADB 081584006015 [email protected] William Collier ELAF Project 0816803526 [email protected] Doli Siregar ELAF Project 0811982951 [email protected] Gerhardus Schultink MSU (1)517-353-1903 [email protected] Akhmad Safik LMPDP/BPN 0818759452 [email protected]

184
APPENDIX C
List of Attendees BPN Needs Assessment Meeting, 19 May 2009
Name Title and Institution Bambang Eko HN Land Registration and Land Rights
Deputy Firmansyah Director of the Determination of
Spatial and Land Border Directorate Budi Mulyanto Director of the Thematic map
Directorate Hermani Noor Head of Bureau of Finance and
Budget Gunanegara Head of Legal Center and Human
Relation Ruslan Director of Policy and Program
Stipulation Control Sukesi S. Widosari Head of Training and Education
Center Rukhyat Noor Head of Data and Information Center Sri Maharani Head of Land Consolidation
Directorate Pelopor Head of International Relation and
Affairs Gunawan Muhammad Head of Organization and Procedures Herman Hidayat Head of Protocol Division Sudjarno Head of Sub-Directorate of
Ownership Rights, HGB and HGU Djoned Yulianto Head of Sub-Directorate of Land
Rights Boundaries Rolly Akis Head of Sub-Directorate of Land
Parcel Information System Ronny Kusuma Yudistiro Head of Sub-Directorate of Spatial
Use Rights and Water Resources Rudi Rubijaya Head of Sub-Directorate of Land
Availability and Management Trias Wiriahadi Head of Sub-Directorate of Land
Inventory and Land Reform Data Made Ngurah Priatna Head of Sub-Directorate of Land
Policy Control Program Husaini Head of Sub-Directorate People
Group Dispute Suyus Windiyana Head of Data System and Land
Information Division

185
Nurhidayat Head of Laws and Regulations Hotman Saragih Head of Plan, Evaluation, and
Reporting Division Gerhardus Schultink Advisor BPN Akhmad Safik Project Assistant
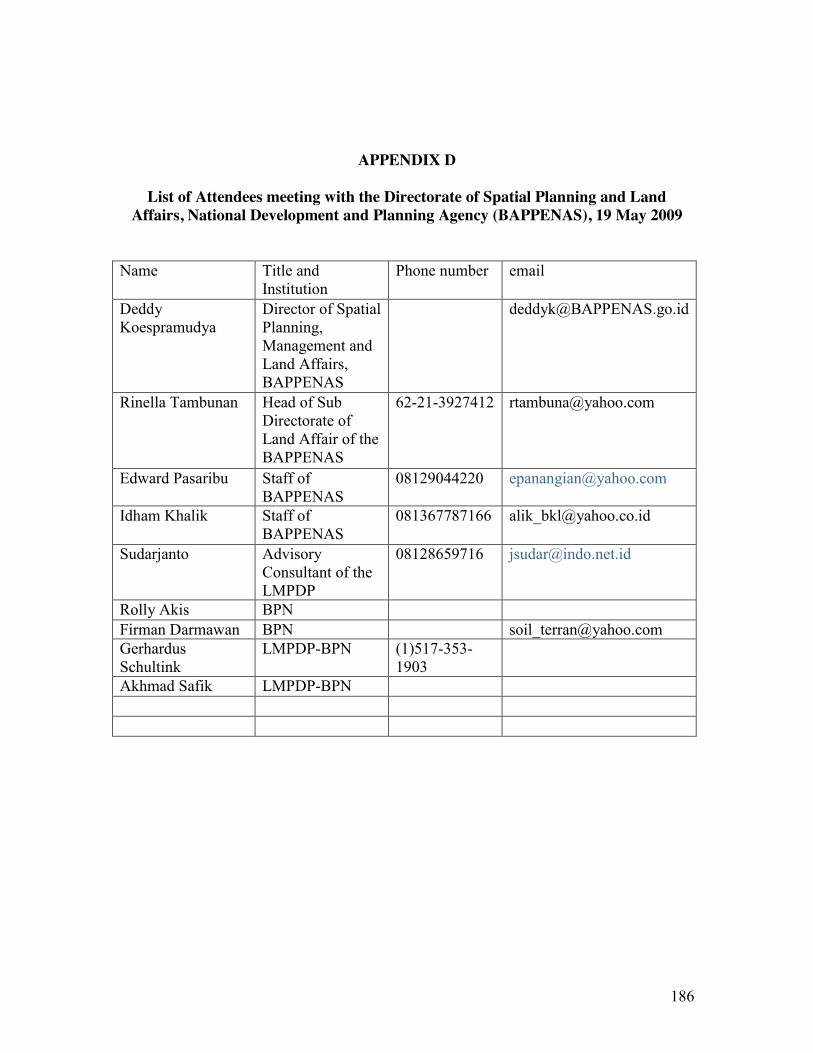
186
APPENDIX D
List of Attendees meeting with the Directorate of Spatial Planning and Land Affairs, National Development and Planning Agency (BAPPENAS), 19 May 2009
Name Title and
Institution Phone number email
Deddy Koespramudya
Director of Spatial Planning, Management and Land Affairs, BAPPENAS
Rinella Tambunan Head of Sub Directorate of Land Affair of the BAPPENAS
62-21-3927412 [email protected]
Edward Pasaribu Staff of BAPPENAS
08129044220 [email protected]
Idham Khalik Staff of BAPPENAS
081367787166 [email protected]
Sudarjanto Advisory Consultant of the LMPDP
08128659716 [email protected]
Rolly Akis BPN Firman Darmawan BPN [email protected] Gerhardus Schultink
LMPDP-BPN (1)517-353-1903
Akhmad Safik LMPDP-BPN

187
APPENDIX E
Work Schedule
No Item Due Date Obligation
1 Draft Inception Report End of May Proposed Research Framework; proposed Schedule of Assignment; proposed location of research; brief initial study of current policy and key issues/problem related to land policy;
2 Initiative Meeting (Discussion of Draft Inception Report) 2x First Week June Minute of Meeting consists of inputs from BPN and other stakeholders
3 Inception Report Mid-July Agreed research framework, schedule of assignment, and location of research; and detail key issues/problems related to land policy
4 Draft Interim Report August Week 2 a) Analysis of existing RI policies affecting agrarian reform issues based on literature study, field research, and personal discussion, in particular national policies, sector policies, and required cross-institutional cooperation that related to land. The analysis should result in the drafting of a concise and comprehensive review of current status and policies directions for the future; b) Comparative study of land policy from other countries; c) Proposed steps to solve key issues/problems related to land policy;
5 Discussion of Draft Interim Report 2x August Week 3 Minute of Meeting consists of inputs from BPN and other stakeholders
6 Interim Report Mid September Agreed draft interim report 7 Draft Final Report Early November a) formulation of coherent and
comprehensive guidelines and strategies for implementing the agrarian reform policy b) Operational proposal for a related NLA-RI Strategic Plan and Land Information System (LIS) in particular on agrarian reform c). Plan and implementation capacity building programs to strengthen technical capacity in related area.
8 Focus Group Discussion of Draft Final Report 3x Mid-End November Minute of Meeting consists of inputs from BPN and other stakeholders
9 Workshop of draft final report (if any) Early December Expose of Draft Final Report to related stakeholders
10 Final Report Mid December Agreed final report
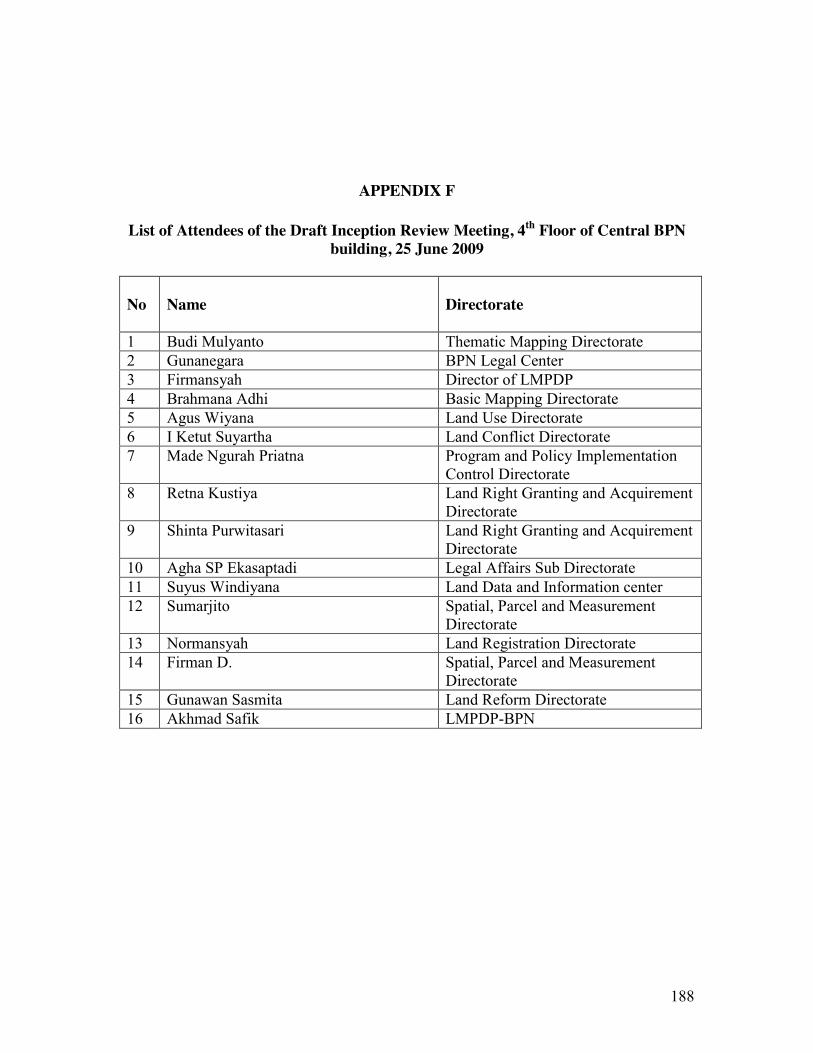
188
APPENDIX F
List of Attendees of the Draft Inception Review Meeting, 4th Floor of Central BPN building, 25 June 2009
No
Name
Directorate
1 Budi Mulyanto Thematic Mapping Directorate 2 Gunanegara BPN Legal Center 3 Firmansyah Director of LMPDP 4 Brahmana Adhi Basic Mapping Directorate 5 Agus Wiyana Land Use Directorate 6 I Ketut Suyartha Land Conflict Directorate 7 Made Ngurah Priatna Program and Policy Implementation
Control Directorate 8 Retna Kustiya Land Right Granting and Acquirement
Directorate 9 Shinta Purwitasari Land Right Granting and Acquirement
Directorate 10 Agha SP Ekasaptadi Legal Affairs Sub Directorate 11 Suyus Windiyana Land Data and Information center 12 Sumarjito Spatial, Parcel and Measurement
Directorate 13 Normansyah Land Registration Directorate 14 Firman D. Spatial, Parcel and Measurement
Directorate 15 Gunawan Sasmita Land Reform Directorate 16 Akhmad Safik LMPDP-BPN

189
APPENDIX G
Prioritization of Land Policy Administrative Issues as Identified in Qualitative BPN Staff Survey and Informal Feedback
Strategic issues identified by BPN staff for consideration in an Agrarian Reform program include: The still relatively low number of land parcels registered (while registration number
increase, so do the number of parcels) Continued inequality among Indonesian peoples on land access, land ownership,
including issues associated with land utilization and land use planning Many large scale areas with long-term land rights are neglected by the right holders A continued high number of land disputes Very limited regions for which detailed maps, including topographic base map,
thematic maps (such as up-to-date land cover/use maps) , land value maps, and suitability maps exist
Disharmony among laws and regulations related to land affairs and policy Limited access by people in remote areas to affordable land services The need for additional BPN staff training, staff recruitment and improvement of
information infrastructure to upgrade the institutional capacity to meet public demand
The role and need of regional economic development linked to land suitability and the regional comparative advantage (based on natural assets) and needs (based on population densities) to be addressed by regional economic development plans
The continued transformation of highly productive agricultural land such as rice paddy to non-agricultural uses (estimated as 3 million hectares as a result of the implementation of current regional plans)
The need to move from a basic regulatory framework to an action-oriented framework that included pro-active land use planning and land managment that harmonizes socio-economic and ecological sustainability
The need for dedicated specialists on land rights issues to assist in effective dispute resolution
The installation of electronic archival capacity to record, centralize and preserve land records
Further studies on the impact of land certification on family prosperity

190
APPENDIX H
Recent BPN Agrarian Reform Projects
No Kabupaten/ Province
Number of Land Distribu-ted (parcels)
Total Area of Land Distri-buted (Ha)
Number of Beneficia-ries (households
Types of Access Reform
Types of Land Distribu-ted
Notes
01 Purbalingga / Central Java Surakarta/Central Java
300 -
45.7432 2,300
300 -
- Slum area improvement
Former Land reform object (1960es) of former perdikan village -
Rural agrarian reform Urban agrarian reform
02 Blitar/East Java 12,001 1,919.46 7261 Community Development - road impr. - cooperative -animal husbandry
Former land reform object
Rural agrarian reform (in cooperation with regional govt and regional develop. Bank
03 Central and South Lampung /Lampung
6,300 3,905.76 5,708 -cooperative farming, farm management -private sector partnership -financing
- In cooperation with Univ. of Lampung, Bank, State Plantation company, etc.
04 Asahan/North Sumatra
- 568 355 - - Deliberation between corp. and farmer mediated by BPN
05 Karangasem/Bali - 444.121 322 Irrigation development (embung – water reservoir) -farming cooperative, financing
- -
06 Kolaka/South East Sulawesi South Konawe/South East Sulawesi
2088 799
3,759.61 1,979.1
- -
Partnership between people and private sector -
- -
- -
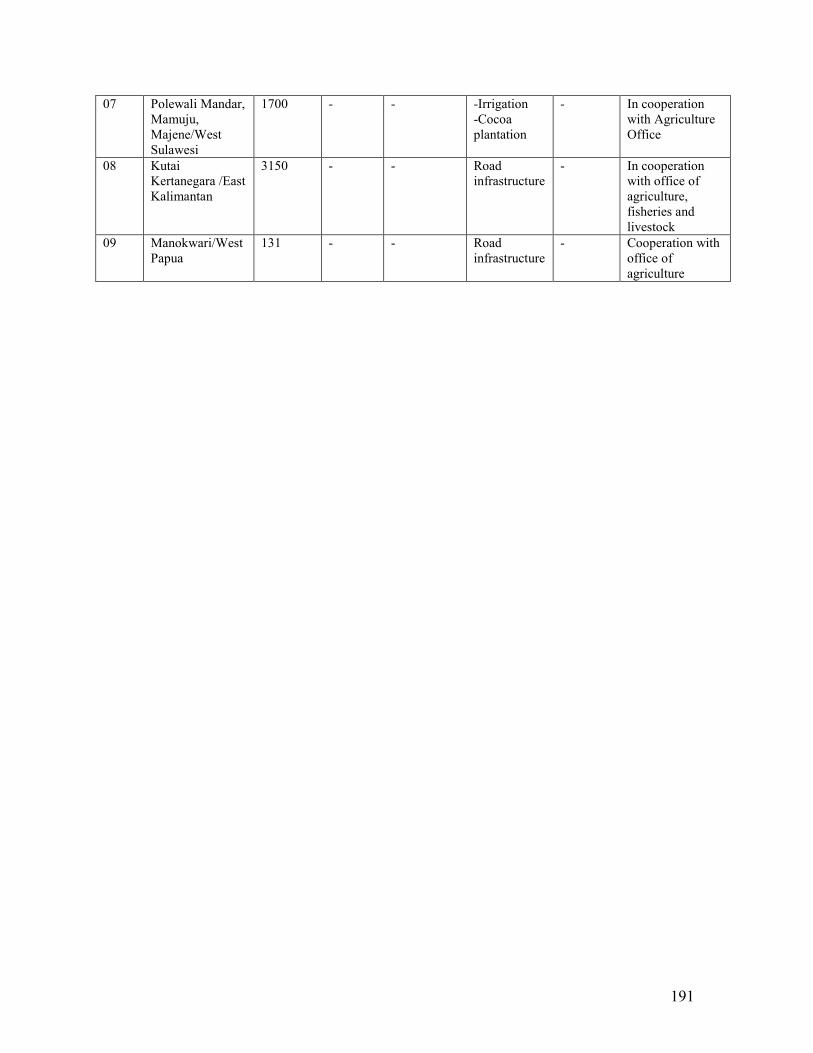
191
07 Polewali Mandar, Mamuju, Majene/West Sulawesi
1700 - - -Irrigation -Cocoa plantation
- In cooperation with Agriculture Office
08 Kutai Kertanegara /East Kalimantan
3150 - - Road infrastructure
- In cooperation with office of agriculture, fisheries and livestock
09 Manokwari/West Papua
131 - - Road infrastructure
- Cooperation with office of agriculture

192
APPENDIX I
Case Study Survey on Recent Land Reform Initiatives, including Land Sources, Recipients and Aspects of Implementation on Java, South Sumatra,
Sulawesi (Celebes), and Kalimantan (Borneo).
The components below were identified to guide informal interviews with BPN staff, local officials and beneficiaries of land titling programs in the
limited time available. These interviews and major observations are summarized in Appendix K
COMPONENT 1 Evaluate the sources and types of land in actual and potential agrarian reform projects (the objects) and its direct beneficiaries (agrarian land reform recipients) Objective: Collect information regarding a) the types of land used for agrarian
reform, b) the issue of acquiring new land for agrarian reform, and c) the process used to identify and select agrarian reform beneficiaries
Interviewees: Central, Provincial and Regency Land Office identification of categories of agrarian reform beneficiaries to receive land, identification of potential sources of land to be acquired for agrarian reform, description of the process of acquiring and distributing land.
Who should receive land in agrarian land reform (all farmers, very small
farmers, agricultural workers, other poor families)? What size plots should families receive (commercial size farms, small
pekarangan plots, other)? What type of land should the Government distribute in agrarian reform
program (expired HGU, abandoned land, excess land, absentee land, privately owned land near village), and what compensation should the Government pay for such land (market value, standard value based on national average value of type of land, other)?
How much in total should the Government spend to acquire land and administer an agrarian reform program (in other words, how many families should benefit and at what cost per family)?
What are the typical crops grown and which other crops (include fruits and vegetables) would be considered

193
What is the minimum number of families that should be part of an agrarian land reform program to allow for cooperative input purchase, sharing farm machinery, processing and marketing
Should the recipient families pay for the land they receive? Should the recipient families be forbidden to transfer the land for some
period? Is feasible to provide communal land title distribute land use rights to
households or individuals? Who should hold the land title or use rights? The head of household, the
man and wife? How should the title be transferred to the next generation? (father to oldest
son, mother to oldest daughter, shared among children (resulting in shared ownership and cultivation rights on smaller parcels)
COMPONENT 2
Evaluation of BPN capacity to organize and implement agrarian land reform Objective: Collect information regarding capacity of BPN and any other related
government agencies to conduct agrarian reform program Interviewees: Central, Provincial and Kabupaten land office and other land related
agency officials.
Jurisdiction/area of authority of office Number of office staff, Expertise/areas of focus for office staff (e.g., legal staff, land valuation experts,
surveyors, etc.) Prioritization among activities/duties Budget/resources for various duties/activities of office Budget for agrarian reform program Agrarian Reform Project
BPN attitude toward the current agrarian reform program to this area
o Is project of interest to BPN? o Does BPN office have sufficient staff and equipment? o Which resources are lacking?
Who will participate in the agrarian reform committee (or other structure) that decides which families receive land in each province/kabupaten/village?
Which level of Government should administer the agrarian reform program, and how can the agrarian reform program be streamlined to minimize delay and cost of administration?
Who will monitor the agrarian reform program to ensure that goals are met? Which criteria will be used in this process? What is the expected impact of agrarian reform program on rural economic
development?

194
COMPONENT 3
Evaluate implementation of access to capital for agrarian reform program (access reform) Objective: Collect information regarding actual and potential sources for financing
the agrarian reform program to cultivate the distributed land Interviewees: Kabupaten Land Office, NGO and farmers
Where does farmer obtain credit (formal or informal sources)? What are the prevailing interest rates for both sources and terms? Is collateral being used – if so, what type? If farmer has a land certificate, has he or she mortgaged that land? Is access to credit available? Source: Individual/Bank/Public or all Are alternative income sources available or typical? If credit is available, are there investment opportunities to diversify income
sources? Are inputs readily accessible when financing is available? (seed, fertilizer,
chemicals, etc.) Access to technical advice – effective extension service support? Is there market access for cash crops? (means of transportation, etc) Has farmer had experience dealing with the local banks? If so, for what services? Would farmer seek credit using land certificate as collateral? If so, from which source(s)? individual / commercial bank / government sources What would be acceptable terms for a loan to pay for inputs (typical amount,
interest rate, repayment schedule)? Would farmer be willing to risk foreclosure? Would farmer be willing to borrow money to pay for land certification
o If so, how much would he or she be willing to pay for the certificate? o If not, why not?
How many urban land certificates issued by the office in last year? How many rural land certificates issued in the last year? Are these numbers similar to prior years or increasing/decreasing? Has farmer had any dealings with BPN? If so, how was the experience?

195
APPENDIX J
List of Attendees of the Draft Inception Review Meeting, 3th Floor of Central BPN, September 4, 2009
No
Name
Directorate
1 Irawan Sumarto Basic mapping directorate 2 Nurhidayat BPN legal center 3 Firmansyah Director of LMPDP 4 Gede Ariyuda Land right determination and
regulatory directorate 5 Anyawangan K Dj State land, neglected land and
marginal land management directorate
6 Djoned Julianto Spatial, parcel and measurement directorate
7 Hersubeno Land conflict directorate 8 Hermani Noor Head of BPN finance bureau 9 Peter Laarakker LMPDP consultant 10 Normansyah Land registration directorate 11 Trias Wiriahadi Land reform directorate 12 Akhmad Safik LMPDP Consultant 13 Agustin Samosir LMPDP-BPN 14 Denisanto LMPDP-BPN 15 Firmansyah Darmawan Spatial, Parcel and Measurement
Directorate 16 Arif Suhattanto Spatial, Parcel and Measurement
Directorate 17 Isa Suryo Astanto Spatial, Parcel and Measurement
Directorate 18 Reza Widya Satria Spatial, Parcel and Measurement
Directorate

196
APPENDIX K
List of Attendees of the Draft Final Report Review Meeting, in 3th Floor of Central BPN, December 4th, 2009 No
Name
Directorate
1 Risnarto Chairman of BPN Center for Research and Development
2 Eka Sukma Staff Director of LMPDP 3 Firmansyah Director of LMPDP 4 Rolly Akis UPK LMPDP 5 Syafwan Salbi Land reform directorate 6 Sumardjito Spatial, parcel and measurement
directorate 7 Fatimah Land conflict directorate 8 Hermani Noor Head of BPN finance bureau 9 Suyus Windiana BPN Center for Data and Information 10 Normansyah Land registration directorate 11 Tansri PTIP Directorate 12 Embun Sari PPHT Directorate 13 Akhmad Safik LMPDP Consultant 14 Denisanto LMPDP-BPN 15 Pelopor BPN Planning Directorate 16 Suardi Land reform directorate 17 Agus Susmiyanto Spatial, Parcel and Measurement
Directorate 18 Reza Widya Satria Spatial, Parcel and Measurement
Directorate

197
APPENDIX L
CASE STUDIES ON RECENT LAND DISTRIBUTION PROJECTS
During the summer of 2009, the team visited various project sites (see this appendix). The visits included interviews with BPN staff, local officials and beneficiaries of the land certification programs. The purpose of these visits was to identify the relative success of programs and identify potential improvements for future initiatives. Major observations and recommendations include:
A need to establish clear records and maps on existing and potential land available for distribution and certification
Agrarian reform has largely been a certification of land distributed in the 1960s, occupied subsequently, and somewhat limited in scope and impact
New and systematic agrarian reform initiatives are needed, combined with comprehensive access reform
Consider designing a program based on systematic and transparent guidelines for the identification and prioritization of available land for distribution and clearly articulated selection criteria for beneficiaries
Consider (temporary) sales restrictions on recently certified real estate properties to prevent or reduce land speculation
Access reform should include formalized procedures and focused technical assistance related to micro-financing, input procurement, farm management, processing and marketing
Technical assistance should be considered to help organize effective farmer’s cooperatives with subsidies including start-up capital for micro loans, cultivation and value-chain development
Niche markets for cottage industries should be explored and developed
Homestead gardens (Pekarangan) should be explored as integrated and supplemental farming systems, including agro-forestry, livestock and fish ponds to provide additional income and nutritional benefits to marginal farmers

198
Combine tax records and parcel descriptions (land survey) into one data base to facilitate property valuation, tax collection, land certification and land market transactions.

199
The Agrarian Reform Program in Bogor Regency Bogor regency is one of the regencies within West Java Province. The total area of
Bogor regency is 2.301,95 Sq Km, consisting of 40 sub districts (kecamatan), and 427
villages (desa/kelurahan). According to the Bogor Demography Office, in 2008 the
population of the Bogor regency was 4,215,436 million people, consisting of 2,163,853
males and 2,051,583 females with a population density is 2,388.93/sq km. Main income
sources are agriculture and fisheries (2,758,821 people), mining (197,059 people),
industry (39,412), electricity, gas and water resources (3,941 people), building
construction (236,470 people), trade (94,117 people), and services (114,294 people).
Figure K-1: Map of Bogor Regency The land use distribution in the Bogor Regency is as follows:
1. Mixed garden (kebun campuran) : 84,766 Hectares
2. Rice field (sawah) : 55.348 Hectares

200
3. Dryland (tegalan) : 26,673 Hectares
4. Forest (hutan) : 45,355 Hectares
5. Housing/settlement : 20,843 Hectares
6. Plantation : 17,521 Hectares
7. Dry rice field (tadah hujan) : 10,547 Hectares
8. Similar types of forest land : 10,225 Hectares
9. Other : 1,000 Hectares
Implementation of Agrarian Reform Program The Bogor Regency Land Office in cooperation with the Regional Government of Bogor
Regency conducted an agrarian reform program in Jasinga Sub District (kecamatan) in
2007. The program distributed 2,426 Hectares of HGU land to local farmers, private
companies, the Regional Government of Bogor Regency, village administration, research
and development sites managed by BPN, and former plantation laborers. All land
distributed has been registered and certified. The total land certificates issued for the
distribution are 7,000 parcels - divided among 5,900 farmers or land user/cultivators -
and 93 land parcels to others (see above).
The land distributed to the farmers of Jasinga was expired HGU land that was formerly
owned by a private plantation company, PT. PP Jasinga. The total area of HGU land was
2,426.9279 Hectares, covering 10 villages of the Jasinga sub district. The 10 villages
include: Jasinga, Pamagersari, Koleang, Pangradin, Curug, Setu, Tegalwangi, Jugalaya,
Sipak and Kalong Sawah. The distance from the ex HGU land to the capital city of Bogor
Regency is about 57 km or a 2-hour drive. Main use of HGU land was as a, still
productive, rubber plantation. Other commodities include palm oil, mixed garden
vegetables, dryland crops, dryland rice field (sawah tadah hujan). A small part is used for
housing.
Jasinga Plantation was founded in 1923 with the cultivation of land as tanah partikelir
(private land), in the same year converted to Erfpacht right (heriditary use right) and
Eigendom No. 110-127 and Eigendom right verpanding No. 3092-3097 and 3214 in total

201
area of 3,326.05 Hectares that was initially managed by N.V. Cultuur Maatschappij
Djasinga and finally managed by the company, Fa. Watie & Co, whose office was in
Jakarta. Afterwhile, PT PP London Sumatera controlled the HGU land while the
cultivation and utilization of land managed by the PT. PP Jasinga that was established
under Notary deed of Mr. R. Kardiman No. 57 dated March 29, 1962, approved by
Minister of Justice No. JA 5/114/2 dated September 27, 1962.
The HGU use right of the plantation expired in 1978. PT PP Jasinga changed its name
into PT Jasinga Estate and proposed an extention of the HGU land rights and received
extension approval under the the Stipulation Letter No. 57/HGU/DA/1978, terminating in
in 1998, with the total area of land of 2,426.90 Hectares. This was at the same time when
the Indonesian financial crisis affected the Indonesian economy, and followed by an
abdication of the Soeharto Presidency on May 21, 1998. At that time, the situation was
politically and economically unstable. Especially, as reflected in mass rioting in several
cities throughout the country around May 15, 1998. Indonesia seemed to be in a power
vaccum in the transition period between the fall of the Soeharto adminstration and the
new Presidency of Habibie that had yet to settle in on a new administration.
In many provinces, the end of the Soeharto administartion was welcomed and followed
by the occupation and “reclaiming” of many plantations by farmers who had been
waiting for decades to take back what they considered “family land”, illegally occupied
by plantation companies, government or other legal entities. According to the former
head of Setu village, the process of agrarian reform in Jasinga took several years. It was
started by the heads and people from ten villages whose territory was part of the
plantation area. It mobilized a people movement that sought to occupy and reclaim land
taken many years ago.
The process started with group meetings and discussions. Letters with requests were send
to the Regent of the Bogor Regency, indicating that an association of people and farmers
from ten villages of the Jasinga sub district asked for the distribution of HGU land owned
by PT. PP Jasinga to the people who had occupied the HGU land since it HGU right

202
expired in 1998. A response to the first letters to the Regent was not received. Subsequent
requests finally were approved by the Regent, especially after the Bogor Land Office
decided to implement an agrarian reform program. The former head of Setu Village
indicated that the approval process was far from easy. While the petitioners were waiting
a response from the regent, they organized a mass rally at the office of the Bogor regency
to exert political pressure and seek public awareness and involvement.
.
The group also met many times with the management of PT. PP Jasinga. Those meetings
were very productive and resulted in the two parties reaching agreements, as follows:
1. Agreement between PT. PP Jasinga, represented by Mr. Boch R. Sersansi and the
head of Koleang village (Mr. Sadeli represented the people of ten villages) to release 86 Hectares of HGU land to be redistributed to land users (penggarap) from Koleang village.
2. MOU between PT. PP Jasinga and representatives of ten villages in the Jasinga sub district about cooperation to utilize part of HGU land managed by PT. PP Jasinga.
3. Based of a land survey of state land of ex HGU land of PT. PP Jasinga by the West Java Land Office in 2001, 419.3185 Hectares of the HGU land was to be redistributed to people of ten villages of Jasinga sub district.
4. Written approval by the Director PT. PP Jasinga dated January 28, 2002, representated by Drs. HE Syukur Alwan, for the cultivation of ex HGU land of PT. PP Jasinga by people of the ten villages with a total area of 537.6777 Hectares.
5. Written approval on January 4, 2003 to release land rights by PT. PP Jasinga and provide 1.5 hectares of ex HGU land for a Setu village market.
6. Written approval by Mr. H. Tb. Adjenar Arifin, SE on behalf of PT. PP Jasinga dated January 29, 2003, indicating that the area of ex HGU land would be extended to 1,350.4147 Hectares, permitting people to cultivate 537.67777 Hectares, and agreeing in principle to transfer land ownership to the people.
7. Minutes of meetings dated May 12 and 18, 2005 stating that PT. PP Jasinga in principle did not object to the occupation and utilization by people of 419.3185 Hectares and 537.6777 hectares, respectively.
The agreements reached are summarized in the following table :

203
Table K-1. Location of ex HGU land distributed to users in the ten villages of Jasinga
Village56
Total area of released land (ex HGU land) /Hectares Phase 1 Phase 2 Phase 3 Total Area (Ha)
Number of land user
Area (Ha)
Number of land user
Area (Ha)
Number of land user
Area (Ha)
Number of land user
Koleang 63.2667 200 86 268 72.7367 132 222.0034
600
Curug 131.7129
374 - - 125.000 382 256.7129
756
Tegalwangi 25.6122 294 - - 120.00 219 145.6122
513
Jugalaya 102.7776
50 - - 35.00 490 137.7776
640
Setu 7.1348 39 1.5 - 35.508 321 42.6428 460 Sipak 11.2048 91 - - 44.00 309 55.2048 400 Pangradin 28.2888 170 - - 42.00 430 70.2888 600 Jasinga 12.4587 102 - - 37.433 149 49.8917 251 Pamagarsari 21.3550 90 - - 16.000 160 37.355 250 Kalongsawah
15.5000 55 - - 10.000 38 25.500 93
Total 419,3115
1,665 87.5
268 537.6777
2.630 1,044.4892
4,563
56 The actual number of land users determined after field identification. Phase 1, 2 and 3 were the consensus phase on land transfer between PT. PP Jasinga and the people of then ten villages.
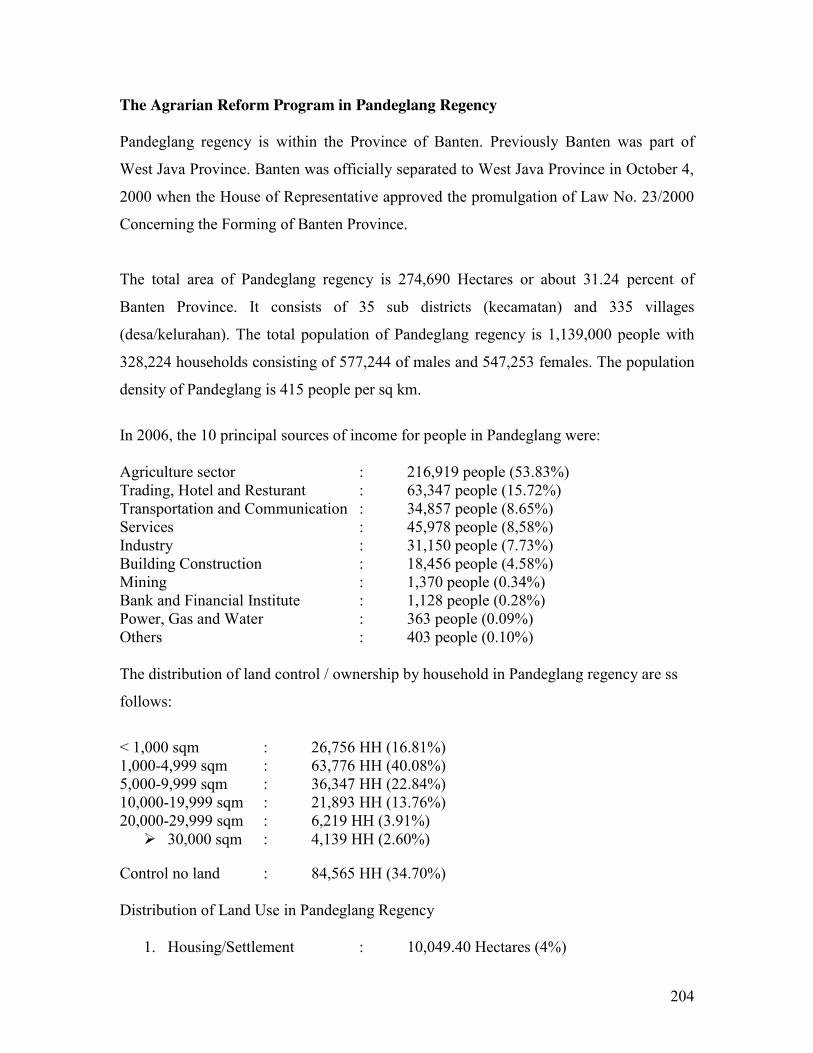
204
The Agrarian Reform Program in Pandeglang Regency Pandeglang regency is within the Province of Banten. Previously Banten was part of
West Java Province. Banten was officially separated to West Java Province in October 4,
2000 when the House of Representative approved the promulgation of Law No. 23/2000
Concerning the Forming of Banten Province.
The total area of Pandeglang regency is 274,690 Hectares or about 31.24 percent of
Banten Province. It consists of 35 sub districts (kecamatan) and 335 villages
(desa/kelurahan). The total population of Pandeglang regency is 1,139,000 people with
328,224 households consisting of 577,244 of males and 547,253 females. The population
density of Pandeglang is 415 people per sq km.
In 2006, the 10 principal sources of income for people in Pandeglang were: Agriculture sector : 216,919 people (53.83%) Trading, Hotel and Resturant : 63,347 people (15.72%) Transportation and Communication : 34,857 people (8.65%) Services : 45,978 people (8,58%) Industry : 31,150 people (7.73%) Building Construction : 18,456 people (4.58%) Mining : 1,370 people (0.34%) Bank and Financial Institute : 1,128 people (0.28%) Power, Gas and Water : 363 people (0.09%) Others : 403 people (0.10%) The distribution of land control / ownership by household in Pandeglang regency are ss
follows:
< 1,000 sqm : 26,756 HH (16.81%) 1,000-4,999 sqm : 63,776 HH (40.08%) 5,000-9,999 sqm : 36,347 HH (22.84%) 10,000-19,999 sqm : 21,893 HH (13.76%) 20,000-29,999 sqm : 6,219 HH (3.91%) 30,000 sqm : 4,139 HH (2.60%)
Control no land : 84,565 HH (34.70%) Distribution of Land Use in Pandeglang Regency
1. Housing/Settlement : 10,049.40 Hectares (4%)
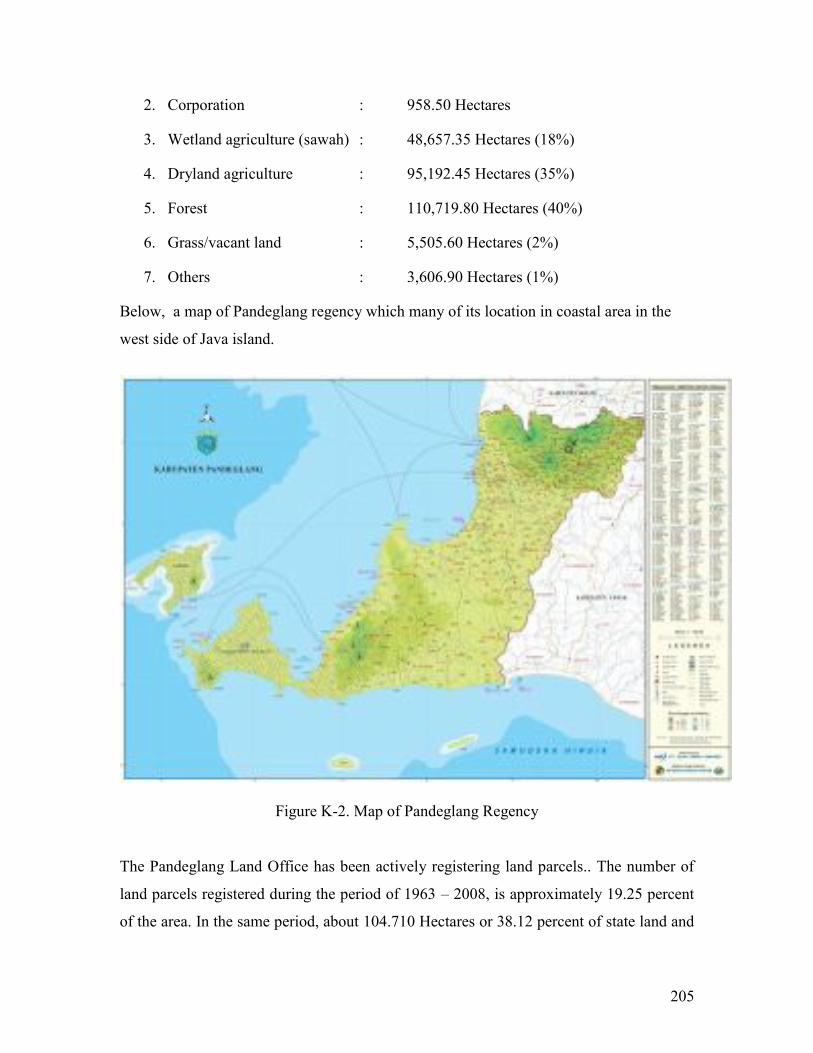
205
2. Corporation : 958.50 Hectares
3. Wetland agriculture (sawah) : 48,657.35 Hectares (18%)
4. Dryland agriculture : 95,192.45 Hectares (35%)
5. Forest : 110,719.80 Hectares (40%)
6. Grass/vacant land : 5,505.60 Hectares (2%)
7. Others : 3,606.90 Hectares (1%)
Below, a map of Pandeglang regency which many of its location in coastal area in the
west side of Java island.
Figure K-2. Map of Pandeglang Regency The Pandeglang Land Office has been actively registering land parcels.. The number of
land parcels registered during the period of 1963 – 2008, is approximately 19.25 percent
of the area. In the same period, about 104.710 Hectares or 38.12 percent of state land and

206
former adat land had not been registered. Table 2 below, describes the land registration
accomplishment of Pandeglang Land Office in the last 45 years.
Table K-2. Total Registration of land rights in Pandeglang 1963-2008 No. Type of Land Rights Number of land
parcel Size (Sq m)
1 Ownership Right (Hak Milik) 64,755 357,139,233
2 Building Use Right (HGB) 3,053 32,533,967
3 Use right (Hak Pakai) 746 23,566,632
4 Management right (HPL) 1 50,000
5 Cultivation Use Right (HGU) 54 115,543,192
Total 68,609 528,833,024 Source: Pandeglang Land Office 2009
Pandeglang is one of the most active agrarian reform regencies (kabupaten) in Indonesia.
The source of land is originally from the land reform program in 1960s. As such, most
land that has been certified was already occupied by the beneficiaries and their families
or had been transferred to others. This evidence can be found in the records of the
Pandeglang Land Office that describes generally the size and location of existing or
potential land. Existing maps are limited in their usefulness for the identification of land
parcels. The table below lists the total area of existing and potential land for agrarian
reform.
Table K-3. List of Size and Location of the Existing and Potential Agrarian Reform Land in Pandeglang 2008
No.
Site/Location
Total Area (Hectares)
Sub District/Kecamatan
Village 1. Labuan Ranca Teurup 1.8800 Labuan 0.2175
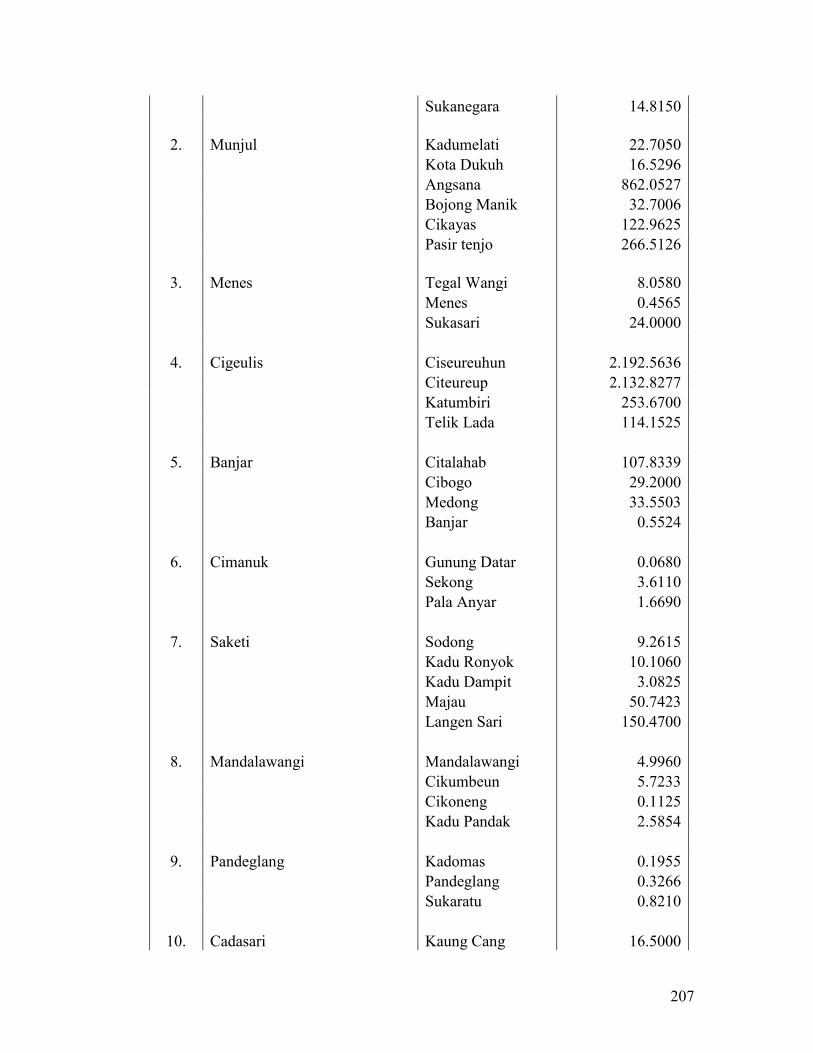
207
Sukanegara 14.8150 2. Munjul Kadumelati 22.7050 Kota Dukuh 16.5296 Angsana 862.0527 Bojong Manik 32.7006 Cikayas 122.9625 Pasir tenjo 266.5126 3. Menes Tegal Wangi 8.0580 Menes 0.4565 Sukasari 24.0000 4. Cigeulis Ciseureuhun 2.192.5636 Citeureup 2.132.8277 Katumbiri 253.6700 Telik Lada 114.1525 5. Banjar Citalahab 107.8339 Cibogo 29.2000 Medong 33.5503 Banjar 0.5524 6. Cimanuk Gunung Datar 0.0680 Sekong 3.6110 Pala Anyar 1.6690 7. Saketi Sodong 9.2615 Kadu Ronyok 10.1060
Kadu Dampit 3.0825 Majau 50.7423 Langen Sari 150.4700
8. Mandalawangi Mandalawangi 4.9960 Cikumbeun 5.7233 Cikoneng 0.1125 Kadu Pandak 2.5854
9. Pandeglang Kadomas 0.1955 Pandeglang 0.3266 Sukaratu 0.8210
10. Cadasari Kaung Cang 16.5000
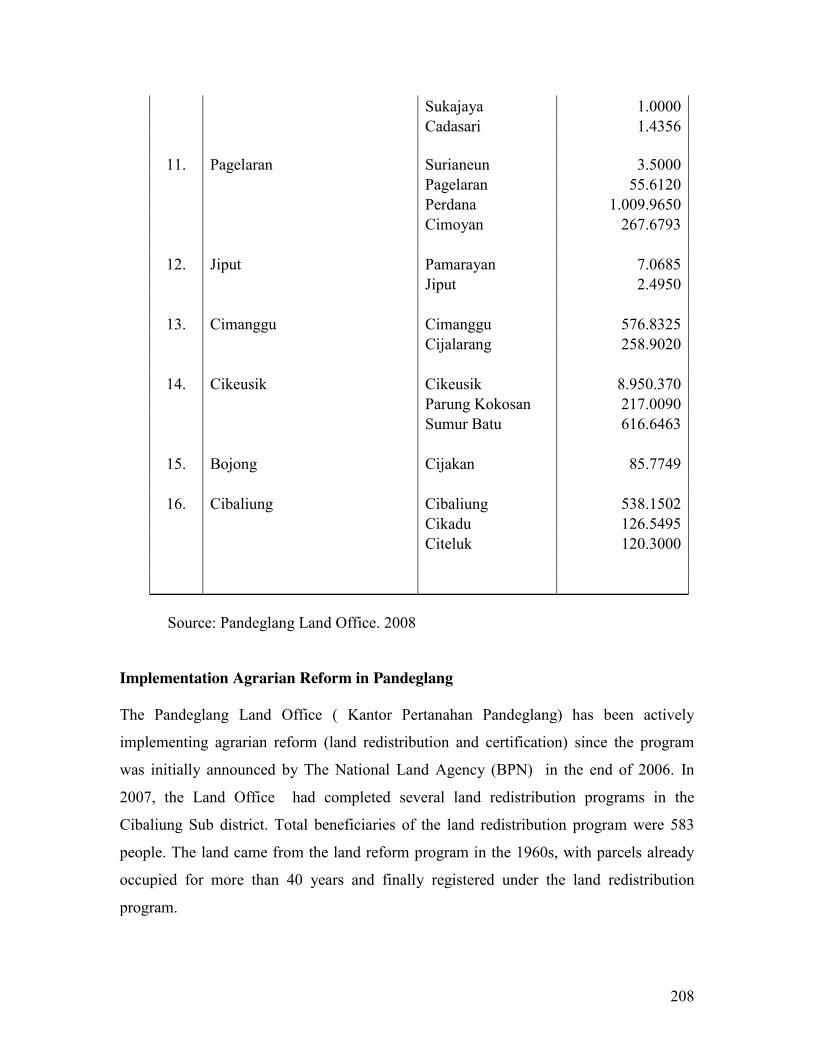
208
Sukajaya 1.0000 Cadasari 1.4356
11. Pagelaran Surianeun 3.5000 Pagelaran 55.6120 Perdana 1.009.9650 Cimoyan 267.6793
12. Jiput Pamarayan 7.0685 Jiput 2.4950
13. Cimanggu Cimanggu 576.8325 Cijalarang 258.9020
14. Cikeusik Cikeusik 8.950.370 Parung Kokosan 217.0090 Sumur Batu 616.6463
15. Bojong Cijakan 85.7749
16. Cibaliung Cibaliung 538.1502 Cikadu 126.5495 Citeluk 120.3000
Source: Pandeglang Land Office. 2008
Implementation Agrarian Reform in Pandeglang The Pandeglang Land Office ( Kantor Pertanahan Pandeglang) has been actively
implementing agrarian reform (land redistribution and certification) since the program
was initially announced by The National Land Agency (BPN) in the end of 2006. In
2007, the Land Office had completed several land redistribution programs in the
Cibaliung Sub district. Total beneficiaries of the land redistribution program were 583
people. The land came from the land reform program in the 1960s, with parcels already
occupied for more than 40 years and finally registered under the land redistribution
program.
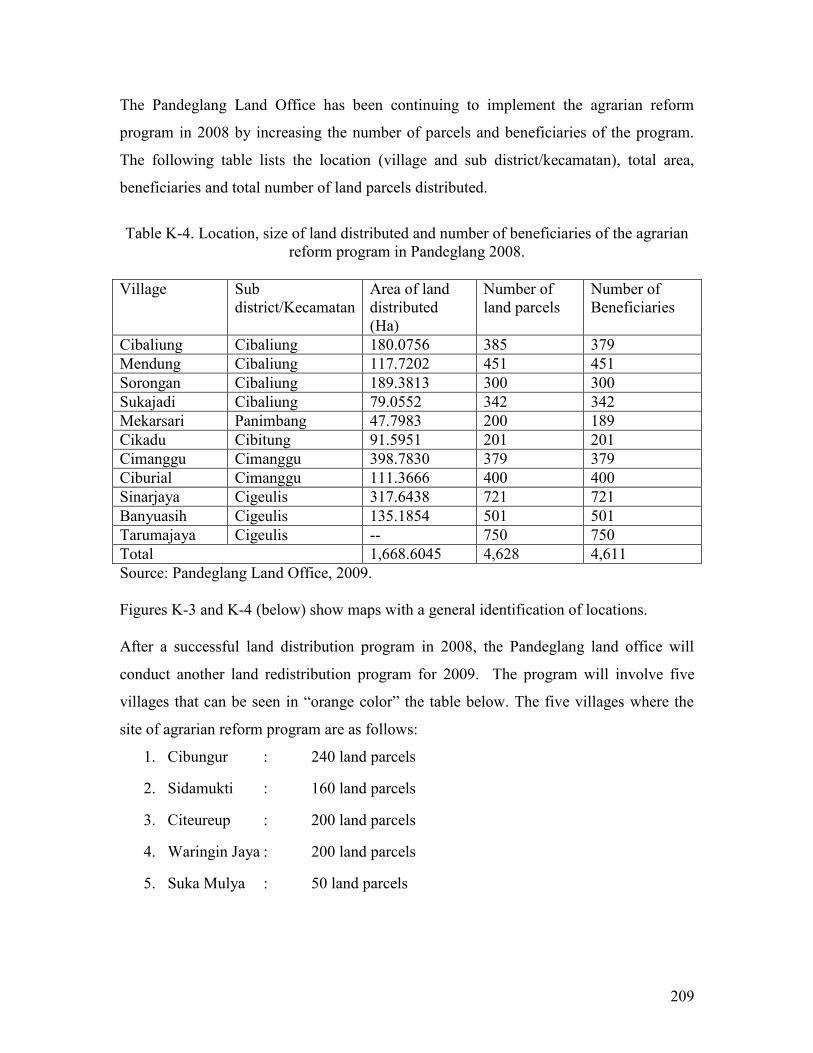
209
The Pandeglang Land Office has been continuing to implement the agrarian reform
program in 2008 by increasing the number of parcels and beneficiaries of the program.
The following table lists the location (village and sub district/kecamatan), total area,
beneficiaries and total number of land parcels distributed.
Table K-4. Location, size of land distributed and number of beneficiaries of the agrarian
reform program in Pandeglang 2008. Village Sub
district/Kecamatan Area of land distributed (Ha)
Number of land parcels
Number of Beneficiaries
Cibaliung Cibaliung 180.0756 385 379 Mendung Cibaliung 117.7202 451 451 Sorongan Cibaliung 189.3813 300 300 Sukajadi Cibaliung 79.0552 342 342 Mekarsari Panimbang 47.7983 200 189 Cikadu Cibitung 91.5951 201 201 Cimanggu Cimanggu 398.7830 379 379 Ciburial Cimanggu 111.3666 400 400 Sinarjaya Cigeulis 317.6438 721 721 Banyuasih Cigeulis 135.1854 501 501 Tarumajaya Cigeulis -- 750 750 Total 1,668.6045 4,628 4,611 Source: Pandeglang Land Office, 2009. Figures K-3 and K-4 (below) show maps with a general identification of locations. After a successful land distribution program in 2008, the Pandeglang land office will
conduct another land redistribution program for 2009. The program will involve five
villages that can be seen in “orange color” the table below. The five villages where the
site of agrarian reform program are as follows:
1. Cibungur : 240 land parcels
2. Sidamukti : 160 land parcels
3. Citeureup : 200 land parcels
4. Waringin Jaya : 200 land parcels
5. Suka Mulya : 50 land parcels
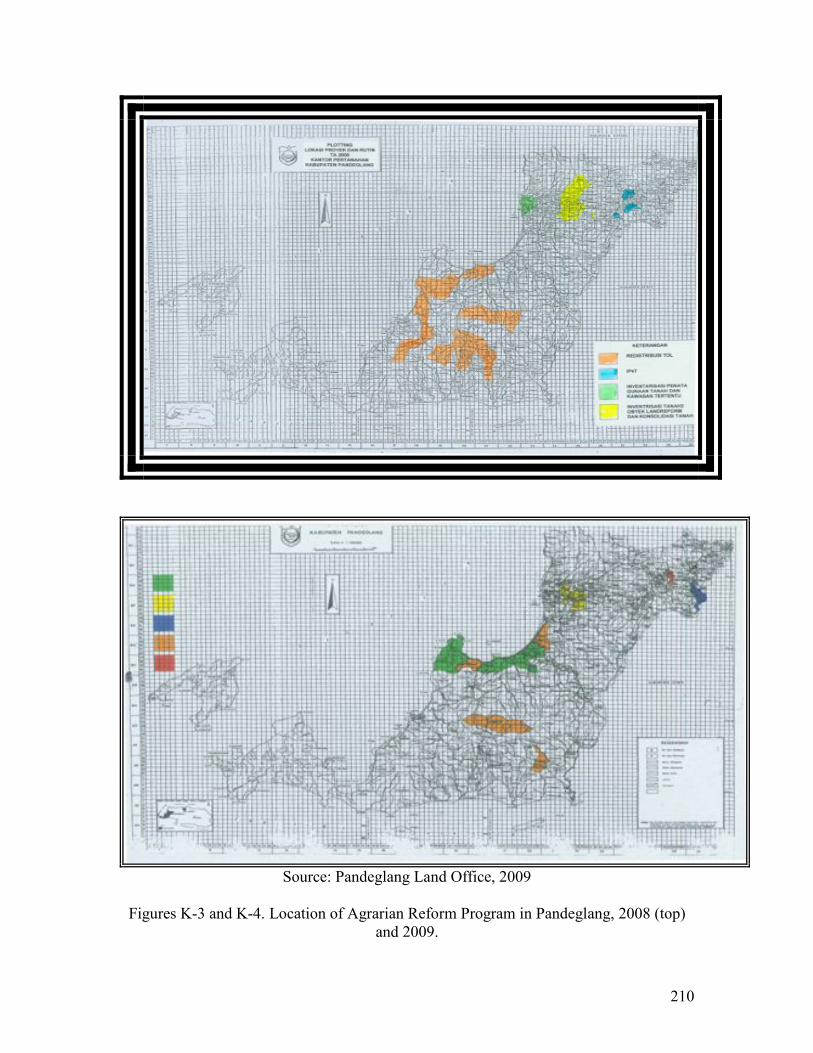
210
Source: Pandeglang Land Office, 2009
Figures K-3 and K-4. Location of Agrarian Reform Program in Pandeglang, 2008 (top)
and 2009.

211
Types of Land in Agrarian Reform The existing regulation on land reform, Government Regulation No. 226 Year 1961,
determines several types of land for distribution. The five types of land are: absentee
land, excess land, “partikelir” land (private land), ex princely land (tanah bekas
swapraja), and other state’s land.
Under this regulation, the Pandeglang land office has identified the land subject to land
reform (certification) and distributed since the land reform program in 1960s, by
examining any existing records in the Land office. After this, land surveys are conducted
and parcels with measurements are recorded in the office. Further verification includes
description of location, boundary, existing use, adjacent land, etc. At the same time, the
office also verifies the legal status of the land title and the existence of previous title
transfers and potential claims. After all necessary verification, the land is registered and a
certificate of ownership is issued. This program, in fact, by its certification process,
legalizes the land distribution (reform) and associated land ownership carried out in the
1960s.
Existing Use and Size of Distributed Land One of the agrarian reform objectives is to increase the productivity of the agriculture
sector. Currently, the production orientation of the agrarian reform program is still
relevant and must be reemphasized further to attain its major goals. Furthermore, the
agrarian reform program should define and implement the detail arrangements of a land
reform program including the source of land and its beneficiaries. The National Land
Agency has added important goals for the agrarian reform program, including the
alleviation poverty and reducing unemployment in Indonesia. These additional objectives
will change the design (land sources and qualifying beneficiaries) of the future programs.
The current implementation of agrarian reform in Pandeglang does not provide a clear
definition of the qualifications of the recipients and the desired utilization of land.
Findings also indicate that the primary type of land selected for distribution and
certification varied in the absence of a clear definition by the Land Office. Many

212
beneficiaries are not really farmers. They may represent various professions and sectors
and still can be certified as land owners. As example, the land certified includes various
land uses in 2008:
1. Housing
2. Wetland (sawah/rice field)
3. Garden (kebun)
4. Pekarangan (Home garden)
5. Farming
6. Dry land.
Parcel sizes distributed are quite variable. The maximum size is about 2 hectares and the
minimum size is between 100 sq m – 200 sq m. The number of land parcel distributed
and registered for each family or person under the agrarian reform program various from
1-2. One is typical.
Access Reform After land distribution and registration, access to financial and technical assistance needs
to be provided. Without such assistance there is doubt that recipients can utilize the land
to effectively improve their livelihood, long-term. In that case, they are likely sell the
land to others and use the money for consumptive rather than productive purposes.
The National Land Agency anticipated the lack of financial and technical capacity and
encouraged some ministries and private companies or banks to assist land reform
recipients to utilize their land more productively. To address this need, the Pandeglang
land office also coordinates with the Regional Government of Pandeglang Regency and
related institutions, ministries such as the office of agriculture, office of cooperative and
banking industries to help the beneficiaries of agrarian reform. This includes the
facilitation of agreements and cooperation between the beneficiaries and any financial
and technical assistance sources.
The Pandeglang land office in cooperation with the regional government of Pandeglang
had been working on a national program on plantation, agriculture, forestry and fisheries,

213
since 2008. The program is financed by the central government and seeks to revitalize
existing programs. related to plantations, agriculture, forestry and fisheries. Various
decrees are passed for this purpose: a) Decree of the Regent of Pandeglang Regency No.
522/KEP.22-HUK/2008 Concerning the forming of an Advisory Team on Plantation
Development, involving the head of the Pandeglang land office as member, b) Decree of
the Regent of Pandeglang Regency No. 522/KEP.24-HUK/2008 Concerning Authority
Delegation to the Head of Plantation and Forestry Office of Pandeglang to Determine
Farmer recipients for Assistance of the Revitalization Program, and c) Decree of Head of
Plantation and Forestry Office No. 525/246/HUTBUN/2008 Concerning the Forming of
Technical Team on Plantation Development in Pandeglang, that includes the head of the
Land Office as team member. This opportunity was used by the Head of Land Office to
combine the revitalization program with the agrarian reform program.
The revitalization program provides financial assistance (soft loans) in an amount of IDR
20 Millions to participants who own about 1 Hectare of land and qualify for other
requirements as determined by the revitalization team. Since one of the requirements
includes a land certificate it gives the Pandeglang land office an opportunity to connect
the revitalization program with agrarian reform. Two villages were selected to be part of
the revitalization program and the agrarian reform program. Those villages are
Tarumanegara and Sinarjaya village of the Cigeulis Sub District (kecamatan).
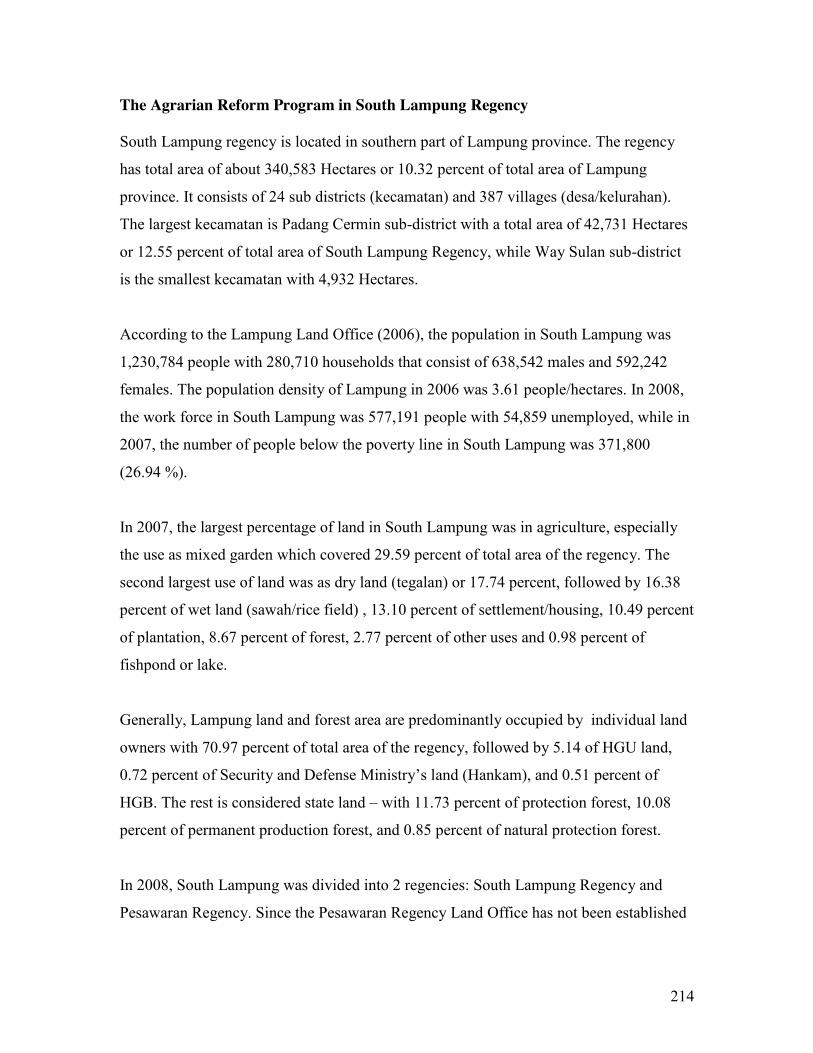
214
The Agrarian Reform Program in South Lampung Regency South Lampung regency is located in southern part of Lampung province. The regency
has total area of about 340,583 Hectares or 10.32 percent of total area of Lampung
province. It consists of 24 sub districts (kecamatan) and 387 villages (desa/kelurahan).
The largest kecamatan is Padang Cermin sub-district with a total area of 42,731 Hectares
or 12.55 percent of total area of South Lampung Regency, while Way Sulan sub-district
is the smallest kecamatan with 4,932 Hectares.
According to the Lampung Land Office (2006), the population in South Lampung was
1,230,784 people with 280,710 households that consist of 638,542 males and 592,242
females. The population density of Lampung in 2006 was 3.61 people/hectares. In 2008,
the work force in South Lampung was 577,191 people with 54,859 unemployed, while in
2007, the number of people below the poverty line in South Lampung was 371,800
(26.94 %).
In 2007, the largest percentage of land in South Lampung was in agriculture, especially
the use as mixed garden which covered 29.59 percent of total area of the regency. The
second largest use of land was as dry land (tegalan) or 17.74 percent, followed by 16.38
percent of wet land (sawah/rice field) , 13.10 percent of settlement/housing, 10.49 percent
of plantation, 8.67 percent of forest, 2.77 percent of other uses and 0.98 percent of
fishpond or lake.
Generally, Lampung land and forest area are predominantly occupied by individual land
owners with 70.97 percent of total area of the regency, followed by 5.14 of HGU land,
0.72 percent of Security and Defense Ministry’s land (Hankam), and 0.51 percent of
HGB. The rest is considered state land – with 11.73 percent of protection forest, 10.08
percent of permanent production forest, and 0.85 percent of natural protection forest.
In 2008, South Lampung was divided into 2 regencies: South Lampung Regency and
Pesawaran Regency. Since the Pesawaran Regency Land Office has not been established
215
until the end of 2008, all activities of Pesawaran Land Office was still managed under
South Lampung Land Office.
Implementation of Agrarian Reform Program South Lampung Regency has many potential land sources for agrarian reform. According
to data collected in 2007, there are 25,563 hectares of potential land originating from the
conversion of forest land. The regency also includes land from the land reform program
in 1960s. Currently, only 9,360 hectares are available for formal distribution although the
land is currently occupied.
In 2007, South Lampung Regency Land Office redistributed (certified) 4,984 land parcels
divided into 1761 land parcels to people in Pesawaran Indah village and 3223 land
parcels in Wates Way Ratai village.The majority of these people are farmers who till the
land and control on the average 0.3052 hectare in Pesawaran Indah and 0.5718 hectare in
Wates Way Ratai. The main commodities are coconut, cocoa, and coffee.
In 2008, South Lampung continued the certification even though some villages that
previously were located inside South Lampung became territory of new Pesawaran
Regency. The following table summarizes this program (Table K-5):
Table K-5. List of Land Distribution in Pesawaran Regency, 2008
No. Village Beneficiaries Number of Certificates
Number of Pekarangan
Number of Farm
Size (sq m)
1 BABAKAN LOA 605 1,000 217 536 3,166,091
2 BUNUT 481 650 181 469 2,962,507
3 BUNUT SEBERANG 508 700 219 481 2,979,871
4 GUNUNG REJO 1,022 1,300 840 460 3,190,882

216
5 HARAPAN JAYA 768 1,100 308 792 5,995,636
6 PAYA 246 347 112 235 1,490,137
7 PESAWARAN INDAH 676 737 132 605 3,840,053
8 SINAR HARAPAN 692 1,000 51 307 2,327,195
9 SUMBER JAYA 713 900 495 405 3,747,130
10 WAY URANG 257 353 116 237 1,531,690
11 WATES WAY RATAI 389 500 385 115 832,548
Source: Lampung Province Land Office, 2009. The principal two land uses are cash cropping (commodities such as coffee, cocoa,
coconut, etc.) and second, as pekarangan (home garden).
Access Reform To follow up the land distribution (certification) program, the South Lampung Land Office helped organize and coordinate an access reform for beneficiaries by inviting stakeholders in land affairs in Lampung such as the Regional Government of South Lampung Regency and other institutions/agencies to assist in the following activities:
1. Institutional Access: The land office encouraged farmer in the area of agrarian reform program to form informal farmer groups and associations. This resulted in the establishment of 2 farmer group in South Lampung in 2007
2. Access to Farming Business: Farmers or group of farmer were assisted by the University of Lampung and PT Garuda Food Putra Putri Jaya to develop and improve their technical capacity in farming system manament.
3. Access to Technology: This was facilitated by inviting several stakeholders like the Agricultural Technology Assessment Agency (BPTP), University of Lampung and the Research Center for Cocoa from Jember, East Java.
4. Access to Capital: The Land office invited several banks, like the Bank of Indonesia, Niaga Bank, , Syariah BNI Bank and Syariah Mandiri Bank to meet farmers.
5. Access to Markets: The Land Office encourages land owners to cooperate with PT. Sinar Laju Abadi, PT GGLC and PT. Garuda Food Putra Putri Jaya.

217
Figure 5. Map of South Lampung Regency (Source: Lampung Province Land Office, 2009)
The Agrarian Reform Program in Central Lampung Central Lampung is one of the regencies in Lampung Province with a strategic regional
location and possibly the highest economic potential given its position between the inland
region and the city in South Sumatra Island. Total area of Central Lampung is 4789.82 sq
km that consist of 28 sub districts (kecamatan) and 293 villages
(desa/kampong/kelurahan).
The people of Central Lampung can be divided into indigenous people (Kebuain Abung
Siwo Migo and Pubian communities) and migrants from many areas of Indonesia. The

218
majority of Lampung’s people came from Java Island. According to the Lampung Land
Office (2008), the population in Central Lampung was 1,160,221 people, consisting of
593,746 males and 566,475 females. The population density of Central Lampung in 2008
was 242 people/sq km. In 2008, work force in Central Lampung was 540,678 people with
27,795 people unemployed with 263,000 people (22.06 %) below the poverty line.
Implementation of Agrarian Reform Central Lampung Regency has also many potential land sources. According to BPN data
collected in 2007, there were 15,347 potential hectares originating from forest
conversion. The regency has also land from the land reform program in 1960s.
Currently, only 1,384 hectares are available for distribution (certification) although the
land is occupied.
In 2007, Central Lampung Regency Land Office redistributed 1316 land parcels divided
into 800 land parcels for people in Sidorejo village and 516 land parcels in Sidodadi
village.In 2008, the Central Lampung Regency distributed agrarian reform object in
several villages as follows :
No. Village Beneficiaries Number of Certificates
Number of Pekarangan
Number of Farm
Size (sq m)
1 SIDODADI 75 78 3 74 197,021 2 SIDOREJO 97 97 26 74 257,250
Source: Lampung Province Land Office, 2009. The majority of people in Sidorejo cultivate corn on their dry land, together with cocoa,
rubber, and palm oil, while Sidodadi villages produce commodities such as cocoa, coffee,
palm oil, cocoa, etc.
Access Reform The Central Lampung Land Office helped organize access by inviting stakeholders in
land affairs in Lampung such as Regional Government of Central Lampung, the
University of Lampung, the State-Owned Plantation Company (PTPN) VII, ASPINDO
Lampung, PT Great Giant Pineapple Co (GGPC), PT Garuda Food Putra Putri Jaya, the

219
Agricultural Technology Assessment Agency (BPTP), Syariah BNI Bank, and Syariah
Mandiri Bank.
Land Certification of Land Distributed in Jasinga Sub District (Kecamatan) The land use associated with the land distributed and registered to people or institutions
in the ten villages of Jasinga, are as follows:
1. Housing
2. Plan for housing
3. Mixed garden (kebun)
4. Bamboo garden
5. Rubber plantation
6. Cassava
7. Rice field (wet land/sawah)
8. Settlement
9. School
10. Public health service
11. Cooperative
12. Village administrative office
13. Sport field (foot ball)
14. Mosque
15. Official teacher housing facility
16. Agriculture
17. Cemetery
18. Public security station
19. Village land inventory
20. Badminton Sport field
21. Dryland agriculture (tegalan)
220
22. Religious center
23. Hamlet plan
Parcel size of land distributed Parcel sizes distributed in Jasinga varied a lot. For individuals, the maximum of land size
is around 1 Hectares or less. If the recipient is an institution or government entity, the
parcel size is much bigger. According to former head of Setu village, the size of
individual parcels received under the agrarian reform program depends on how much ex
HGU land was occupied by each person. This typically means that someone with greater
financial assets and ability to manage land receives a larger plot of land.
Resolution of land disputes Consensus building on land distribution between PT PP Jasinga and people of the ten
villages were not easy. Each party argued their position on controlling and utilizing the
ex HGU land. PT PP Jasinga was in strong and documented position to legally control the
land with the the opportunity to extend the HGU land rights. On the other hand, people of
the ten villages had occupied and cultivated the HGU land for years while they argues
that PT PP Jasinga actually managed only parts of the HGU land and did not cultivate all
the land.
Under the agrarian reform program, the National Land Agency was a mediator between
the two parties and sought to reach a “win-win solution” of this problem. Finally, and
after a long, difficult deliberation between both parties, PT PP Jasinga and the people of
the ten villages reached agreement as follows:
1. Consensus dated May 1, 1998 to manage part of ex HGU land by applying a
polyculture (tumpang sari) planting system on 419 Hectares.
2. Consensus dated May 17, 2000 between PT PP Jasinga and Head of Koleang Village stated PT PP Jasinga releasing 86 Hectares of ex HGU land.
3. Statement letters dated January 28, 2002; January 4, 2003; and January 29, 2003 that allowed people of the ten villages to cultivate land and provide 1.5 Hectares of land for a village market in Setu village.
221
4. The three agreements above were improved and completed with statement letter of PT PP Jasinga dated January 15, 2007 releasing 1,038.2734 Hectares and providing for land cultivation in the ten villages of Jasinga sub district; 100 Hectares for the Regional Government of Bogor regency and 30.1565 hectares for an agrarian reform research site of the National Land Agency.
Access Reform To address the problem of access reform, the Bogor Land Office coordinated help to
beneficiaries for financial and technical assistance with the Regional Government of
Bogor Regency. The nation was expressed that farmers and people who receive land must
be proactive and actively looking for opportunities for financial assistance. In addition,
farmers are also encouraged to establish farmers groups. After land distribution, small
farmer groups have emerged in Jasinga, including the farmer group “Binangkit” of
Village Curug, the farmer group “Poleng” in Jasinga village, and groups “lestari”;;
“harapan makmur” and “harapan maju” in Pangradin village and other villages.

222
The Agrarian Reform Program in Blitar Regency Blitar Regency consist of a mountainous region including the Kelud and Butak
mountains, and hilly terrain in the southern part of the regency. It also includes some flat
and coastal land. According to the Statistic Office, the total area of the regency is 158,879
Hectares. Administratively, Blitar Regency is divided into 22 sub districts (kecamatan)
and 248 villages (Desa/Kelurahan). 21 sub district had been established a long time ago
but the Selopuro sub district was established in 1999, previously a part of Wlingi sub
districts (7 villages) and Talun sub district (1 village ). The 2000 population was
1,064,643 people, increasing in 2004 to 1,111,957 and in 2005 to 1,295,601, consisting of
657,012 males and 638,589 females. The population density in 2005 was 815 people/sq
km.
Land Use in Blitar
Land use in Blitar Regency is dominated by agricultural with around 59 percent of total
area of the regency or 97,340 Hectares. It consists of 35,442 Hectares of sawah (wet
land/rice field), dry land (tegalan) 53,259 Hectares, and mixed gardens 8,659 Hectares.
After President Suharto stepped down in 1998, many farmers and people of Blitar
regency “reclaimed” and occupied plantation and forest land, converting it into new dry
land agriculture.
Housing generally developed near the capital of sub district (kecamatan). Total area of
housing in Blitar is 30,912 Hectares or 18,9 % percent. Plantation land is 12.74 percent
or 20,747 Hectares. Because the land is fertile, many plantations developed in this
regency. Currently there are 22 big plantation companies mostly located in the northern
part of the Brantas river watershed. In 1999, 16 plantation companies faced land conflicts
with local people. Among of them, only 5 plantation issues were totally resolved. .
The total area of forest is 12.74 percent or 20,747 Hectares. One of the main activities of
Blitar’s people is animal husbandry for beef or milk. The area is a main supplier of meat
and milk for East Java Province.
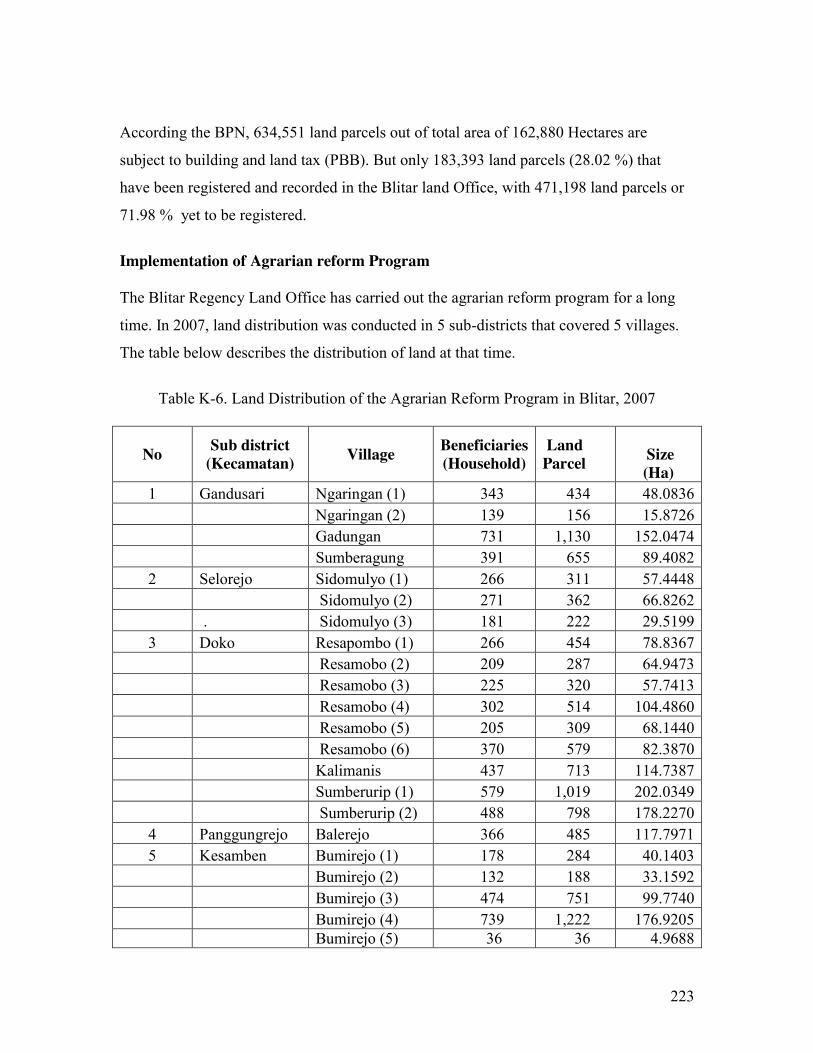
223
According the BPN, 634,551 land parcels out of total area of 162,880 Hectares are
subject to building and land tax (PBB). But only 183,393 land parcels (28.02 %) that
have been registered and recorded in the Blitar land Office, with 471,198 land parcels or
71.98 % yet to be registered.
Implementation of Agrarian reform Program The Blitar Regency Land Office has carried out the agrarian reform program for a long
time. In 2007, land distribution was conducted in 5 sub-districts that covered 5 villages.
The table below describes the distribution of land at that time.
Table K-6. Land Distribution of the Agrarian Reform Program in Blitar, 2007
No Sub district (Kecamatan) Village Beneficiaries
(Household) Land Parcel
Size (Ha)
1 Gandusari Ngaringan (1) 343 434 48.0836 Ngaringan (2) 139 156 15.8726 Gadungan 731 1,130 152.0474 Sumberagung 391 655 89.4082 2 Selorejo Sidomulyo (1) 266 311 57.4448 Sidomulyo (2) 271 362 66.8262 . Sidomulyo (3) 181 222 29.5199 3 Doko Resapombo (1) 266 454 78.8367 Resamobo (2) 209 287 64.9473 Resamobo (3) 225 320 57.7413 Resamobo (4) 302 514 104.4860 Resamobo (5) 205 309 68.1440 Resamobo (6) 370 579 82.3870 Kalimanis 437 713 114.7387 Sumberurip (1) 579 1,019 202.0349 Sumberurip (2) 488 798 178.2270 4 Panggungrejo Balerejo 366 485 117.7971 5 Kesamben Bumirejo (1) 178 284 40.1403 Bumirejo (2) 132 188 33.1592 Bumirejo (3) 474 751 99.7740 Bumirejo (4) 739 1,222 176.9205 Bumirejo (5) 36 36 4.9688
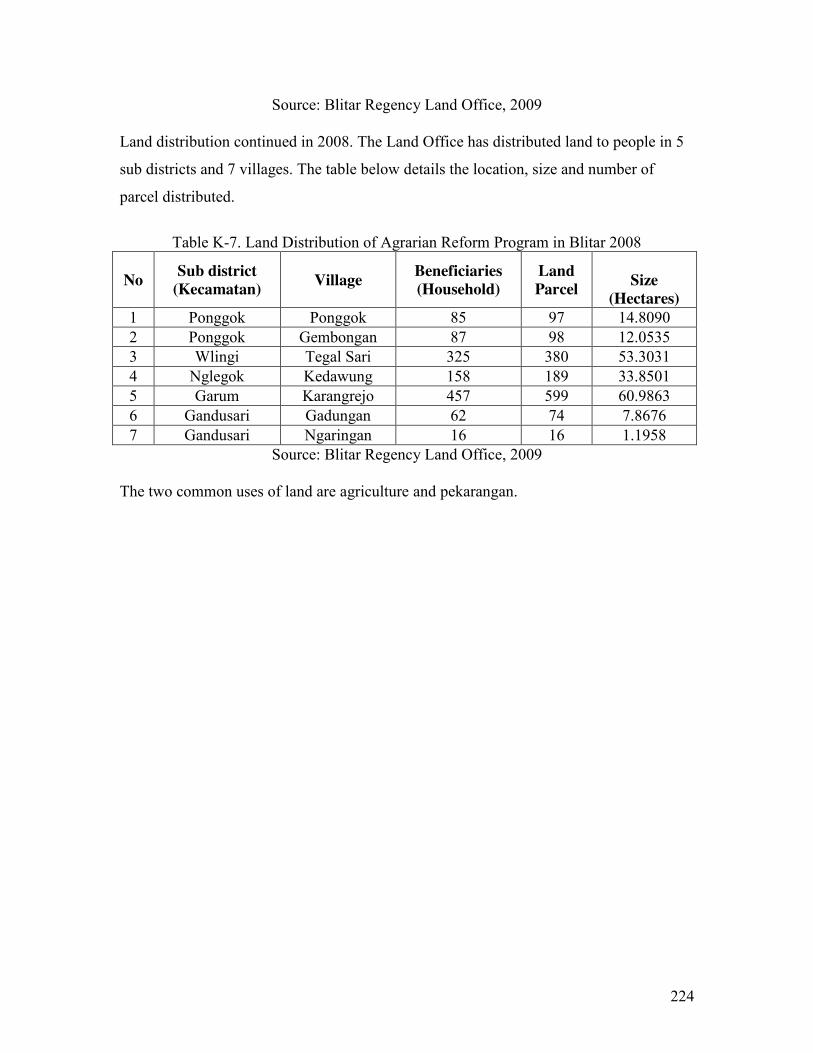
224
Source: Blitar Regency Land Office, 2009 Land distribution continued in 2008. The Land Office has distributed land to people in 5
sub districts and 7 villages. The table below details the location, size and number of
parcel distributed.
Table K-7. Land Distribution of Agrarian Reform Program in Blitar 2008
No Sub district (Kecamatan) Village Beneficiaries
(Household) Land Parcel
Size
(Hectares) 1 Ponggok Ponggok 85 97 14.8090 2 Ponggok Gembongan 87 98 12.0535 3 Wlingi Tegal Sari 325 380 53.3031 4 Nglegok Kedawung 158 189 33.8501 5 Garum Karangrejo 457 599 60.9863 6 Gandusari Gadungan 62 74 7.8676 7 Gandusari Ngaringan 16 16 1.1958
Source: Blitar Regency Land Office, 2009 The two common uses of land are agriculture and pekarangan.

225
Figure K-6. Map of Blitar Regency
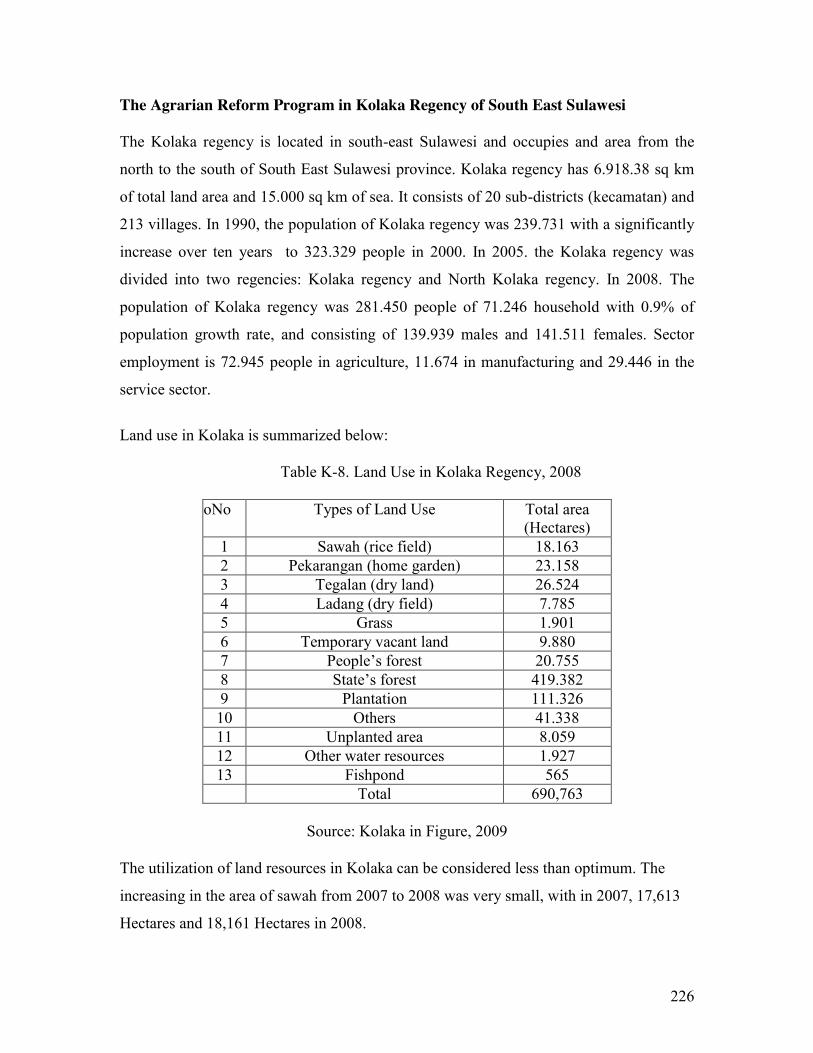
226
The Agrarian Reform Program in Kolaka Regency of South East Sulawesi The Kolaka regency is located in south-east Sulawesi and occupies and area from the
north to the south of South East Sulawesi province. Kolaka regency has 6.918.38 sq km
of total land area and 15.000 sq km of sea. It consists of 20 sub-districts (kecamatan) and
213 villages. In 1990, the population of Kolaka regency was 239.731 with a significantly
increase over ten years to 323.329 people in 2000. In 2005. the Kolaka regency was
divided into two regencies: Kolaka regency and North Kolaka regency. In 2008. The
population of Kolaka regency was 281.450 people of 71.246 household with 0.9% of
population growth rate, and consisting of 139.939 males and 141.511 females. Sector
employment is 72.945 people in agriculture, 11.674 in manufacturing and 29.446 in the
service sector.
Land use in Kolaka is summarized below:
Table K-8. Land Use in Kolaka Regency, 2008
NoNo Types of Land Use Total area (Hectares)
1 Sawah (rice field) 18.163 2 Pekarangan (home garden) 23.158 3 Tegalan (dry land) 26.524 4 Ladang (dry field) 7.785 5 Grass 1.901 6 Temporary vacant land 9.880 7 People’s forest 20.755 8 State’s forest 419.382 9 Plantation 111.326 10 Others 41.338 11 Unplanted area 8.059 12 Other water resources 1.927 13 Fishpond 565 Total 690,763
Source: Kolaka in Figure, 2009
The utilization of land resources in Kolaka can be considered less than optimum. The
increasing in the area of sawah from 2007 to 2008 was very small, with in 2007, 17,613
Hectares and 18,161 Hectares in 2008.

227
Food crops produced in Kolaka regency are rice, corn, cassava, sweet potatoes, soybeans,
etc, while plantation commodities include coconut, coffee, cashews, pepper, cocoa,
cloves, ugarcane, tobacco, etc. Only six of these are commonly planted by private
farmers, namely coconut, coffee, pepper, clove, cashew nut, cocoa and sago. Most of the
land area is state forest consisting of five types of forest: regular production forest,
limited production forest, protection forest, forest tourism, and production conversion
forest. In 2007, the total area of forest was 517,775 Hectares, increased in 2008 to
621,027 Hectares.
The following figure is the map of Kolaka regency.
Figure K-7. Map of Kolaka Regency (Source: South East Sulawesi Land Office, 2009)
In the period of 2000-2008, the number of Stipulation Letter (SK) of land rights
significantly increased. The SK is the evidence of formal ownership and required for
people to register land. The SK is issued by the land office to grant new land rights for
people or legal entities on original state land. In 2000, only 354 people or any legal entity

228
who owns Building Use Right (HGB) with total area 18,065 sq m. Ownership right is
only owned by 2,608 people with a total area 8,259,161 sq m. In 2008 no person or
institution received HGB and the number of SK issued were 5,155 or 38,662,500 sq m.
New Approach to Agrarian Reform Program in South East Sulawesi Most land distributed originates from the land reform program in 1960s. Generally, the
land was redistributed a long time ago but had not yet been yet registered. Land
registration and title certification provides access to financial resources and technical
assistance.
The South East Sulawesi Land Office primarily relies on the distribution of HGU land to
people and provide businesses opportunities as a cooperative venture. The goal is to
distribute land to people, provide financial and technical access to manage their land, and
for businesses to assure a safe production environment with available of certified land
that can safely be cultivated. The cooperation with business provide also access markets
The South East Sulawesi land office (Kantor Pertanahan Wilayah Provinsi Sulawesi
Tenggara) began implementing agrarian reform program in 2007 when Mr. Doddy Imron
Cholid was head of the office. He initiated cooperation between the office and PT.
Damai Jaya Lestari (DJL) of Kendari by establishing agreement in the form of a
memorandum of understanding (MOU) between BPN and PT. Damai Jaya Lestari. The
agreement was signed by Mr. Doddy as representative of South East Sulawesi Land
Office and Mr. Sudarjo Soemitro who represented PT. Damai Jaya Lestari. The
agreement stated the both parties agreed to cooperate in a land certification program for
the following ten villages in two sub-districts (kecamatan) of Kolaka regency :
1. Popalia Village of Tanggetada Sub district (kecamatan)
2. Tondowolio Village of Tanggetada Sub district
3. Oneha Village of Tanggetada Sub district
4. Lamoiko Village of Tanggetada Sub district

229
5. Puundaipa Village of Tanggetada Sub district
6. Polenga Village of Watubangga Sub district
7. Polinggona Village of Watubangga Sub district
8. Plasma Jaya Village of Watubangga Sub district
9. Kukutio Village of Watubangga Sub district
10. Langgosipi Village of Watubangga Sub district
There are program aspects included:
1. PT. Damai Jaya Lestari (DJL) as first party tasks BPN to arrange and conduct a land certification program to develop palm a oil plantation.
2. The number of land parcel to be certificated or registered is 2900 parcels.
The cost needed to register land parcel is IDR 534,000 for each land parcel, with a total
cost of IDR 1,548,600,000.00 to be paid by PT. Damai Jaya Lestari. This is provided in
the form of a farm loan.
The 2900 land parcels registered will be distributed to the people of ten villages The
average size of land parcel is 1 Hectares. The agreement provides a direct cooperation
between a private plantation company and farmers who need help in financial assistance
in the productive management of their land. The cooperation is based on thousand of
contracts between PT DJL and beneficiaries of agrarian reform program in Kolaka
regency, while providing individual security and protection.
The following are operational aspects of the contract or partnership agreement between
PT DJL and the people of Kolaka:
1. Mr. Soedarjo Sumitro, director of PT DJL represented PT DJL to sign any contract related to agrarian reform program in South East Sulawesi.
2. The contract period between PT DJL is twice the productive planting time or 50 years.

230
3. PT DJL will receive products from the land contracted.
4. PT DJL provides working capital working to start the cultivating palm oil.
5. Total amount of working capital working provided for each of 1 Hectares land parcel is IDR 24 Million, and considered a farm loan.
6. The cost of land certification is IDR 540 Thousands, provided as farm loan.
7. The administration cost and acquiring letter of ownership evidence cost are IDR 460 thousands and also considered a farm loan.
8. A sharecropping agreement that states that PT DJL will receive 60 percent of total production of land area contracted, while the land owner will receive 40 percent of total production of the contracted land.
9. The land owner pays the debt (working capital, cost of land certification and administration cost) in an amount of 30 percent of production of the 40 percent the contracted land areas monthly.
10. The land certificate will be kept by PT DJL during the period of loan contract.
11. PT DJL will return the land certificate after all debt is paid by the land owner.
Challenges During the fieldwork, interesting facts emerged. In one case, the original owner already
transferred land to other people. So the partnership contract to utilize land was made
between PT DJL and the second land owners. Interestingly, the second owners were not
local people, but people from other islands. Staff of PT DJL indicated that similar vents
occurred and that many of the current land owners were not local people anymore. This
issue needs to be investigated further. If a large number current land owners are not local,
this means that the agrarian reform program may not achieve its main objective, namely
to improve the long-term prosperity of local people and achieve social justice for
marginalized people.
231
GROUP INTERVIEW ON ACCESS REFORM TOPIC : LAND CERTIFICATION AND ACCESS REFORM PLACE : WATES VILLAGE, KECAMATAN PADANG CERMIN,
KABUPATEN PESAWARAN, PROVINSI LAMPUNG DAY/DATE : MONDAY, AUGUST 3, 2009 TIME : 12:30 PM – CLOSING (NOTES AND COMMENTS (C) BY SAIFUL HIKAM, Ph.D, DEPARTMENT OF CROP SCIENCES, UNIVERSITY OF LAMPUNG, BANDAR LAMPUNG, EDITED BY G.SCHULTINK AND BASED ON QUESTIONS TO THE FARMERS GROUP ASSEMBLED, CONSISTING OF ABOUT 30 PEOPLE) 1. Question: How easy is it to get access to credits from formal or informal
institutions after issuance of land certificates? Answer (given by Mr. Suprapto from Wates village): I have 1 hectare (ha)
of rice field and 2 ha of cacao plantation certified. I borrowed money from the BRI bank of IDR50millions with an interest rate of 22.5% per annum. Yes, the certificates were accepted by the bank as the collateral for the credit.
Comment: I think Mr. Suprapto took the bank credit of a multipurpose kind. Once given, the bank lets the borrower decide how the money is used. The multipurpose credit is commonly considered a consumptive one, the interest rate is (much) higher than the credit for investment. Usually, the interest for the multipurpose credit is 16 % per annum as compared to 6% for the investment credit. For agricultural activity, it becomes impossible for a single farmer to get the credit from the bank. The agriculture credit named KKP (Kredit Ketahanan Pangan, food resiliency credit), must be taken in group of 500 – 1,000 ha per unit. This KKP credit needs an avalis (guarantor) that is required to ensure that farmers cultivate the land profitably. Should farmer(s) be unable to pay back the loan, the avalis must take over the credit (s). For that, the avalis will charge the farmers as high as 40 % of the credit amount. Whether there is a legal regulation or contract concerning the avalis is not clear. The avalis is required by the bank since the fiscal year 1997/98.
2. Q: Comments on sales of crops? A: Sales are through middlemen. Price of cacao fluctuates from IDR
10,000 – 20,000 per kg and depends on the quality of the cacao seeds.

232
The middlemen are not fair in weighing and determining water content of the produce. Best price is obtained with a water content at 10 %.
C: The price of plantation products depends on international market prices. This is true for coffee, cacao, cassava, rubber, and palm oil. It is a common practice that the end traders are in Bandar Lampung, the capital city; and there are 2 – 3 middlemen involved. The trading between a farmer and a middleman is often tarnished by the practice of unfair weighing and measuring of water content. It is really hard, though, to achieved and maintain a 10 % water content at the farm level due to the lack of proper drying and storing facilities. This is worsened by the relative humidity in the tropics that is always higher than 86 %. In the U.S., for example, a water content of 15.5 % is considered sufficient in its climate of 49 % humidity. The University of Lampung (Unila) team tried hard (and continues to) to persuade varies parties (farmers, traders, and the local government) to use 13 % w.c. or process the cocoa seeds into cocoa-butter. In addition, some farmers may have borrowed funds from the middlemen as part of a sales contract. While the commodity price follows the prevailing market price at time of the sale, high loan interests may become a burden for farmers.
3. Q: Is there community interest in other crops or livestock? A: The main crops in the area are rice and cacao, but we grow coffee,
coconut, and chili peppers but these of minor importance. Especially for chili-pepper, efforts to enlarge the acreage are hampered by limited land availability. We are interested in raising cattle.
C: In the 2007 – 08 project, the BPN and the Unila team invited Dr. Gunawan (a veterinary doctor and the supervisor for cattle raising of the Great Giant Livestock Company with about 20,000 units per year). The GGLC was the avalis for cattle raising in Kabupaten Lampung Tengah, another project site of the BPN), asking him if the GGLC could help farmers in Wates with the cattle raising. We were informed that it might be difficult for the farmers to raise cattle of Australian origin, as did the GGLC. It was also difficulty for the GGLC to supervise to provide advice given the 150 km distance. We were advised that the Wates farmers would be better off with raising local stock, but it was next to impossible to find avalis as responsible as the GGLC. Perhaps the BPN may support the farmers in raising goats instead after an intensive study on farmer competency and climate suitability.
4. Q: Any comment on the program from a 0.5 ha farmer present here? A: My name is Muhartoyo from Wates. I was born here and inherited my
land from my father. We still cannot make use of the pods of the cacao fruit. The pods are considered and treated as waste, though we are already taught by the Unila team to make animal feeds out of the pods. We understand quite well how to produce the feed but we do not have
233
the animals to be fed. Perhaps the BPN is willing to loan us some capital to make this a possibility?
C: To process feed out of cacao pods needs a tool to chop-off the pods which are tough. Since the farmers did not have the animals yet, I raised a question whether they could produce and market the feed. A big no was the answer. This is a good example how we, the Unila team, have failed to introduce opportunities to the farmer community. I think the 2007 – 08 program was mostly focusing on the idea of self-sufficiency.
5. Q: Could the farmers unify to obtain credit? A: (No definite answers) C: (see Comment on Q #1)
6. Q: Was there any farmer coop in the past? Do you have any interest in establishing a farmer coop?
A: There was no farmer coop in the past, but yes we like to have one. (Hikam tried to remind the farmers of the KUD (Koperasi Unit Desa; village-unit cooperation). We had had a KUD established in 1981 to help marketing cloves. Since the KUD did not involve the community, the response to the KUD was (very) low. The KUD management and marketing systems were not transparent. Currently, some farmer’s coops exist but the joint capital is very small, , less than IDR50millions (about $5000 per coop). The main activity of the coops is save-and-loan. If there is any possibility that the Government will support us with capital, we would be very happy. With that support, we would be able to help marketing the cacao directly, cutting out the middlemen. In addition, to buy the production of 2 ha of cacao the coop will need some IDR25millions per year ($2500).
C: Coops at the agriculture grass-root is a rather ‘tricky’ business because the bargaining power is never on the farmer side for exported produce such as cacao or coffee (they have Robusta rather than Arabica)57. The price is mostly stable until the word suffers severe frost in South America – and the price goes up quickly, but that is a rare occurrence and only for a short duration. Recently, Indonesia is criticized by international NGOs for ‘destroying’ forest areas for those crops. In 2008, a NGO claimed, on the internet, that 50 % of Lampung coffee is produced by converting forest areas. Such claim results in anxiety
57 Schultink: Two basic coffees are grown: Arabica and Robusta. High quality blends consist of 100% Arabica beans. Lower quality, cheaper blends may have some proportion of Robusta beans, or they may consist entirely of Robusta. Arabica beans produce a superior taste, more flavorful and complex than Robusta. Robusta coffee trees produce their first crops within about two to three years after planting. Arabica trees require about four to five years to produce fruit (sometimes with a better quality under shade). Farmers sometimes grow the faster growing variety to take advantage of upswings in the price of coffee. Robusta coffee can grow under a wider variety of environmental conditions than Arabica. It is more tolerant to lower temperatures and, consequently grows well in a wider range of altitudes. Second, roasters buy the Robusta beans because they are generally cheaper than Arabica.

234
among exporters and affect pricing policy, resulting in lower prices. I have talked with a concerned coffee-exporting company head-quartered in Switzerland, and asked if the company is willing to comply with the Fair-trade and the Rain-Forest Alliances. Membership in these NGOs results in additional costs to the company and to teach their contracted coffee-farmers. During our dinner discussion last night, I learned that NESTLE is the long-time buyer for coffee produced in Way Kanan area, one of the areas with BPN certification programs in Lampung. Perhaps in the future the strategies of land certification (that means no more farming on forest land) together with complying with environmental issues under the supervision of buying companies will reduce such criticism and price will farm producers.
7. Q: Is it possible to have a loan coop run by the farmers? A: It would face problems with available human resources due to low
education level the farmers have and the government regulation on banking.
C: (no comment) 8. Q: On technical assistance by the Government, what is needed and
provided? A: We need assistances in (1) processing of cacao seeds to improve
quality, (2) processing cacao pods for feed, and (3) low interest loans. C: Especially in processing, it is a rather ‘easy’ task to do since what
needed is only a simple fermentation process (I believe that the Unila team has taught it). However, the process is time consuming and requires cleanliness from the start: separating from the pulp, plenty of clean fresh-water to wash the pulp residue off the seed surface, a covered drying platform that is fly-free – all these aseptic conditions seem beyond the farmer’s ability. In addition, cacao harvest is done every other day or once in every three days. This is a rather short harvest interval, plus the need for instant cash makes it impossible to ferment the seeds. The alternative is to provide the farmers as group (s) the skills and facilities to produce cacao butter (see C for Q#2).
9. Q: What other crops as options? A: We have coconut, coffee (Robusta), banana, and chili-pepper but of
minor importance. Actually we started with cultivating coffee and replaced it with cacao in 1990s. The reasons for the replacement are (1) better price, (2) harvest every week, not like coffee which harvest twice a year, and (3) lower management cost.
C: There is a potential danger in the way Wates’ farmers plant cacao trees – too dense! Average density is 800 trees per ha (instead of 600 as recommended) some even have 1,200 trees/ha – no direct sunlight ever reaches the soil surface anymore. This makes soil fungi grow easily and uncontrollably and infect the trees and the fruits (this is happening now). When the trees grow older and bigger, they will
235
compete for soil nutrients. The Unila team has yet to learn how to tell the farmers about these risks because right now the short-term revenues outweighs the long-term risk. (We also figure that it will be more difficult to take out excess trees when they are much bigger than they are now).
10. Q: I would like to hear from someone else among you. Mr. Teguh Warsito from Wates village responded to the invitation.
11. Q: How large is your land? A: 0.25 ha. That is because I am a new comer. I moved to this village in
1995. I consider myself lucky to be able to buy that piece of land since even in that time land was becoming scarce here.
12. Q: What do you cultivate? A: Corn.
13. Q: What is the purpose of cultivating corn? A: To fulfill my family needs. It is not sufficient, though, but I have other
businesses. My land produces 1.25 metric tons per ha at the selling price of max of IRD2,500 per kg.
C: I do believe that Mr. Warsito has opportunities to plant horticulture crops like chili-pepper, but he sees better opportunities outside agriculture.
14. Q: What do you think about receiving credit from a bank? A: I farm with my own money, but in would like to ask for a loan from
middleman on a yarnen (bayar-panen; paid with harvest) basis. C: Mr. Warsito is an example of C for Q#2
15. Q: Are you still interested in getting the credit from the bank? A: You bet!
16. Q: Why didn’t you apply for the credit? A: The procedure is too complicated and the interest rate is too high. I
do not have any collateral for the credit. 17. Q: Do you think that you need assistance from the Government services?
A: Not really, since I was graduated from SPMA (Sekolah Pertanian Menengah Atas. Literally translated: High School in Ag. Sci – Vocational School in Agriculture)
C: Mr. Warsito’s education level is the basic level required from a field extension service. 18. Q: So, you know all you need about agriculture?
A: In my opinion knowledge should come together with financial support. 19. Q: Anyone else would respond?
Mr. Kustama from Way Urang village volunteered. 20. Q: Do you have any experience to share from what we have discussed so far?
A: We have experiences on running a coop. The Kabupaten Government, Lampung Selatan, before it separated into a new kabupaten, Pesawaran, supported our coop in excess of IRD12millions. Nowadays,

236
we have increased our capital to IRD25millions ($2500). Our coop plans to buy cacao from farmers, but has difficulty because we do not have competent management.
C: Perhaps this case has to be considered carefully since in my opinion the coop would easily slip to become a middle-trader, for better or for worse. The Unila team advised such coop to help market the produce and for the farmer members to collect the cacao produce and trust the coop to market it. The coop would receive 25 % of the profit.
21. Q: In the case a coop member borrowsmoney from your coop, what is the interest rate?
A: Very low. A 2 % interest per month (others responded their disagreement since it means 24 % interest per annum, even higher than the BRI bank of 22.5 % interest per annum). Some of you may think that the interest rate is (too) high, however, all the interests receivable are reinvested to increase the coop capital.
C: It is a common practice that a coop would charge a 1 % interest per month for a payback duration of 10 months. Another ‘weakness’ of the coop, I would say, is the max amount one can borrow is IRD5millions – too small amount by today’s standards, but hard to payback. The coop usually regulates the payback in term of equal monthly installments. This amount is prohibitively high.
22. Q: Any other remarks or suggestions? A: (from Mr. Dwi Warsito from Gunung Rejo village). It is best for the
Government to support poor households in terms of agriculture inputs, such as fertilizers, pesticides. In my village, there are 150 households altogether; among them are 100 households that have been classified as poor by the Government. And 50 households do not have land – they work as sharecroppers.

237
GROUP INTERVIEW ON ACCESS REFORM TOPIC : LAND CERTIFICATION AND ACCESS REFORM PLACE : SIDOREJO VILLAGE, KECAMATAN BANGUN REJO,
KABUPATEN LAMPUNG TENGAH, PROVINSI LAMPUNG DAY/DATE : TUESDAY, AUGUST 4, 2009 TIME : 12:00 PM – CLOSING (NOTES AND COMMENTS (C) BY SAIFUL HIKAM, Ph.D, DEPARTMENT OF CROP SCIENCES, UNIVERSITY OF LAMPUNG, BANDAR LAMPUNG, EDITED BY G.SCHULTINK AND BASED ON QUESTIONS TO THE FARMERS GROUP ASSEMBLED, CONSISTING OF ABOUT 25 PEOPLE) 1. Question: After your lands were certifiied, how easy was it to obtain credit?
What did you do to get the credit? Did you experience any difficulties to get the credit? What do you think about the interest rates?
Answer (given by Mr. Suratno from Sidorejo, the head of Gapoktan (Gabungan Kelompok Tani; Farmer Group Unification): I would like to tell you my experience in tilling the land. We practiced a no-till in planting corn. We used herbicide and applied manure. The kernels we harvested were solely for feed that we sold to Japfa Comfeed (JC), a feed manufacturer. No-till was more profitable than tilled planting. My Gapoktan was loaned credits for the corn planting from BSM (Bank Syariah Mandiri; a bank regulated (supposedly) in accordance to Islamic laws (=syariah)). The JC introduced us to the BSM and was willing to be our avalis (guarantor) for the credits, for that we were grateful. No, the JC did not charge us any fee for being our avalis. We only had to sell the corn to the JC with the price at harvest time. Yes, the business between the bank and us was without a go-between. We received our money directly from the bank and paid back the credit also by ourselves.
2. Q (asked by Mr. Syarif, the head of BPN office in Kabupaten Tanggamus). In 2007 – 08 he was the head of BPN office in Kabupaten Lampung Tengah where this project was situated): Please tell us your experience with the other bank.
A: In 2007, we were introduced to the certification and access programs. We met with a consolidated team of the BPN and the Unila (University of Lampung). We started a program of cattle fattening. We were introduced to a bank BNI-syariah and the GGLC (Great Giant Livestock Company). The GGLC was our avalis and took care of the bank credits. We received 4 stock-bulls of local Brahman, feed and feed-concentrates, vaccines and other medicines, and supervision for involved members; all for four months. Members involved had to build pens, plant grasses, and prepare in-family

238
laborers. Caring for the cattle required we obtained a 0.9 kg daily weight gain per bull. The GGLC was the primary buyer. However, we could sell to other parties that offered a better price than the price we and the GGLC had agreed on. We paid our debt to the GGLC and kept the difference. Total credit per member was IDR50millions. After 4 month, we profited about IDR4millions. (about $100/month). But now we can go directly to the bank. We buy stock-bulls from the GGLC, prepare the feed ourselves, following practices taught by the GGLC and the Unila team. We already have grasses (green feed) but not the concentrate we buy from Santory (another cattle-feeding company, situated closer than the GGLC to the village, as discarded concentrate). Santory keeps the concentrate in pen-feeders only for 24 hours, then it is discarded. We sun-dry the concentrate before given to our cattle. (This practice is confirmed by Mr. Narsih, another Gapoktan leader) We also have a new agreement with the BSM bank. The bank gives us credits for a 5-year duration, in which we are entitled to a 3-year grace period – in the first 3 year we pay only interest, at a rate of 0.9 % per month
C: For better or for worse, we witness changes. As background, from the start in 2007 the BPN (Mr. Sitanggang, former Head of Kanwil Lampung; and Mr. Syarif, former Head of Lampung Tengah Branch-Office) initiated a three-party work: the BPN, the Unila, and the private companies. In response, the Unila formed a team of 4 lecturers: Drs. Wan Abbas Zakaria (agric. socio-economist), Erwanto (animal-scientist), Saiful Hikam (agronomist), and Mrs. Yuni (agric. socio-economist; an M.S.). The Unila team worked in the 4 villages, pilots for the BPN project; Pesawaran Indah and Wates in Kabupaten Pesawaran, Sidorejo and Sidodadi in Kabupaten Lampung Tengah. The Unila team started the access reform (agric. and soc-econ. supervising) at the same time the BPN started the land registration and certification. We initiated programs we call “empowering local knowledge". We made villagers realize what potentials and opportunities they have and they could make use of for these opportunities instead of asking support and subsidies from the government, like they used to in the past. We started with reforming and reactivating the Gapoktan in each village. Within a Gapoktan, there are groups of farmers with the same crops; agriculture (rice, corn, peanut, cacao, coffee, rubber, and oil-palm), livestock (cattle-raising due to the fact that raising animal requires a lot less land than for cultivating crop, and (can be) more profitable, too. The ones we witness in Sidorejo are the first to start in all 4 villages, and fish-ponds (catfish; only in Pesawaran Indah and Wates having plenty of streams from their mountainous topography). Through Gapoktan meetings, we tried, among others:

239
(1) To established working-links among farming groups to empower self-sufficiency and self-sustainability through recycling: wastes from crops to animals to fishponds back to crops. (2) To differentiate products to obtain better prices: cacao seeds sundried fermented making cocoa butter. (3) To differentiate market-places especially for cacao: middlemen for small quantity end trader for large amount from collective farmers chocolate industries for cocoa butter. Or catfish: traditional market for live catfish dressed catfish for super markets fish fillets for export. (The BPN put a brand-new high-speed core2duo-Intel PC in each village and with an existing internet link in a cell-phone’s modem, e-commerce (marketing) is a possibility. Two potential commodities, cacao and catfish exist, to go e-commerce. A young SPMA graduate lives in the village, who owned only a quarter ha of land, but as a SPMA-graduate, he can make use of the computer, including e-marketing (4) To make cattle feed themselves utilizing crop waste. This works nicely in Sidorejo and Sidodadi. But in Wates, the villagers still want to know what to do with their cacao waste. Here we possibly stress too much self-sufficiency and self-sustainability, and forgot that that wastes was a potential commodity. Recent studies in the Unila proofed that coffee and cacao, as well as cassava wastes are good sources for feed-concentrate using only a simple fermentation with certain fungi. We may also start with making silage. (5) Increase max credit of IRD50millions to IRD100millions per farmer for cattle-raising. This will double the profit since costs for in-family laborers and animal pens will remain the same. (The banks have not agreed on our proposal because the farmers have to fill-in and submit tax reports – that may be too much of a burden for simple farmers. We negotiated this with the bank, but the regulation is issued by the BI, Jakarta and needs to be implemented without exception). The BPN was successful in finding private businesses willing to act as bapak-angkat (step-father) for the Gapoktan. The step-fathers would take care of the Gapoktan in financing, supervising, and marketing the produces. For example, the GGLC in cattle raising, the Japfa Comfeed in corn, Kacang Garuda in peanuts, and Mukhtar Sani in catfish (unfortunately this one was unsuccessful). The BPN was also successful in including the BSM and BNI-syariah banks.
240
To further support the program, the Unila teams placed two students working on their KKN program (Kuliah Kerja Nyata; an academic course accomplished by working together with the villagers in the field for a 2-month period) in each village. We also placed a doctorate student from the IPB (he was a Unila lecturer) in fishery to supervise catfish raising in Pesawaran Indah village. (In 2009, the Unila places eight KKN students in Pesawaran Indah and Wates, but unfortunately none in Sidorejo or Sidodadi). The 2007 – 08 program worked well, as we reported the results in the LMPDD (Land Management and Policy Development Project) meeting, 22 – 23 May, 2008. In that meeting, I realized that it was only Lampung that already accomplished the first stage of access reform program. From the discussion we had in Wates and Sidorejo villages, I witnessed several changes: (1) The fish-pond program of no continuity, (2) The cattle-raising activity has become independent. Caution should be noted on: (a) 0.9 kg daily gain per animal, can it be achieved?; (b) if it can, how does a farmer weigh his cattle prior to selling? During the project, the GGLC provided a digital scale with big-red-bright digits on its screen; (c) the practice of buying concentrate-waste from Suntory may not be acceptable since the farmers can not measure growth of pathogenic fungi in it, also diseases from previous pens can be easily introduced. (3) We expect that the selling price of corn kernels should be higher than the farm-gate price at harvest for two reasons: (a) the JC as the step-father should be willing to provide a ‘better’ price;; (b) direct selling by the farmers – the JC must have had reduced costs for the middlemen. It is only fair that the JC shares its profit with the farmers. But of course, the JC deserves two thumbs up for not charging the farmers avalist fee. (4) The interest rate has increased from 6 % per annum to 0.9 % per month (= 10.8 % per annum). I think that’s quite an increase (= 76 %). Is it because of the bank gives a 5-year period instead of the usual 6 month for cattle-raising? Are the farmers given a choice to pick the one suits them more? To me, extending the credit period raises risk more to the farmers than to the bank since we understand that it is difficult for the farmers to keep the pens clean and to feed the cattle with fresh-healthy concentrate.
3. Q: How about borrowing money from nonbank sectors? A: We do not have to and do not dare to do that. The nonbank loans mostly
from middlemen on yarnen basis (bayar panen; paid for with harvest) and some from shark money-lenders. This yarnen creates more problems than it does benefit to us. Our agriculture is rain-fed, which is difficult to predict. Mr. Sunarsih, my colleaque Gapoktan head and I initiate a plan of collatering one certificate from each of us to get two IDR50million credits.

241
4. Q: Why do you want to take such risk dividing your credit money? What are criteria you apply for selecting the recipients?
A: We do that since we realize that not all of my Gapoktan members owe certificates liable for bank credits since their parcels are too small. So I volunteered to put my certificate up for the credit. I selected the 9 members of the poorest members myself. The first credit will be paid for in full in the next three months, so I think the risk I take is worthwhile. Yes, those members pay the dues to me since I am who signs the credit contracts. But I do not charge extra profit from them. They know how much the interest should be paid for.
C: This is another nice improvement. By using his certificate, Mr. Suratno and Mr. Sunarsih could possibly act as non-fee avalis. The risk on them is heavy, though, since the agriculture in Sidorejo is all rain-fed. I wonder if they keep the certificates of the other 18 members (8 of each Gapoktan) as collateral?
Q: What are your criteria to decide whether a member is poor. A: (given by Mr. Riduan, the chief of Sidorejo village): the criteria for poor
are: (1) one rice meal a day, (2) one new clothes a year, (3) go to a saman-healer instead of to a doctor when sick, (4) have hut (semi permanent) instead of permanent stone house, (5) have no definable job, (6) land ownership of 0.25 ha or own no land at all.
C: I might add that according to the State’s Treasurer poor is defined as having collective income of IDR600,000 ($60) per month. It is called collective since it is rather common that there are 3 generations in one households.
5. Q: What else you think may the BPN do to help? A: We need support for the poor to assist them in their farming, or maybe
credits for them to raise cattle. We have an example here. One of our members cultivates wood mushrooms on saw dust, two kinds of them: the white one and the tiram (clam-like) one. He is so poor that he cannot expand his enterprise, although the demand for these mushrooms is high, and with good profit. (These are different mushrooms than ones sold along the road. Those are wild mushrooms that grown on stumps of oil-palm trees).
C: We did visit the mushroom huts and met a farmer in clear need of financial assistance. An education center near Cianjur, West Java, exist known as VEDCA (Vocational Education and Development Center for Agriculture) established in 1985 with a World Bank’s grant. I visited VEDCA in 1992, and scientists were doing experiments of culturing wood mushrooms on wood-cuts instead of on sawmill-dust. Replacing sawmill-dust with wood-cuts will enable farmers use their own tree-wood. Many sawmills, we suspect, get their tree illegally from the protected forest areas.
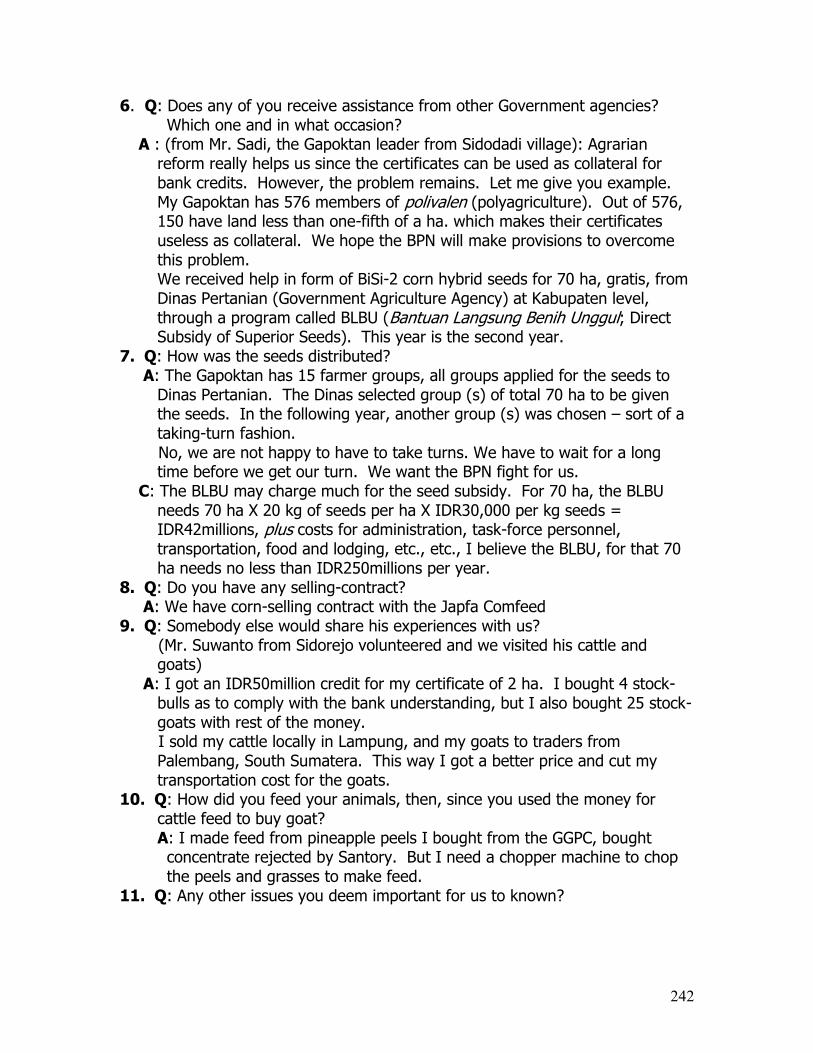
242
6. Q: Does any of you receive assistance from other Government agencies? Which one and in what occasion?
A : (from Mr. Sadi, the Gapoktan leader from Sidodadi village): Agrarian reform really helps us since the certificates can be used as collateral for bank credits. However, the problem remains. Let me give you example. My Gapoktan has 576 members of polivalen (polyagriculture). Out of 576, 150 have land less than one-fifth of a ha. which makes their certificates useless as collateral. We hope the BPN will make provisions to overcome this problem. We received help in form of BiSi-2 corn hybrid seeds for 70 ha, gratis, from Dinas Pertanian (Government Agriculture Agency) at Kabupaten level, through a program called BLBU (Bantuan Langsung Benih Unggul; Direct Subsidy of Superior Seeds). This year is the second year.
7. Q: How was the seeds distributed? A: The Gapoktan has 15 farmer groups, all groups applied for the seeds to
Dinas Pertanian. The Dinas selected group (s) of total 70 ha to be given the seeds. In the following year, another group (s) was chosen – sort of a taking-turn fashion.
No, we are not happy to have to take turns. We have to wait for a long time before we get our turn. We want the BPN fight for us.
C: The BLBU may charge much for the seed subsidy. For 70 ha, the BLBU needs 70 ha X 20 kg of seeds per ha X IDR30,000 per kg seeds = IDR42millions, plus costs for administration, task-force personnel, transportation, food and lodging, etc., etc., I believe the BLBU, for that 70 ha needs no less than IDR250millions per year.
8. Q: Do you have any selling-contract? A: We have corn-selling contract with the Japfa Comfeed
9. Q: Somebody else would share his experiences with us? (Mr. Suwanto from Sidorejo volunteered and we visited his cattle and
goats) A: I got an IDR50million credit for my certificate of 2 ha. I bought 4 stock-
bulls as to comply with the bank understanding, but I also bought 25 stock-goats with rest of the money.
I sold my cattle locally in Lampung, and my goats to traders from Palembang, South Sumatera. This way I got a better price and cut my transportation cost for the goats.
10. Q: How did you feed your animals, then, since you used the money for cattle feed to buy goat?
A: I made feed from pineapple peels I bought from the GGPC, bought concentrate rejected by Santory. But I need a chopper machine to chop the peels and grasses to make feed.
11. Q: Any other issues you deem important for us to known?

243
A (given by Mr. Riduan chief of Sidorejo): Our village is 560 ha wide. 185 ha have been certified with 900 deeds, yet still 375 ha are in waiting. What is the BPN plan on those 375 ha? We are grateful that the certification increase our land value from IDR60millions to IDR100millions per ha. I know because there were already 10 deeds already banked as collateral and 20 deeds have been marketed.
C: In the beginning, the BPN (Mr. Sitanggang) and the Unila team planned to stamp the certificates with a “not to be sold within 10 year period after issuance”. This was never done by the BPN. I strongly warned the reform-subject farmers in our first meeting here in 2007, that I would rather have them deedless and occupy the land and be poor, than the BPN issuing deeds and then they sell the land and be landless-poor. That way they are not only lost their land, but more importantly, they lose their dignity. Maybe, I am overprotective? Maybe those who sell the land will be better off by using the money to realize what they have hoped for in all those years?
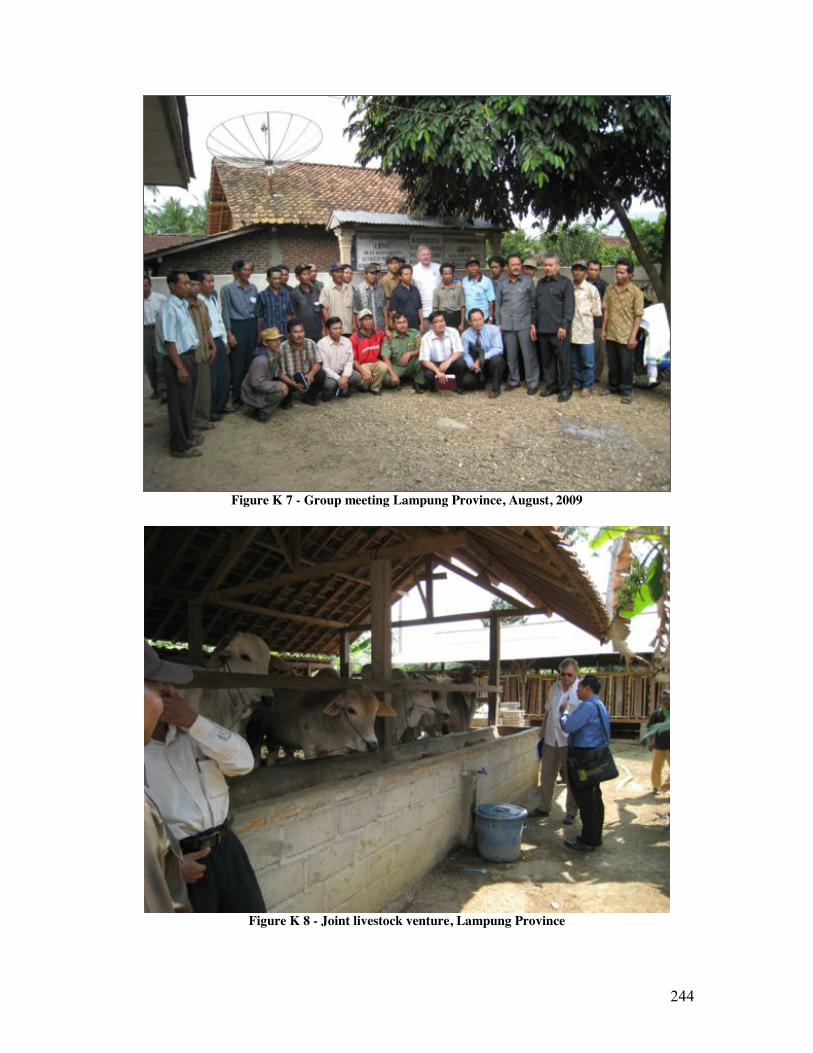
244
Figure K 7 - Group meeting Lampung Province, August, 2009
Figure K 8 - Joint livestock venture, Lampung Province

245
Figure K 9 – Cottage Industry: Mushroom Cultivation on Sawdust, Lampung Province, 2009 (see
also question 5, above)

246