land bank presentations/land bank... · 2018-08-27 · land bank presentation 2 key contacts land...
TRANSCRIPT

LAND BANK
INVESTOR ROADSHOW AUG 2017

Land Bank Presentation 2
Key Contacts
Land Bank
Bennie van Rooy
Chief Financial Officer
+27 12 686 0914
Mohammed Alli
General Manager – Investor Relations
+27 12 686 0519
Stefan Jansen van Vuuren
General Manager – Treasury
+27 12 686 0783
Nehru Pillay
General Manager – Research and Intelligence
+27 12 686 0963
Carolien Samson
General Manager – Strategy and Growth Innovation
+27 12 686 0920
Nedbank and Rho Capital
Ronelle Singh
Principal – Specialised Distribution – CIB
+27 11 294 4588
Nswana Mwangu
Associate – DCM Origination
+27 11 294 7997
Bheka Fakude
Managing Director: RHO Capital
+27 11 805 0668

Land Bank Presentation 3
1. Business Overview
• Mandate and Strategy
• Governance Matters
• Industry Developments
2. Financial Overview
3. Funding Matters
• Overview
• DMTN Matters
• August 2017 Issuance – Term sheet
Contents

BUSINESS OVERVIEW

Land Bank Presentation 5
MANDATE AND LAND BANK ACT
The Mandate of the Land Bank and the National Development Plan highlights the importance of the Agriculture sector to the country’s Development and Transformation agenda
The NDP views agriculture as central in achieving its inclusiveness and socio-economic goals
“Better land use in communal areas has the potential to improve the livelihoods1 of at least 370 000 people.”
“A further 70 000 livelihood opportunities are created if land reform beneficiaries are properly supported.”
“Agriculture has the potential to create close to 1 million new jobs by 2030, asignificant contribution to the overall employment target.”
National Development Plan; Vision 2030
Mandate
The objects, as per the Land Bank Act, No. 15 of 2002, are the promotion, facilitation and support of:
• Equitable ownership of agricultural land, in particular increasing ownership of agricultural land by HDI’s Agrarian reform, land redistribution or development programmes aimed at HDI persons
• Land access for agricultural purposes• Agricultural entrepreneurship• Removal of the legacy of racial and gender
discrimination in agriculture• Enhancing productivity, profitability, investment and
innovation• Growth of the agricultural sector and better use of land• Environmental sustainability of land and related natural
resources• Rural development and job creation• Commercial agriculture• Food security

Land Bank Presentation 6
Strategic Development Objectives Strategic Pillars
Sector growth
Employment
Quality
Transformation
Food Security
Sustainable
Development
Supply chain
development
Increase funding in agro-processing
2
Sector growth support
Prioritise high-potential regions and crops
1
Agri. innovation
Spur agri. innovation4
Production expansion and
intensification
Support next-generation farming
3
LAND BANK STRATEGYStrategic Development Objectives and Strategic Pillars

Land Bank Presentation 7
VALUE PROPOSITION & TARGET MARKET
AG
BIZ
Provide agri-inputs and services to farmers, use agri-
produce as inputs (market for farmers) or on-lending.
Includes: Large Agriculture; Corporates; Specialised
Agriculture; On-lenders (intermediaries).
LAR
GE
Operate on large agricultural land; capacity to
influence/dominate the market; agro-processing
capability.
Asset value: >R100m
Turnover: >R500m – R1b
ME
D
Established in commercial farming with skills and
access to markets.
Asset value: R10m – R100
Turnover: R5m–R500m
BBBEE threshold: <R10m turnover (EME); R10m –
R50m (QSE)
SM
ALL
New to commercial farming with some access to
markets.
Weak financial security (collateral)
Asset value:<R10m
Turnover: <R5mS
UB Operate small allotment and own few livestock mainly
for own consumption
EME=Exempted Micro Enterprise; QSE=Qualifying Small Enterprise
Co-ops & Agribusiness
Large Farmers
[LARGE]
Medium Commercial
[MED]
Emerging/Small/New Entrants
[SMALL]
Subsistence Farmer
[SUB]
Land
Ban
k F
ocus
Value Proposition - Key Points
• End-to-end support through value chain progression
• Meaningful partnership through farmer development phases
• Comprehensive suite of farmer support through LBIC
• Detailed on-farm risk analysis and advice
• Appetite for innovation
• Integrates – Public/Private/Govt/NGO’s
• Sector specific financing solutions
Target Market Profile

Land Bank Presentation 8
DEVELOPMENT IMPACTCommitted to growing the sector in a more inclusive and equitable way
Transformation
• Equitable ownership of agricultural land, particularly increasing the ownership of agricultural land by historically disadvantaged persons
• Agrarian reform, land redistribution or development programmes aimed at historically disadvantaged persons
• Removing the legacy of racial, gender and generational discrimination in agriculture
• Commercial Agriculture • Land access for agricultural purposes • Growth of the agricultural sector and better use of land
Economic Growth
• Food security • Enhancing productivity, profitability, investment and innovation
Economic Growth
Employment• Rural development and job creation • Agricultural entrepreneurship
Sustainable Development
• Environmental sustainability of land and related natural resources

Land Bank Presentation 9
DEVELOPMENT IMPACT OUTCOMESHighlights
R2.4bn growth in our
Loan Book to the
Development Sector
(Target: R2bn)
R4.8bn in new
disbursements
(excluding Revolving
facilities)
New jobs created:
15 360
Poultry sector jobs
maintained:
3 500
R100m disbursed under
Drought Relief Facility
Projects to expand
irrigated land:
13 000 hectares
Black Brokers
Development
Programme

Land Bank Presentation 10
Vision and Mandate Development Mandate Governance
• Equitable ownership of agricultural
land, in particular increasing
ownership of agricultural land by HDI
persons
• Agrarian reform, land redistribution /
development programmes aimed at
HDI persons
• Rural development and job creation
• Land access for agricultural purposes
• Agricultural entrepreneurship
• Removal of the legacy of racial and
gender discrimination in agriculture
• Enhancing productivity, profitability,
investment and innovation
• Growth of the agricultural sector and
better use of land
• Food security
• Alignment to the National
Development Plan (“NDP”); a priority
sector to reduce poverty, food
insecurity and drive sustainable
economic growth
• Stimulates growth, drives solid
performance and spurs innovation
• Work with all stakeholders to build an
adaptive and competitive agricultural
sector
• Promote Transformation
(Sector Inclusivity)
• Increase emphasis on environmental
and developmental sustainability
• National Treasury (“NT”) is the
Executive Authority of the Bank
• An independent Board appointed by
NT, consisting of an independent non-
executive Chairman and nine individual
non-executive members provide
independent oversight
• The Board has a Code of Conduct
which is aligned to best practice
• Independent Credit and Investment
Committee consisting of an
independent non-executive Chairman,
with four individual non-executive
members supporting the independence
of credit granting decisions
• Quorum and voting requirements
regarding credit decisions has been
strengthened to a two thirds majority
• A policy on lending to Politically
Exposed Persons has been approved
by the Board
• A strong domestic Aa1.za credit rating
assigned by Moody’s
• The Bank has received a unqualified
audit opinions since FY2012
MissionTo work with all stakeholders to build an adaptive and competitive agricultural sector that drives environmental,
social and economic development, and contributes to food security
Governance MattersLand Bank is committed to good governance and development mandate

Land Bank Presentation 11
Executive Authority
Accounting Authority
Exco Accountable to Board
Shareholder
Minister of Finance
Board of
Directors
Risk and Governance
Committee
Audit and Finance
Committee
Credit and Investments
Committee
Human Resource , Social &
Ethics Committee
Executive Committee
All Board Committees are accountable to the Board
Board Committees
• Enterprise Risk Management
Framework, Governance
Architecture, Risk Appetite and
Tolerance Framework
• Approve the Bank’s Risk
Management Plan
• Review and Monitor the
management of all Risks in the
organisation
• Internal and External Audit
matters
• Accounting policies and
methodologies
• Financial matters
• Monitor, Review and Oversee
all Human Resources, Social,
Ethics and Environmental
matters
• Review and recommend credit
policies, frameworks as well as
prudential limits and guidelines
• Review and approve or
recommend credit facilities in
line with Delegations of Power
• Monitoring
Prof. ASM Karaan 1
Ms. DN Motau Ms. SA LundMs. D Hlatshwayo
Ms. TT Ngcobo Adv. S Coetzee
Mr. MA Moloto
Ms. M Makgatho Ms. N Zwane
Ms. M Dlamini Mr. F Stiglingh Mr. S Soundy Ms. K Gugushe
Mr. W Jacobs
Mr. B van Rooy
Mr. G Conway Ms. L Ndlovu Mr. J Mthembu Secretary
Mr. TP Nchocho
Governance MattersOverall Governance Structure
Ms G Mtetwa
1 – Resigned with effect 31 July 2017

Land Bank Presentation 12
Operational MapLand Bank Locations
• The map notes the Land Bank’s direct national footprint
• Land Bank’s footprint is further enhanced through the Bank’s Intermediaryand Service Level Agreement (SLA) partners across the country

Land Bank Presentation 13
Operating EnvironmentTough agricultural conditions characterised by the worst drought in a century…
The Agricultural Economic
Landscape
• Domestic GDP growth at 0.3 % for the 2016 financial year (2015: 1.3%)
• Agricultural GDP growth declined by 7.8 %(2015: 6.1% decrease)
• SA agricultural exports to the world were valued at R79 billion in 2016(R64 billion: 2015)
• Aggregate Farm Income increased by 6.4% for the 2016 financial year(2015: 20.8%)
Drought:
A Significant Factor
• Important to note differences in impact by Regions & Access to Irrigation
• Grain Crops: Estimated 21.6% increase in hectares planted during the2017 calendar year.
• Livestock:
A 8% increase in feed costs for the 2016 financial year (2015: 8%)
• Horticulture: Mostly under irrigation & Export oriented
• Average Food Inflation during the 2016 financial year 10.8%
• Drought Relief Funding of > R100mn made available to support the sector

Land Bank Presentation 14
Industry MattersDrought, Fall Army Worm, Avian Flu, Land Reform
Drought
• Apart from the Western and Eastern Cape weather patterns havevastly improved with the outlook for another good rainfallseason in the “summer crop” areas
• Land Bank’s drought related exposure has stabilised aroundR784.4 million:
• Drought relief support extended to date:
• The remaining available support under the IDC drought relieffacility will be directed to support the Western and Eastern Cape
Avian Flu:
• The recent outbreak of the avian flu brings about new risk to theLand Bank’s loan assets
• The following is a summary of Land Bank’s exposure:
• Land Bank is pro-actively engaging and managing the affectedexposures
Delivery Channel FY2017
Direct R75.6 million
Indirect (SLA) R708.8 million
Total R784.4 million
Delivery Channel FY2017
Loans approved R207.6 million
Loans disbursed R117.8 million
Support available R192.4 million
Fall Army Worm
• Risk emerged during CY2017/Q1 and Land Bank previouslysuggested no real risk due to SA grain strands being immune
• Recent harvest levels have confirmed this
FY2017
Delivery Channel # Clients DistressExposure
R’mArrears
R’m
CDB 35 5 276.5 1.4
CB & SI 1 - 101.4 -
Total 36 5 377.9 1.4
Land Reform:
• The principle of appropriation of land without compensation isreceiving heightened attention
• Land reform is currently enshrined in the Constitution of theRepublic of South Africa and cannot be without compensation
• A policy change will require a change in the Constitution, whichrequires a 2/3 majority
• If such a policy should come to fruition, the process of amendedthe Constitution will be a lengthy process
• In this unlikely event, Land Bank together with all otherCommercial Bank’s collateral positions could be affectedadversely.
FINANCIAL OVERVIEW

Land Bank Presentation 16
Financial Overview Salient Features - Group
Published basis Like-for-like basis
Salient features Var % FY2017 FY2016 Var % FY2017 FY2016
Net interest margin 0.3% 3.1% 3.0% 0.3% 3.1% 3.0%
Impairments 9.8% R 81.5m R 74.2m 9.8% R 81.5m R 74.2m
Operating expenses (14.4%) R 595.2m R 695.5m 5.9% R 564.1m R 532.8m
Cost-to-income ratio (23.1%) 56.8% 73.9% (5.0%) 53.8% 56.6%
Profit for the year +100% R 367.0m R 182.0m 0.7% R 398.1m R 395.5m
- Banking Operations +100% R 316.3m R 94.0m 13.0% R 347.4m R 307.5m
- Insurance Operations (42.4%) R 50.7m R 88.0m (42.4%) R 50.7m R 88.0m
Cash (40%) R 1.52bn R 2.5bn (40%) R 1.52bn R 2.5bn
Net loans and advances 12.6% R 41.0bn R 36.4bn 12.6% R 41.0bn R 36.4bn
Impairment ratio (19.1%) 5.5% 6.8% (19.1%) 5.5% 6.8%
Non-performing loans (19.3%) 7.1% 8.8% (19.3%) 7.1% 8.8%
NPL coverage ratio - 77.1% 77.2% - 77.1% 77.2%
Total assets 9.7 % R 45.4bn R 41.4bn 9.7% R 45.4bn R 41.4bn

Land Bank Presentation 17
Financial Overview Salient Features - Bank
Published basis Like-for-like basis
Salient features Var % FY2017 FY2016 Var % FY2017 FY2016
Net interest margin 0.3% 3.1% 3.0% 0.3% 3.1% 3.0%
Impairments 9.8% R 81.5m R 74.2m 9.8% R 81.5m R 74.2m
Operating expenses (15.9%) R 570.0m R 678.0m 4.6% R 538.9m R 515.2m
Cost-to-income ratio (26.1%) 54.4% 73.7% (8.2%) 51.4% 56.0%
Profit for the year +100% R 316.3m R 94.0m 13.0% R 347.4m R 307.5m
Total comprehensive income +100% R 305.8m R 71.8m 11.0% R 314.6m R 283.5m
Cash (42.9%) R 1.2bn R 2.1bn (42.9%) R 1.2bn R 2.1bn
Net loans and advances 12.6% R 41.0bn R 36.4bn 12.6% R 41.0bn R 36.4bn
Impairment ratio (19.1%) 5.5% 6.8% (19.1%) 5.5% 6.8%
Non-performing loans (19.3%) 7.1% 8.8% (19.3%) 7.1% 8.8%
NPL coverage ratio - 77.1% 77.2% - 77.1% 77.2%
Total assets 10.1% R 43.8bn R 39.8bn 10.1% R 43.8bn R 39.8bn
Total CAR – Basel Standardised Approach (5.9%) 17.7% 18.8% (5.9%) 17.7% 18.8%

Land Bank Presentation 18
Statement of Profit and Loss and OCIProfit for the year: Published for Like-for-like basis
350
300
250
200
150
100
50
0
R m
illio
n
Organisational review
31.1
Published basis Like-for-like basis
347.4316.3
+10%
Profit for the year Var % FY2017 FY2016
Published basis +100% 316.3 94.0
Organisational review (80.9%) 31.1 162.7
IRFS 9 – FV designation to amortised cost (+100%) - 50.8
Like-for-like basis 13.0% 347.4 307.5
FY2017
The Bank’s performance during FY2017 was impacted by additional costs incurred in relation to the Organisational Review as undertaken during FY2016.
Although these costs are not significant, a “like-for-like” comparison is required to fully appreciate the results achieved in FY2017
350
300
250
200
150
100
50
0
R m
illio
n
307.5
50.8
Organisational review
IFRS 9: FV designation to amortised cost
162.7
+227%
Like-for-like basisPublished basis
94.0
FY2016

Land Bank Presentation 19
Statement of Profit and Loss and OCI
Profit for the year (like-for-like): Performance analysis
-100
0
100
200
300
400
500
Impairments Discontinued
operations
122.4
-7.3-54.6
Indirect tax
& other
Other income
-23.7
FY2016 NII
R m
illio
n
30.4
-16.5
347.4
Opex
-10.9307.5
FY2017NIR/E
13.0%
Profit for the year (like for like) Var % FY2017 FY2016
Net interest income 10.8% 1,256.9 1,134.51
- Interest Income 19.5% 4,234.8 3,543.7
- Interest Expense (23.6%) (2,977.9) (2,409.2)
Net impairment charges (9.8%) (81.5) (74.2)
Operating expenses (4.6%) (538.9) (515.2)
Profit for the year 13.0% 347.4 307.5
Net interest Margin 0.3% 3.1% 3.0%
Cost-to-income ratio (8.2%) 51.4% 56.0%
1 – FY2016 amounts have been reclassified to split out PRMA liability interest expense
Profit for the year – FY2017
Net interest income• Consolidation of the Bank’s earnings base resulted in 11% growth of
the gross loan book• This, together with more appropriate risk-based pricing resulted in a
an increase in net interest income of 10.8%• In line with expectations, actively lengthening of the Bank’s funding
profile resulted in increased funding costs• Net result is an increased in Net interest margin from 3.0% to 3.1%
Impairments• IFRS 9 models now in place for a 2nd consecutive reporting period• Impairment charges have stabilised and are more predictable.
Operating expenses• Excluding R31.1 million as a continuation of once-off costs relating
to the organisational review conducted in FY2016, operating expenses marginally increased year-on-year
• Cost-to-income ratio decreased from 56.0% to 51.4% (published basis: 54.4%)

Land Bank Presentation 20
Statement of Financial PositionBank
Like-for-like basis
Salient features Var % FY2017 FY2016
Cash and cash equivalents (42.9%) 1,211.3 2,120.6
Net Loans and Advances 12.7% 40,975.6 36,353.4
Investments 76.2% 983.2 557.8
Assets of disposal group classified as held-for-sale 31.8% 197.1 149.6
Other assets (26.9%) 451.8 618.1
Total assets 10.1% 43,819.0 39,799.5
Capital and reserves 6.0% 5,364.6 5,058.8
Liabilities 10.7% 38,454.4 34,740.7
- Funding liabilities 11.4% 36,918.8 33,156.0
- Provisions (47.7%) 107.1 204.8
- Liabilities of disposal group classified as held-for-sale 6.1% 920.9 868.1
- Other liabilities (0.8%) 507.6 511.8
Total equity and liabilities 10.1% 43,819.0 39,799.5

Land Bank Presentation 21
Statement of Financial Position
Loan Book: Performance
7.1%
83.7%
9.2%
Stage 3: Non-performing loansStage 2: Under-performing loansStage 1: Performing loans
13.1%
8.8%
78.1%
Loan book – FY2017 Loan book – FY2016
9.7%
9.0%
81.3%
Loan book – FY2015
NPL by Business Line – CDB (CDB approximates 16,8% of Gross Loans)
0
5
10
15
20
15.7%
3.0%
14.5%
17.0%
Direct
0.0%
16.1%
Total Indirect
FY2016
FY2017
0
5
10
15
Indirect
10.3%
5.6%
2.8%
4.3%
Total
7.4%
Direct
7.5%
FY2016
FY2017
NPL by Business Line – CB (CB approximates 83,2% of Gross Loans)

Land Bank Presentation 22
Statement of Financial Position
Loan Book: Impairment Coverage
0
1
2
3
0%
20%
40%
60%
80%
100%
0.8
74.8%
2.0
FY2015 FY2017FY2016
77.1%
1.6
77.2%
0.8
1.7
-11.1%
1.0
Specific impairments CoveragePortfolio impairments
0
5
10
15
20
25
30
35
40
45
0%
1%
2%
3%
4%
5%
6%
7%
8%
36.3
4.03.1
FY2016 FY2017
5.5%
30.5
6.8%
FY2015
30.7
5.13.4
7.3%
3.7 3.4
Stage 1: PerformingStage 3: Non-performing
Impairment ratioStage 2: Under-performing
Loan Book and Impairment ratio
Loan Book Impairments and “Coverage” Land Bank’s IFRS 9 models have now been in place for a 2nd
consecutive reporting period and Impairment levels have stabilised and are more predictable :
• Impairment ratio of 5.5% (FY2016: 6.8%); and • NPL coverage ratio of 77.1% (FY2016: 77.2%)
Although total impairment coverage has remained unchanged year-on-year, the Impairment Ratio for FY2017 has reduced to 5.5% as a result of reduced “Specific” Impairments, in line with decrease in the NPL portfolio.
The reduction in the NPL portfolio is largely driven by two successful workout solutions for two previously “legacy distress” clients, as well as more favourable weather conditions during the year which has cushioned the impact of the drought on the Bank’s NPL portfolio.
R b
illio
nR
bill
ion

Land Bank Presentation 23
Statement of Financial Position
Capital and Liquidity Management: CAR, LCR, NSFR
0%
5%
10%
15%
20%
FY2017RWA
18.8%17.7%
-5.9%
-1.9%0.8%0.0%
FY2016 ProfitGuarantee
0%
5%
10%
15%
20%
1.1%1.2%
-5.9%
FY2017
17.7%
10.9%
5.7%
FY2016
18.8%
11.3%
6.3%
FY2018/Q1
1.1%
5.6%
-1.7%
10.7%
17.4%
Target CARTotal CET 1 CapitalTier 2 CapitalGuarantee
Total Capital adequacy ratio
The year-on-year decline in CAR is as a result of increased RWA’s
Following the Land Bank’s voluntary introduction of a number of the BaselAccord’s capital and liquidity risk management practices during FY2016 theBank’s balance sheet has been significantly strengthened.
The Basel-like principles includes: Total Capital Adequacy Ratio (TCAR) – Basel II standardised approach Liquidity Coverage Ratio (LCR) – Basel III; and Net Stable Funding Ratio (NSFR) – Basel III
Approved deviations:
CAR Inclusion of Government guarantees as Capital Supply
LCR High quality liquid assets Roll-over rates

Land Bank Presentation 24
Statement of Financial Position
Capital and Liquidity Management: CAR, LCR. NSFR
Net Stable Funding Ratio
0%
20%
40%
60%
80%
100%
0%
60%
80%
20%
100%
40%
FY2016
90.0%
FY2017
86.7%79.0%
+8.4%
FY2018/Q1
+9.7%
94.0%
80.0%
Cash
800
1,800
600
400
200
0
1,200
1,600
2,000
1,000
2,200
1,400
+70.4%-42.9%
FY2018/Q1
2,063
FY2017
1,211
2,121
1,369
FY2015
1,228
FY2015 FY2016
Liquidity Cover Ratio
80%
40%
0%
240%
0%
40%
60%
100%
60%80%
20%20%
85.0%
FY2017
+54.5%
70.0%
55.0%
FY2018/Q1
60.0%
+169.9%
229.4%
FY2016
LCR Target
LCR
The Bank’s cash requirements are driven by LCR.
Land Bank has access to a number of liquidity facilitieswhich it taps into from time to time, of which:
• R2.15 billion Committed• R0.50 billion Uncommitted
At the time of this presentation all committedfacilities are undrawn
1 – LCR for FY2018/Q1 excludes available committedfacilities of R2.15bn.
R m
illio
n
NSFR
NSFR Target

FUNDING MATTERS
Land Bank Presentation 26
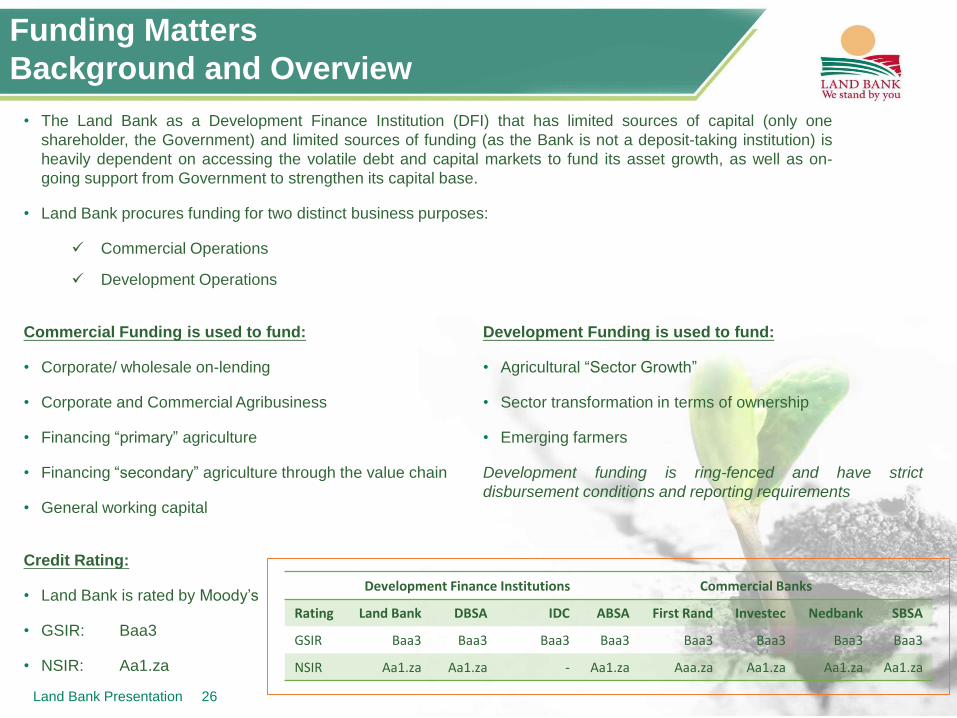
Funding Matters
Background and Overview
• The Land Bank as a Development Finance Institution (DFI) that has limited sources of capital (only one
shareholder, the Government) and limited sources of funding (as the Bank is not a deposit-taking institution) is
heavily dependent on accessing the volatile debt and capital markets to fund its asset growth, as well as on-
going support from Government to strengthen its capital base.
• Land Bank procures funding for two distinct business purposes:
Commercial Operations
Development Operations
Commercial Funding is used to fund:
• Corporate/ wholesale on-lending
• Corporate and Commercial Agribusiness
• Financing “primary” agriculture
• Financing “secondary” agriculture through the value chain
• General working capital
Development Funding is used to fund:
• Agricultural “Sector Growth”
• Sector transformation in terms of ownership
• Emerging farmers
Development funding is ring-fenced and have strict
disbursement conditions and reporting requirements
Credit Rating:
• Land Bank is rated by Moody’s
• GSIR: Baa3
• NSIR: Aa1.za
Development Finance Institutions Commercial Banks
Rating Land Bank DBSA IDC ABSA First Rand Investec Nedbank SBSA
GSIR Baa3 Baa3 Baa3 Baa3 Baa3 Baa3 Baa3 Baa3
NSIR Aa1.za Aa1.za - Aa1.za Aaa.za Aa1.za Aa1.za Aa1.za

Land Bank Presentation 27
Funding Matters
Strategy and Execution
5.0%5.0%
10.0%
30.0%
50.0%
10 years
7 years
5 years
3 years
< 1 year
Funding Profile
Medium Term target
Funding Strategy
• Land Bank has made great strides in extending its maturity
profile, thereby reducing refinancing risk and improving general
liquidity levels of the Bank.
• The extension of the maturity profile has been done in a well co-
ordinated, responsible and cost-effective manner, protecting the
Bank’s net interest margins.
• It is expected that the Bank will achieve it’s Medium-Term target
funding profile by 31 March 2018.
Notes on summary of the Bank’s funding activities for FY2017
FY2017 was a good funding year with the Land Bank achieving average
roll-over rates as follows:
FY2017
• Excl. PIC/ CPD: 73%
• PIC/ CPD: 100%
• Total: 85%
Debt excl. Call Bonds and Facilities FY2017
Total maturities R34.8bn
Debt rolled over R28.6bn
New funding raised R7.7bn
Liquidity position
• The Bank’s liquidity position has been vastly improved with
introduction of longer-dated funding, reducing call bond
exposures, as well as keeping utilisation of committed and
uncommitted facilities to a minimum.
• As at 31 March 2017, the Bank had R1.2bn cash on balance
sheet with access to a further R0.25bn in committed facilities
(subsequently increased to R2,15bn following further pay down of
facilities)

Land Bank Presentation 28
Statement of Financial Position
Funding: Investor base
0%
20%
40%
60%
80%
100%
47.4%
31.8%
FY2015
50.3%
18.6%
FY2014
62.4%
7.8%20.8%
31.1%29.7%
37.7%
FY2013
52.3%7.8%
FY2012
42.6%
56.6%
11.2%
5.8%
41.1%
FY2009
45.6%
80.9%
56.5%
2.3%
FY2011
55.0%
FY2010
2.3%2.1%
FY2016 FY2017
21.4%
28.3%
50.3%
Institutional & Other
PIC & CPD
Banks
Diversification of investor base
The Land Bank’s investor relations strategy is bearing fruit. Renewed investor confidence is evident with the Bank seeing increased support from existingfunders as well as new investors/ funders. Furthermore, the Bank has also managed to lure back investors that had previously left the Bank. The Bankhas a well diversified investor base across local debt and capital markets, as well as foreign funding relationships with Banks and multilaterals.
FY2017 @ Nominal
Related Parties DFI SOE
Commercial Bank
Foreign Banks
InstitutionalInvestors
Multi-lateral Investors
Agri Companies Total
Drawn Facilities - - - 2,000 400 500 - - 2,900
< 1 Year 10,748 450 1,778 2,953 120 4,720 - 906 21,675
1 – 3 Years - - - 1,250 525 6,372 - - 8,147
3 – 5 Years - 65 - 375 77 2,760 - - 3,277
5 – 7 Years - - - 364 71 579 - - 1,014
7 – 10 Years - - - - - - - - -
> 10 Years - 77 - - - - 955 - 1,032
Total 10,748 592 1,778 6,942 1,193 14,931 955 906 38,045
% Distribution 28.3% 1.6% 4.7% 18.2% 3.1% 39.2% 2.5% 2.4%

Land Bank Presentation 29
Funding Matters
Profile: Remaining vs. Original time to Maturity FY2018/Q1
Amortised Cost - RttM Total Excl. PIC/ CPD
FY2018/Q1 R’m % R’m %
Drawn Facilities 500 1.3% 500 1.8%
< 1 Year 20,348 52.3% 9,937 34.8%
1 – 3 Years 7,713 19.8% 7,713 27.0%
3 – 5 Years 5,923 15.2% 5,923 20.8%
5 – 7 Years 990 2.5% 990 3.5%
7 – 10 Years 2,472 6.4% 2,472 8.7%
> 10 Years 985 2.5% 985 3.5%
Total 38,931 100% 28,520 100%
Amortised Cost - RttM Total Excl. PIC/ CPD
FY2018/Q1 R’m % R’m %
Drawn Facilities 500 1.3% 500 1.8%
< 1 Year 17,105 43.7% 6,604 23.2%
1 – 3 Years 7,964 20.5% 7,964 27.9%
3 – 5 Years 6,300 16.2% 6,300 22.1%
5 – 7 Years 3,598 9.2% 3,598 12.6%
7 – 10 Years 2,361 6.1% 2,361 8.3%
> 10 Years 1,193 3.1% 1,193 4.2%
Total 38,931 100% 28,520 100%
6.4%
2.5%2.5%
15.2%
19.8%
52.3%
1.3%
> 10 Years
7 - 10 Years
5 - 7 Years
3 - 5 Years
1 - 3 Years
< 1 Year
Drawn Facilities
3.1%
16.2%
9.2%
6.1%
20.5%
43.7%
1.3%
3 - 5 Years
7 - 10 Years
> 10 Years
5 - 7 Years
1 - 3 Years
< 1 Year
Drawn Facilities
FY2018/Q1 – Original time to Maturity “OttM”
FY2018/Q1 – Remaining time to Maturity “RttM”

Land Bank Presentation 30
DMTN Programme Review
To enhance transparency, investor protection mechanisms and investor confidence, the following amendments have been introduced into the
DMTN Programme – effective 13 March 2017:
Investor transparency/ Information undertakings
Documents incorporated by reference enhanced to include:
• Policy on code of conduct regulating conflicts of interest
• Code of Ethics and Business Conduct
• Fraud & Corruption Prevention Plan
• Fraud & Corruption Prevention Policy
• Politically Exposed Persons Policy
• Whistleblowing Policy
Notice to investors w.r.t. Changes in Board Members/ Board Committees / Executive Management
Investor protection mechanisms
Redemption event in the event of a “Change in Control” entrenching National Treasury’s position as Executive Authority
Redemption event in the event of a “Breach of Anti Corruption Laws or Corporate Governance Policies”
Redemption event in the event of a “Disposal of all or greater part of the business”
Redemption event in the event of a “Change in the Business of the Land Bank” – linked to a change in the Land Bank Act.
All of these redemption events are at the option of noteholders.
Other enhancements
Inclusion of Notes that may qualify as “Regulatory Capital”
Market standardisation

Land Bank Presentation 31
DMTN Programme
Issuance Summary – FY2018/Q1
Notes on the current position of the R20bn DMTN Programme
• Issued under the programme: R11.538bn
• Matured: R 5.158bn
• Currently Outstanding: R 6.380bn (12 bonds)
• Available: R 8.462bn
Planned DMTN Issuances to 31 March 2018
• FY2018/Q2: R1.0bn
• FY2018/Q3: -
• FY2018/Q4: R1.0bn
R2.0bn
Land Bank’s allocated SOE Calendar auction dates
• FY2018/Q1 19 Jun 2017 – Not utilised
• FY2018/Q2 30 Aug 2017
• FY2018/Q3 06 Nov 2017
• FY2018/Q4 19 Feb 2018
Summary of significant maturities to 31 March 2019
DMTN Maturities Bi-lateral maturities
Instrument Amount Date Instrument Amount Date
LBK07 (3YR FRN) R0.387bn Sep 2017 Syndicated Loan (3YR) R1.020bn Dec 2017
LBK19 (1YR FRN) R0.755bn Mar 2018 Syndicated Loan (3YR) R0.775bn Aug 2018
LBK14U (2YR FRN) R0.500bn Mar 2018
LBK05 (5YR FRN) R0.752bn Feb 2019
Total R2.394bn Total R1.795bn
The total refinancing need to 31 Mar 2018 amounts to R2.662bn with a further R1.527bn to 31 Mar 2019
* - Syndicated loans could potentially be refinanced on bi-lateral basis

Land Bank Presentation 32
DMTN Programme
August 2017 Issuance – Term Sheet
DMTN Programme Details
Issuer The Land and Agricultural Development Bank of South Africa (“Land Bank”)
Issuer Rating Moody’s: Aa1.za
DMTN Programme Size R20 billion listed on the Interest Rate Market of the JSE
Transaction Details
Trade Date [30] August 2017
Settlement Date [04] September 2017
Targeted Issue Size R0.75bn across the three Notes (no single note will exceed 50% of total issuance)
Instrument Listed Floating Rate Notes
Stock Code [LBK21] [LBK22] [LBK23]
Maturity Date [04] September 2018 [04] September 2020 [04] September 2022
Term 1 year 3 years 5 years
Price Guidance [TBC]bps [TBC]bps [TBC]bps
Pricing Benchmark 3m Jibar as at Trade Date

Land Bank Presentation 33
DMTN Programme
August 2017 Issuance – Term Sheet
Auction Methodology and Allocation process
Auction time 09h00 – 11h00
Auction methodology Dutch Auction - no feedback
Contact details: Nedbank Fixed Income Sales
+2711 535 4021David Needham, Gareth Robertson, Tsikaro Mapena
Benchmark rate to be set as at 11:00 on Trade Date
Allocation across the Notes will be at the Issuers discretion
The issuer reserves the right to upsize the total issue size to R1.0bn if bids received are within guidance
The issuer reserves the right not to issue any notes should the bid spreads received be viewed as excessive
Bids to be submitted at a spread to the relevant benchmark
Bids below the final clearing spread will receive a full allocation at the clearing spread
Successful bids at the clearing spread could receive partial allocation should the book be oversubscribed

Land Bank Presentation 34
Summary
Land Bank is a sound investment proposition with:
• Strong corporate governance structures
• A well defined strategy that promotes transformation and growth inline with the NDP
• Strong external credit rating
• Well diversified sources of funding – not solely ratings dependent
• Strong financial performance despite a challenging macro-economic environment
THANK YOU!