lanco infratech - business standardsmartinvestor.business-standard.com/bscms/pdf/lanco...lanco...
TRANSCRIPT
Company Report Industry: Power
Rupa Shah ([email protected]) +91-22-66322244
Lanco Infratech
Big Leap
October 18, 2010 2
Lanco Infratech
Prabhudas Lilladher Pvt. Ltd. and/or its associates (the 'Firm') does and/or seeks to do business with companies covered in its research reports. As a result investors should be aware that the Firm may have a conflict of interest that could affect the objectivity of the report. Investors should consider this report as only a single factor in making their investment decision.
Please refer to important disclosures and disclaimers at the end of the report
Contents Page No.
Investment Highlights ................................................................................................. 4
Power portfolio breaking grounds ..................................................................................................... 4
Well-built Fuel strategy ..................................................................................................................... 5
Fuel requirements secured .......................................................................................................... 6
Perfect mix of tariff............................................................................................................................ 8
Lanco appears more defensive .................................................................................................... 9
EPC business…a strong support ....................................................................................................... 11
Other businesses ............................................................................................................................. 12
Real Estate...not a sector to be in .............................................................................................. 12
Road BOT…small footing ............................................................................................................ 12
Funding requirement …not a problem in the near term ................................................................. 13
Financial Overview .................................................................................................... 14
Valuations ...has room for upsides ........................................................................... 15
Financials .................................................................................................................. 17
Lanco Infratech
Company Report October 18, 2010
Rating Accumulate
Price Rs68
Target Price Rs83
Implied Upside 22.1%
Sensex 20,125
(Prices as on October 15, 2010)
Trading data
Market Cap. (Rs bn) 162.0
Shares o/s (m) 2,385.5
3M Avg. Daily value (Rs m) 316.9
Major shareholders
Promoters 67.95%
Foreign 19.64%
Domestic Inst. 4.46%
Public & Other 7.95%
Stock Performance
(%) 1M 6M 12M
Absolute (0.7) 17.6 28.4
Relative (3.9) (13.0) 0.6
Price Performance (RIC: LAIN.BO, BB: LANCI IN)
Source: Bloomberg
0
10
20
30
40
50
60
70
80
Oct
-09
Dec-
09
Feb-1
0
Apr-
10
Jun-1
0
Aug-1
0
Oct
-10
(Rs)
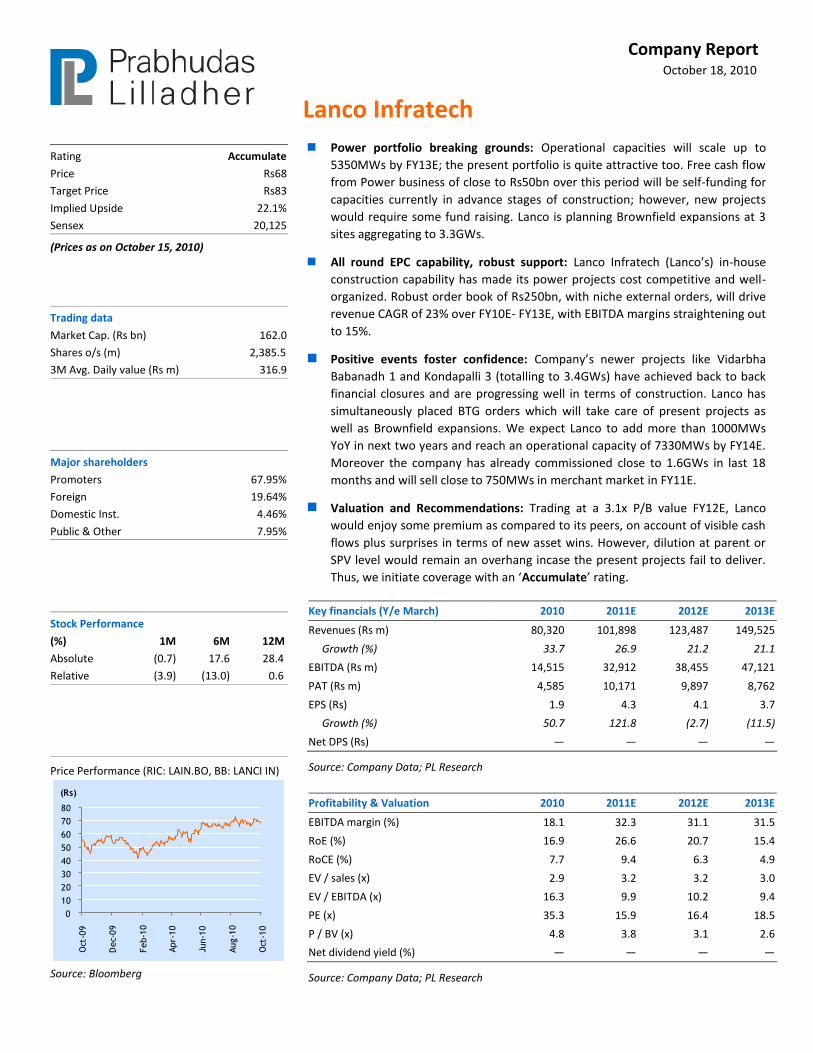
Power portfolio breaking grounds: Operational capacities will scale up to
5350MWs by FY13E; the present portfolio is quite attractive too. Free cash flow
from Power business of close to Rs50bn over this period will be self-funding for
capacities currently in advance stages of construction; however, new projects
would require some fund raising. Lanco is planning Brownfield expansions at 3
sites aggregating to 3.3GWs.
All round EPC capability, robust support: Lanco Infratech (Lanco’s) in-house
construction capability has made its power projects cost competitive and well-
organized. Robust order book of Rs250bn, with niche external orders, will drive
revenue CAGR of 23% over FY10E- FY13E, with EBITDA margins straightening out
to 15%.
Positive events foster confidence: Company’s newer projects like Vidarbha
Babanadh 1 and Kondapalli 3 (totalling to 3.4GWs) have achieved back to back
financial closures and are progressing well in terms of construction. Lanco has
simultaneously placed BTG orders which will take care of present projects as
well as Brownfield expansions. We expect Lanco to add more than 1000MWs
YoY in next two years and reach an operational capacity of 7330MWs by FY14E.
Moreover the company has already commissioned close to 1.6GWs in last 18
months and will sell close to 750MWs in merchant market in FY11E.
Valuation and Recommendations: Trading at a 3.1x P/B value FY12E, Lanco
would enjoy some premium as compared to its peers, on account of visible cash
flows plus surprises in terms of new asset wins. However, dilution at parent or
SPV level would remain an overhang incase the present projects fail to deliver.
Thus, we initiate coverage with an ‘Accumulate’ rating.
Key financials (Y/e March) 2010 2011E 2012E 2013E
Revenues (Rs m) 80,320 101,898 123,487 149,525
Growth (%) 33.7 26.9 21.2 21.1
EBITDA (Rs m) 14,515 32,912 38,455 47,121
PAT (Rs m) 4,585 10,171 9,897 8,762
EPS (Rs) 1.9 4.3 4.1 3.7
Growth (%) 50.7 121.8 (2.7) (11.5)
Net DPS (Rs) — — — —
Source: Company Data; PL Research
Profitability & Valuation 2010 2011E 2012E 2013E
EBITDA margin (%) 18.1 32.3 31.1 31.5
RoE (%) 16.9 26.6 20.7 15.4
RoCE (%) 7.7 9.4 6.3 4.9
EV / sales (x) 2.9 3.2 3.2 3.0
EV / EBITDA (x) 16.3 9.9 10.2 9.4
PE (x) 35.3 15.9 16.4 18.5
P / BV (x) 4.8 3.8 3.1 2.6
Net dividend yield (%) — — — —
Source: Company Data; PL Research
Lanco Infratech
October 18, 2010 4
Investment Highlights
Power portfolio breaking grounds
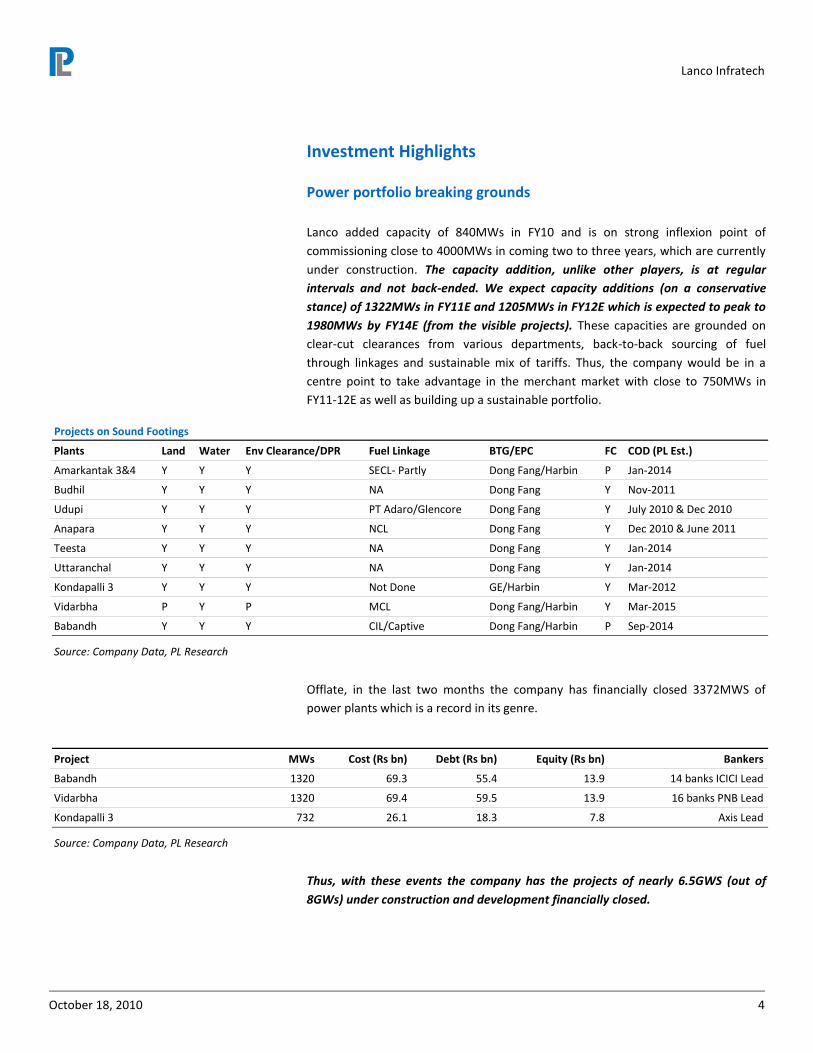
Lanco added capacity of 840MWs in FY10 and is on strong inflexion point of
commissioning close to 4000MWs in coming two to three years, which are currently
under construction. The capacity addition, unlike other players, is at regular
intervals and not back-ended. We expect capacity additions (on a conservative
stance) of 1322MWs in FY11E and 1205MWs in FY12E which is expected to peak to
1980MWs by FY14E (from the visible projects). These capacities are grounded on
clear-cut clearances from various departments, back-to-back sourcing of fuel
through linkages and sustainable mix of tariffs. Thus, the company would be in a
centre point to take advantage in the merchant market with close to 750MWs in
FY11-12E as well as building up a sustainable portfolio.
Projects on Sound Footings
Plants Land Water Env Clearance/DPR Fuel Linkage BTG/EPC FC COD (PL Est.)
Amarkantak 3&4 Y Y Y SECL- Partly Dong Fang/Harbin P Jan-2014
Budhil Y Y Y NA Dong Fang Y Nov-2011
Udupi Y Y Y PT Adaro/Glencore Dong Fang Y July 2010 & Dec 2010
Anapara Y Y Y NCL Dong Fang Y Dec 2010 & June 2011
Teesta Y Y Y NA Dong Fang Y Jan-2014
Uttaranchal Y Y Y NA Dong Fang Y Jan-2014
Kondapalli 3 Y Y Y Not Done GE/Harbin Y Mar-2012
Vidarbha P Y P MCL Dong Fang/Harbin Y Mar-2015
Babandh Y Y Y CIL/Captive Dong Fang/Harbin P Sep-2014
Source: Company Data, PL Research
Offlate, in the last two months the company has financially closed 3372MWS of
power plants which is a record in its genre.
Project MWs Cost (Rs bn) Debt (Rs bn) Equity (Rs bn) Bankers
Babandh 1320 69.3 55.4 13.9 14 banks ICICI Lead
Vidarbha 1320 69.4 59.5 13.9 16 banks PNB Lead
Kondapalli 3 732 26.1 18.3 7.8 Axis Lead
Source: Company Data, PL Research
Thus, with these events the company has the projects of nearly 6.5GWS (out of
8GWs) under construction and development financially closed.
Lanco Infratech
October 18, 2010 5
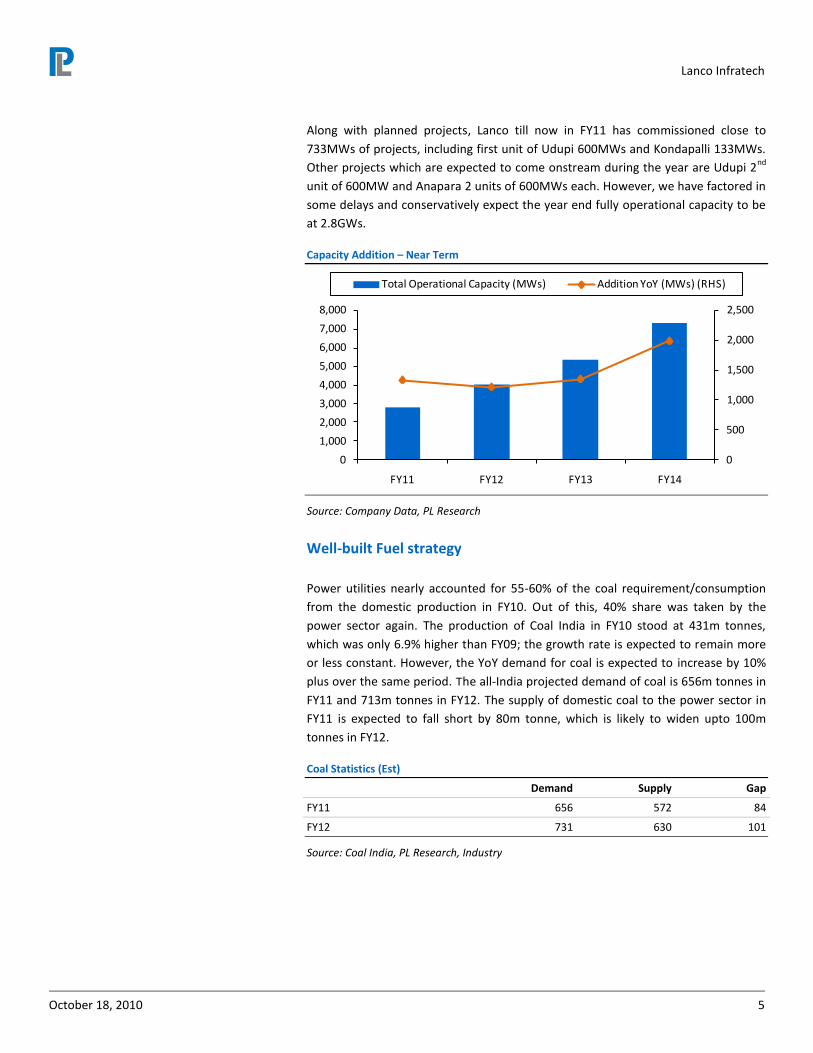
Along with planned projects, Lanco till now in FY11 has commissioned close to
733MWs of projects, including first unit of Udupi 600MWs and Kondapalli 133MWs.
Other projects which are expected to come onstream during the year are Udupi 2nd
unit of 600MW and Anapara 2 units of 600MWs each. However, we have factored in
some delays and conservatively expect the year end fully operational capacity to be
at 2.8GWs.
Capacity Addition – Near Term
0
500
1,000
1,500
2,000
2,500
0
1,000
2,000
3,000
4,000
5,000
6,000
7,000
8,000
FY11 FY12 FY13 FY14
Total Operational Capacity (MWs) Addition YoY (MWs) (RHS)
Source: Company Data, PL Research
Well-built Fuel strategy
Power utilities nearly accounted for 55-60% of the coal requirement/consumption
from the domestic production in FY10. Out of this, 40% share was taken by the
power sector again. The production of Coal India in FY10 stood at 431m tonnes,
which was only 6.9% higher than FY09; the growth rate is expected to remain more
or less constant. However, the YoY demand for coal is expected to increase by 10%
plus over the same period. The all-India projected demand of coal is 656m tonnes in
FY11 and 713m tonnes in FY12. The supply of domestic coal to the power sector in
FY11 is expected to fall short by 80m tonne, which is likely to widen upto 100m
tonnes in FY12.
Coal Statistics (Est)
Demand Supply Gap
FY11 656 572 84
FY12 731 630 101
Source: Coal India, PL Research, Industry
Lanco Infratech
October 18, 2010 6
Imports catered to 11% of the demand gap in FY10 (50m tonnes) which is expected
to increase to 15-20% in the coming 2-3 years. Over and above that, nearly 40m
tonnes would be required additionally from imports for the power plants based on
imported coal capacities. However, with higher prices and inadequate infrastructure
imported coal would be a costly affair for generation, in turn, leading to lower profits
or necessitating changes/abolishing in PPA terms. Moreover, till CY2009, roughly 200
blocks were awarded on captive basis, with reserves of 50bn tonnes, of which not
even 10% have started excavation.
Fuel requirements secured
As compared to its peers, Lanco has a very well-sketched fuel sourcing arrangement
for its 7500MW capacity (all thermal) which is expected to come onstream by FY16E.
Moreover, unlike others, the company’s reliance on imported coal is to the extent of
14.5% which is lower than peers. However, gas for the Kondapalli 3 (expansion
project) needs to be tied up from the KG basin, which would not be a problem, going
forward.
Three to four years ago, when the company had mainly won projects through Case 1
bids and through MOUs, it did face some risks attached for obtaining proper fuel
linkages. However, along with timely execution of projects, the company
simultaneously firmed up linkages, mainly from domestic sources aggregating to
5GWS. In addition to this, Lanco also has a project of 1200MWs where coal from
Indonesia is tied up and 1320MWs where captive coal mines have been allocated.
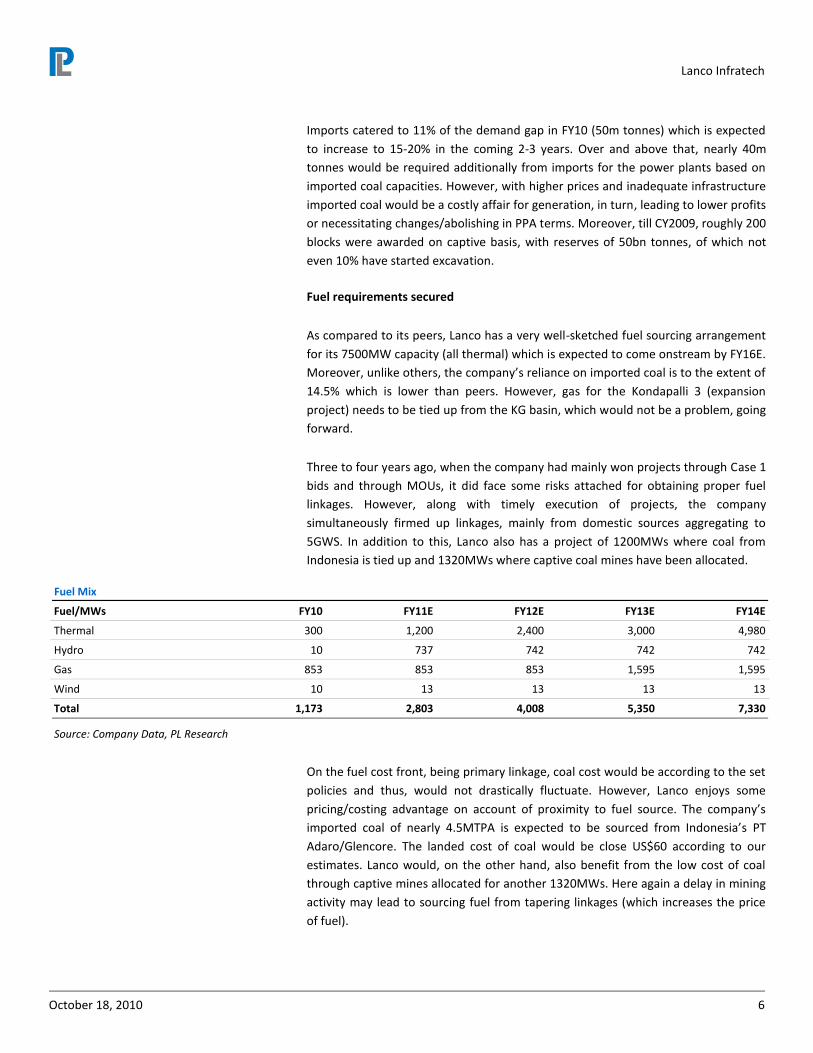
Fuel Mix
Fuel/MWs FY10 FY11E FY12E FY13E FY14E
Thermal 300 1,200 2,400 3,000 4,980
Hydro 10 737 742 742 742
Gas 853 853 853 1,595 1,595
Wind 10 13 13 13 13
Total 1,173 2,803 4,008 5,350 7,330
Source: Company Data, PL Research
On the fuel cost front, being primary linkage, coal cost would be according to the set
policies and thus, would not drastically fluctuate. However, Lanco enjoys some
pricing/costing advantage on account of proximity to fuel source. The company’s
imported coal of nearly 4.5MTPA is expected to be sourced from Indonesia’s PT
Adaro/Glencore. The landed cost of coal would be close US$60 according to our
estimates. Lanco would, on the other hand, also benefit from the low cost of coal
through captive mines allocated for another 1320MWs. Here again a delay in mining
activity may lead to sourcing fuel from tapering linkages (which increases the price
of fuel).
Lanco Infratech
October 18, 2010 7
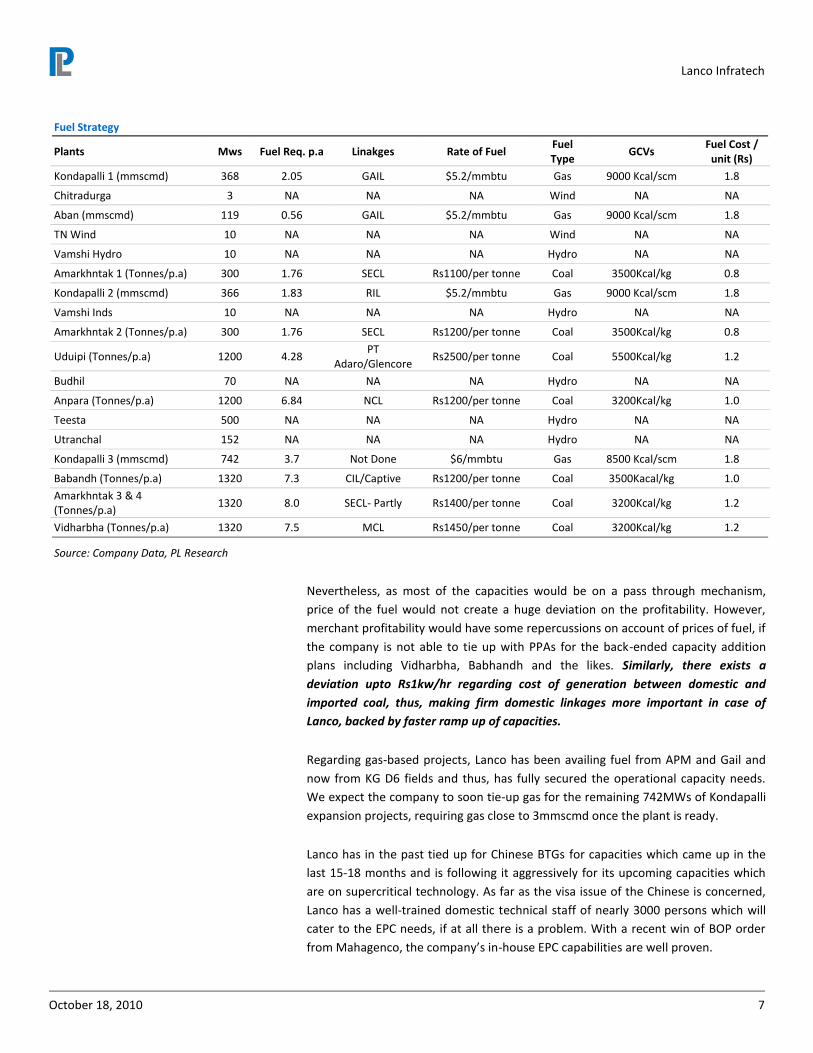
Fuel Strategy
Plants Mws Fuel Req. p.a Linakges Rate of Fuel Fuel Type
GCVs Fuel Cost /
unit (Rs)
Kondapalli 1 (mmscmd) 368 2.05 GAIL $5.2/mmbtu Gas 9000 Kcal/scm 1.8
Chitradurga 3 NA NA NA Wind NA NA
Aban (mmscmd) 119 0.56 GAIL $5.2/mmbtu Gas 9000 Kcal/scm 1.8
TN Wind 10 NA NA NA Wind NA NA
Vamshi Hydro 10 NA NA NA Hydro NA NA
Amarkhntak 1 (Tonnes/p.a) 300 1.76 SECL Rs1100/per tonne Coal 3500Kcal/kg 0.8
Kondapalli 2 (mmscmd) 366 1.83 RIL $5.2/mmbtu Gas 9000 Kcal/scm 1.8
Vamshi Inds 10 NA NA NA Hydro NA NA
Amarkhntak 2 (Tonnes/p.a) 300 1.76 SECL Rs1200/per tonne Coal 3500Kcal/kg 0.8
Uduipi (Tonnes/p.a) 1200 4.28 PT
Adaro/Glencore Rs2500/per tonne Coal 5500Kcal/kg 1.2
Budhil 70 NA NA NA Hydro NA NA
Anpara (Tonnes/p.a) 1200 6.84 NCL Rs1200/per tonne Coal 3200Kcal/kg 1.0
Teesta 500 NA NA NA Hydro NA NA
Utranchal 152 NA NA NA Hydro NA NA
Kondapalli 3 (mmscmd) 742 3.7 Not Done $6/mmbtu Gas 8500 Kcal/scm 1.8
Babandh (Tonnes/p.a) 1320 7.3 CIL/Captive Rs1200/per tonne Coal 3500Kacal/kg 1.0
Amarkhntak 3 & 4 (Tonnes/p.a)
1320 8.0 SECL- Partly Rs1400/per tonne Coal 3200Kcal/kg 1.2
Vidharbha (Tonnes/p.a) 1320 7.5 MCL Rs1450/per tonne Coal 3200Kcal/kg 1.2
Source: Company Data, PL Research
Nevertheless, as most of the capacities would be on a pass through mechanism,
price of the fuel would not create a huge deviation on the profitability. However,
merchant profitability would have some repercussions on account of prices of fuel, if
the company is not able to tie up with PPAs for the back-ended capacity addition
plans including Vidharbha, Babhandh and the likes. Similarly, there exists a
deviation upto Rs1kw/hr regarding cost of generation between domestic and
imported coal, thus, making firm domestic linkages more important in case of
Lanco, backed by faster ramp up of capacities.
Regarding gas-based projects, Lanco has been availing fuel from APM and Gail and
now from KG D6 fields and thus, has fully secured the operational capacity needs.
We expect the company to soon tie-up gas for the remaining 742MWs of Kondapalli
expansion projects, requiring gas close to 3mmscmd once the plant is ready.
Lanco has in the past tied up for Chinese BTGs for capacities which came up in the
last 15-18 months and is following it aggressively for its upcoming capacities which
are on supercritical technology. As far as the visa issue of the Chinese is concerned,
Lanco has a well-trained domestic technical staff of nearly 3000 persons which will
cater to the EPC needs, if at all there is a problem. With a recent win of BOP order
from Mahagenco, the company’s in-house EPC capabilities are well proven.
Lanco Infratech
October 18, 2010 8
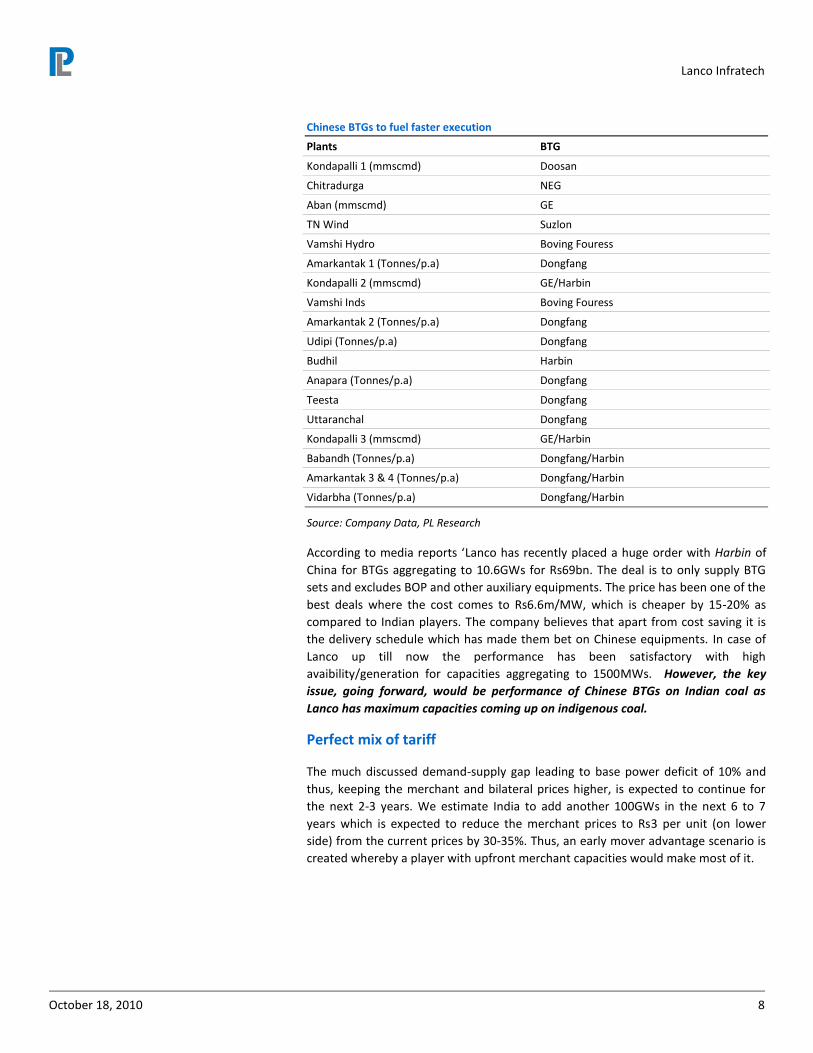
Chinese BTGs to fuel faster execution
Plants BTG
Kondapalli 1 (mmscmd) Doosan
Chitradurga NEG
Aban (mmscmd) GE
TN Wind Suzlon
Vamshi Hydro Boving Fouress
Amarkantak 1 (Tonnes/p.a) Dongfang
Kondapalli 2 (mmscmd) GE/Harbin
Vamshi Inds Boving Fouress
Amarkantak 2 (Tonnes/p.a) Dongfang
Udipi (Tonnes/p.a) Dongfang
Budhil Harbin
Anapara (Tonnes/p.a) Dongfang
Teesta Dongfang
Uttaranchal Dongfang
Kondapalli 3 (mmscmd) GE/Harbin
Babandh (Tonnes/p.a) Dongfang/Harbin
Amarkantak 3 & 4 (Tonnes/p.a) Dongfang/Harbin
Vidarbha (Tonnes/p.a) Dongfang/Harbin
Source: Company Data, PL Research
According to media reports ‘Lanco has recently placed a huge order with Harbin of
China for BTGs aggregating to 10.6GWs for Rs69bn. The deal is to only supply BTG
sets and excludes BOP and other auxiliary equipments. The price has been one of the
best deals where the cost comes to Rs6.6m/MW, which is cheaper by 15-20% as
compared to Indian players. The company believes that apart from cost saving it is
the delivery schedule which has made them bet on Chinese equipments. In case of
Lanco up till now the performance has been satisfactory with high
avaibility/generation for capacities aggregating to 1500MWs. However, the key
issue, going forward, would be performance of Chinese BTGs on Indian coal as
Lanco has maximum capacities coming up on indigenous coal.
Perfect mix of tariff
The much discussed demand-supply gap leading to base power deficit of 10% and
thus, keeping the merchant and bilateral prices higher, is expected to continue for
the next 2-3 years. We estimate India to add another 100GWs in the next 6 to 7
years which is expected to reduce the merchant prices to Rs3 per unit (on lower
side) from the current prices by 30-35%. Thus, an early mover advantage scenario is
created whereby a player with upfront merchant capacities would make most of it.
Lanco Infratech
October 18, 2010 9
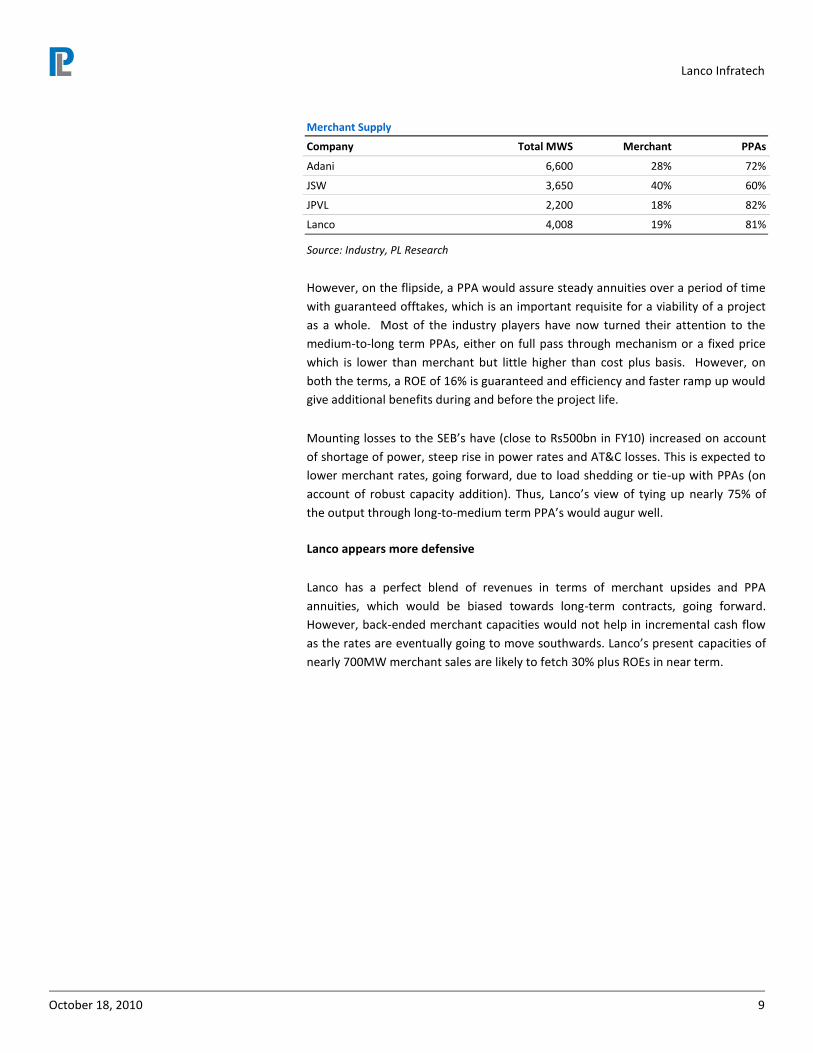
Merchant Supply
Company Total MWS Merchant PPAs
Adani 6,600 28% 72%
JSW 3,650 40% 60%
JPVL 2,200 18% 82%
Lanco 4,008 19% 81%
Source: Industry, PL Research
However, on the flipside, a PPA would assure steady annuities over a period of time
with guaranteed offtakes, which is an important requisite for a viability of a project
as a whole. Most of the industry players have now turned their attention to the
medium-to-long term PPAs, either on full pass through mechanism or a fixed price
which is lower than merchant but little higher than cost plus basis. However, on
both the terms, a ROE of 16% is guaranteed and efficiency and faster ramp up would
give additional benefits during and before the project life.
Mounting losses to the SEB’s have (close to Rs500bn in FY10) increased on account
of shortage of power, steep rise in power rates and AT&C losses. This is expected to
lower merchant rates, going forward, due to load shedding or tie-up with PPAs (on
account of robust capacity addition). Thus, Lanco’s view of tying up nearly 75% of
the output through long-to-medium term PPA’s would augur well.
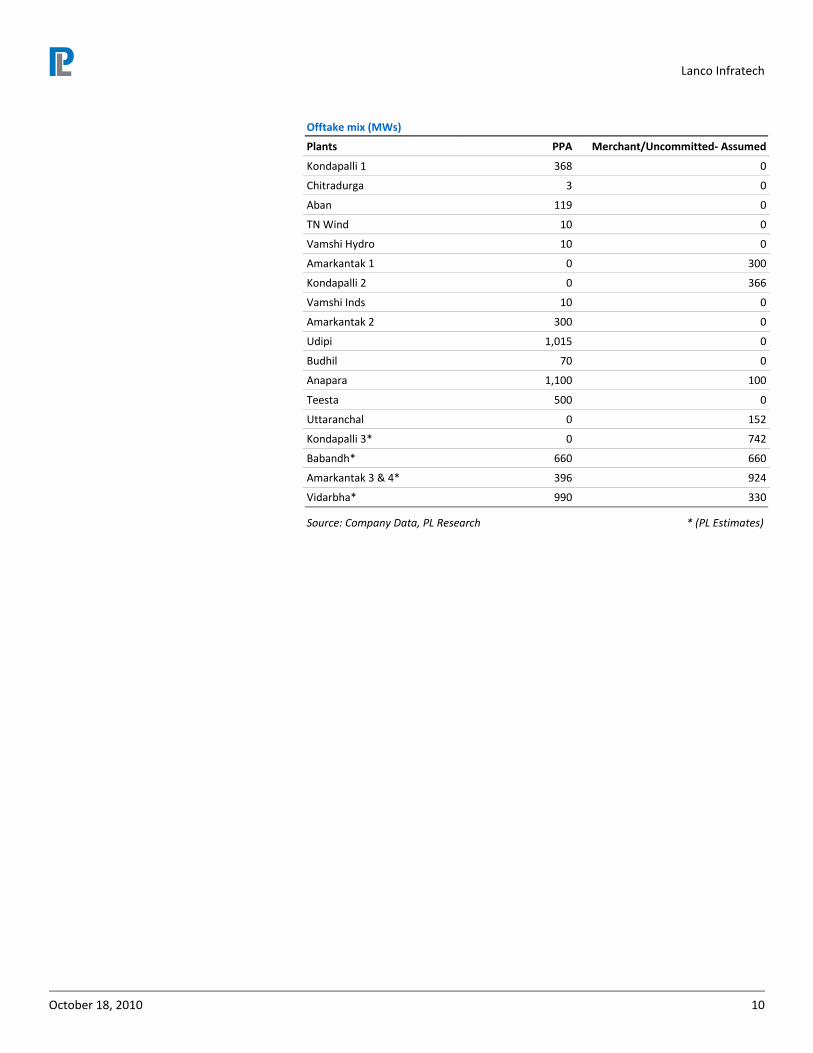
Lanco appears more defensive
Lanco has a perfect blend of revenues in terms of merchant upsides and PPA
annuities, which would be biased towards long-term contracts, going forward.
However, back-ended merchant capacities would not help in incremental cash flow
as the rates are eventually going to move southwards. Lanco’s present capacities of
nearly 700MW merchant sales are likely to fetch 30% plus ROEs in near term.
Lanco Infratech
October 18, 2010 10
Offtake mix (MWs)
Plants PPA Merchant/Uncommitted- Assumed
Kondapalli 1 368 0
Chitradurga 3 0
Aban 119 0
TN Wind 10 0
Vamshi Hydro 10 0
Amarkantak 1 0 300
Kondapalli 2 0 366
Vamshi Inds 10 0
Amarkantak 2 300 0
Udipi 1,015 0
Budhil 70 0
Anapara 1,100 100
Teesta 500 0
Uttaranchal 0 152
Kondapalli 3* 0 742
Babandh* 660 660
Amarkantak 3 & 4* 396 924
Vidarbha* 990 330
Source: Company Data, PL Research * (PL Estimates)
Lanco Infratech
October 18, 2010 11
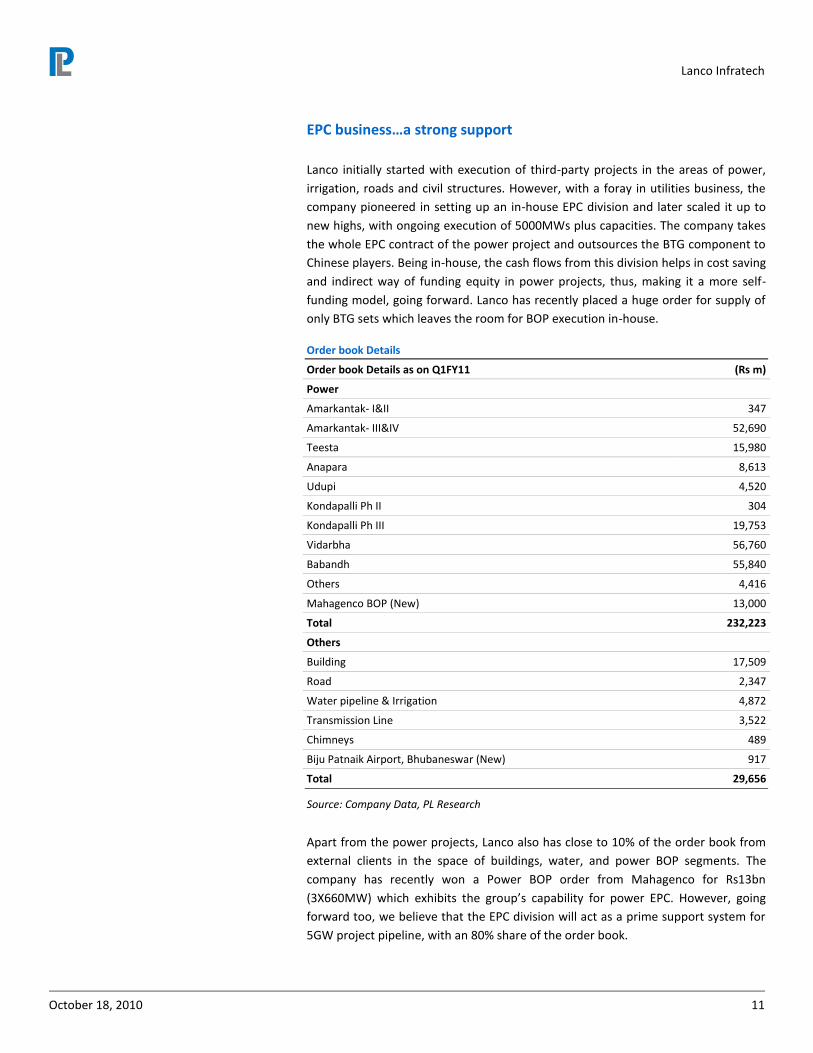
EPC business…a strong support
Lanco initially started with execution of third-party projects in the areas of power,
irrigation, roads and civil structures. However, with a foray in utilities business, the
company pioneered in setting up an in-house EPC division and later scaled it up to
new highs, with ongoing execution of 5000MWs plus capacities. The company takes
the whole EPC contract of the power project and outsources the BTG component to
Chinese players. Being in-house, the cash flows from this division helps in cost saving
and indirect way of funding equity in power projects, thus, making it a more self-
funding model, going forward. Lanco has recently placed a huge order for supply of
only BTG sets which leaves the room for BOP execution in-house.
Order book Details
Order book Details as on Q1FY11 (Rs m)
Power
Amarkantak- I&II 347
Amarkantak- III&IV 52,690
Teesta 15,980
Anapara 8,613
Udupi 4,520
Kondapalli Ph II 304
Kondapalli Ph III 19,753
Vidarbha 56,760
Babandh 55,840
Others 4,416
Mahagenco BOP (New) 13,000
Total 232,223
Others
Building 17,509
Road 2,347
Water pipeline & Irrigation 4,872
Transmission Line 3,522
Chimneys 489
Biju Patnaik Airport, Bhubaneswar (New) 917
Total 29,656
Source: Company Data, PL Research
Apart from the power projects, Lanco also has close to 10% of the order book from
external clients in the space of buildings, water, and power BOP segments. The
company has recently won a Power BOP order from Mahagenco for Rs13bn
(3X660MW) which exhibits the group’s capability for power EPC. However, going
forward too, we believe that the EPC division will act as a prime support system for
5GW project pipeline, with an 80% share of the order book.
Lanco Infratech
October 18, 2010 12
Other businesses
Apart from its core power segment growth, Lanco has other growth drivers as well
which are though smaller in size.
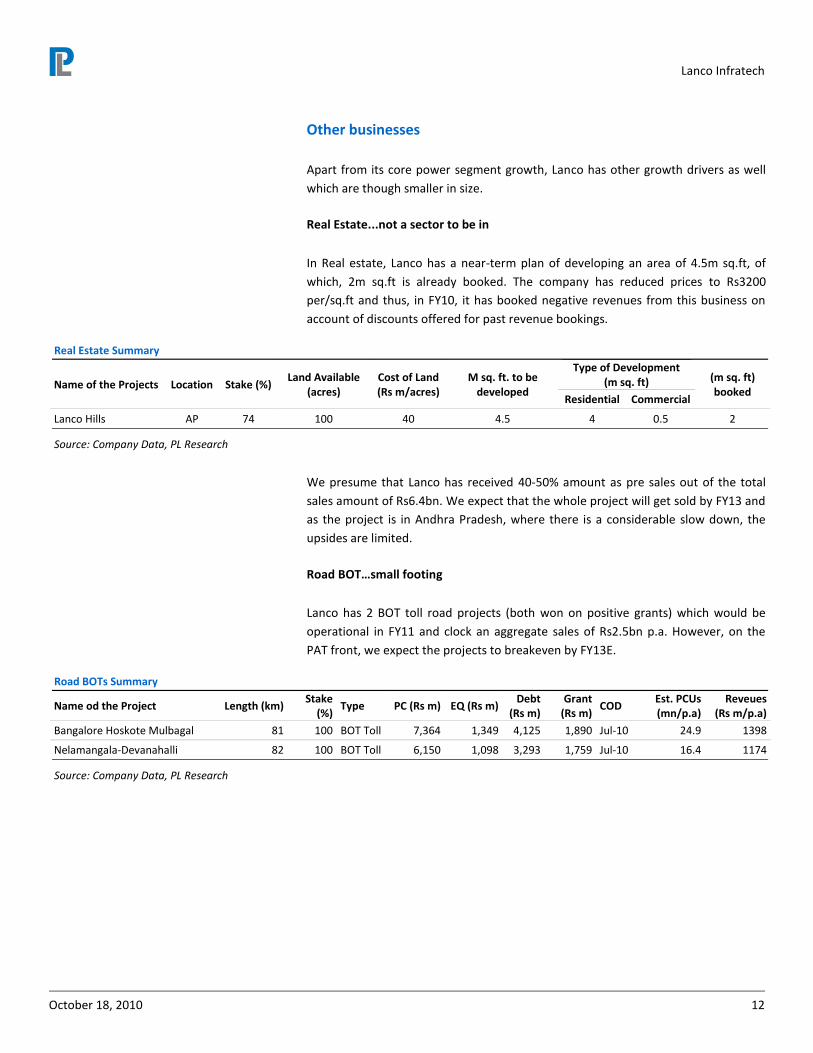
Real Estate...not a sector to be in
In Real estate, Lanco has a near-term plan of developing an area of 4.5m sq.ft, of
which, 2m sq.ft is already booked. The company has reduced prices to Rs3200
per/sq.ft and thus, in FY10, it has booked negative revenues from this business on
account of discounts offered for past revenue bookings.
Real Estate Summary
Name of the Projects Location Stake (%) Land Available
(acres) Cost of Land (Rs m/acres)
M sq. ft. to be developed
Type of Development (m sq. ft) (m sq. ft)
booked Residential Commercial
Lanco Hills AP 74 100 40 4.5 4 0.5 2
Source: Company Data, PL Research
We presume that Lanco has received 40-50% amount as pre sales out of the total
sales amount of Rs6.4bn. We expect that the whole project will get sold by FY13 and
as the project is in Andhra Pradesh, where there is a considerable slow down, the
upsides are limited.
Road BOT…small footing
Lanco has 2 BOT toll road projects (both won on positive grants) which would be
operational in FY11 and clock an aggregate sales of Rs2.5bn p.a. However, on the
PAT front, we expect the projects to breakeven by FY13E.
Road BOTs Summary
Name od the Project Length (km) Stake
(%) Type PC (Rs m) EQ (Rs m)
Debt (Rs m)
Grant (Rs m)
COD Est. PCUs (mn/p.a)
Reveues (Rs m/p.a)
Bangalore Hoskote Mulbagal 81 100 BOT Toll 7,364 1,349 4,125 1,890 Jul-10 24.9 1398
Nelamangala-Devanahalli 82 100 BOT Toll 6,150 1,098 3,293 1,759 Jul-10 16.4 1174
Source: Company Data, PL Research
Lanco Infratech
October 18, 2010 13
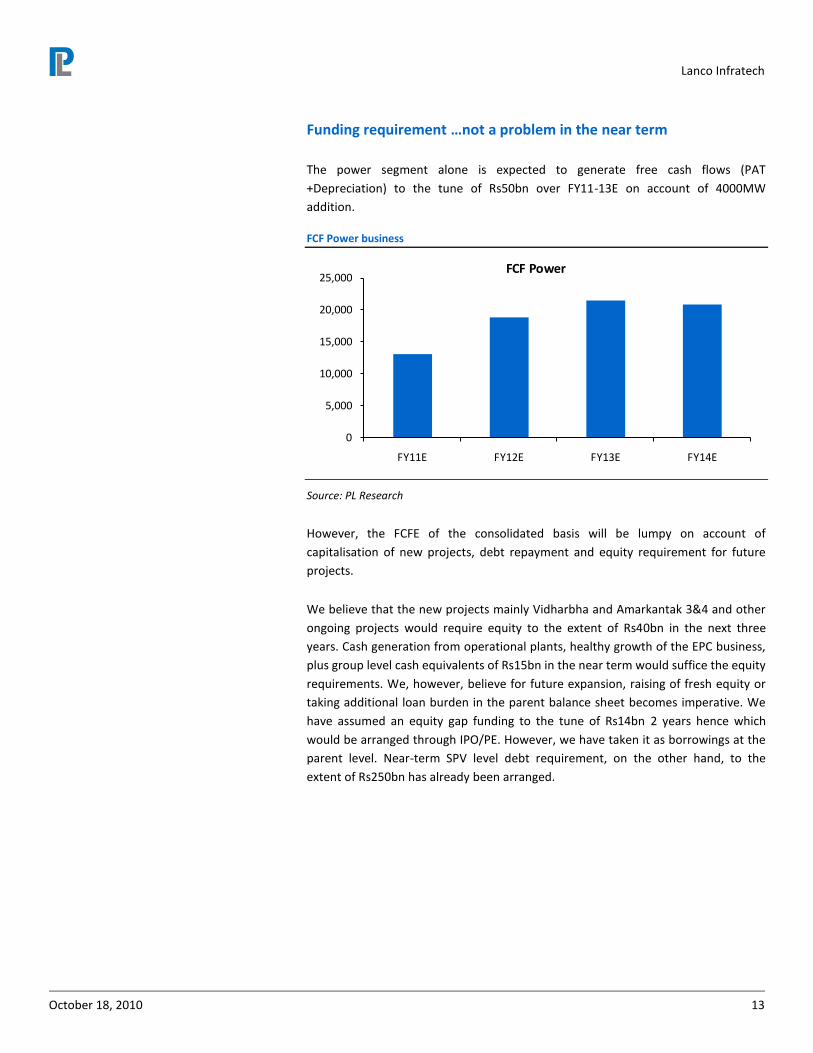
Funding requirement …not a problem in the near term
The power segment alone is expected to generate free cash flows (PAT
+Depreciation) to the tune of Rs50bn over FY11-13E on account of 4000MW
addition.
FCF Power business
0
5,000
10,000
15,000
20,000
25,000
FY11E FY12E FY13E FY14E
FCF Power
Source: PL Research
However, the FCFE of the consolidated basis will be lumpy on account of
capitalisation of new projects, debt repayment and equity requirement for future
projects.
We believe that the new projects mainly Vidharbha and Amarkantak 3&4 and other
ongoing projects would require equity to the extent of Rs40bn in the next three
years. Cash generation from operational plants, healthy growth of the EPC business,
plus group level cash equivalents of Rs15bn in the near term would suffice the equity
requirements. We, however, believe for future expansion, raising of fresh equity or
taking additional loan burden in the parent balance sheet becomes imperative. We
have assumed an equity gap funding to the tune of Rs14bn 2 years hence which
would be arranged through IPO/PE. However, we have taken it as borrowings at the
parent level. Near-term SPV level debt requirement, on the other hand, to the
extent of Rs250bn has already been arranged.
Lanco Infratech
October 18, 2010 14
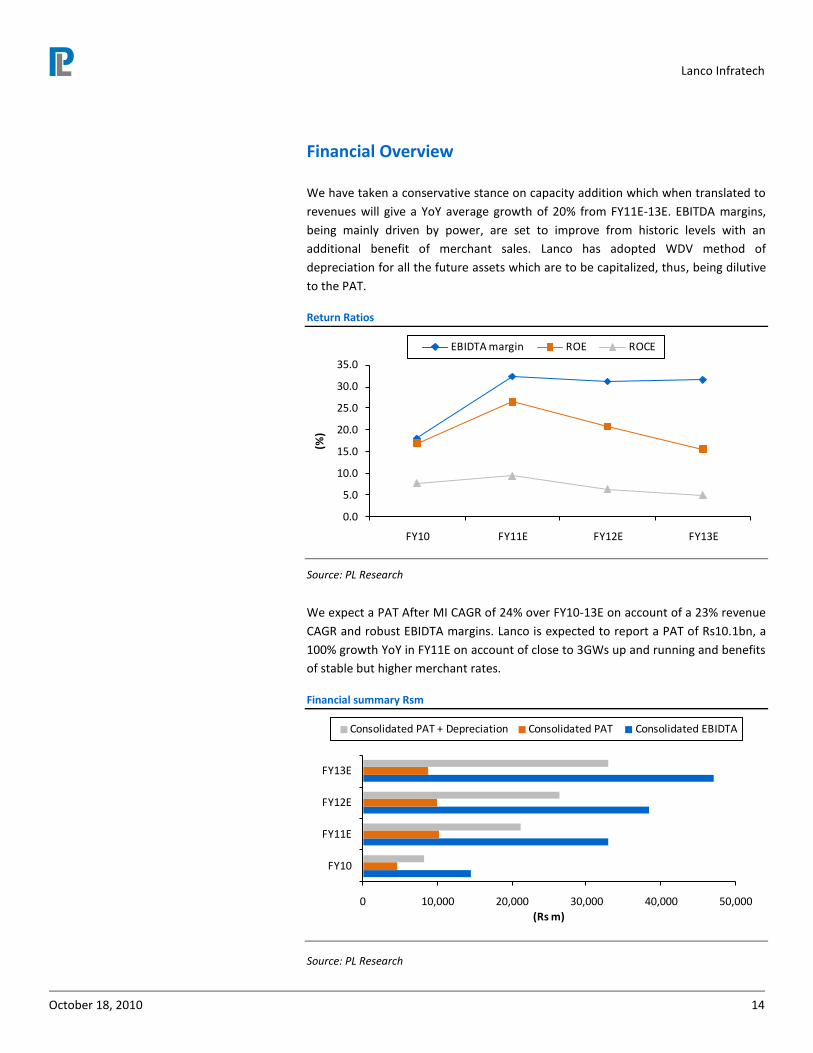
Financial Overview
We have taken a conservative stance on capacity addition which when translated to
revenues will give a YoY average growth of 20% from FY11E-13E. EBITDA margins,
being mainly driven by power, are set to improve from historic levels with an
additional benefit of merchant sales. Lanco has adopted WDV method of
depreciation for all the future assets which are to be capitalized, thus, being dilutive
to the PAT.
Return Ratios
0.0
5.0
10.0
15.0
20.0
25.0
30.0
35.0
FY10 FY11E FY12E FY13E
(%)
EBIDTA margin ROE ROCE
Source: PL Research
We expect a PAT After MI CAGR of 24% over FY10-13E on account of a 23% revenue
CAGR and robust EBIDTA margins. Lanco is expected to report a PAT of Rs10.1bn, a
100% growth YoY in FY11E on account of close to 3GWs up and running and benefits
of stable but higher merchant rates.
Financial summary Rsm
0 10,000 20,000 30,000 40,000 50,000
FY10
FY11E
FY12E
FY13E
(Rs m)
Consolidated PAT + Depreciation Consolidated PAT Consolidated EBIDTA
Source: PL Research
Lanco Infratech
October 18, 2010 15
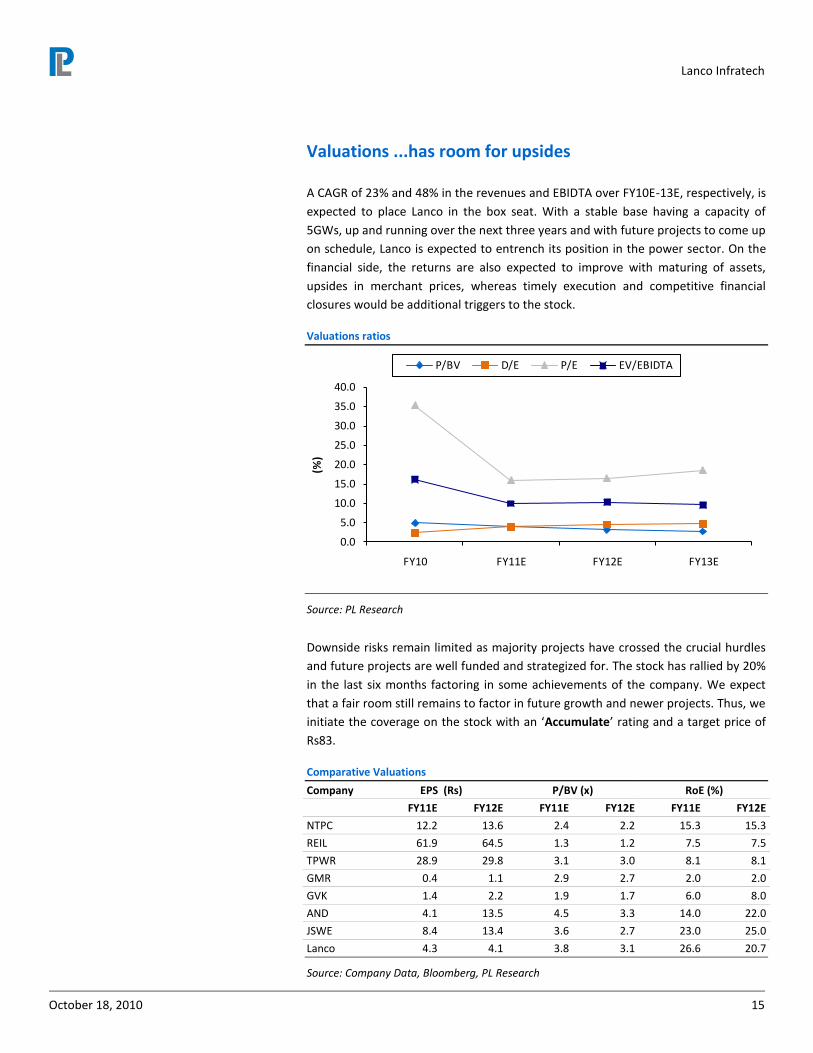
Valuations ...has room for upsides
A CAGR of 23% and 48% in the revenues and EBIDTA over FY10E-13E, respectively, is
expected to place Lanco in the box seat. With a stable base having a capacity of
5GWs, up and running over the next three years and with future projects to come up
on schedule, Lanco is expected to entrench its position in the power sector. On the
financial side, the returns are also expected to improve with maturing of assets,
upsides in merchant prices, whereas timely execution and competitive financial
closures would be additional triggers to the stock.
Valuations ratios
0.0
5.0
10.0
15.0
20.0
25.0
30.0
35.0
40.0
FY10 FY11E FY12E FY13E
(%)
P/BV D/E P/E EV/EBIDTA
Source: PL Research
Downside risks remain limited as majority projects have crossed the crucial hurdles
and future projects are well funded and strategized for. The stock has rallied by 20%
in the last six months factoring in some achievements of the company. We expect
that a fair room still remains to factor in future growth and newer projects. Thus, we
initiate the coverage on the stock with an ‘Accumulate’ rating and a target price of
Rs83.
Comparative Valuations
Company EPS (Rs) P/BV (x) RoE (%)
FY11E FY12E FY11E FY12E FY11E FY12E
NTPC 12.2 13.6 2.4 2.2 15.3 15.3
REIL 61.9 64.5 1.3 1.2 7.5 7.5
TPWR 28.9 29.8 3.1 3.0 8.1 8.1
GMR 0.4 1.1 2.9 2.7 2.0 2.0
GVK 1.4 2.2 1.9 1.7 6.0 8.0
AND 4.1 13.5 4.5 3.3 14.0 22.0
JSWE 8.4 13.4 3.6 2.7 23.0 25.0
Lanco 4.3 4.1 3.8 3.1 26.6 20.7
Source: Company Data, Bloomberg, PL Research
Lanco Infratech
October 18, 2010 16
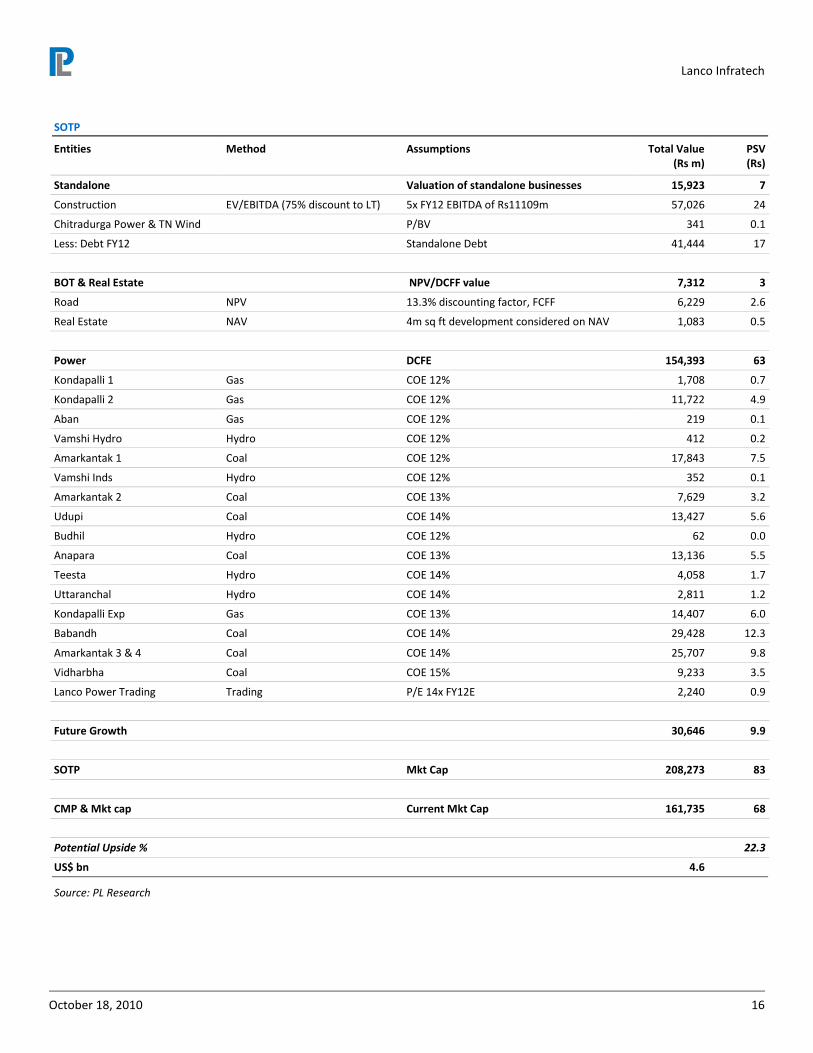
SOTP
Entities
Method
Assumptions
Total Value (Rs m)
PSV (Rs)
Standalone Valuation of standalone businesses 15,923 7
Construction EV/EBITDA (75% discount to LT) 5x FY12 EBITDA of Rs11109m 57,026 24
Chitradurga Power & TN Wind P/BV 341 0.1
Less: Debt FY12 Standalone Debt 41,444 17
BOT & Real Estate NPV/DCFF value 7,312 3
Road NPV 13.3% discounting factor, FCFF 6,229 2.6
Real Estate NAV 4m sq ft development considered on NAV 1,083 0.5
Power DCFE 154,393 63
Kondapalli 1 Gas COE 12% 1,708 0.7
Kondapalli 2 Gas COE 12% 11,722 4.9
Aban Gas COE 12% 219 0.1
Vamshi Hydro Hydro COE 12% 412 0.2
Amarkantak 1 Coal COE 12% 17,843 7.5
Vamshi Inds Hydro COE 12% 352 0.1
Amarkantak 2 Coal COE 13% 7,629 3.2
Udupi Coal COE 14% 13,427 5.6
Budhil Hydro COE 12% 62 0.0
Anapara Coal COE 13% 13,136 5.5
Teesta Hydro COE 14% 4,058 1.7
Uttaranchal Hydro COE 14% 2,811 1.2
Kondapalli Exp Gas COE 13% 14,407 6.0
Babandh Coal COE 14% 29,428 12.3
Amarkantak 3 & 4 Coal COE 14% 25,707 9.8
Vidharbha Coal COE 15% 9,233 3.5
Lanco Power Trading Trading P/E 14x FY12E 2,240 0.9
Future Growth 30,646 9.9
SOTP Mkt Cap 208,273 83
CMP & Mkt cap Current Mkt Cap 161,735 68
Potential Upside % 22.3
US$ bn 4.6
Source: PL Research
Lanco Infratech
October 18, 2010 17
Financials
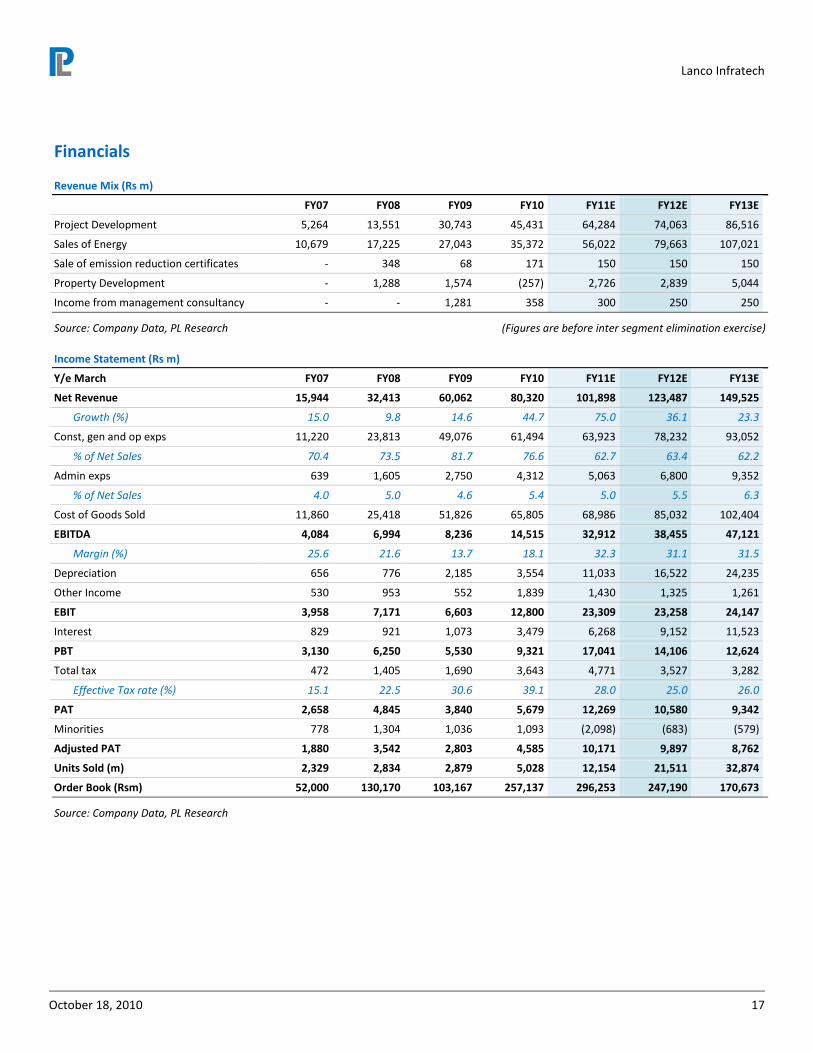
Revenue Mix (Rs m)
FY07 FY08 FY09 FY10 FY11E FY12E FY13E
Project Development 5,264 13,551 30,743 45,431 64,284 74,063 86,516
Sales of Energy 10,679 17,225 27,043 35,372 56,022 79,663 107,021
Sale of emission reduction certificates - 348 68 171 150 150 150
Property Development - 1,288 1,574 (257) 2,726 2,839 5,044
Income from management consultancy - - 1,281 358 300 250 250
Source: Company Data, PL Research (Figures are before inter segment elimination exercise)
Income Statement (Rs m)
Y/e March FY07 FY08 FY09 FY10 FY11E FY12E FY13E
Net Revenue 15,944 32,413 60,062 80,320 101,898 123,487 149,525
Growth (%) 15.0 9.8 14.6 44.7 75.0 36.1 23.3
Const, gen and op exps 11,220 23,813 49,076 61,494 63,923 78,232 93,052
% of Net Sales 70.4 73.5 81.7 76.6 62.7 63.4 62.2
Admin exps 639 1,605 2,750 4,312 5,063 6,800 9,352
% of Net Sales 4.0 5.0 4.6 5.4 5.0 5.5 6.3
Cost of Goods Sold 11,860 25,418 51,826 65,805 68,986 85,032 102,404
EBITDA 4,084 6,994 8,236 14,515 32,912 38,455 47,121
Margin (%) 25.6 21.6 13.7 18.1 32.3 31.1 31.5
Depreciation 656 776 2,185 3,554 11,033 16,522 24,235
Other Income 530 953 552 1,839 1,430 1,325 1,261
EBIT 3,958 7,171 6,603 12,800 23,309 23,258 24,147
Interest 829 921 1,073 3,479 6,268 9,152 11,523
PBT 3,130 6,250 5,530 9,321 17,041 14,106 12,624
Total tax 472 1,405 1,690 3,643 4,771 3,527 3,282
Effective Tax rate (%) 15.1 22.5 30.6 39.1 28.0 25.0 26.0
PAT 2,658 4,845 3,840 5,679 12,269 10,580 9,342
Minorities 778 1,304 1,036 1,093 (2,098) (683) (579)
Adjusted PAT 1,880 3,542 2,803 4,585 10,171 9,897 8,762
Units Sold (m) 2,329 2,834 2,879 5,028 12,154 21,511 32,874
Order Book (Rsm) 52,000 130,170 103,167 257,137 296,253 247,190 170,673
Source: Company Data, PL Research
Lanco Infratech
October 18, 2010 18
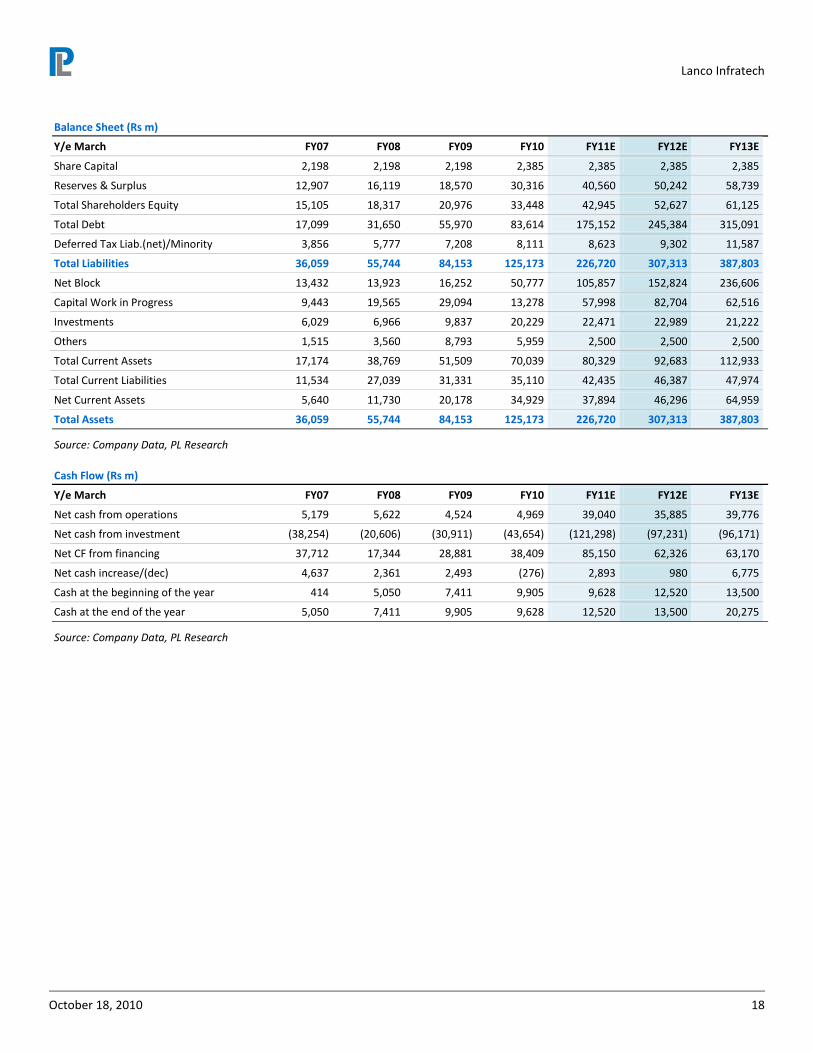
Balance Sheet (Rs m)
Y/e March FY07 FY08 FY09 FY10 FY11E FY12E FY13E
Share Capital 2,198 2,198 2,198 2,385 2,385 2,385 2,385
Reserves & Surplus 12,907 16,119 18,570 30,316 40,560 50,242 58,739
Total Shareholders Equity 15,105 18,317 20,976 33,448 42,945 52,627 61,125
Total Debt 17,099 31,650 55,970 83,614 175,152 245,384 315,091
Deferred Tax Liab.(net)/Minority 3,856 5,777 7,208 8,111 8,623 9,302 11,587
Total Liabilities 36,059 55,744 84,153 125,173 226,720 307,313 387,803
Net Block 13,432 13,923 16,252 50,777 105,857 152,824 236,606
Capital Work in Progress 9,443 19,565 29,094 13,278 57,998 82,704 62,516
Investments 6,029 6,966 9,837 20,229 22,471 22,989 21,222
Others 1,515 3,560 8,793 5,959 2,500 2,500 2,500
Total Current Assets 17,174 38,769 51,509 70,039 80,329 92,683 112,933
Total Current Liabilities 11,534 27,039 31,331 35,110 42,435 46,387 47,974
Net Current Assets 5,640 11,730 20,178 34,929 37,894 46,296 64,959
Total Assets 36,059 55,744 84,153 125,173 226,720 307,313 387,803
Source: Company Data, PL Research
Cash Flow (Rs m)
Y/e March FY07 FY08 FY09 FY10 FY11E FY12E FY13E
Net cash from operations 5,179 5,622 4,524 4,969 39,040 35,885 39,776
Net cash from investment (38,254) (20,606) (30,911) (43,654) (121,298) (97,231) (96,171)
Net CF from financing 37,712 17,344 28,881 38,409 85,150 62,326 63,170
Net cash increase/(dec) 4,637 2,361 2,493 (276) 2,893 980 6,775
Cash at the beginning of the year 414 5,050 7,411 9,905 9,628 12,520 13,500
Cash at the end of the year 5,050 7,411 9,905 9,628 12,520 13,500 20,275
Source: Company Data, PL Research
Lanco Infratech
October 18, 2010 19
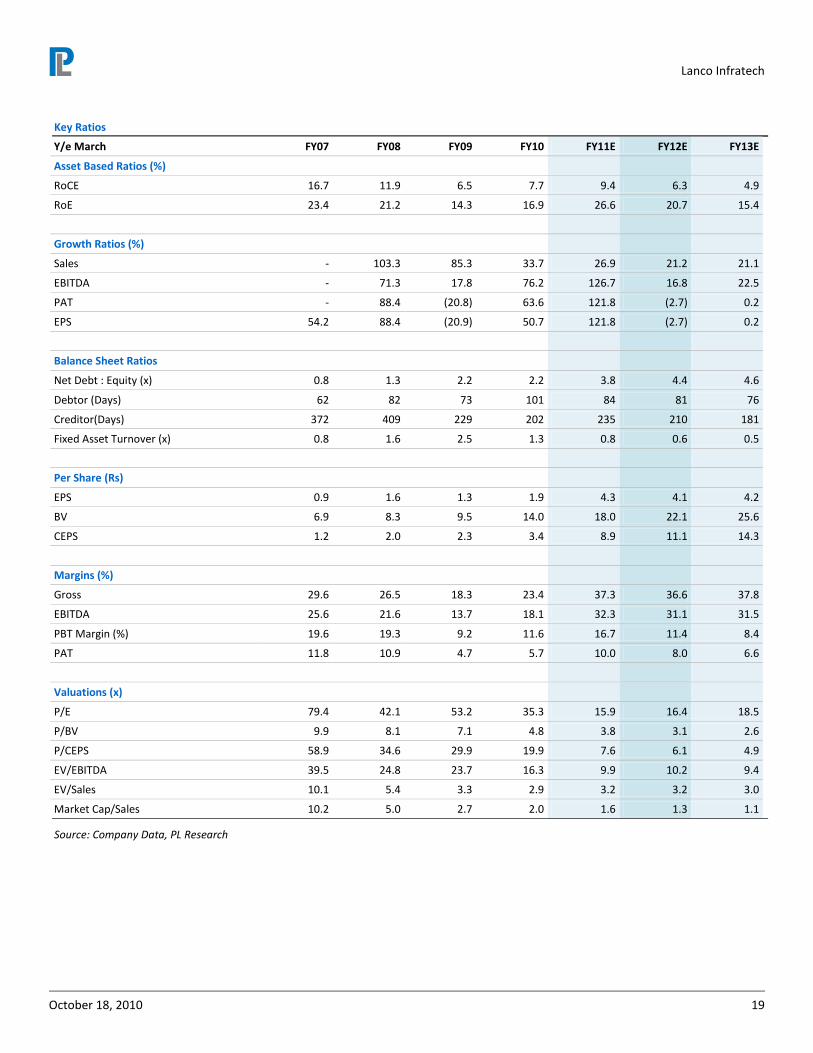
Key Ratios
Y/e March FY07 FY08 FY09 FY10 FY11E FY12E FY13E
Asset Based Ratios (%)
RoCE 16.7 11.9 6.5 7.7 9.4 6.3 4.9
RoE 23.4 21.2 14.3 16.9 26.6 20.7 15.4
Growth Ratios (%)
Sales - 103.3 85.3 33.7 26.9 21.2 21.1
EBITDA - 71.3 17.8 76.2 126.7 16.8 22.5
PAT - 88.4 (20.8) 63.6 121.8 (2.7) 0.2
EPS 54.2 88.4 (20.9) 50.7 121.8 (2.7) 0.2
Balance Sheet Ratios
Net Debt : Equity (x) 0.8 1.3 2.2 2.2 3.8 4.4 4.6
Debtor (Days) 62 82 73 101 84 81 76
Creditor(Days) 372 409 229 202 235 210 181
Fixed Asset Turnover (x) 0.8 1.6 2.5 1.3 0.8 0.6 0.5
Per Share (Rs)
EPS 0.9 1.6 1.3 1.9 4.3 4.1 4.2
BV 6.9 8.3 9.5 14.0 18.0 22.1 25.6
CEPS 1.2 2.0 2.3 3.4 8.9 11.1 14.3
Margins (%)
Gross 29.6 26.5 18.3 23.4 37.3 36.6 37.8
EBITDA 25.6 21.6 13.7 18.1 32.3 31.1 31.5
PBT Margin (%) 19.6 19.3 9.2 11.6 16.7 11.4 8.4
PAT 11.8 10.9 4.7 5.7 10.0 8.0 6.6
Valuations (x)
P/E 79.4 42.1 53.2 35.3 15.9 16.4 18.5
P/BV 9.9 8.1 7.1 4.8 3.8 3.1 2.6
P/CEPS 58.9 34.6 29.9 19.9 7.6 6.1 4.9
EV/EBITDA 39.5 24.8 23.7 16.3 9.9 10.2 9.4
EV/Sales 10.1 5.4 3.3 2.9 3.2 3.2 3.0
Market Cap/Sales 10.2 5.0 2.7 2.0 1.6 1.3 1.1
Source: Company Data, PL Research
Lanco Infratech
October 18, 2010 20
Prabhudas Lilladher Pvt. Ltd.
3rd Floor, Sadhana House, 570, P. B. Marg, Worli, Mumbai-400 018, India
Tel: (91 22) 6632 2222 Fax: (91 22) 6632 2209
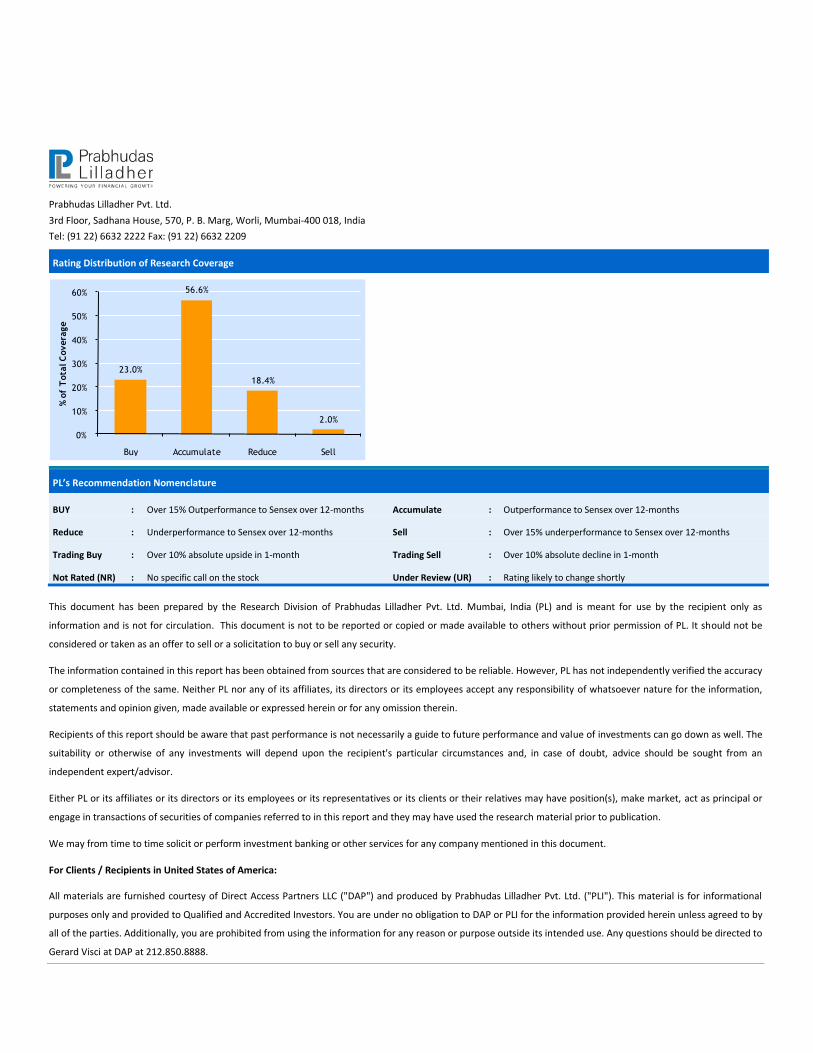
Rating Distribution of Research Coverage
23.0%
56.6%
18.4%
2.0%
0%
10%
20%
30%
40%
50%
60%
Buy Accumulate Reduce Sell
% o
f T
ota
l C
overa
ge
PL’s Recommendation Nomenclature
BUY : Over 15% Outperformance to Sensex over 12-months Accumulate : Outperformance to Sensex over 12-months
Reduce : Underperformance to Sensex over 12-months Sell : Over 15% underperformance to Sensex over 12-months
Trading Buy : Over 10% absolute upside in 1-month Trading Sell : Over 10% absolute decline in 1-month
Not Rated (NR) : No specific call on the stock Under Review (UR) : Rating likely to change shortly
This document has been prepared by the Research Division of Prabhudas Lilladher Pvt. Ltd. Mumbai, India (PL) and is meant for use by the recipient only as
information and is not for circulation. This document is not to be reported or copied or made available to others without prior permission of PL. It should not be
considered or taken as an offer to sell or a solicitation to buy or sell any security.
The information contained in this report has been obtained from sources that are considered to be reliable. However, PL has not independently verified the accuracy
or completeness of the same. Neither PL nor any of its affiliates, its directors or its employees accept any responsibility of whatsoever nature for the information,
statements and opinion given, made available or expressed herein or for any omission therein.
Recipients of this report should be aware that past performance is not necessarily a guide to future performance and value of investments can go down as well. The
suitability or otherwise of any investments will depend upon the recipient's particular circumstances and, in case of doubt, advice should be sought from an
independent expert/advisor.
Either PL or its affiliates or its directors or its employees or its representatives or its clients or their relatives may have position(s), make market, act as principal or
engage in transactions of securities of companies referred to in this report and they may have used the research material prior to publication.
We may from time to time solicit or perform investment banking or other services for any company mentioned in this document.
For Clients / Recipients in United States of America:
All materials are furnished courtesy of Direct Access Partners LLC ("DAP") and produced by Prabhudas Lilladher Pvt. Ltd. ("PLI"). This material is for informational
purposes only and provided to Qualified and Accredited Investors. You are under no obligation to DAP or PLI for the information provided herein unless agreed to by
all of the parties. Additionally, you are prohibited from using the information for any reason or purpose outside its intended use. Any questions should be directed to
Gerard Visci at DAP at 212.850.8888.