lakewood ranch sd cdd budget fiscal year 2019-2020
TRANSCRIPT

Lakewood Ranch Stewardship District
Proposed Operating Budget for General Fund -
Summary Budget For Operation & Maintenance
October 1, 2019 to September 30, 2020
Increase FINAL BUDGET
Full Year FY2020;
(Decrease) Estimated
Category 30-Sep-19 Resolution 2019-
2020 Budget vs. Buildout
36 2019 Budget Budget Budget
Sources of Funds:
Assessments - Platted Land $ 2,918,102 $ 4,326,130 67% $ 1,408,028 $ 9,731,966
Assessments - Un Platted Land $ 131,204 $ 186,747 70% $ 55,543 $ -
Landowner Contribution $ 1,956,356 $ 3,061,056 64% $ 1,104,700 $ -
Other Revenue (Park Rental Fees) $ - $ 1,000 $ 1,000 $ -
Total - Sources of Funds $ 5,005,662 $ 7,574,933 66% $ 2,569,271 $ 9,731,966
Uses of Funds
Administrative Expenditures:
Insurance $ 8,000 $ 8,000 100% $ - $ 20,000
Meeting Advertising $ 15,000 $ 15,000 100% $ - $ 20,000
Real Estate Taxes $ - $ - $ - $ -
Engineering $ 70,000 $ 70,000 100% $ - $ 75,000
Bond Agent Fees $ 30,000 $ 30,000 100% $ - $ 75,000
Legal Fees $ 100,000 $ 100,000 100% $ - $ 125,000
Accounting $ 32,000 $ 32,000 100% $ - $ 75,000
Lien Book and Tax Roll $ 139,000 $ 150,000 93% $ 11,000 $ 150,000
Annual Audit $ 17,000 $ 17,000 100% $ - $ 50,000
Trustee $ 100,000 $ 100,000 100% $ - $ 150,000
Manager $ 85,000 $ 108,000 79% $ 23,000 $ 150,000
Travel and Per Diem $ - $ - $ - $ -
Telephone $ - $ - $ - $ -
Postage $ 1,500 $ 1,500 100% $ - $ 2,657
Office Supplies $ 1,500 $ 1,500 100% $ - $ 10,629
Other Current Charges $ 3,810 $ 3,810 100% $ - $ 1,500
Dues, Licenses, Subscriptions $ 500 $ 22,000 2% $ 21,500 $ 22,000
Capital Outlay $ - $ - $ - $ -
Meeting Room Rent $ - $ - $ - $ -
Outside Services; County Administrative Fee $ - $ - $ - $ -
Total - Administrative $ 603,310 $ 658,810 92% $ 55,500 $ 926,786
Reserves $ - $ 152,578 0% $ 152,578 $ 276,375
Maintenance:
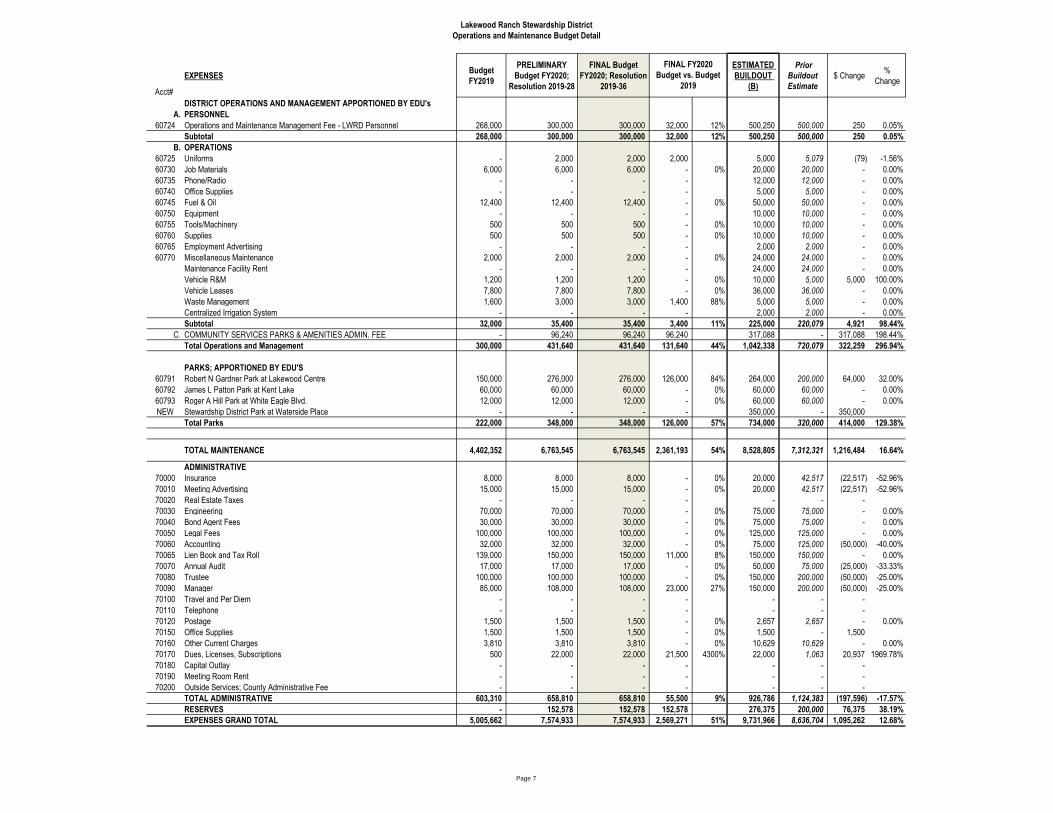
Maintenance Management Fee - allocated at buildout $ 268,000 $ 300,000 89% $ 32,000 $ 500,250
General & Parks Maintenance - allocated at buildout $ 254,000 $ 383,400 66% $ 129,400 $ 959,000
Community Services Admin. Fee $ - $ 96,240 0% $ 96,240 $ 317,088
Landscape & Irrigation Maintenance - Contracted $ 2,367,293 $ 3,626,086 65% $ 1,258,793 $ 3,908,206
Landscape & Irrigation Repairs - Non-Contracted $ 653,941 $ 901,000 73% $ 247,059 $ 991,000
Irrigation for Master Landscaping $ 556,846 $ 1,016,846 55% $ 460,000 $ 1,166,846
Environmental $ 182,300 $ 241,500 75% $ 59,200 $ 435,500
Utilities $ 6,773 $ 55,273 12% $ 48,500 $ 64,173
Other Maintenance $ 113,200 $ 143,200 79% $ 30,000 $ 186,742
Contingency $ - $ - $ - $ -
Total - Maintenance $ 4,402,352 $ 6,763,545 65% $ 2,361,193 $ 8,528,805
Total - Uses of Funds $ 5,005,662 $ 7,574,933 66% $ 2,569,271 $ 9,731,966
Operating Surplus or Deficit $ (0) $ - $ 0 $ -
Increase
Budget Final Budget (Decrease) Estimated
FY2019 FY2020; RES. 2020 Budget vs. Buildout
Maintenance Expense by Land Area: 2019-36 2019 Budget Budget
Southeast Sector $1,254,975 $1,676,873 75% $421,899 $1,720,873
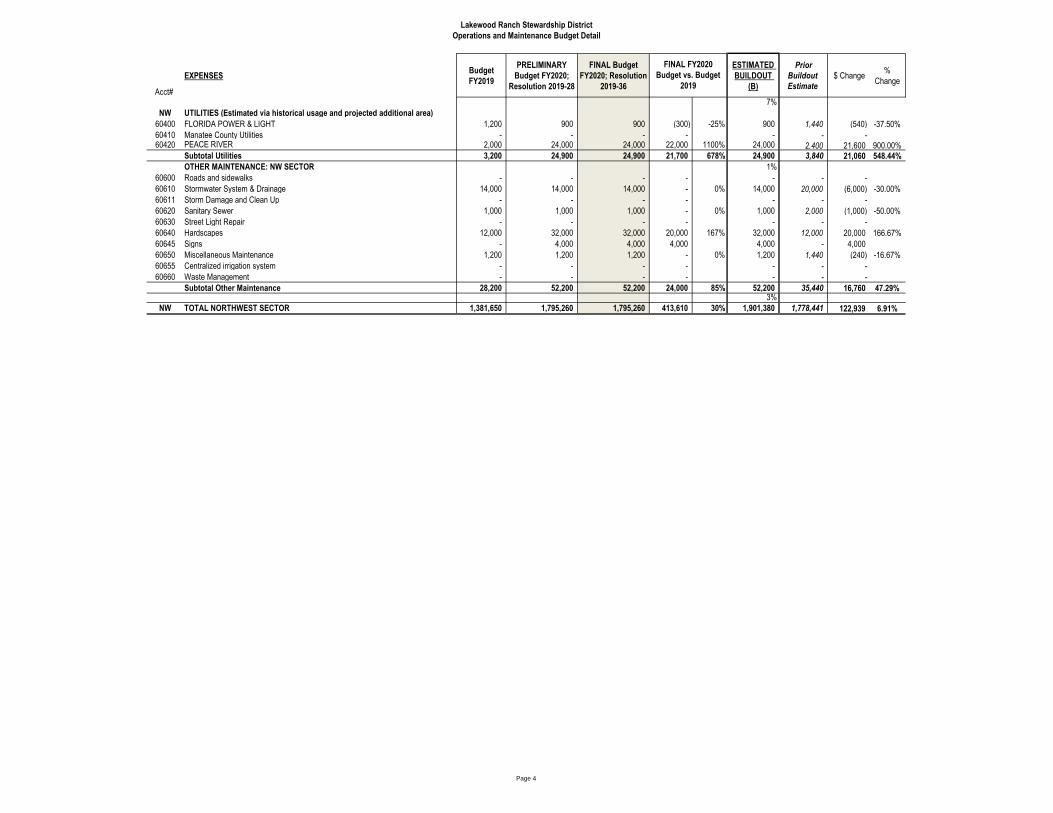
Northwest Sector $1,381,650 $1,795,260 77% $413,610 $1,901,380
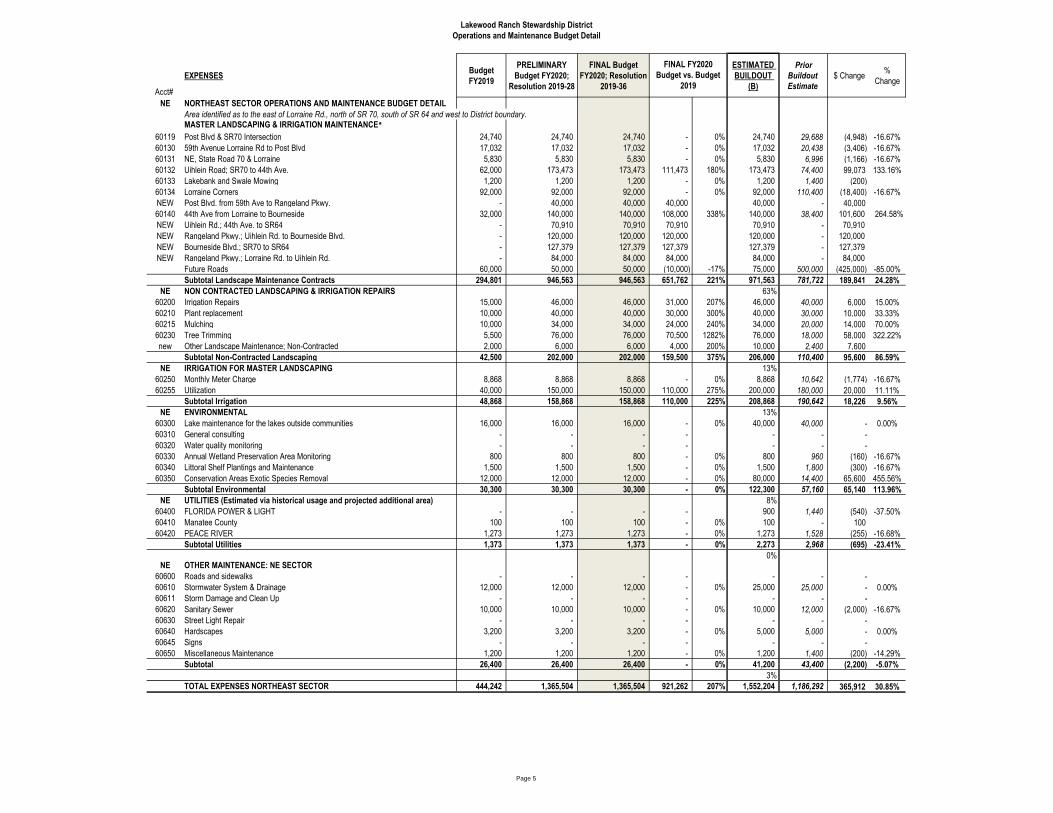
Northeast Sector $444,242 $1,365,504 33% $921,262 $1,552,204
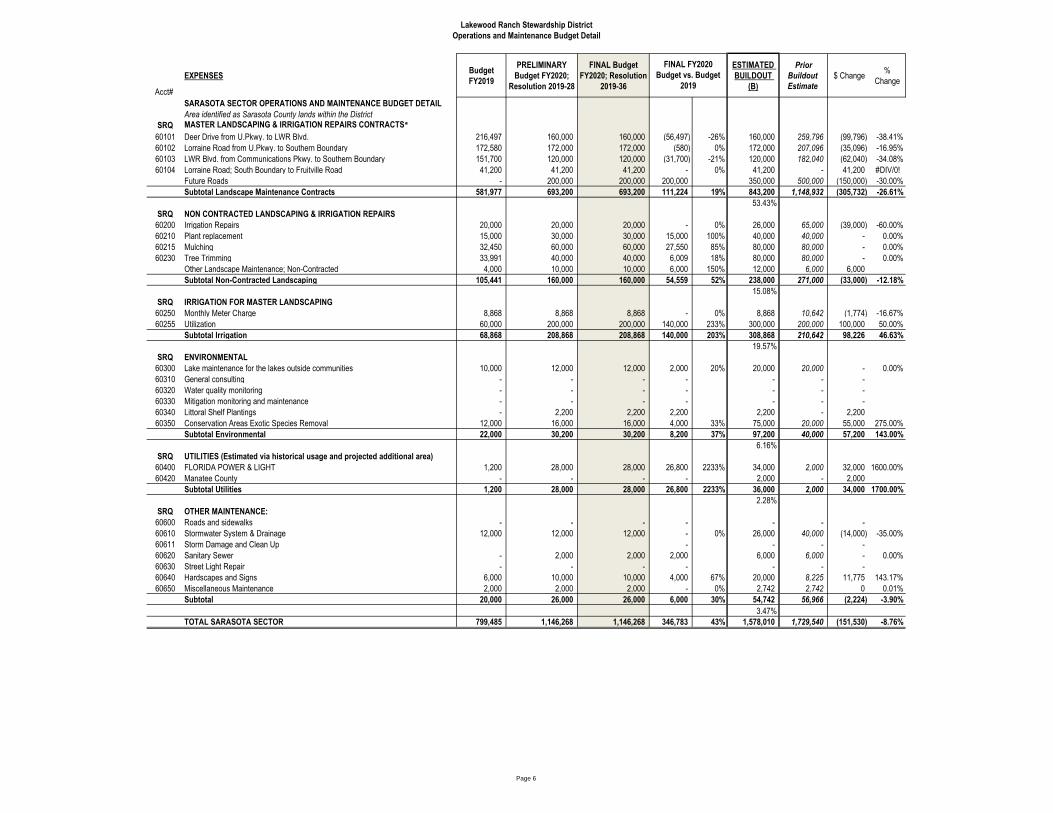
Sarasota Sector $799,485 $1,146,268 70% $346,783 $1,578,010
Other / General Maintenance $300,000 $431,640 70% $131,640 $1,042,338
Parks Maintenance $222,000 $348,000 64% $126,000 $734,000
Total $4,402,352 $6,763,545 65% $2,361,193 $8,528,805
Page 1

Lakewood Ranch Stewardship District
Operations and Maintenance Budget Detail
Acct#
SE
60101
60102
60103
60104
60106
60107
60108
60109
EXPENSES
SOUTHEAST SECTOR OPERATIONS AND MAINTENANCE BUDGET DETAIL
Area identified as around Country Club East and Lake Club MASTER LANDSCAPING & IRRIGATION MAINTENANCE CONTRACTSᵃ
University Parkway from Lorraine to Concession
The Masters Ave.; Lorraine to Players
Lorraine Rd - East side
Allocation from CDD's for UP and Lorraine medians
Bournside Blvd. from Masters to SR70
Covenant Way
Masters Ave. from Players Dr. to Bourneside Blvd.
Bourneside Blvd. from Masters to University Pkwy.
Budget
FY2019
PRELIMINARY
Budget FY2020;
Resolution 2019-28
FINAL Budget
FY2020; Resolution
2019-36
FINAL FY2020
Budget vs. Budget
2019
ESTIMATED
BUILDOUT
(B)
Prior
Buildout
Estimate
$ Change %
Change
160,000
196,573
108,150
20,173
80,000
12,978
112,000
-
350,000
204,000
105,000
20,173
108,000
12,600
110,000
60,000
350,000
204,000
105,000
20,173
108,000
12,600
110,000
60,000
190,000
7,427
(3,150)
-
28,000
(378)
(2,000)
60,000
119%
4%
-3%
0%
35%
-3%
-2%
350,000
204,000
105,000
20,173
108,000
12,600
110,000
90,000
166,000
235,888
129,780
24,208
100,000
15,574
134,400
86,000
184,000
(31,888)
(24,780)
(4,035)
8,000
(2,974)
(24,400)
4,000
110.84%
-13.52%
-19.09%
-16.67%
8.00%
-19.09%
-18.15%
4.65%
Subtotal Landscape Maintenance Contracts 689,875 969,773 969,773 279,899 41% 999,773 891,850 107,924 12.10%
SE
60200
60210
60215
60230
new
NON CONTRACTED LANDSCAPING & IRRIGATION REPAIRS
Irrigation Repairs
Plant replacement
Mulching
Tree Trimming
Other Landscape Maintenance; Non-Contracted
55,000
92,000
50,000
30,000
4,000
65,000
100,000
60,000
30,000
8,000
65,000
100,000
60,000
30,000
8,000
10,000
8,000
10,000
-
4,000
18%
9%
20%
0%
100%
58.10%
65,000
100,000
60,000
30,000
12,000
66,000
120,000
60,000
32,000
6,000
(1,000)
(20,000)
-
(2,000)
6,000
-1.52%
-16.67%
0.00%
-6.25%
Subtotal Non-Contracted Landscaping 231,000 263,000 263,000 32,000 14% 267,000 284,000 (17,000) -5.99%
SE
60250
60255
IRRIGATION FOR MASTER LANDSCAPING
Monthly Meter Charge
Utilization
10,500
220,000
10,500
320,000
10,500
320,000
-
100,000
0%
45%
15.52%
10,500
320,000
12,600
260,000
(2,100)
60,000
-16.67%
23.08%
Subtotal Irrigation 230,500 330,500 330,500 100,000 43% 330,500 272,600 57,900 21.24%
SE
60300
60310
60320
60330
60340
60350
ENVIRONMENTAL
Lake maintenance for the lakes outside communities
General consulting
Water quality monitoring
Mitigation monitoring and maintenance
Littoral Shelf Plantings
Conservation Areas Exotic Species Removal
4,000
-
-
-
-
60,000
4,000
-
-
-
-
70,000
4,000
-
-
-
-
70,000
-
-
-
-
-
10,000
0%
17%
19.21%
4,000
-
-
-
-
80,000
12,000
-
-
-
-
72,000
(8,000)
-
-
-
-
8,000
-66.67%
11.11%
Subtotal Environmental 64,000 74,000 74,000 10,000 16% 84,000 84,000 - 0.00%
SE
60400
60410
UTILITIES
FLORIDA POWER & LIGHT
Manatee County
1,000
-
1,000
-
1,000
-
-
-
0%
4.88%
1,000
-
1,200
-
(200)
-
-16.67%
Subtotal Utilities 1,000 1,000 1,000 - 0% 1,000 1,200 (200) -16.67%
60600
60610
60611
60620
60630
60640
60645
60650
60655
60660
OTHER MAINTENANCE: SE SECTOR
Roads and sidewalks
Stormwater System & Drainage
Storm Damage and Clean Up
Sanitary Sewer
Street Light Repair
Hardscapes
Signs
Miscellaneous Maintenance
Centralized irrigation system
Waste Management
2,000
20,000
5,000
-
10,000
-
1,200
400
-
2,000
20,000
-
5,000
-
10,000
-
1,200
400
-
2,000
20,000
-
5,000
-
10,000
-
1,200
400
-
-
-
-
-
-
-
-
-
-
-
0%
0%
0%
0%
0%
0%
0.06%
2,000
20,000
-
5,000
-
10,000
-
1,200
400
-
2,400
22,000
-
6,000
-
12,000
-
1,440
480
-
(400)
(2,000)
-
(1,000)
-
(2,000)
-
(240)
(80)
-
-16.67%
-9.09%
-16.67%
-16.67%
-16.67%
-16.67%
Subtotal 38,600 38,600 38,600 - 0% 38,600 44,320 (5,720) -12.91%
2.24%
SE TOTAL SOUTHEAST SECTOR 1,254,975 1,676,873 1,676,873 421,899 34% 1,720,873 1,577,970 142,904 9.06%
Page 2

Lakewood Ranch Stewardship District
Operations and Maintenance Budget Detail
Budget EXPENSES
FY2019
Acct#
NW NORTHWEST SECTOR OPERATIONS AND MAINTENANCE BUDGET DETAIL
Area identified as to the east of LWR Blvd, north of SR 70, south of SR 64 and west of Lorraine Rd. MASTER LANDSCAPING & IRRIGATION MAINTENANCE CONTRACTSᵃ
PRELIMINARY
Budget FY2020;
Resolution 2019-28
FINAL Budget
FY2020; Resolution
2019-36
FINAL FY2020
Budget vs. Budget
2019
ESTIMATED
BUILDOUT
(B)
Prior
Buildout
Estimate
% $ Change
Change
60111 White Eagle Blvd from SR 70 to Malachite 23,694 96,000 96,000 72,306 305% 96,000 28,433 67,567 237.64%
60112 Rangeland Pkwy form LWR Blvd to White Eagle 27,093 68,000 68,000 40,907 151% 68,000 32,512 35,488 109.16%
60113 Kent Lake & Lake Bank Maintenance 37,136 37,000 37,000 (136) 0% 37,000 44,563 (7,563) -16.97%
60114 Malachite Road; east of White Eagle 18,120 - - (18,120) -100% 18,120 21,744 (3,624) -16.67%
60115 44th Ave from Rosedale to White Eagle 34,089 85,000 85,000 50,911 149% 84,000 40,907 43,093 105.35%
60116 Malachite Road from LWR Blvd. to White Eagle 12,978 30,000 30,000 17,022 131% 30,000 15,574 14,426 92.63%
60117 White Eagle from Rangleland to 44th Ave 10,296 - - (10,296) -100% - 12,355 (12,355) -100.00%
60118 Lake Bank mowing 15,450 15,450 15,450 - 0% 15,450 18,540 (3,090) -16.67%
60119 Rangeland Pkwy from White Eagle to Esplanade 9,072 22,800 22,800 13,728 151% 22,800 10,887 11,913 109.43%
60120 LWR Blvd.; SR70 to Malachite 43,436 48,000 48,000 4,564 11% 48,000 52,124 (4,124) -7.91%
60121 LWR Blvd.; Malachite to SR64 81,605 88,000 88,000 6,395 8% 88,000 97,926 (9,926) -10.14%
60132 White Eagle from Malachite to 44th Ave 47,380 42,000 42,000 (5,380) -11% 42,000 56,856 (14,856) -26.13%
60133 White Eagle from 44th Ave to Gatewood Dr. 164,800 164,800 164,800 - 0% 164,800 197,760 (32,960) -16.67%
60134 White Eagle from Gatewood Dr. to SR64 - 20,000 20,000 20,000 20,000 28,000 (8,000) -28.57%
60135 Silver Palm Blvd. 5,974 7,440 7,440 1,466 25% 7,440 7,169 271 3.78%
60136 Wood Fern Trail 53,560 53,560 53,560 - 0% 53,560 64,272 (10,712) -16.67%
60137 Gatewood Drive 51,500 48,500 48,500 (3,000) -6% 48,500 61,800 (13,300) -21.52%
60138 44th Ave from White Eagle Blvd. to Indigo 36,050 40,000 40,000 3,950 11% 40,000 43,260 (3,260) -7.54%
60139 44th Ave from Indigo to Lorraine 31,386 14,000 14,000 (17,386) -55% 14,000 37,663 (23,663) -62.83%
60141 Silver Falls Run 10,421 30,000 30,000 19,579 188% 30,000 12,505 17,495 139.90%
60142 117th Street 86,600 80,000 80,000 (6,600) -8% 80,000 88,000 (8,000)
60143 Rangeland Pkwy. from Esplanade to Lorraine - 26,000 26,000 26,000 26,000 80,000 (54,000)
NEW Newhaven Blvd. - - - - 60,000 - 60,000
Subtotal Landscape Maintenance Contracts 800,640 1,016,550 1,016,550 215,910 27% 1,093,670 1,052,849 40,821 3.88%
NW NON CONTRACTED LANDSCAPING & IRRIGATION REPAIRS
58%
60200 Irrigation Repairs 55,000 62,000 62,000 7,000 13% 62,000 75,000 (13,000) -17.33%
60210 Plant replacement 42,000 42,000 42,000 - 0% 42,000 62,000 (20,000) -32.26%
60215 Mulching 98,000 100,000 100,000 2,000 2% 100,000 106,000 (6,000) -5.66%
60230 Tree Trimming 76,000 64,000 64,000 (12,000) -16% 64,000 104,180 (40,180) -38.57%
Other Landscape Maintenance; Non-Contracted 4,000 8,000 8,000 4,000 100% 12,000 4,800 7,200
Subtotal Non-Contracted Landscaping 275,000 276,000 276,000 1,000 0% 280,000 351,980 (71,980) -20.45%
NW IRRIGATION FOR MASTER LANDSCAPING
15%
60250 Monthly Meter Charge 8,610 8,610 8,610 - 0% 8,610 10,332 (1,722) -16.67%
60255 Utilization 200,000 310,000 310,000 110,000 55% 310,000 250,000 60,000 24.00%
Subtotal Irrigation 208,610 318,610 318,610 110,000 53% 318,610 260,332 58,278 22.39%
NW ENVIRONMENTAL
17%
60300 Lake maintenance for the lakes outside communities 26,000
60310 General consulting -
60320 Water quality monitoring -
60330 Mitigation monitoring and maintenance -
60340 Littoral Shelf Plantings -
60350 Conservation Areas Exotic Species Removal 40,000
32,000
-
-
-
-
75,000
32,000
-
-
-
-
75,000
6,000
-
-
-
-
35,000
23%
88%
32,000
-
-
-
-
100,000
28,000
-
-
-
-
46,000
4,000 14.29%
-
-
-
-
54,000 117.39%
Subtotal Environmental 66,000 107,000 107,000 41,000 62% 132,000 74,000 58,000 78.38%
Page 3
Lakewood Ranch Stewardship District
Operations and Maintenance Budget Detail
FINAL FY2020 PRELIMINARY FINAL Budget ESTIMATED
900
-24,000
24,900
-
14,000
-
1,000
-
32,000
4,000
1,200
-
-
52,200
1,795,260
Prior Budget %
Budget vs. Budget EXPENSES Budget FY2020; FY2020; Resolution BUILDOUT Buildout $ Change FY2019 Change
2019 Estimate Resolution 2019-28 2019-36 (B) Acct#
7%
NW UTILITIES (Estimated via historical usage and projected additional area)
60400 FLORIDA POWER & LIGHT 1,200 900 (300) -25% 900 1,440 (540) -37.50%
60410 Manatee County Utilities - - - - - -60420 PEACE RIVER 2,000 24,000 22,000 1100% 24,000 21,600 900.00% 2,400
Subtotal Utilities 3,200 24,900 21,700 678% 24,900 3,840 21,060 548.44%
OTHER MAINTENANCE: NW SECTOR 1%
60600 Roads and sidewalks - - - - - -
60610 Stormwater System & Drainage 14,000 14,000 - 0% 14,000 20,000 (6,000) -30.00%
60611 Storm Damage and Clean Up - - - - - -
60620 Sanitary Sewer 1,000 1,000 - 0% 1,000 2,000 (1,000) -50.00%
60630 Street Light Repair - - - - - -
60640 Hardscapes 12,000 32,000 20,000 167% 32,000 12,000 20,000 166.67%
60645 Signs - 4,000 4,000 4,000 - 4,000
60650 Miscellaneous Maintenance 1,200 1,200 - 0% 1,200 1,440 (240) -16.67%
60655 Centralized irrigation system - - - - - -
60660 Waste Management - - - - - -
Subtotal Other Maintenance 28,200 52,200 24,000 85% 52,200 35,440 16,760 47.29% 3%
NW TOTAL NORTHWEST SECTOR 1,381,650 1,795,260 413,610 30% 1,901,380 1,778,441 122,939 6.91%
Page 4
Lakewood Ranch Stewardship District
Operations and Maintenance Budget Detail
Acct#
NE
60119
60130
60131
60132
60133
60134
NEW
60140
NEW
NEW
NEW
NEW
Budget EXPENSES
FY2019
NORTHEAST SECTOR OPERATIONS AND MAINTENANCE BUDGET DETAIL
Area identified as to the east of Lorraine Rd., north of SR 70, south of SR 64 and west to District bouMASTER LANDSCAPING & IRRIGATION MAINTENANCEᵃ
Post Blvd & SR70 Intersection 24,740
59th Avenue Lorraine Rd to Post Blvd 17,032
NE, State Road 70 & Lorraine 5,830
Uihlein Road; SR70 to 44th Ave. 62,000
Lakebank and Swale Mowing 1,200
Lorraine Corners 92,000
Post Blvd. from 59th Ave to Rangeland Pkwy. -
44th Ave from Lorraine to Bourneside 32,000
Uihlein Rd.; 44th Ave. to SR64 -
Rangeland Pkwy.; Uihlein Rd. to Bourneside Blvd. -
Bourneside Blvd.; SR70 to SR64 -
Rangeland Pkwy.; Lorraine Rd. to Uihlein Rd. -
Future Roads 60,000
PRELIMINARY
Budget FY2020;
Resolution 2019-28
FINAL Budget
FY2020; Resolution
2019-36
FINAL FY2020
Budget vs. Budget
2019
ESTIMATED
BUILDOUT
(B)
Prior
Buildout
Estimate
$ Change %
Change
ndary.
24,740
17,032
5,830
173,473
1,200
92,000
40,000
140,000
70,910
120,000
127,379
84,000
50,000
24,740
17,032
5,830
173,473
1,200
92,000
40,000
140,000
70,910
120,000
127,379
84,000
50,000
-
-
-
111,473
-
-
40,000
108,000
70,910
120,000
127,379
84,000
(10,000)
0%
0%
0%
180%
0%
0%
338%
-17%
24,740
17,032
5,830
173,473
1,200
92,000
40,000
140,000
70,910
120,000
127,379
84,000
75,000
29,688
20,438
6,996
74,400
1,400
110,400
-
38,400
-
-
-
-
500,000
(4,948)
(3,406)
(1,166)
99,073
(200)
(18,400)
40,000
101,600
70,910
120,000
127,379
84,000
(425,000)
-16.67%
-16.67%
-16.67%
133.16%
-16.67%
264.58%
-85.00%
Subtotal Landscape Maintenance Contracts 294,801 946,563 946,563 651,762 221% 971,563 781,722 189,841 24.28%
NE
60200
60210
60215
60230
new
NON CONTRACTED LANDSCAPING & IRRIGATION REPAIRS
Irrigation Repairs 15,000
Plant replacement 10,000
Mulching 10,000
Tree Trimming 5,500
Other Landscape Maintenance; Non-Contracted 2,000
46,000
40,000
34,000
76,000
6,000
46,000
40,000
34,000
76,000
6,000
31,000
30,000
24,000
70,500
4,000
207%
300%
240%
1282%
200%
63%
46,000
40,000
34,000
76,000
10,000
40,000
30,000
20,000
18,000
2,400
6,000
10,000
14,000
58,000
7,600
15.00%
33.33%
70.00%
322.22%
Subtotal Non-Contracted Landscaping 42,500 202,000 202,000 159,500 375% 206,000 110,400 95,600 86.59%
NE
60250
60255
IRRIGATION FOR MASTER LANDSCAPING
Monthly Meter Charge 8,868
Utilization 40,000
8,868
150,000
8,868
150,000
-
110,000
0%
275%
13%
8,868
200,000
10,642
180,000
(1,774)
20,000
-16.67%
11.11%
Subtotal Irrigation 48,868 158,868 158,868 110,000 225% 208,868 190,642 18,226 9.56%
NE
60300
60310
60320
60330
60340
60350
ENVIRONMENTAL
Lake maintenance for the lakes outside communities 16,000
General consulting -
Water quality monitoring -
Annual Wetland Preservation Area Monitoring 800
Littoral Shelf Plantings and Maintenance 1,500
Conservation Areas Exotic Species Removal 12,000
16,000
-
-
800
1,500
12,000
16,000
-
-
800
1,500
12,000
-
-
-
-
-
-
0%
0%
0%
0%
13%
40,000
-
-
800
1,500
80,000
40,000
-
-
960
1,800
14,400
-
-
-
(160)
(300)
65,600
0.00%
-16.67%
-16.67%
455.56%
Subtotal Environmental 30,300 30,300 30,300 - 0% 122,300 57,160 65,140 113.96%
NE
60400
60410
60420
UTILITIES (Estimated via historical usage and projected additional area)
FLORIDA POWER & LIGHT -
Manatee County 100
PEACE RIVER 1,273
-
100
1,273
-
100
1,273
-
-
-
0%
0%
8%
900
100
1,273
1,440
-
1,528
(540)
100
(255)
-37.50%
-16.68%
Subtotal Utilities 1,373 1,373 1,373 - 0% 2,273 2,968 (695) -23.41%
NE
60600
60610
60611
60620
60630
60640
60645
60650
OTHER MAINTENANCE: NE SECTOR
Roads and sidewalks -
Stormwater System & Drainage 12,000
Storm Damage and Clean Up -
Sanitary Sewer 10,000
Street Light Repair -
Hardscapes 3,200
Signs -
Miscellaneous Maintenance 1,200
-
12,000
-
10,000
-
3,200
-
1,200
-
12,000
-
10,000
-
3,200
-
1,200
-
-
-
-
-
-
-
-
0%
0%
0%
0%
0%
-
25,000
-
10,000
-
5,000
-
1,200
-
25,000
-
12,000
-
5,000
-
1,400
-
-
-
(2,000)
-
-
-
(200)
0.00%
-16.67%
0.00%
-14.29%
Subtotal 26,400 26,400 26,400 - 0% 41,200 43,400 (2,200) -5.07%
3%
TOTAL EXPENSES NORTHEAST SECTOR 444,242 1,365,504 1,365,504 921,262 207% 1,552,204 1,186,292 365,912 30.85%
Page 5
Lakewood Ranch Stewardship District
Operations and Maintenance Budget Detail
Acct#
SRQ
60101
60102
60103
60104
EXPENSES
SARASOTA SECTOR OPERATIONS AND MAINTENANCE BUDGET DETAIL
Area identified as Sarasota County lands within the District MASTER LANDSCAPING & IRRIGATION REPAIRS CONTRACTSᵃ
Deer Drive from U.Pkwy. to LWR Blvd.
Lorraine Road from U.Pkwy. to Southern Boundary
LWR Blvd. from Communications Pkwy. to Southern Boundary
Lorraine Road; South Boundary to Fruitville Road
Future Roads
Budget
FY2019
PRELIMINARY
Budget FY2020;
Resolution 2019-28
FINAL Budget
FY2020; Resolution
2019-36
FINAL FY2020
Budget vs. Budget
2019
ESTIMATED
BUILDOUT
(B)
Prior
Buildout
Estimate
$ Change %
Change
216,497
172,580
151,700
41,200
-
160,000
172,000
120,000
41,200
200,000
160,000
172,000
120,000
41,200
200,000
(56,497)
(580)
(31,700)
-
200,000
-26%
0%
-21%
0%
160,000
172,000
120,000
41,200
350,000
259,796
207,096
182,040
-
500,000
(99,796)
(35,096)
(62,040)
41,200
(150,000)
-38.41%
-16.95%
-34.08%
#DIV/0!
-30.00%
Subtotal Landscape Maintenance Contracts 581,977 693,200 693,200 111,224 19% 843,200 1,148,932 (305,732) -26.61%
SRQ
60200
60210
60215
60230
NON CONTRACTED LANDSCAPING & IRRIGATION REPAIRS
Irrigation Repairs
Plant replacement
Mulching
Tree Trimming
Other Landscape Maintenance; Non-Contracted
20,000
15,000
32,450
33,991
4,000
20,000
30,000
60,000
40,000
10,000
20,000
30,000
60,000
40,000
10,000
-
15,000
27,550
6,009
6,000
0%
100%
85%
18%
150%
53.43%
26,000
40,000
80,000
80,000
12,000
65,000
40,000
80,000
80,000
6,000
(39,000)
-
-
-
6,000
-60.00%
0.00%
0.00%
0.00%
Subtotal Non-Contracted Landscaping 105,441 160,000 160,000 54,559 52% 238,000 271,000 (33,000) -12.18%
SRQ
60250
60255
IRRIGATION FOR MASTER LANDSCAPING
Monthly Meter Charge
Utilization
8,868
60,000
8,868
200,000
8,868
200,000
-
140,000
0%
233%
15.08%
8,868
300,000
10,642
200,000
(1,774)
100,000
-16.67%
50.00%
Subtotal Irrigation 68,868 208,868 208,868 140,000 203% 308,868 210,642 98,226 46.63%
SRQ
60300
60310
60320
60330
60340
60350
ENVIRONMENTAL
Lake maintenance for the lakes outside communities
General consulting
Water quality monitoring
Mitigation monitoring and maintenance
Littoral Shelf Plantings
Conservation Areas Exotic Species Removal
10,000
-
-
-
-
12,000
12,000
-
-
-
2,200
16,000
12,000
-
-
-
2,200
16,000
2,000
-
-
-
2,200
4,000
20%
33%
19.57%
20,000
-
-
-
2,200
75,000
20,000
-
-
-
-
20,000
-
-
-
-
2,200
55,000
0.00%
275.00%
Subtotal Environmental 22,000 30,200 30,200 8,200 37% 97,200 40,000 57,200 143.00%
SRQ
60400
60420
UTILITIES (Estimated via historical usage and projected additional area)
FLORIDA POWER & LIGHT
Manatee County
1,200
-
28,000
-
28,000
-
26,800
-
2233%
6.16%
34,000
2,000
2,000
-
32,000
2,000
1600.00%
Subtotal Utilities 1,200 28,000 28,000 26,800 2233% 36,000 2,000 34,000 1700.00%
SRQ
60600
60610
60611
60620
60630
60640
60650
OTHER MAINTENANCE:
Roads and sidewalks
Stormwater System & Drainage
Storm Damage and Clean Up
Sanitary Sewer
Street Light Repair
Hardscapes and Signs
Miscellaneous Maintenance
-
12,000
-
-
6,000
2,000
-
12,000
2,000
-
10,000
2,000
-
12,000
2,000
-
10,000
2,000
-
-
-
2,000
-
4,000
-
0%
67%
0%
2.28%
-
26,000
-
6,000
-
20,000
2,742
-
40,000
-
6,000
-
8,225
2,742
-
(14,000)
-
-
-
11,775
0
-35.00%
0.00%
143.17%
0.01%
Subtotal 20,000 26,000 26,000 6,000 30% 54,742 56,966 (2,224) -3.90%
3.47%
TOTAL SARASOTA SECTOR 799,485 1,146,268 1,146,268 346,783 43% 1,578,010 1,729,540 (151,530) -8.76%
Page 6
Lakewood Ranch Stewardship District
Operations and Maintenance Budget Detail
EXPENSES
Acct#
DISTRICT OPERATIONS AND MANAGEMENT APPORTIONED BY EDU's
A. PERSONNEL
60724 Operations and Maintenance Management Fee - LWRD Personnel
Budget
FY2019
PRELIMINARY
Budget FY2020;
Resolution 2019-28
FINAL Budget
FY2020; Resolution
2019-36
FINAL FY2020
Budget vs. Budget
2019
ESTIMATED
BUILDOUT
(B)
Prior
Buildout
Estimate
$ Change %
Change
268,000 300,000 300,000 32,000 12% 500,250 500,000 250 0.05%
Subtotal 268,000 300,000 300,000 32,000 12% 500,250 500,000 250 0.05%
B. OPERATIONS
60725 Uniforms
60730 Job Materials
60735 Phone/Radio
60740 Office Supplies
60745 Fuel & Oil
60750 Equipment
60755 Tools/Machinery
60760 Supplies
60765 Employment Advertising
60770 Miscellaneous Maintenance
Maintenance Facility Rent
Vehicle R&M
Vehicle Leases
Waste Management
Centralized Irrigation System
-
6,000
-
-
12,400
-
500
500
-
2,000
-
1,200
7,800
1,600
-
2,000
6,000
-
-
12,400
-
500
500
-
2,000
-
1,200
7,800
3,000
-
2,000
6,000
-
-
12,400
-
500
500
-
2,000
-
1,200
7,800
3,000
-
2,000
-
-
-
-
-
-
-
-
-
-
-
-
1,400
-
0%
0%
0%
0%
0%
0%
0%
88%
5,000
20,000
12,000
5,000
50,000
10,000
10,000
10,000
2,000
24,000
24,000
10,000
36,000
5,000
2,000
5,079
20,000
12,000
5,000
50,000
10,000
10,000
10,000
2,000
24,000
24,000
5,000
36,000
5,000
2,000
(79)
-
-
-
-
-
-
-
-
-
-
5,000
-
-
-
-1.56%
0.00%
0.00%
0.00%
0.00%
0.00%
0.00%
0.00%
0.00%
0.00%
0.00%
100.00%
0.00%
0.00%
0.00%
Subtotal 32,000 35,400 35,400 3,400 11% 225,000 220,079 4,921 98.44%
C. COMMUNITY SERVICES PARKS & AMENITIES ADMIN. FEE - 96,240 96,240 96,240 317,088 - 317,088 198.44%
Total Operations and Management 300,000 431,640 431,640 131,640 44% 1,042,338 720,079 322,259 296.94%
PARKS; APPORTIONED BY EDU'S
60791 Robert N Gardner Park at Lakewood Centre
60792 James L Patton Park at Kent Lake
60793 Roger A Hill Park at White Eagle Blvd.
NEW Stewardship District Park at Waterside Place
150,000
60,000
12,000
-
276,000
60,000
12,000
-
276,000
60,000
12,000
-
126,000
-
-
-
84%
0%
0%
264,000
60,000
60,000
350,000
200,000
60,000
60,000
-
64,000
-
-
350,000
32.00%
0.00%
0.00%
Total Parks 222,000 348,000 348,000 126,000 57% 734,000 320,000 414,000 129.38%
TOTAL MAINTENANCE 4,402,352 6,763,545 6,763,545 2,361,193 54% 8,528,805 7,312,321 1,216,484 16.64%
ADMINISTRATIVE
70000 Insurance
70010 Meeting Advertising
70020 Real Estate Taxes
70030 Engineering
70040 Bond Agent Fees
70050 Legal Fees
70060 Accounting
70065 Lien Book and Tax Roll
70070 Annual Audit
70080 Trustee
70090 Manager
70100 Travel and Per Diem
70110 Telephone
70120 Postage
70150 Office Supplies
70160 Other Current Charges
70170 Dues, Licenses, Subscriptions
70180 Capital Outlay
70190 Meeting Room Rent
70200 Outside Services; County Administrative Fee
8,000
15,000
-
70,000
30,000
100,000
32,000
139,000
17,000
100,000
85,000
-
-
1,500
1,500
3,810
500
-
-
-
8,000
15,000
-
70,000
30,000
100,000
32,000
150,000
17,000
100,000
108,000
-
-
1,500
1,500
3,810
22,000
-
-
-
8,000
15,000
-
70,000
30,000
100,000
32,000
150,000
17,000
100,000
108,000
-
-
1,500
1,500
3,810
22,000
-
-
-
-
-
-
-
-
-
-
11,000
-
-
23,000
-
-
-
-
-
21,500
-
-
-
0%
0%
0%
0%
0%
0%
8%
0%
0%
27%
0%
0%
0%
4300%
20,000
20,000
-
75,000
75,000
125,000
75,000
150,000
50,000
150,000
150,000
-
-
2,657
1,500
10,629
22,000
-
-
-
42,517
42,517
-
75,000
75,000
125,000
125,000
150,000
75,000
200,000
200,000
-
-
2,657
-
10,629
1,063
-
-
-
(22,517)
(22,517)
-
-
-
-
(50,000)
-
(25,000)
(50,000)
(50,000)
-
-
-
1,500
-
20,937
-
-
-
-52.96%
-52.96%
0.00%
0.00%
0.00%
-40.00%
0.00%
-33.33%
-25.00%
-25.00%
0.00%
0.00%
1969.78%
TOTAL ADMINISTRATIVE 603,310 658,810 658,810 55,500 9% 926,786 1,124,383 (197,596) -17.57%
RESERVES - 152,578 152,578 152,578 276,375 200,000 76,375 38.19%
EXPENSES GRAND TOTAL 5,005,662 7,574,933 7,574,933 2,569,271 51% 9,731,966 8,636,704 1,095,262 12.68%
Page 7

Lakewood Ranch Stewardship District
Operations and Maintenance Budget Detail
4,326,130 1,408,028 48% 9,731,966
186,747 55,543 42%
3,061,056 1,104,700 56%
- -
1,000 1,000
7,574,933 2,569,271 51% 9,731,966
TOTAL CHANGE VS. PRIOR YEAR
0 0 0
EXPENSES
Acct#
REVENUES - % FROM PLATTED LOTS ASSESSMENTS FROM PLATTED LOTSᵇ
ASSESSMENTS FROM UNPLATTED
LANDOWNER CONTRIBUTIONS (A)
INTEREST INCOME
OTHER INCOME (PARK RENTAL FEES)
TOTAL
OPERATING SURPLUS (DEFICIT)
Budget
FY2019
2,918,102
131,204
1,956,356
5,005,662
0
FINAL FY2020 PRELIMINARY FINAL Budget Budget vs. Budget Budget FY2020; FY2020; Resolution
2019Resolution 2019-28 2019-36
4,326,130
186,747
3,062,056
-
-
7,574,933
0
ESTIMATED
BUILDOUT
(B)
100%
Prior
Buildout
Estimate
8,636,704
8,636,704
1,095,262
0
(A) INCLUDES LOTS NOT PLATTED AT BEGINNING OF YEAR AND SOLD TO A THIRD PARTY DURING YEAR.
ᵃLandscape contracts are inclusive of turf maint., shrub & ornamental tree maint., bed maint., and ADOPTED AND APPROVED BY RESOLUTION 2019-36 OF THE LAKEWOOD RANCH
irrigation system programming and inspection. Contracts are not inclusive of palm and canopy tree STEWARDSHIP DISTRICT BOARD OF SUPERVISORS WHILE IN REGULAR SESSION WITH A
pruning, mulch, annuals or irrigation repairs. QUORUM PRESENT AND VOTING ON AUGUST 9, 2019
ᵇBuildout assessments budget includes a cushion to account for county administration and
collection fees equating to 3% and up to 4% for discounts aloud.
CHAIRMAN/VICE-CHAIRMAN (B) BUILDOUT AMOUNTS ARE IN CURRENT YEAR $. FINAL BUILDOUT AMOUNTS MAY BE
SIGNIFICANTLY DIFFERENT DUE TO ECONOMIC FACTORS AND PLAN CHANGES
Page 8
% $ Change
Change
1,095,262 12.68%
-
-
-
-
1,095,262 12.68%
.______ Eu
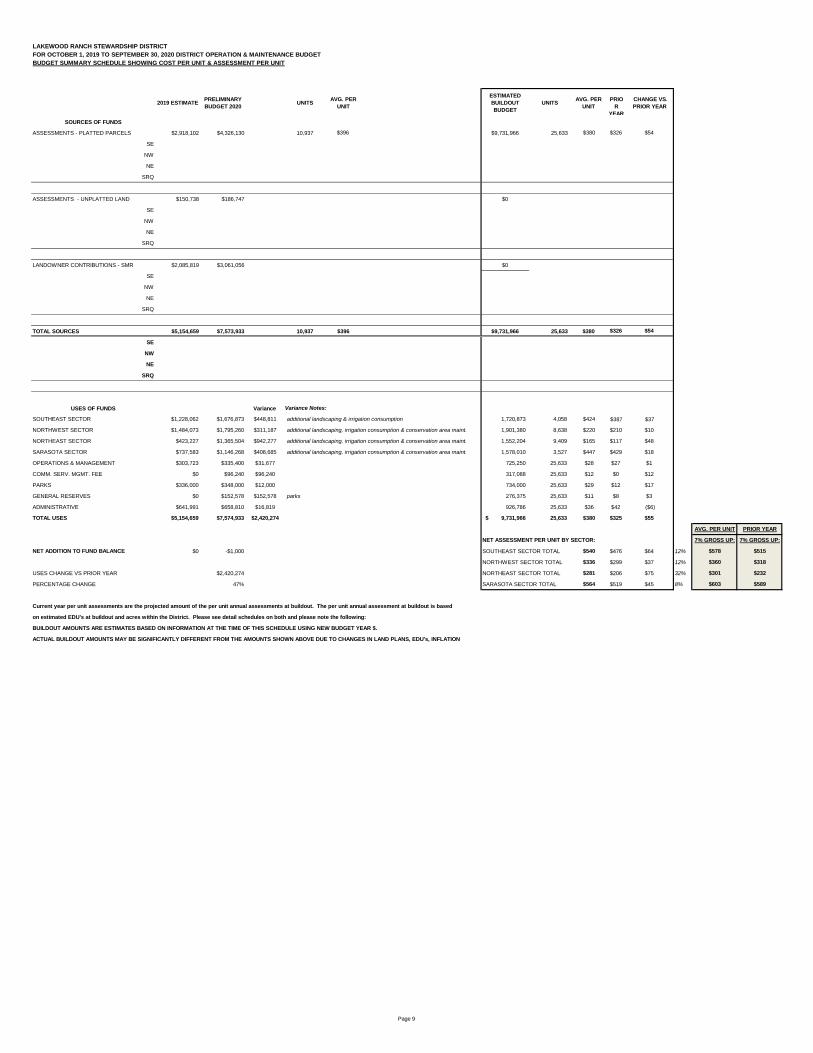
LAKEWOOD RANCH STEWARDSHIP DISTRICT
FOR OCTOBER 1, 2019 TO SEPTEMBER 30, 2020 DISTRICT OPERATION & MAINTENANCE BUDGET
BUDGET SUMMARY SCHEDULE SHOWING COST PER UNIT & ASSESSMENT PER UNIT
2019 ESTIMATE PRELIMINARY
BUDGET 2020 UNITS
AVG. PER
UNIT
SOURCES OF FUNDS
ASSESSMENTS - PLATTED PARCELS
SE
NW
NE
SRQ
$2,918,102 $4,326,130 10,937 $396
ASSESSMENTS - UNPLATTED LAND
SE
NW
NE
SRQ
$150,738 $186,747
LANDOWNER CONTRIBUTIONS - SMR
SE
NW
NE
SRQ
$2,085,819 $3,061,056
TOTAL SOURCES
SE
NW
NE
SRQ
$5,154,659 $7,573,933 10,937 $396
USES OF FUNDS
SOUTHEAST SECTOR
NORTHWEST SECTOR
NORTHEAST SECTOR
SARASOTA SECTOR
OPERATIONS & MANAGEMENT
COMM. SERV. MGMT. FEE
PARKS
GENERAL RESERVES
ADMINISTRATIVE
TOTAL USES
$1,228,062
$1,484,073
$423,227
$737,583
$303,723
$0
$336,000
$0
$641,991
$5,154,659
$1,676,873
$1,795,260
$1,365,504
$1,146,268
$335,400
$96,240
$348,000
$152,578
$658,810
$7,574,933
Variance
$448,811
$311,187
$942,277
$408,685
$31,677
$96,240
$12,000
$152,578
$16,819
$2,420,274
Variance Notes:
additional landscaping & irrigation consumption
additional landscaping, irrigation consumption & conservation area maint.
additional landscaping, irrigation consumption & conservation area maint.
additional landscaping, irrigation consumption & conservation area maint.
parks
NET ADDITION TO FUND BALANCE $0 -$1,000
USES CHANGE VS PRIOR YEAR
PERCENTAGE CHANGE
$2,420,274
47%
Current year per unit assessments are the projected amount of the per unit annual assessments at buildout. The per unit annual assessment at buildout is based
on estimated EDU's at buildout and acres within the District. Please see detail schedules on both and please note the following:
BUILDOUT AMOUNTS ARE ESTIMATES BASED ON INFORMATION AT THE TIME OF THIS SCHEDULE USING NEW BUDGET YEAR $.
ACTUAL BUILDOUT AMOUNTS MAY BE SIGNIFICANTLY DIFFERENT FROM THE AMOUNTS SHOWN ABOVE DUE TO CHANGES IN LAND PLANS, EDU's, INFLATION
ESTIMATED AVG. PER PRIO CHANGE VS.
BUILDOUT UNITS UNIT R PRIOR YEAR
BUDGET YEAR
$9,731,966 25,633 $380 $326 $54
$0
$0
$9,731,966 25,633 $380 $326 $54
1,720,873 4,058 $424 $387 $37
1,901,380 8,638 $220 $210 $10
1,552,204 9,409 $165 $117 $48
1,578,010 3,527 $447 $429 $18
725,250 25,633 $28 $27 $1
317,088 25,633 $12 $0 $12
734,000 25,633 $29 $12 $17
276,375 25,633 $11 $8 $3
926,786 25,633 $36 $42 ($6)
$ 9,731,966 25,633 $380 $325 $55
NET ASSESSMENT PER UNIT BY SECTOR:
SOUTHEAST SECTOR TOTAL $540 $476 $64 12%
NORTHWEST SECTOR TOTAL $336 $299 $37 12%
NORTHEAST SECTOR TOTAL $281 $206 $75 32%
SARASOTA SECTOR TOTAL $564 $519 $45 8%
AVG. PER UNIT PRIOR YEAR
7% GROSS UP:
$578
7% GROSS UP:
$515
$360 $318
$301 $232
$603 $589
Page 9

I
--
1.32
187
85.5
LAKEWOOD RANCH STEWARDSHIP DISTRICT
ESTIMATED EDU's BY COMMUNITY AND ALLOCATION OF OPERATIONS & MAINTENANCE BUDGET - BASED ON PROJECTIONS AS OF MAY 2019
FOR OCTOBER 2019 TO SEPTEMBER 2020 DISTRICT OPERATIONS & MAINTENANCE BUDGET
Billable
Acres
450
643
339
83
Acres
0.95
0.78
0.71
1.09
1.46
1.34
100
150
21
93
304
74.4
65
1.32
1.4
2.99
Acres
1292
992
250
278
16.94
11
2.54
0.865
1.136
3.26
Acres
8.58
5.09
5.01
ESTIMATED EDU'S Revenue based on # of EDU
W/IN
% OF % OF SECTOR PER REVENUE PRIOR
RES UNITS RES EDU COMM EDU TOTAL TOTAL RES UNITS RES EDU COMM TOTAL TOTAL % 'S EDU TOTAL YEAR
SE SECTOR LAKE CLUB - SF - Phase 1 & 2 328 328 328 1.28% 328 328 328 3.00% 11% 177,217
LAKE CLUB - SF - Phase 3 (Stock) 68 68 68 0.27% 68 68 68 0.62% 2% 36,740
LAKE CLUB - SF - Phase 4 - Stock Development - Genoa 312 312 312 1.22% 104 104 104 0.95% 4% 56,191
CC EAST - SF 1,260 1,260 1,260 4.92% 1,260 1,260 1,260 11.52% 44% 680,774
CC EAST - MF - "Clubside" 92 46 46 0.18% 92 46 46 0.42% 2% 24,854
CCE EAST GOLF COURSE 18 18 0.07% 18 18 0.16% 1% 9,725
DEL WEBB - Pulte Homes 1,300 1,300 1,300 5.07% 855 855 855 7.82% 30% 461,954
Toll Brothers 450 450 450 1.76% 151 151 151 1.38% 5% 81,585
Diocese of Sarasota - Catholic School Site 83 acres 40 40 0.16% 0 0.00% 0% 0
SMR Building 12 12 0.05% 12 12 0.11% 0% 6,484
NE Corner of Lorraine & Upkwy:
North American Properties - ID 588601559 - 60,320 sq ft 24 24 0.09% 24 24 0.22% 1% 13,036
North American Properties - ID 588601459 - 16,950 sq ft 7 7 0.03% 7 7 0.06% 0% 3,663
PROFESSIONAL RESOURCE DEV. - ID 588600979 - 4,000 sq ft 2 2 0.01% 2 2 0.01% 0% 864
North American Properties - ID 588601509 - vacant 1.32 acres 2 2 0.01% 0 0.00% 0% 0
REMAINING EAST LAND - (East of Bourn.) 150 150 20 170 0.66% 0 0.00% 0% 0
Triangle Parcel - SW corner of Masters & Bournside 20 20 0.08% 0 0.00% 0% 0
SUBTOTAL 3,960 3,914 144 4,058 15.83% 2,858 2,812 63 2,875 26.28% 100% $540 $1,553,088 $1,161,425 $391,663
25%
NW SECTOR CENTRAL PARK 826 826 826 3.22% 826 826 826 7.55% 15% 277,830
CENTRAL PARK COMM 60 60 0.23% 0 0.00% 0% 0
Lakewood Center South / NW Sector:
ESPLANADE - SF 1024 1024 1,024 3.99% 1,024 1,024 1,024 9.36% 19% 344,429
ESPLANADE- MF (Townhomes) 176 88 88 0.34% 176 88 88 0.80% 2% 29,599
BRIDGEWATER - Lennar Homes 275 275 275 1.07% 275 275 275 2.51% 5% 92,498
HARMONY - SF 142 142 142 0.55% 142 142 142 1.30% 3% 47,763
HARMONY - MF (Townhomes) 535 268 268 1.04% 535 268 268 2.45% 5% 89,975
LOST CREEK APARTMENTS 272 136 136 0.53% 272 136 136 1.24% 2% 45,744
CREEKSIDE APARTMENTS 256 128 128 0.50% 256 128 128 1.17% 2% 43,054
LUX APARTMENTS - Davis Devlopment-Parcel J 237 119 119 0.46% 237 119 119 1.08% 2% 39,858
Palisades (DR Horton) 150 150 150 0.59% 150 150 150 1.37% 3% 50,453
NW Sector Parcel "F" 8 8 0.03% 0 0 0.00% 0% 0
NW Sector Parcel "K" 4 4 0.02% 0 0 0.00% 0% 0
Other Commercial Sites - Parcels L to Q 32 32 0.12% 0 0 0.00% 0% 0
Parcel "F" - off of 44th 76 76 76 0.30% 0 0 0.00% 0% 0
Parcel "H" - Rangeland & Lorraine 10 10 0.04% 0 0 0.00% 0% 0
CORE (within LWCS):
The Green @ LWR - Lot 1 - ID #583207059 2.00 2.00 0.01% 0 0 0.00% 0% 0
The Green @ LWR - Lot 2 - ID #583207109 2.00 2.00 0 0 0.00% 0% 0
The Green @ LWR - Lot 3 - ID #583207159 2.85 2.85 3 3 0.03% 0% 959
The Green @ LWR - Lot 4 - ID #583207209 2.00 2.00 0 0 0.00% 0% 0
The Green @ LWR - Lot 5 - ID #583207259 1.65 1.65 2 2 0.02% 0% 554
The Green @ LWR - Lot 6 - ID #583207309 3.00 3.00 0 0 0.00% 0% 0
The Green @ LWR - Lot 7 - ID #583207359 3.00 3.00 0 0 0.00% 0% 0
The Green - Lots 8 & 9 are Parking Lots
The Green @ LWR - Lot 10 - ID #583207509 17.73 17.73 18 18 0.16% 0% 5,964
The Green @ LWR - Lot 11 - ID #583207559 9.62 9.62 10 10 0.09% 0% 3,236
The Green @ LWR - Lot 12 - ID #583207609 13.59 13.59 14 14 0.12% 0% 4,571
Tavistock (Apartments) - ID #583207459 250 125 125 0.49% 250 125 125 1.14% 2% 42,045
Bridgehouse Holdings (Mercedes Med) - ID# 583202609 22.00 22.00 0.09% 22 22 0.20% 0% 7,401
LWR MOB (Optimal Outcomes) - ID #583204509 20.00 20.00 0.08% 20 20 0.18% 0% 6,727
CORE remaining 187 acres 800 800 3.12% 0 0.00% 0% 0
Lakewood Center North 1 - "Commercial Units":
SHI II SLD Lakewood Ranch - Unit 1 - ID #583206059 43.54 43.54 0.17% 0 44 44 0.40% 1% 14,644
LWCN Lot 5 30.00 30.00 0.12% 0 0 0 0.00% 0% 0
Rangeland MOB 11 - Units 6 & 7 - ID # 583206179 9.58 9.58 0.04% 0 10 10 0.09% 0% 3,223
JADRO LLC - Unit 8 - ID #583206259 20.00 20.00 0.08% 0 0 0 0.00% 0% 0
SCATA Realestate - Unit 9 - ID#583206309 8.95 8.95 0.03% 0 9 9 0.08% 0% 3,011
Rangeland MOB - Unit 10 - ID#583206359 9.84 9.84 0.04% 0 10 10 0.09% 0% 3,308
Lakewood Center North:
ARBOR GRANDE - Standard Pacific - SF 183 183 183 0.71% 183 183 183 1.67% 3% 61,553
ARBOR GRANDE - Standard Pacific - MF 122 61 61 0.24% 122 61 61 0.56% 1% 20,518
MALLORY PARK - Divosta Homes - SF 328 328 328 1.28% 307 307 307 2.81% 6% 103,261
MALLORY PARK - Divosta Homes - MF 108 54 54 0.21% 24 12 12 0.11% 0% 4,036
ECHO LAKE APARTMENTS - Home by Towne 360 180 180 0.70% 360 180 180 1.65% 3% 60,544
INDIGO - Neal Homes 590 590 590 2.30% 590 590 590 5.39% 11% 198,450
SAVANNAH - Meritage Homes 475 475 475 1.85% 361 361 361 3.30% 7% 121,425
Woodleaf Hammock - Homes by Towne - SF 103 103 103 0.40% 91 91 91 0.83% 2% 30,608
Woodleaf Hammock - Homes by Towne - MF 150 75 75 0.29% 78 39 39 0.36% 1% 13,118
Future Parcel - NW corner of Lorraine & 44th - 65 acres 200 200 200 0.78% 0 0.00% 0% 0
Parcel "U" - North of Woodleaf Trl. - Apartments 300 150 150 0.59% 0 0.00% 0% 0
Parcel "U" - South of Woodleaf Trl. - Apartments 500 250 250 0.98% 0 0.00% 0% 0
Parcel "U" - South of Woodleaf Trl. 60 60 0.23% 0 0.00% 0% 0
NW Corner of 44th & White Eagle - Apartments 240 120 120 0.47% 0 0.00% 0% 0
Parcel "FF" - SE corner of 117th and SR64 - Retail 66 66 0.26% 0 0.00% 0% 0
Parcel GG, HH, II, JJ, KK, LL - 252,500 Sq Ft - includes future publix 101 101 0.39% 0 0.00% 0% 0
Parcel GG, HH, II, JJ, KK, LL - Apartments on White Eagle 250 125 125 0.49% 0 0.00% 0% 0
Buisiness Park & Commerce Park:
Harrod Properties
Building 1 - ID #567813009 24 24 0.09% 24 24 0.22% 0% 8,182
Building 2 - ID #567810859 24 24 0.09% 24 24 0.22% 0% 8,182
Building 3 - ID #567813159 24 24 0.09% 24 24 0.22% 0% 8,182
Building 4 - ID #567813209 24 24 0.09% 24 24 0.22% 0% 8,182
Building 5 - ID #567813059 40 40 0.16% 40 40 0.37% 1% 13,491
Building 6 - ID #567810909 40 40 0.16% 40 40 0.37% 1% 13,491
Business Park
Condev Self Storage - ID #579102909 36 36 0.14% 36 36 0.33% 1% 12,035
Ungabungawunga - ID #579102409 4 4 0.02% 0 0 0.00% 0% 0
Sorrentino - ID# 579102709 4 4 0.02% 0 0 0.00% 0% 0
KW Realty - ID#579101259 4 4 0.02% 0 0 0.00% 0% 0
FUTURE Parcels 800 800 3.12% 0 0 0.00% 0% 0
SUBTOTAL 8,128 6,250 2,388 8,638 33.70% 6,259 5,104 373 5,477 50.08% 100% $336 $1,842,101 $1,409,581 $432,520
23%
NE SECTOR LAKEWOOD NATIONAL - Lennar Homes 1,576 1,576 1,576 6.15% 1,576 1,576 1,576 14.41% 85% 443,175
POLO RUN - Lennar Homes 423 423 423 1.65% 212 212 212 1.94% 11% 59,615
Taylor Morrison 1,685 1,685 1,685 6.57% 0 0.00% 0% 0
CRESSWIND - Kolter 651 651 651 2.54% 0 0.00% 0% 0
SOLERA - DR Horton 675 675 675 2.63% 0 0.00% 0% 0
FUTURE RESIDENTIAL 3,077 3,077 3,077 12.00% 0 0.00% 0% 0
FUTURE Apartments 1,000 500 500 1.95% 0 0.00% 0% 0
FUTURE COMMERCIAL 400 400 1.56% 0 0.00% 0% 0
Lorraine & SR70 - NE Corner:
Publix + 3 outparcels - ID# 582200609 100 100 0.39% 0 0.00% 0% 0
Lorraine NE Corners - Lots 6 & 7 - ID#58202859 254 127 127 0.50% 0 0.00% 0% 0
Big Jim Self Storage - ID #582202059 69 69 0.27% 69 69 0.63% 4% 19,460
Bayside Pet Resort - ID #582202109 6 6 0.02% 6 6 0.06% 0% 1,739
JK Investment - ID #582202159 30 30 0.12% 0 0.00% 0% 0
TB SR70 LLC - ID #582202219 30 30 0.12% 0 0.00% 0% 0
TB SR70 LLC - ID #582202239 30 30 0.12% 0 0.00% 0% 0
Lorraine NE Corners - Lot 5 - ID #582202259 30 30 0.12% 0 0.00% 0% 0
SUBTOTAL 9,341 8,714 695 9,409 36.71% 1,788 1,788 75 1,863 17.04% 4% $281 $523,988 $201,484 $322,504
62%
SARASOTA FUTURE SINGLE FAMILY 1,021 1,021 1,021 3.98% 0 0.00% 0% 0
FUTURE MULTI FAMILY 2,776 1,388 1,388 5.41% 0 0.00% 0% 0
SHOREVIEW - Pulte - All SF 246 246 246 0.96% 246 246 246 2.25% 34% 138,657
LAKEHOUSE COVE - Homes by Towne - SF 331 331 331 1.29% 331 331 331 3.03% 46% 186,567
DD LR, LLC (Davis Apts) - ID #0191010003 290 145 145 0.57% 145 145 145 1.33% 20% 81,729
DD Waterside, LLC (Davis Apts) - ID #0193010004 208 104 104 0.41% 0 0.00% 0% 0
DD Waterside, LLC (Davis Apts) - ID #0193010005 100 50 50 0.20% 0 0.00% 0% 0
Sarasota Property Owner LLC (Ryan AL) -ID# 0183030001 172 86 86 0.34% 0 0.00% 0% 0
FUTURE COMMERCIAL 156 156 0.61% 0 0.00% 0% 0
SUBTOTAL 5,144 3,371 156 3,527 13.76% 722 722 722 6.60% 100% $564 $406,954 $299,197 $107,757
26%
ALL TOTAL 26,573 22,249 3,384 25,633 100% 11,627 10,426 511 10,937 100% $4,326,130 $3,071,687 $1,254,443
AS OF MAY 2019
PROJECTED BUILDOUT EDU'S ASSESSMENTS
VAR
PLATTED AS OF MAY 2019
BUDGET YEAR EDU'S
Prior Year: 26,798 23,096 3,455 26,551 Prior Year: 8,375 331 8,706
Operation & Maintenance Annual Assessments Are Charged Per Platted EDU As Follows: Note that annual assessments shown on schedule are for 1 EDU
Single Family Home = 1 EDU Commercial EDU'S 2,500 SQ FT. = 1 EDU
Multi Family Home is 1/2 of EDU The Square Feet Is Either GDP = General Development Plan - total square fee in Plan - Or Best Estimate
The Budget Assessment Per EDU amount shown above is grossed up by 7% when placed on the Manatee County Real Estate Taxes Invoice.
The gross up is 4% discount for early payment, Property Appraiser fee of 1.5% & Tax Collector fee of 1.5%
Per a separate calculation, landowners are charged and direct billed an assessment on a per acre basis for land that they own that has not been platted.
Please see schedule of acres for this assessment calcuation
Page 10

LAKEWOOD RANCH STEWARDSHIP DISTRICT
ESTIMATED ACRES BY PARCEL BASED ON PROJECTIONS AS OF MAY 2019
FOR ALLOCATION OF OPERATION & MAINTENANCE ASSESSMENTS ON LAND NOT PLATTED
FOR OCTOBER 2019 TO SEPTEMBER 2020 DISTRICT OPERATIONS & MAINTENANCE BUDGET
ESTIMATED ACRES BY PARCEL
BUILDOUT ACRES
RES COMM TOTAL
SE SECTOR -Manatee County
LAKE CLUB 728 728
EAST OF LAKE CLUB 909 909
CC EAST 1,164 1,164
CCE GOLF COURSE 350 350
EAST PULTE AGE REST 604 604
REMAINING EAST LAND 157 157
Diocese of Sarasota 83 83
UNIV CORNERS/SMR 30 30
SUBTOTAL 3,912 113 4,025
NW SECTOR
CENTRAL PARK 355 355
CENTRAL PARK COMM 18 18
Lakewood Center South / NW Sector:
ESPLANADE 195 195
ESPLANADE - GOLF 400 400
BRIDGEWATER - Lennar Homes 278 278
HARMONY - Mattamy 245 245
LOST CREEK APARTMENTS 24 24
CREEKSIDE APARTMENTS 17 17
LUX APARTMENTS - Davis Devlopment-Parcel J 24 24
NW Sector Parcel "I" 54 54
NW Sector Parcel "F" 14 14
Lakewood Center Parcel "I" 90 90
Lakewood Center Parcel "J" 149 149
Other Multi Family - Hotel - I&J 4 4
Other Commercial Sites - Parcels L to Q 35 35
Other MF Units - Parcel R 44 44
Lakewood Center North 1 - "Commercial Units":
SENIOR LYFESTYLES - LWCN Lot 1 7 7
LWCN Lot 5 4 4
MOB II - LWCN Lot 6 & 7 3 3
LWCN Lot 8 1 1
TIDEWELL - LWCN Lot 9 2 2
INTERCOASTAL MEDICAL GROUP - LWCN Lot 10 3 3
Lakewood Center North:
ARBOR GRANDE - Standard Pacific 100 100
MALLORY PARK - Divosta Homes 150 150
ECHO LAKE APARTMENTS - Home by Towne 21 21
INDIGO - Neal Homes 93 93
SAVANNAH - Meritage Homes 304 304
FUTURE RESIDENTIAL 22 22
FUTURE MULTIFAMILY 31 31
FUTURE COMMERCIAL - Office & Retail 75 75
BUSINESS PARK 182 182
COMMERCE PARK -east of LWRB 144 144
BUSINESS PARK -east of LWRB 113 113
SUBTOTAL 2,648 552 3,201
NE SECTOR
COMMERCIAL 797 797
MULTI-FAMILY 161 161
LAKEWOOD NATIONAL / POLO RUN 1,292 1,292
RESIDENTIAL 3,613 3,613
SUBTOTAL 5,066 797 5,863
SARASOTA
RESIDENTIAL 5,500 5,500
COMMERCIAL 120 120
HERITAGE RANCH 2,258 2,258
HAMLETS 364 364
SUBTOTAL 5,864 2,378 8,242
ADMINISTRATIVE/GENERAL
Totals 17,490 3,840 21,331
Wetland Systems Not Assessed - benefit all 1,724
TOTAL DISTRICT ACRES PER BOND VALIDATION 23,055
NOTE:
PER ACRE
% OF BUILDOUT ASSESSMENT
TOTAL BUDGET AMOUNT
3.41% 311,254
4.26% 388,639
5.46% 497,664
1.64% 149,641
2.83% 258,238
0.74% 67,125
0.39% 35,486
0.14% 12,826
0.00% 0
18.87% 1,720,873 428
1.66% 210,663
0.08% 10,616
0.91% 115,847
1.88% 237,635
1.30% 165,156
1.15% 145,551
0.11% 14,133
0.08% 9,921
0.11% 14,258
0.25% 32,081
0.07% 8,555
0.42% 53,468
0.70% 88,519
0.02% 2,139
0.17% 21,031
0.21% 26,021
0.03% 3,862
0.02% 2,602
0.01% 1,610
0.01% 796
0.01% 1,479
0.01% 1,741
0.47% 59,409
0.70% 89,113
0.10% 12,476
0.44% 55,250
1.43% 180,602
0.10% 13,248
0.14% 18,238
0.35% 44,556
0.85% 108,124
0.68% 85,548
0.53% 67,132
15.00% 1,901,380 594
3.74% 211,002
0.75% 42,624
6.06% 342,051
16.94% 956,526
27.49% 1,552,204 265
25.78% 1,053,028
0.56% 22,975
10.59% 432,316
1.71% 69,691
38.64% 1,578,010 191
2,979,499 140 **
100% 9,731,966 456
-
The District charges the Land Owner an annual
CC East is Country Club East consisting of the original 851 acres plus 178 acres "Ritz Option" and 135 acre "Triangle parcel = 1,164 per acre assessment for the undeveloped land
NE Sector - land east of Lorraine Road and north of State Road 70 - East North @ 3,401 acres & East South at 2,462 acres = 5,863 acres equal to 50% of the Admninistrative per acre
Sarasota - the 8,242 acres of Sarasota land is per Sarasota County Tax ID #s when District was formed buildout budget.
Land Owner Contribution Summary # of Total Unit Per # of Platted EDU Not Platted Per Acre
Unplated Acreage Contributions # of Acres EDU Acre EDU Divided by Assessment
Land Owners Unit Per Acre to ** Equal to 50% of the
Equal Acres to Bill On Admin per acre buildout
Southeast Sector:
Stock Development (Lake Club Ph 4) 450.00 312 0.69 104 300.00 $70
Pulte Homes (Del Webb) 643.00 1,300 2.02 855 220.10 $70
Toll Brothers (The Isles at LWR) 339.00 450 1.33 151 225.25 $70
Diocese of Sarasota - Catholic School Site 83.00 40 0.48 0 83.00 $70
North American Properties - ID 588601509 1.32 2 1.21 0 1.32 $70
Northwest Sector:
Central Park Commercial Land 17.87 60 3.36 0 17.87 $70
The Green @ LWR - Lot 1 - ID #583207059 0.95 2 2.11 0 .95 $70
The Green @ LWR - Lot 2 - ID #583207109 0.78 2 2.56 0 .78 $70
The Green @ LWR - Lot 4 - ID #583207209 0.71 2 2.82 0 .71 $70
The Green @ LWR - Lot 6 - ID #583207309 1.09 3 2.75 0 1.09 $70
The Green @ LWR - Lot 7 - ID #583207359 1.46 3 2.05 0 1.46 $70
JADRO LLC - Unit 8 - ID #583206259 1.34 20 14.93 0 1.34 $70
MALLORY PARK - Divosta Homes 150.00 382 2.55 319 24.74 $70
SAVANNAH - Meritage Homes 304.00 475 1.56 361 72.96 $70
Woodleaf Hammock - Homes by Towne 74.40 178 2.39 130 20.06 $70
Ungabungawunga - ID #579102409 1.32 4 3.03 0 1.32 $70
Sorrentino - ID# 579102709 1.40 4 2.86 0 1.40 $70
KW Realty - ID#579101259 2.99 4 1.34 0 2.99 $70
Northeast Sector:
LAKEWOOD NATIONAL / POLO RUN - Lennar Homes 1,292.00 1,999 1.55 1,788 136.37 $70
Taylor Morrison 992.00 1,685 1.70 0 992.00 $70
CRESSWIND - Kolter 250.00 651 2.60 0 250.00 $70
SOLERA - DR Horton 278.00 675 2.43 0 278.00 $70
Publix + 3 outparcels - ID# 582200609 16.94 100 5.90 0 16.94 $70
JK Investment - ID #582202159 2.54 30 11.81 0 2.54 $70
TB SR70 LLC - ID #582202219 0.87 30 34.68 0 .87 $70
TB SR70 LLC - ID #582202239 1.14 30 26.41 0 1.14 $70
Sarasota:
DD Waterside, LLC (Davis Apts) - ID #0193010004 8.58 104 12.12 0 8.58 $70
DD Waterside, LLC (Davis Apts) - ID #0193010005 5.09 50 9.83 0 5.09 $70
Sarasota Property Owner LLC (Ryan AL) -ID# 0183030001 5.01 86 17.17 0 5.01 $70
Total Non-SMR 2,673.88
Assessment
Amount
$20,952
$15,372
$15,732
$5,797
$92
$57,945
$1,248
$66
$54
$50
$76
$102
$94
$1,728
$5,096
$1,401
$92
$98
$209
$10,314
$9,525
$69,283
$17,460
$19,416
$1,183
$177
$60
$79
$117,184
$599
$355
$350
$1,305
$186,747
Page 11

I
I I I I
I I I I
LAKEWOOD RANCH STEWARDSHIP DISTRICT
Projected General Maintenance & Administration Cost at Buildout - Shared Expenses Per EDU
OPERATIONAL EXPENSES
A. Field Staff Payroll; Subtotal
B. Other Operational Expenses
Uniforms
Job Materials
Phone/Radio
Office Supplies
Fuel & Oil
Equipment
Tools/Machinery
Supplies
Employment Advertising
Miscellaneous Maintenance
Maintenance Facility Rent
Vehicle R&M
Vehicles
Waste Management
Centralized Irrigation System
TOTAL OPERATIONAL EXPENSES
Projected
Build-Out
Budget
500,250
5,000
20,000
12,000
5,000
50,000
10,000
10,000
10,000
2,000
24,000
24,000
10,000
36,000
5,000
2,000
225,000
SE Sector Build-Out
4,058
16% Per Unit
79,199 $19.52
792 $0
3,166 $1
1,900 $0
792 $0
7,916 $2
1,583 $0
1,583 $0
1,583 $0
317 $0
3,800 $1
3,800 $1
1,583 $0
5,699 $1
792 $0
317 $0
35,622 $28
EQUIVALENT DWELLING UNITS (EDU'S)
NW Sector Build-Out NE Sector Build-Out SRQ Sector Build-Out
8,638 9,409 3,527
34% Per Unit 37% Per Unit 14% Per Unit
168,582 $19.52 183,636 $19.52 68,834 $19.52
1,685 $0 1,835 $0 688 $0
6,740 $1 7,342 $1 2,752 $1
4,044 $0 4,405 $0 1,651 $0
1,685 $0 1,835 $0 688 $0
16,850 $2 18,354 $2 6,880 $2
3,370 $0 3,671 $0 1,376 $0
3,370 $0 3,671 $0 1,376 $0
3,370 $0 3,671 $0 1,376 $0
674 $0 734 $0 275 $0
8,088 $1 8,810 $1 3,302 $1
8,088 $1 8,810 $1 3,302 $1
3,370 $0 3,671 $0 1,376 $0
12,132 $1 13,215 $1 4,954 $1
1,685 $0 1,835 $0 688 $0
674 $0 734 $0 275 $0
75,824 $28 82,595 $28 30,960 $28
Total Build-Out
25,633
100%
500,250
5,001
20,002
12,001
5,001
50,006
10,001
10,001
10,001
2,000
24,003
24,003
10,001
36,004
5,001
2,000
225,026
2019/2020
Budget
300,000
2,000
6,000
12,400
500
500
2,000
1,200
7,800
3,000
35,400
SE
47,496
317
950
1,963
79
79
317
190
1,235
475
5,604
$17
$17
NW
101,099
674
2,022
4,179
168
168
674
404
2,629
1,011
11,930
$18
$18
NE
110,126
734
2,203
4,552
184
184
734
441
2,863
1,101
12,995 $0
SRQ
41,280
275
826
1,706
69
69
275
165
1,073
413
4,871
Parks Maintenance
Community Services Mgmt. Fee
ALL TOTAL
ADMINISTRATIVE
Insurance
Meeting Advertising
Real Estate Taxes
Engineering
Bond Agent Fees
Legal Fees
Accounting
Lien Book and Tax Roll
Annual Audit
Trustee
Manager
Travel and Per Diem
Telephone
Postage
Office Supplies
Other Current Charges
Dues, Licenses, Subscriptions
Capital Outlay
Meeting Room Rent
Outside Services; County Administrative Fee
TOTAL ADMINISTRATIVE
734,000
317,088
1,776,338
20,000
20,000
-
75,000
75,000
125,000
75,000
150,000
50,000
150,000
250,000
-
-
2,657
-
10,629
1,063
-
-
1,004,349
116,206
231,026
3,166
3,166
-
11,874
11,874
19,790
11,874
23,748
7,916
23,748
39,580
-
-
421
-
1,683
168
-
-
-
159,007
$29
$77
$39
247,354
491,760
6,740
6,740
-
25,275
25,275
42,124
25,275
50,549
16,850
50,549
84,249
-
-
895
-
3,582
358
-
-
-
338,461
$29
$76
$39
269,442
535,673
7,342
7,342
-
27,532
27,532
45,886
27,532
55,063
18,354
55,063
91,772
-
-
975
-
3,902
390
-
-
-
368,684
$29
$76
$39
100,997
200,791
2,752
2,752
-
10,320
10,320
17,200
10,320
20,640
6,880
20,640
34,400
-
-
366
-
1,463
146
-
-
-
138,197
$29
$76
$39
734,000
1,459,276
20,000
20,000
-
75,000
75,000
125,000
75,000
150,000
50,000
150,000
250,000
-
-
2,657
-
10,629
1,063
-
-
-
1,004,349
348,000
96,240
779,640
8,000
15,000
-
70,000
30,000
100,000
32,000
150,000
17,000
100,000
108,000
-
-
1,500
1,500
3,810
22,000
-
-
-
658,810
55,095
15,237
123,432
1,267
2,375
-
11,082
4,750
15,832
5,066
23,748
2,691
15,832
17,098
-
-
237
237
603
3,483
-
-
-
104,302
117,274
32,432
262,735
2,696
5,055
-
23,590
10,110
33,700
10,784
50,549
5,729
33,700
36,395
-
-
505
505
1,284
7,414
-
-
-
222,016
127,746
35,329
286,196
2,937
5,506
-
25,696
11,013
36,709
11,747
55,063
6,240
36,709
39,645
-
-
551
551
1,399
8,076
-
-
-
241,841
47,884
13,242
107,277
1,101
2,064
-
9,632
4,128
13,760
4,403
20,640
2,339
13,760
14,861
-
-
206
206
524
3,027
-
-
-
90,651
Capital Improvement Reserves 276,375 43,755 $11 93,137 $11 101,454 $11 38,029 $11 152,578 24,156 $6 51,418 $6 56,010 $6 20,995
ALL TOTAL SHARED EXPENSES 3,057,062 433,789 $127 923,358 $126 1,005,810 $126 377,017 $126 2,463,626 1,591,028 251,889 536,169 584,047 218,923
Parks and Facilities Capital Improvement
Reserves
A Bob Gardner Community Park
Useful Life Original Construction Cost:
in Years
1 Pavilions (2) $ 387,986 30
2 Boardwalks (2) $ 49,300 20
3 Parking Lot $ 25,000 15
$ 462,286
B James L Patton Community Park
1 Pavilion (1) $ 213,916 30
2 Bridges (4) $ 159,000 20
3 Parking Lot $ 25,000 15
$ 397,916
C Roger Hill Park
Pavilion $ 150,000 30
D Future Park; NE Sector
Pavilion $ 225,000 30
Assets Reserves
G Vehicles: User: EST. Cost
Truck 1 Louis Lawman $ 45,000
Truck 2 Larry Neale $ 40,000
Truck 3 Garrett Hardy $ 40,000
Truck 4 David DelValle $ 40,000
Truck 5 Future $ 40,000
$ 205,000
H Equipment:
Off-Road 1 $ 15,000
Off-Road 2 $ 15,000
Mower $ 8,000
Other $ 5,000
$ 43,000
ALL TOTAL $ 248,000
Useful Life
in Years
5
5
5
5
5
5
5
5
5
$
$
$
$
$
$
$
$
$
$
$
$
Annual Depr.
9,000
8,000
8,000
8,000
8,000
41,000
3,000
3,000
1,600
1,000
8,600
49,600
Replacement
Year 1
2023
2020
2021
2024
2025
2025
2025
2023
2021
Replacement
Year 2
2028
2025
2026
2029
2030
2030
2030
2028
2026
Replacement
Year 3
2034
2031
2032
2035
2036
2036
2036
2034
2032
Replacement
Year 4
2039
2036
2037
2040
2041
2041
2041
2039
2037
Replacement
Year 4
2044
2041
2042
2045
2046
2046
2046
2044
2042
E Stormwater System
$ 2,000,000 50
F District Park at Waterside Place
$ 500,000 30
Page 12

I I
C
C
C
Lakewood Ranch Stewardship District
Parks/Facilities/Assets Reserves updated on 8/1/2019
FY YEAR ENDING: 2020 2021 2022 2023 2024 2025 2026
increase draw balance increase draw balance increase balance increase draw balance increase draw balance increase draw balance increase draw balance
A1 12,933 12,933 13,192 26,124 13,455 39,580 13,724 53,304 13,999 67,303 14,279 81,582 14,565 96,147
A2 2,465 2,465 2,514 4,979 2,565 7,544 2,616 10,160 2,668 12,828 2,722 15,550 2,776 18,326
A3 1,667 1,667 1,700 3,367 1,734 5,101 1,769 6,869 1,804 8,673 1,840 10,514 1,877 12,390
B1 7,131 7,131 7,273 14,404 7,419 21,822 7,567 29,389 7,718 37,108 7,873 44,980 8,030 53,010
B2 7,950 7,950 8,109 16,059 8,271 24,330 8,437 32,767 8,605 41,372 8,777 50,150 8,953 59,103
B3 1,667 1,667 1,700 3,367 1,734 5,101 1,769 6,869 1,804 8,673 1,840 10,514 1,877 12,390
5,000 5,000 5,100 10,100 5,202 15,302 5,306 20,608 5,412 26,020 5,520 31,541 5,631 37,171
D 7,500 7,500 7,650 15,150 7,803 22,953 7,959 30,912 8,118 39,030 8,281 47,311 8,446 55,757
E 40,000 40,000 40,800 80,800 41,616 122,416 42,448 164,864 43,297 208,162 44,163 252,325 45,046 297,371
F 16,667 16,667 17,000 33,667 17,340 51,007 17,687 68,693 18,041 86,734 18,401 105,135 18,769 123,905
G 41,000 (40,000) 1,000 41,820 (40,000) 2,820 42,656 45,476 43,510 (45,000) 43,986 44,380 (40,000) 48,366 45,267 (80,000) 13,633 46,173 (40,000) 19,806
H 8,600 8,600 8,772 (5,000) 12,372 8,947 21,319 9,126 (8,000) 22,446 9,309 31,755 9,495 (30,000) 11,250 9,685 (5,000) 15,935
TOTAL 152,578 (40,000) 112,578 155,630 (45,000) 223,208 158,743 381,951 161,917 (53,000) 490,868 165,156 (40,000) 616,024 168,459 (110,000) 674,483 171,828 (45,000) 801,311
year 1 2 3 4 5 6 7
appr
opria
tions
ap
prop
riatio
ns
appr
opria
tions
A1
A2
A3
B1
B2
B3
D
E
F
G
H
TOTAL
year
2027
increase balance
2028
increase draw balance
2029
increase draw balance
2030
increase draw balance
2031
increase draw balance
2032
increase draw balance
2033
increase balance
14,856 111,002 15,153 126,155 15,456 141,611 15,765 157,376 16,080 173,457 16,402 189,859 16,730 206,589
2,832 21,157 2,888 24,045 2,946 26,991 3,005 29,996 3,065 33,061 3,126 36,187 3,189 39,376
1,914 14,305 1,953 16,258 1,992 18,250 2,032 20,281 2,072 22,353 2,114 24,467 2,156 26,623
8,191 61,201 8,355 69,556 8,522 78,077 8,692 86,769 8,866 95,635 9,043 104,679 9,224 113,903
9,132 68,235 9,315 77,549 9,501 87,050 9,691 96,741 9,885 106,626 10,083 116,709 10,284 126,993
1,914 14,305 1,953 16,258 1,992 18,250 2,032 20,281 2,072 22,353 2,114 24,467 2,156 26,623
5,743 42,915 5,858 48,773 5,975 54,749 6,095 60,844 6,217 67,060 6,341 73,402 6,468 79,870
8,615 64,372 8,787 73,160 8,963 82,123 9,142 91,265 9,325 100,591 9,512 110,102 9,702 119,805
45,947 343,319 46,866 390,185 47,804 47,804 48,760 96,563 49,735 146,298 50,730 197,028 51,744 248,772
19,145 143,049 19,528 162,577 19,918 19,918 20,317 40,235 20,723 60,958 21,137 82,095 21,560 103,655
47,096 66,902 48,038 (45,000) 69,940 48,999 (40,000) 78,939 49,979 (40,000) 88,917 50,978 (40,000) 99,896 51,998 (40,000) 111,894 53,038 164,931
9,879 25,814 10,076 (8,000) 27,890 10,278 38,168 10,483 (30,000) 18,651 10,693 29,344 10,907 (5,000) 35,251 11,125 46,376
175,265 976,576 178,770 (53,000) 1,102,346 182,345 (40,000) 691,929 185,992 (70,000) 807,921 189,712 (40,000) 957,633 193,506 (45,000) 1,106,139 197,376 1,303,516
8 9 10 11 12 13 14
2034 2035 2036 2037 2038 2039 2040
increase draw balance increase draw balance increase draw balance increase draw balance increase balance increase draw balance increase draw balance
A1 17,065 223,653 17,406 241,059 17,754 258,813 18,109 276,923 18,471 295,394 18,841 314,235 19,218 333,452
A2 3,253 42,628 3,318 45,946 3,384 49,330 3,452 52,781 3,521 56,302 3,591 59,893 3,663 (61,625) 1,931
A3 2,199 28,822 2,243 (30,000) 1,065 2,288 3,353 2,334 5,687 2,380 8,068 2,428 10,496 2,477 12,972
B1 9,409 123,311 9,597 132,908 9,789 142,697 9,984 152,681 10,184 162,865 10,388 173,253 10,596 183,849
B2 10,490 137,483 10,700 148,182 10,914 159,096 11,132 170,228 11,355 181,582 11,582 193,164 11,813 (198,750) 6,227
B3 2,199 28,822 2,243 (30,000) 1,065 2,288 3,353 2,334 5,687 2,380 8,068 2,428 10,496 2,477 12,972
6,597 86,467 6,729 93,196 6,864 100,060 7,001 107,062 7,141 114,203 7,284 121,487 7,430 128,917
D 9,896 129,701 10,094 139,795 10,296 150,091 10,502 160,592 10,712 171,304 10,926 182,230 11,145 193,375
E 52,779 301,552 53,835 355,386 54,911 410,298 56,010 466,307 57,130 523,437 58,272 581,710 59,438 641,148
F 21,991 125,646 22,431 148,078 22,880 170,957 23,337 194,295 23,804 218,099 24,280 242,379 24,766 267,145
G 54,099 (45,000) 174,030 55,181 (40,000) 189,211 56,284 (40,000) 205,495 57,410 (40,000) 222,905 58,558 281,463 59,729 (45,000) 296,192 60,924 (40,000) 317,116
H 11,348 (8,000) 49,723 11,574 61,298 11,806 (30,000) 43,104 12,042 (5,000) 50,146 12,283 62,429 12,529 (8,000) 66,957 12,779 79,737
TOTAL 201,324 (53,000) 1,451,840 205,350 (100,000) 1,557,190 209,457 (70,000) 1,696,647 213,647 (45,000) 1,865,294 217,920 2,083,214 222,278 (53,000) 2,252,492 226,723 (300,375) 2,178,840
year 15 16 17 18 19 20 21
page 14
C
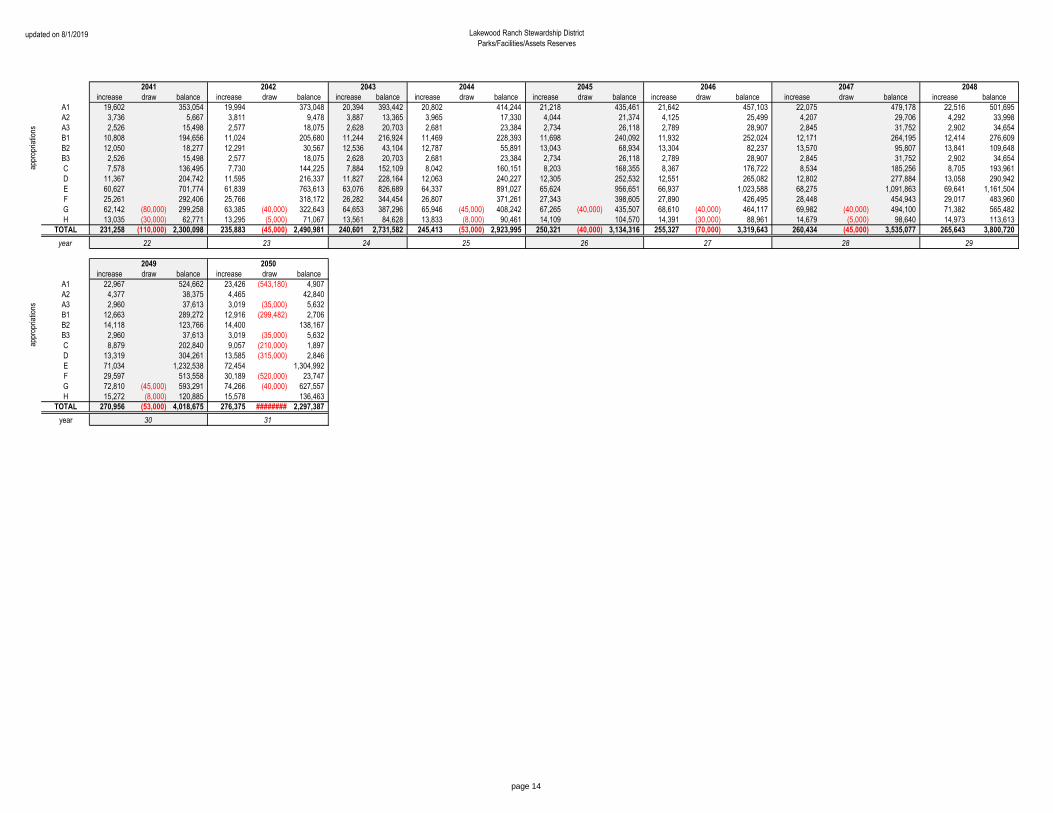
Lakewood Ranch Stewardship District updated on 8/1/2019 Parks/Facilities/Assets Reserves
2041
increase draw balance
A1 19,602 353,054 19,994 373,048 20,394 393,442 20,802 414,244 21,218 435,461 21,642 457,103 22,075 479,178 22,516 501,695
A2 3,736 5,667 3,811 9,478 3,887 13,365 3,965 17,330 4,044 21,374 4,125 25,499 4,207 29,706 4,292 33,998
A3 2,526 15,498 2,577 18,075 2,628 20,703 2,681 23,384 2,734 26,118 2,789 28,907 2,845 31,752 2,902 34,654
B1 10,808 194,656 11,024 205,680 11,244 216,924 11,469 228,393 11,698 240,092 11,932 252,024 12,171 264,195 12,414 276,609
B2 12,050 18,277 12,291 30,567 12,536 43,104 12,787 55,891 13,043 68,934 13,304 82,237 13,570 95,807 13,841 109,648
B3 2,526 15,498 2,577 18,075 2,628 20,703 2,681 23,384 2,734 26,118 2,789 28,907 2,845 31,752 2,902 34,654
C 7,578 136,495 7,730 144,225 7,884 152,109 8,042 160,151 8,203 168,355 8,367 176,722 8,534 185,256 8,705 193,961
D 11,367 204,742 11,595 216,337 11,827 228,164 12,063 240,227 12,305 252,532 12,551 265,082 12,802 277,884 13,058 290,942
E 60,627 701,774 61,839 763,613 63,076 826,689 64,337 891,027 65,624 956,651 66,937 1,023,588 68,275 1,091,863 69,641 1,161,504
F 25,261 292,406 25,766 318,172 26,282 344,454 26,807 371,261 27,343 398,605 27,890 426,495 28,448 454,943 29,017 483,960
G 62,142 (80,000) 299,258 63,385 (40,000) 322,643 64,653 387,296 65,946 (45,000) 408,242 67,265 (40,000) 435,507 68,610 (40,000) 464,117 69,982 (40,000) 494,100 71,382 565,482
H 13,035 (30,000) 62,771 13,295 (5,000) 71,067 13,561 84,628 13,833 (8,000) 90,461 14,109 104,570 14,391 (30,000) 88,961 14,679 (5,000) 98,640 14,973 113,613
TOTAL 231,258 (110,000) 2,300,098
year 22
2042
increase draw balance
235,883 (45,000) 2,490,981
23
2043
increase balance
240,601 2,731,582
24
2044
increase draw balance
245,413 (53,000) 2,923,995
25
2045
increase draw balance
250,321 (40,000) 3,134,316
26
2046
increase draw balance
appr
opria
tions
ap
prop
riatio
ns
255,327 (70,000) 3,319,643
27
2047
increase draw balance
260,434 (45,000) 3,535,077
28
2048
increase balance
265,643 3,800,720
2049
increase draw
A1 22,967
A2 4,377
A3 2,960
B1 12,663
B2 14,118
B3 2,960
8,879
D 13,319
E 71,034
F 29,597
G 72,810 (45,000)
H 15,272 (8,000)
TOTAL 270,956 (53,000)
year 30
balance
524,662
38,375
37,613
289,272
123,766
37,613
202,840
304,261
1,232,538
513,558
593,291
120,885
4,018,675
2050
increase draw
23,426
4,465
3,019
12,916
14,400
3,019
9,057
13,585
72,454
30,189
74,266
15,578
(543,180)
(35,000)
(299,482)
(35,000)
(210,000)
(315,000)
(520,000)
(40,000)
276,375 ########
31
balance
4,907
42,840
5,632
2,706
138,167
5,632
1,897
2,846
1,304,992
23,747
627,557
136,463
2,297,387
page 14
29

Stewardship District Payroll Projection At Buildout
Position Total Cost
Operations Director $ 128,000
Construction/Public Works Manager $ 83,200
Maintenance Manager $ 79,950
Park Services Lead $ 43,050
Park Services/Maint. Tech $ 36,900
Park Services/Maint. Tech $ 36,900
Park Services/Maint. Tech $ 36,900
Administrative Assit. $ 55,350
$ 500,250
page 15