lake thunderbird water quality 2013
TRANSCRIPT

Oklahoma Water Resources Board
Lake Thunderbird
Water Quality
2013
for the
Central Oklahoma Master Conservancy District
February 6th, 2014
FINAL REPORT
Oklahoma Water Resources Board 3800 North Classen Boulevard, Oklahoma City, OK 73118

2
Table of Contents
Executive Summary ........................................................................................................................ 5 Introduction ..................................................................................................................................... 6 Water Quality Evaluation ............................................................................................................... 7
Sampling Regime ..................................................................................................................................... 7 Additional Data Sources ........................................................................................................................... 7 Quality Assurance and Quality Control (QA/QC) .................................................................................... 9
Duplicate and Replicate Samples ....................................................................................................... 10 Climate .......................................................................................................................................... 11 Hydrologic Budget ........................................................................................................................ 12
Results .................................................................................................................................................... 13
Sources of Error ...................................................................................................................................... 16
Thermal Stratification, Temperature, and Dissolved Oxygen ...................................................... 17 Nutrients and Chlorophyll-a ......................................................................................................... 24
Phosphorus – P ....................................................................................................................................... 26
Nitrogen – N ........................................................................................................................................... 28
Nutrient Budget ...................................................................................................................................... 31
Riverine Nutrients................................................................................................................................... 32
Chlorophyll-a – Chl-a ............................................................................................................................ 33
General Water Quality .................................................................................................................. 35 Total Organic Carbon - TOC .................................................................................................................. 35
Trophic State Index - TSI ....................................................................................................................... 38
pH, Oxidation-Reduction (redox) Potentials, and Dissolved Metals ...................................................... 40
Taste and Odor Complaints .......................................................................................................... 41 Water Quality Standards ............................................................................................................... 42
Dissolved Oxygen – DO ......................................................................................................................... 43
Chlorophyll-a – Chl-a ............................................................................................................................ 43
Water Clarity .......................................................................................................................................... 43
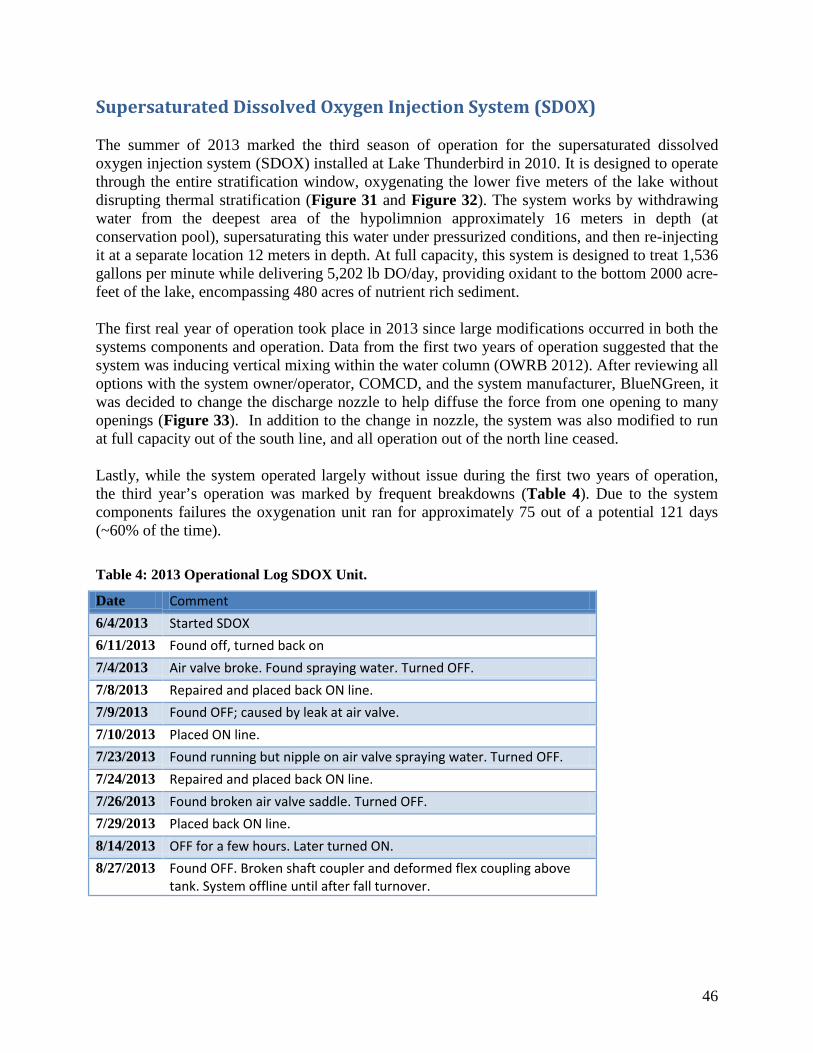
Supersaturated Dissolved Oxygen Injection System (SDOX)...................................................... 46 SDOX Effect on Thermal Stratification ................................................................................................. 48
SDOX Effect on Dissolved Oxygen and Oxidation-Reduction Potential .............................................. 51
SDOX Effect on Nutrients, and Chlorophyll-a ...................................................................................... 58
SDOX Discussion ................................................................................................................................... 59
Discussion ..................................................................................................................................... 61 Water Quality ......................................................................................................................................... 61
State Water Quality Standards ................................................................................................................ 61
Closing Remarks..................................................................................................................................... 62
References ..................................................................................................................................... 63 Appendix A: Quality Control Data ............................................................................................... 64 Appendix B: Riverine Nutrient Data ............................................................................................ 66
3
Table of Figures
Figure 1. Lake Thunderbird 2013 sampling sites ........................................................................... 8 Figure 2. Statistical summary of Lake Thunderbird duplicate samples April 26, 2013- December
18, 2013................................................................................................................................. 10 Figure 3. 2013 Inflow, precipitation, and elevation data for Lake Thunderbird .......................... 11 Figure 4. 2013 Average daily temperature values at the Norman mesonet station. ..................... 12 Figure 5. 2013 Lake Thunderbird input and output sources by month. ........................................ 15 Figure 6. A typical temperature and dissolved oxygen vertical profile for Lake Thunderbird .... 17 Figure 7. Temperature and Dissolved Oxygen Vertical Profile. Site 1: March 13, 2013 – June 6,
2013....................................................................................................................................... 19 Figure 8. Temperature and Dissolved Oxygen Vertical Profile Site 1: June 19, 2013 – August 15,
2013....................................................................................................................................... 20 Figure 9. Temperature and Dissolved Oxygen Vertical Profile Site 1: August 21, 2013 –
December 18, 2013.. ............................................................................................................. 21 Figure 10. Lake Thunderbird isopleths showing temperature (C), and dissolved oxygen (mg/L)
with depth at Site 1, by date for 2013 ................................................................................... 22 Figure 11. Annual average Total N, Total P, and TN:TP ratio for 2006 through 2013................ 25 Figure 12. 2013 Site 1 surface TN:TP molecular ratio ................................................................. 26 Figure 13: 2013 Lake Thunderbird surface ortho-P and TP, by date, at Site 1. ........................... 27 Figure 14: 2013 Lake Thunderbird total phosphorus and ortho-phosphorus. ............................. 27 Figure 15. 2012 Lake Thunderbird NO2-NO3, Ammonia, Total Kjeldahl N, and Total N ......... 29 Figure 16. 2013 Site 1 Surface NO2-NO3, N-Ammonia and Total Kjeldahl N at Site 1............. 30 Figure 17. Lake Thunderbird lacustrine surface Chl-a (g/L) by site ............................................ 33 Figure 18. Lake Thunderbird riverine surface Chl-a (g/L) by site ............................................... 34 Figure 19. 2001-2013 Lake Thunderbird surface Chl-a (ppb) at Site 1 ....................................... 35 Figure 20. TOC concentrations and Chl-a at Site 1 surface on Lake Thunderbird ...................... 36 Figure 21. 2013 Lake Thunderbird TOC vs Chl- a for raw water samples .................................. 37 Figure 22: Historical TOC vs Chl-a plot ...................................................................................... 37 Figure 23. Carlson's Trophic State Index values for Lake Thunderbird 2013 at Site 1. ............... 38 Figure 24. Potential nutrient limited and nonnutrient-limited causes for the deviation of biomass-
based trophic state index. ...................................................................................................... 39 Figure 25. 2013 Lake Thunderbird pH (S.U.) versus Depth Over Time: Site 1 ........................... 40 Figure 26. 2013 Lake Thunderbird oxidation-reduction potential (mV) versus depth (M) over
time: Site 1. Area below thick black line represents the strong reducing conditions responsible for reduction of sediment bound phosphorous. ................................................. 41
Figure 27. Taste and odor complaints to the City of Norman during 2012 .................................. 42 Figure 28. 2013 Lake Thunderbird Secchi disk depth (in centimeters) by site, where boxes
represent 25% of the data distribution above and below the median (horizontal black line), and lines (or whiskers) represent the other 50% of the data distribution. ............................. 44
Figure 29. 2013 Lake Thunderbird turbidity (NTU), by site, where boxes represent 25% of the data distribution above and below the median (horizontal black line), and lines (or whiskers) represent the other 50% of the data distribution (horizontal blue line represents state water quality standard).................................................................................................................... 45
Figure 30. Conceptual Illustration of the SDOX System at Lake Thunderbird ............................ 47 Figure 31. Map of SDOX location and current configuration. ..................................................... 47 Figure 32. Schematic of the modified nozzle ............................................................................... 48
4
Figure 33. 2009, 2011, 2012, and 2013 seasonal temperature plots for Site 1. ............................ 49 Figure 34: Relative Thermal Resistance Plots from 2010, 2011, and early 2012. ....................... 50 Figure 35: Relative Thermal Resistance plots for 2011, 2012, and 2013 ..................................... 50 Figure 36. 2009, 2011, 2012, and 2013 Seasonal Dissolved Oxygen Plot for Site 1. .................. 53 Figure 37. Lake Thunderbird 2009, 2011, 2012, and 2013 oxidation-reduction potential isopleth
............................................................................................................................................... 56 Figure 38. Temperature, Oxidation-Reduction Potential, and Dissolved Oxygen by depth. ....... 57
List of Tables
Table 1. 2013 Water quality sampling dates and parameters measured. ........................................ 9 Table 2. Lake Thunderbird 2013 water budget calculations expressed in acre-feet. .................... 14 Table 3. 2013 Lake Thunderbird Site 1 Phosphorus Mass (kg) at Depth Intervals by Sample
Date.. ..................................................................................................................................... 31 Table 4: 2013 Operational Log SDOX Unit. ................................................................................ 46

5
Executive Summary Lake Thunderbird is listed in Chapter 45, Part 5 of the Oklahoma Water Quality Standards (OWQS) as a Sensitive Water Supply (SWS) (OAC 785:45-5-25(C)(4)). In 2013, lake water quality monitoring by the Oklahoma Water Resources Board (OWRB) continued to focus on the effects of the hypolimnetic oxygenation system, which began operation in 2011. The end of 2013 represents 14 years of continuous monitoring at Lake Thunderbird. The year of 2013 ended the two-year drought that began in 2011. The reservoir began the year seven feet below conservation pool but high inflows in the spring brought pool elevations three feet above conservation pool along with record high phosphorus level concentrations. The hydraulic residence time for 2013 was below average at 2.73 years, due mostly to the large releases that occurred in August. Data collected in 2013 illustrated that the modifications to the hypolimnetic oxygenation system that occurred in 2012 have reduced the vertical mixing that was observed the first year and a half of operation. Stratification was first detected in mid-May and total mixing of the water-column had occurred by October 10. Hypolimnetic anoxia was reduced in 2013, with volumetric anoxia peaking at 17% of the lake volume. Calculated sediment areal anoxia was 60% less in 2013 from the 2005-2009 average. Strong reducing conditions indicated by low to negative oxidation-reduction potentials were observed only after the hypolimnetic oxygenation system had mechanical failures, which left it inoperable for the last forty-three days of stratification. While the summer started with record high phosphorus concentrations after the first flush inflows in spring, total phosphorous levels tapered off throughout the summer before reaching the laboratory detection limit in early August. Nitrogen levels were high in the spring but became relatively stable throughout the summer. Total nitrogen to total phosphorus ratio, TN:TP, indicated strong phosphorous limiting conditions. A comparison trophic state index (TSI) plot supports phosphorous limitation throughout the summer with possible light limitation during the high inflow periods in the early spring. Mean (19 µg/L) and peak (39.6 µg/L) chlorophyll-a (Chl-a) values for 2013 were reduced from recent years, signaling a drop in algal biomass in the reservoir. Two-sample t-tests statistics revealed that mean phosphorous and Chl-a concentrations have been significantly reduced in the entrainment period since hypolimnetic oxygenation began. Taste and odor complaints did not follow the established decade old trend of peak complaints coinciding with peak Chl-a during fall turnover, instead 70% of taste and odor complaints came during January and December indicating a likely species shift to taste and odor producing blue-green algae species during the winter. Active lake and watershed management is required for Lake Thunderbird to meet OWQS for dissolved oxygen (DO) and Chl-a. Primary mitigation efforts should focus on nutrient reduction, which would affect two impaired water quality parameters: algae growth (Chl-a) and dissolved oxygen. In-lake mitigation efforts focused on minimizing the transfer of suspended solids from the riverine zones to the main lake body would show the greatest positive impact to turbidity. Continuation of the active hypolimnetic oxygenation project should continue to provide relief to the lake’s DO levels, algal problems, and drinking water taste and odor complaints. Further recommendations on future lake management of Lake Thunderbird should include the review of watershed evaluations to spur nutrient reductions in the basin.

6
Introduction Constructed by the Bureau of Reclamation, Lake Thunderbird began operation in 1966. Designated uses of the dam and the impounded water are flood control, municipal water supply, recreation, and fish and wildlife propagation. Under the authority of the Central Oklahoma Master Conservancy District (COMCD), Lake Thunderbird serves as a municipal water supply furnishing raw water for Del City, Midwest City and the City of Norman. The Oklahoma Water Resources Board (OWRB) has provided water quality-based environmental services for COMCD since 2000. The objective in 2013, in addition to routine monitoring, was to evaluate the performance of Lake Thunderbird’s supersaturated dissolved oxygen injection system (SDOX), which was implemented in 2011. Lake Thunderbird is listed as Category 5 (303d list) in the State’s 2012 Integrated Report as impaired due to excessive turbidity, low dissolved oxygen and excessive Chl-a (http://www.deq.state.ok.us/wqdnew/305b_303d/2012_draft_integrated_report.pdf). Because of these impairments, Lake Thunderbird has undergone total maximum daily load (TMDL) analysis by the Oklahoma Department of Environmental Quality (ODEQ) and approved by the Environmental Protection Agency (EPA) on November 13th 2013. In short, the TMDL analysis requires a 35% long-term average load reduction of total nitrogen (TN), total phosphorus (TP), and total suspended solids (TSS) from the 2008-2009 watershed load estimates in order to for Lake Thunderbird to meet all current WQS. This 35% load reduction scenario equates to an annual load reduction of 76,340 kg of total nitrogen per year, 15,006 kg of total phosphorus per year, and 7,470,252 kg of total suspended solids per year. For more information on the findings of the TMDL please refer to the TMDL report (http://www.deq.state.ok.us/wqdnew/tmdl/thunderbird/LakeThunderbirdFinalTMDL_ReportNov2013.pdf). In addition to the water quality standard impairment listings, collaborative work with the City of Norman has illustrated the water quality impairments have translated into elevated total organic carbon (TOC) in raw drinking water, effected taste and odor complaints in the finished drinking water, and elevated treatment costs. The City of Norman has taken steps to reduce taste and odor complaints in the treatment process, but some taste and odor complaints still exist. In an attempt to mitigate the result of the cultural eutrophication witnessed in the reservoir, the COMCD applied and was granted funding, through the American Recovery and Reinvestment Act, to install and operate an oxygenation system designed to oxygenate the deepest portion of the anoxic hypolimnion in the lake while leaving thermal stratification intact. The targeted impact of providing an oxygenated hypolimnion include attainment of dissolved oxygen WQS, elimination of reducing conditions in the hypolimnion, and reductions of internal phosphorous load, dissolved metals, and peak Chl-a events. Data collected in 2013, represents the third season of SDOX operation.

7
Water Quality Evaluation
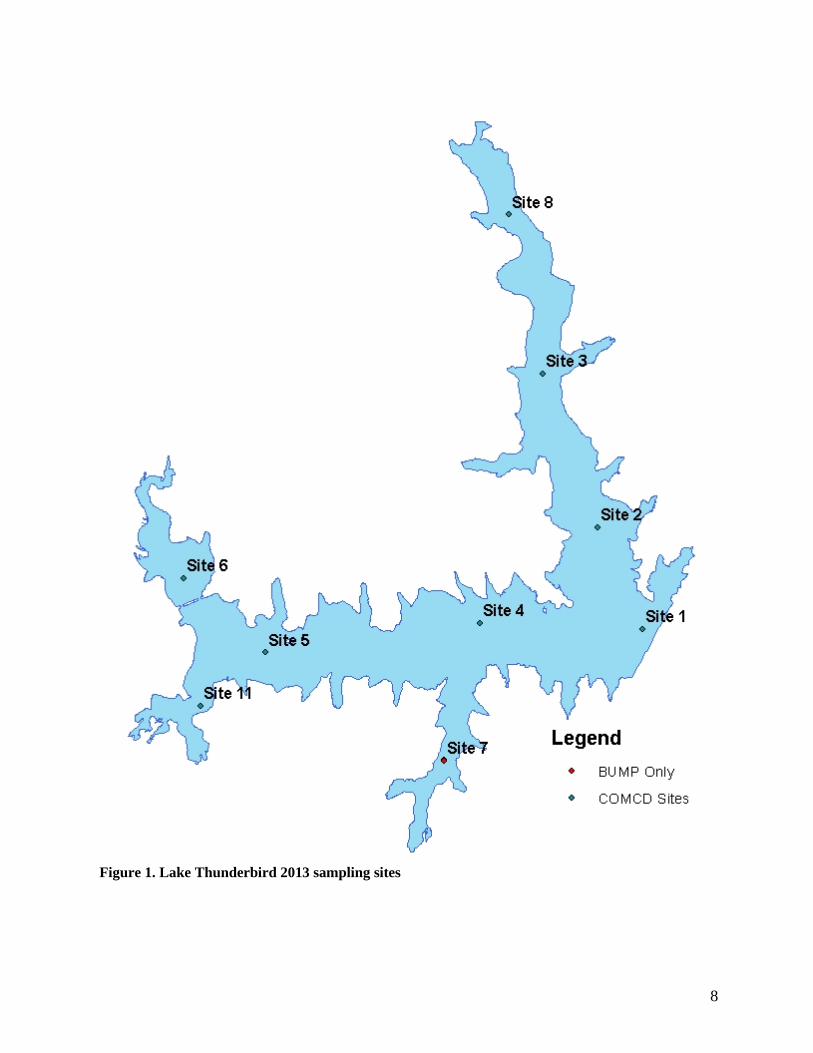
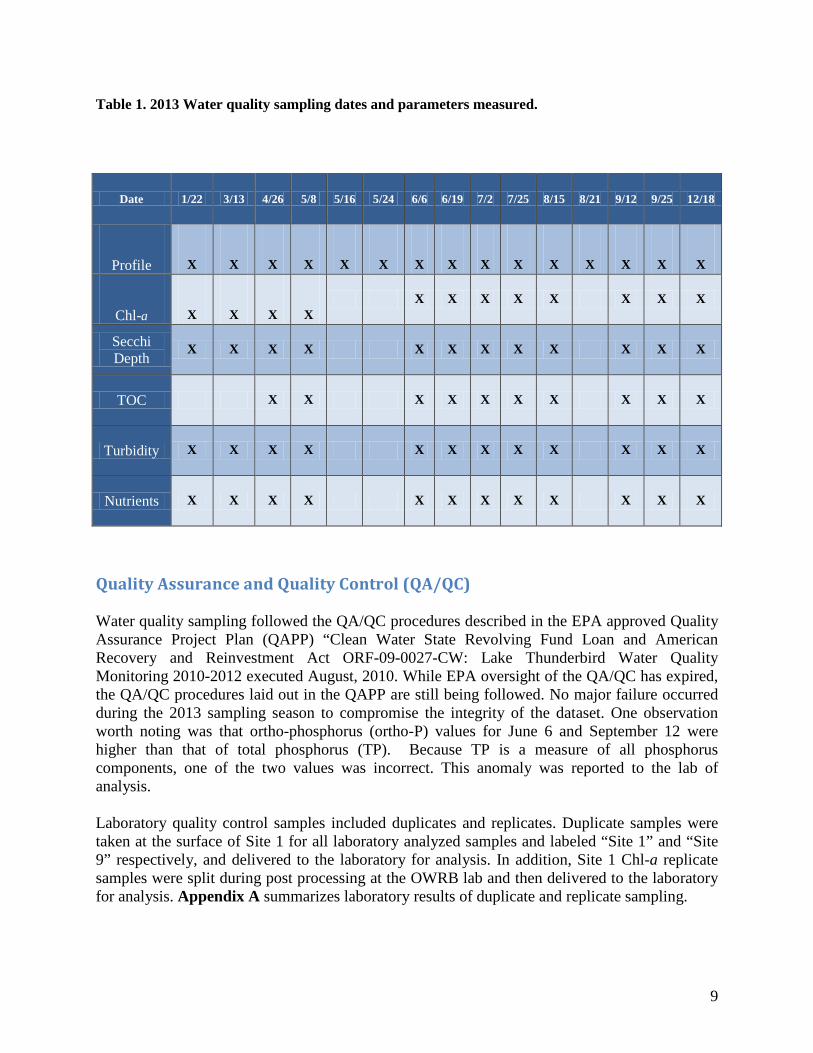
Sampling Regime In 2013, Lake Thunderbird water quality sampling occurred from April 26 through December 18 (Table 1) at the sites indicated in Figure 1. All sites were sampled at each visit. Sites 1, 2, and 4 represent the lacustrine zones of the lake. Site 6 embodies the riverine zone of the Little River arm, while Site 11 represents the riverine zone of Dave Blue Creek. Site 5 represents the transition zone between these two riverine sites to the main body of the lake. Site 8 represents the Hog Creek riverine zone. Site 3 represents the transition zone of the Hog Creek arm. On every visit, all sites had water quality profiles performed which included oxidation-reduction potential (ORP), DO saturation and concentration, temperature, specific conductance, total dissolved solids (TDS) and pH. Each water-quality profile was measured in approximately one-meter vertical intervals from the lake surface to sediment at each site. In addition, nutrient samples were collected at the surface of Sites 1, 6, 8 and 11 and at 4-meter depth intervals of Site 1 to the bottom. Analysis performed on these samples included phosphorus (P) and nitrogen (N) series. Total organic carbon samples were also collected at the surface of Site 1. Secchi disk depth, surface Chl-a, and turbidity samples were collected at all nine sites.
Additional Data Sources In 2013, the State of Oklahoma’s Beneficial Use Monitoring program (BUMP) sampled Lake Thunderbird three times in January, April, and August. The BUMP program samples at six identical sites as the COMCD funded work (Sites 1-6) and one additional site on the Clear Creek arm, Site 7. The BUMP sampling regime is similar in that water quality profiles are measured at every site with identical parameters (ORP, DO, temperature, specific conductance, TDS, and pH) at one meter intervals. All chemical/laboratory analysis are surface samples and include phosphorus and nitrogen series, chloride, sulfate, alkalinity, hardness, turbidity, enterococci and Chl-a. In addition, zooplankton and phytoplankton tows were performed at Site 1. Relevant BUMP data has been used in this report to provide additional information when needed.
8
Figure 1. Lake Thunderbird 2013 sampling sites
9
Table 1. 2013 Water quality sampling dates and parameters measured.
Quality Assurance and Quality Control (QA/QC) Water quality sampling followed the QA/QC procedures described in the EPA approved Quality Assurance Project Plan (QAPP) “Clean Water State Revolving Fund Loan and American Recovery and Reinvestment Act ORF-09-0027-CW: Lake Thunderbird Water Quality Monitoring 2010-2012 executed August, 2010. While EPA oversight of the QA/QC has expired, the QA/QC procedures laid out in the QAPP are still being followed. No major failure occurred during the 2013 sampling season to compromise the integrity of the dataset. One observation worth noting was that ortho-phosphorus (ortho-P) values for June 6 and September 12 were higher than that of total phosphorus (TP). Because TP is a measure of all phosphorus components, one of the two values was incorrect. This anomaly was reported to the lab of analysis. Laboratory quality control samples included duplicates and replicates. Duplicate samples were taken at the surface of Site 1 for all laboratory analyzed samples and labeled “Site 1” and “Site 9” respectively, and delivered to the laboratory for analysis. In addition, Site 1 Chl-a replicate samples were split during post processing at the OWRB lab and then delivered to the laboratory for analysis. Appendix A summarizes laboratory results of duplicate and replicate sampling.
Date 1/22 3/13 4/26 5/8 5/16 5/24 6/6 6/19 7/2 7/25 8/15 8/21 9/12 9/25 12/18
Profile X X X X X X X X X X X X X X X
Chl-a X X X X X X X X X X X X
Secchi Depth
X X X X X X X X X X X X
TOC X X X X X X X X X X
Turbidity X X X X X X X X X X X X
Nutrients X X X X X X X X X X X X

10
Duplicate and Replicate Samples Duplicate samples yield an overall estimate of error either due to sampler or laboratory error. This paired data set yields a difference between the two “identical” samples. Site 9 is the duplicate sample label for Site 1 surface samples. The percent absolute difference (PAD) was used to describe the precision of each laboratory parameter based on the paired comparison of duplicate samples. Eq.1 PAD = xS1 – xS9/ x *100 For each duplicate sample report parameter, equation 1 was applied. Results were tabulated and statistical summaries were generated using the box and whisker plot function (Figure 2). All parameters showed relatively good precision with median PAD below 20. Note that while PAD is good over the entire sampling season, instances of high PAD for Nitrite-Nitrate as N, and Chlorophyll-a occurred and is reflected by the large upper quartile.
Figure 2. Statistical summary of Lake Thunderbird duplicate samples April 26, 2013- December 18, 2013. (Box represents the middle 50%, the center bar the median value, top and bottom stems the upper and lower 25% quartile and asterisks as outliers)
11
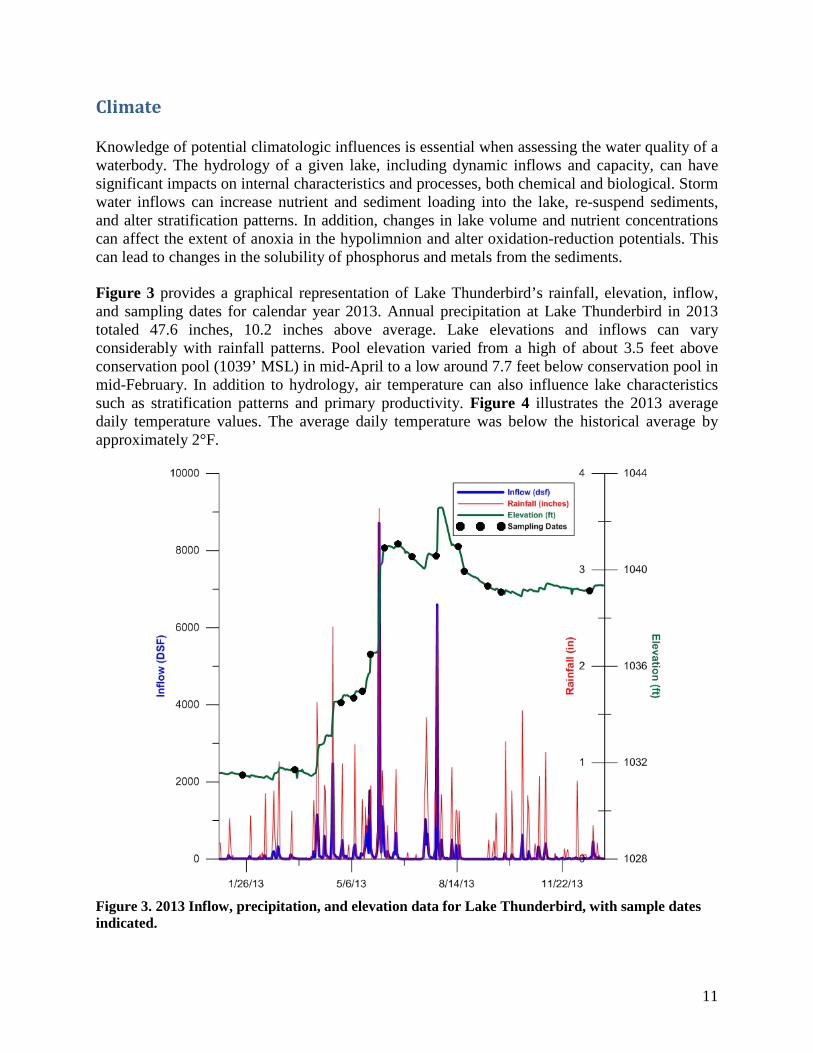
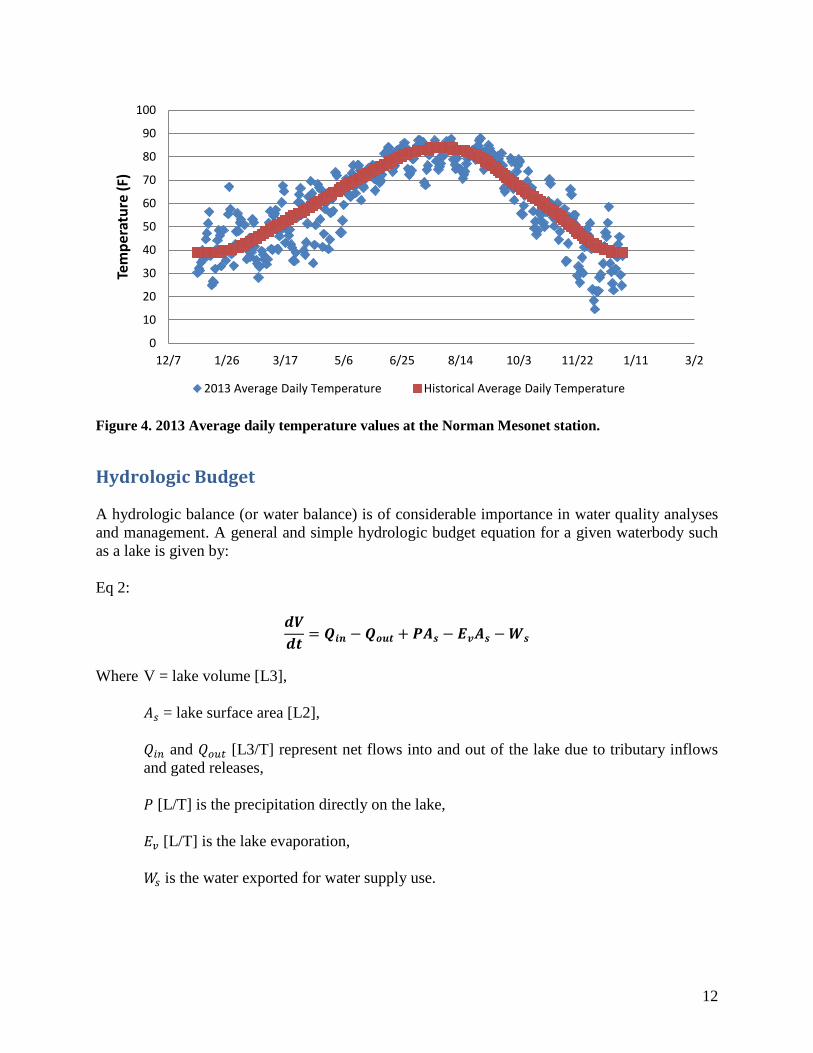
Climate Knowledge of potential climatologic influences is essential when assessing the water quality of a waterbody. The hydrology of a given lake, including dynamic inflows and capacity, can have significant impacts on internal characteristics and processes, both chemical and biological. Storm water inflows can increase nutrient and sediment loading into the lake, re-suspend sediments, and alter stratification patterns. In addition, changes in lake volume and nutrient concentrations can affect the extent of anoxia in the hypolimnion and alter oxidation-reduction potentials. This can lead to changes in the solubility of phosphorus and metals from the sediments. Figure 3 provides a graphical representation of Lake Thunderbird’s rainfall, elevation, inflow, and sampling dates for calendar year 2013. Annual precipitation at Lake Thunderbird in 2013 totaled 47.6 inches, 10.2 inches above average. Lake elevations and inflows can vary considerably with rainfall patterns. Pool elevation varied from a high of about 3.5 feet above conservation pool (1039’ MSL) in mid-April to a low around 7.7 feet below conservation pool in mid-February. In addition to hydrology, air temperature can also influence lake characteristics such as stratification patterns and primary productivity. Figure 4 illustrates the 2013 average daily temperature values. The average daily temperature was below the historical average by approximately 2°F.
Figure 3. 2013 Inflow, precipitation, and elevation data for Lake Thunderbird, with sample dates indicated.
12
Figure 4. 2013 Average daily temperature values at the Norman Mesonet station.
Hydrologic Budget A hydrologic balance (or water balance) is of considerable importance in water quality analyses and management. A general and simple hydrologic budget equation for a given waterbody such as a lake is given by: Eq 2:
𝒅𝑽𝒅𝒕 = 𝑸𝒊𝒏 − 𝑸𝒐𝒖𝒕 + 𝑷𝑨𝒔 − 𝑬𝒗𝑨𝒔 −𝑾𝒔
Where V = lake volume [L3],
𝐴𝑠 = lake surface area [L2], 𝑄𝑖𝑛 and 𝑄𝑜𝑢𝑡 [L3/T] represent net flows into and out of the lake due to tributary inflows and gated releases, 𝑃 [L/T] is the precipitation directly on the lake, 𝐸𝑣 [L/T] is the lake evaporation, 𝑊𝑠 is the water exported for water supply use.
0
10
20
30
40
50
60
70
80
90
100
12/7 1/26 3/17 5/6 6/25 8/14 10/3 11/22 1/11 3/2
Tem
pera
ture
(F)
2013 Average Daily Temperature Historical Average Daily Temperature

13
In other words, the rate of change in volume of water stored in or on the given area per unit time is equal to the rate of inflow from all sources, minus the rate of outflows. The input or inflows to a lake may include surface inflow, subsurface inflow, and water imported into the lake. The outputs may include surface and subsurface outputs and water exported (e.g. water supply) from the lake. For Lake Thunderbird, subsurface flow is likely insignificant, based on the relatively impermeable lake substrate. The inputs to Lake Thunderbird include precipitation and inflow from the tributaries, which includes all surface runoff in the basin. The outputs are evaporation, dam releases (spilled), and water supply intake. Precipitation was estimated from the direct rainfall measurements/data provided by the United States Army Corps of Engineers (USACE). The precipitation contribution to the total inflows was obtained by multiplying the daily rainfall amounts by the surface area of the lake on each date, as shown by: 𝑸𝒑= P*𝑨𝒔
where P [L/T] is rainfall amount and 𝑨𝒔 [L2] is the surface area of the lake. Daily evaporation rates were calculated and reported by the USACE. Here, empirical equations were used to relate solar radiation, wind speed, relative humidity, and average daily air temperature to the rate of evaporation from the lake. These rates are multiplied by the daily average surface area of the lake to give the amount of water evaporated per unit time. 𝑸𝒆 = 𝑬𝒗*𝑨𝒔 where Ev [L/T] is the evaporation rate and 𝑨𝒔 [L2] is the surface area of the lake. Water outputs from Lake Thunderbird include gated dam releases and water supply withdraws. Dam releases are reported by the USACE, while COMCD reports water supply withdraws. Change in volume or storage was recorded by the USACE at the end of every day. The lake volumes, corresponding to the elevations, were computed and the difference between them is the change in volume for that month. The volumes used were estimated from elevation-capacity curves generated from the OWRB’s 2001 bathymetric survey of the lake.
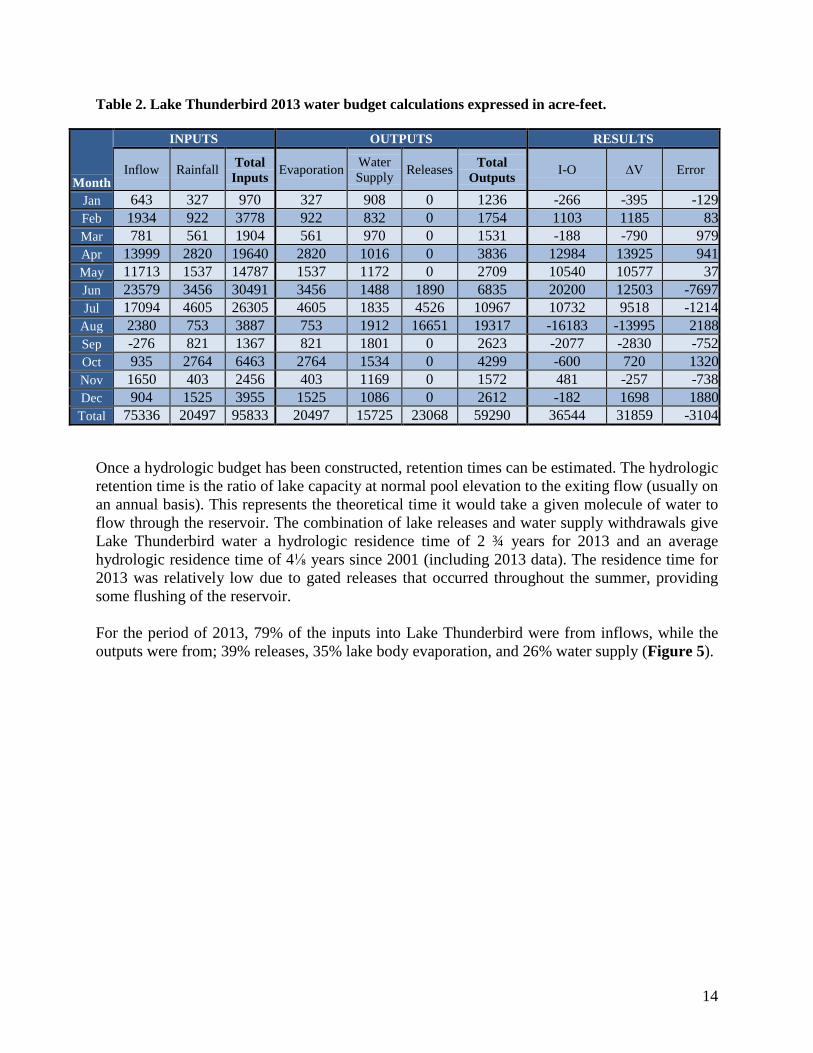
Results Water budget calculations were summarized on a monthly basis for Lake Thunderbird as described previously (Table 2). In the table below, Total Inputs is the sum of all the flows into the lake and Total Outputs is the sum of all the outflows from the lake. From equation 2, the difference between the inputs and the outputs must be the same as the change in volume of the lake for an error free water budget. The difference between the inflow and outflow is in the I-O column. Total monthly error is calculated as the difference between the change in lake volume based on elevation and I-O. Examination of the estimated budget for Lake Thunderbird showed that estimated inputs and outputs were close to the actual volume changes with relatively little error. Errors in the hydraulic budget will be discussed in the next section.
14
Table 2. Lake Thunderbird 2013 water budget calculations expressed in acre-feet.
Month
INPUTS OUTPUTS RESULTS
Inflow Rainfall Total Inputs Evaporation Water
Supply Releases Total Outputs I-O ∆V Error
Jan 643 327 970 327 908 0 1236 -266 -395 -129 Feb 1934 922 3778 922 832 0 1754 1103 1185 83 Mar 781 561 1904 561 970 0 1531 -188 -790 979 Apr 13999 2820 19640 2820 1016 0 3836 12984 13925 941 May 11713 1537 14787 1537 1172 0 2709 10540 10577 37 Jun 23579 3456 30491 3456 1488 1890 6835 20200 12503 -7697 Jul 17094 4605 26305 4605 1835 4526 10967 10732 9518 -1214
Aug 2380 753 3887 753 1912 16651 19317 -16183 -13995 2188 Sep -276 821 1367 821 1801 0 2623 -2077 -2830 -752 Oct 935 2764 6463 2764 1534 0 4299 -600 720 1320 Nov 1650 403 2456 403 1169 0 1572 481 -257 -738 Dec 904 1525 3955 1525 1086 0 2612 -182 1698 1880
Total 75336 20497 95833 20497 15725 23068 59290 36544 31859 -3104
Once a hydrologic budget has been constructed, retention times can be estimated. The hydrologic retention time is the ratio of lake capacity at normal pool elevation to the exiting flow (usually on an annual basis). This represents the theoretical time it would take a given molecule of water to flow through the reservoir. The combination of lake releases and water supply withdrawals give Lake Thunderbird water a hydrologic residence time of 2 ¾ years for 2013 and an average hydrologic residence time of 4⅛ years since 2001 (including 2013 data). The residence time for 2013 was relatively low due to gated releases that occurred throughout the summer, providing some flushing of the reservoir. For the period of 2013, 79% of the inputs into Lake Thunderbird were from inflows, while the outputs were from; 39% releases, 35% lake body evaporation, and 26% water supply (Figure 5).

15
Figure 5. 2013 Lake Thunderbird input and output sources by month, expressed as the percent of totals.
0
5000
10000
15000
20000
25000
30000
Jan Feb Mar Apr May Jun Jul Aug Sep Oct Nov Dec
Volu
me
(acr
e-fe
et)
Month
Inputs vs Outputs
Inputs
Outputs
79%
21%
Inputs
Inflow
Rainfall
35%
26%
39%
Outputs Evaporation
Water Supply
Releases
16
Sources of Error Although robust, the hydrologic budget does contain error. In the 2013 calendar year, the hydrologic budget contains a cumulative annual error of 3,104 acre-feet, with an average monthly error of 259 acre-feet in 2013. Inflow from the tributaries was estimated by the USACE based on changes in lake volume using the original lake bathymetry. The 2001 survey estimates a conservation pool sedimentation rate around 400 acre-feet per year. In 2009, bathymetric surveying was performed in the areas around the dam area for design purposes of the hypolimnetic oxygenation system. This survey indicates little sediment accumulation in the dead pool of the lake compared to the 2001. Newly deposited sediment is predicted to be mostly in the upper portion of the conservation pool with a loss of approximately 5,200 acre-feet. It should be noted that the method used to calculate capacity in the original design used fewer data points than the 2001 bathymetric survey, and thereby, results in less accurate sedimentation estimates. A new survey using the same method as the 2001 survey would allow for a more accurate estimate of sedimentation based on comparable survey methods. Groundwater loss and gain to the lake were assumed negligible. This could be verified with field measurements or through a review of the geology in the area. While the hydrologic budget contains sources of error, it is still robust enough to support lake nutrient budget development and water quality modeling.

17
Thermal Stratification, Temperature, and Dissolved Oxygen As warming of the lake surface progresses through spring, the onset of stratification follows. Thermal stratification occurs when an upper, less dense layer of water (epilimnion) forms over a cooler, denser layer (hypolimnion). The metalimnion, or thermocline, is the region of greatest temperature and density changes and occurs between the epilimnion and hypolimnion (Figure 6). Because of these differences, thermal resistance to mixing prevents the epilimnion and hypolimnion from coming in contact during stratification. Therefore, when DO is consumed and depleted by the decomposition processes in the hypolimnion, it is not replenished. This process has been documented by the OWRB at Lake Thunderbird for every monitoring year to date (since 2000), and is inevitable without the influence of outside forces.
Figure 6. A typical temperature and dissolved oxygen vertical profile for Lake Thunderbird (July 25th, 2013). Oxygenation system had been off for approximately 2 weeks.
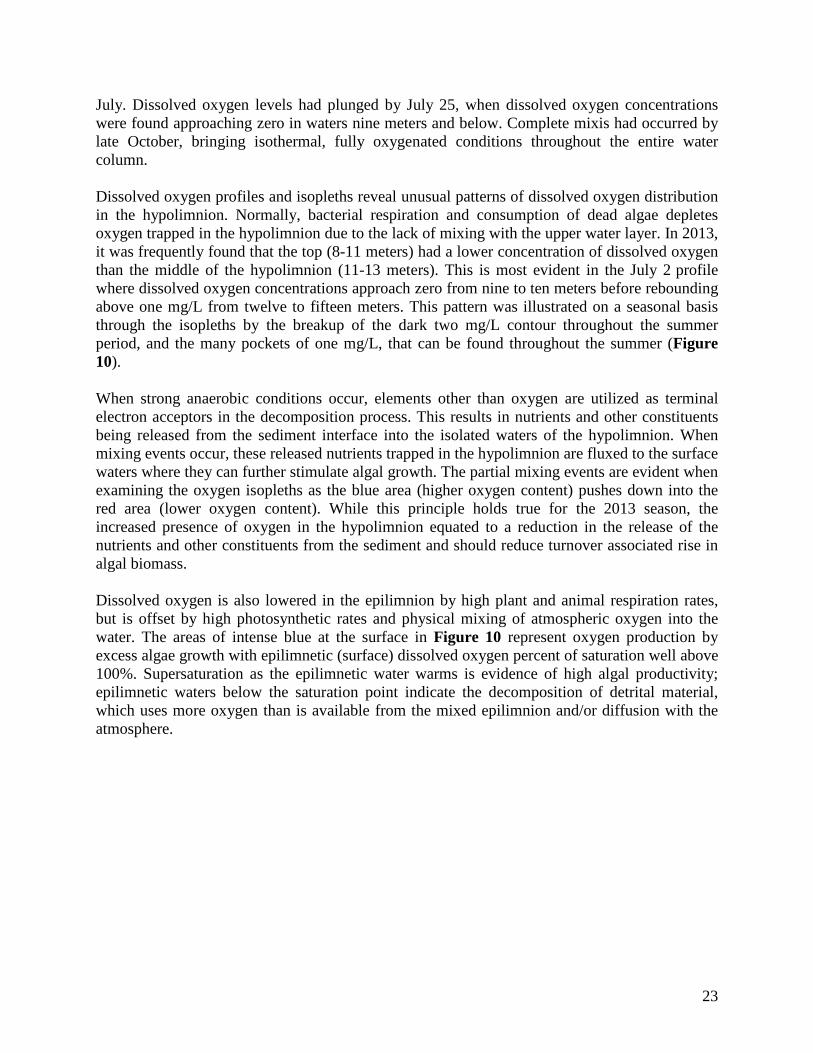
18
Prior to the onset of stratification, the lake has isothermal conditions throughout the water column. As stratification sets in and strengthens, the epilimnion stays relatively homogenous while the metalimnion (thermocline) changes radically with depth until the hypolimnion is reached. This physical structure maintains until surface temperatures start to decline, the epilimnion cools, and the thermocline erodes as the epilimnion mixes with the lower layers. This process is referred to as fall mixing or “turnover”. Lake stratification may have a significant effect on water quality by isolating chemicals in areas of reduced exchanged (hypolimnion). An increased loading of nutrients can occur through settling of nutrients from the epilimnion and metalimnion primarily in the particulate form. Increased loading can also occur in the hypolimnion when the sediment bed is exposed to anaerobic conditions and releases inorganic phosphorous and ammonia into the water column. Starting in early fall/late summer these isolated nutrients are then entrained back into the epilimnetic waters in large volumes under mixing events, causing significant fluxes in surface water chemistry. A key feature of the influxes of hypolimnetic waters is a further stimulation of algae growth, as nutrients in the hypolimnion are mixed back into the epilimnion. Lake stratification can also affect drinking water treatment cost and quality. Treatment cost escalates with rising organic content, summer time increase in organic content is largely due to the stimulation in algae growth associated with turnover discussed later in this report. The quality of drinking water can also be affected as hypolimnetically stored algal cells are incompletely decomposed and contents of the algal cells are recirculated into the water column. The City of Norman has historically received taste and odor complaints about the drinking water at this time of year, and confirmed the presence of algal associated taste and odor compounds, MIB and Geosmin.

19
In 2013, the season began with the lake in an isothermal state. As increased solar radiation and ambient temperatures began to occur, the upper portion of the water column began to heat up while the bottom of the lake stayed cooler, which led to stratification of the water column. As stratification set in, dissolved oxygen levels began to decrease in the hypolimnion in May and June (Figure 7).
Figure 7. Temperature and Dissolved Oxygen Vertical Profile. Site 1: March 13, 2013 – June 6, 2013.

20
As the summer progressed from late June through mid August, heating at the surface began to occur much more rapidly than at the lake bottom. This caused thermal stratification to greatly strengthen; anoxia became present at the top of the hypolimnion and near the lake bottom. The recovery of dissolved oxygen in late June and early July was due to COMCD operation of the hypolimnetic oxygenation unit. On July 25, anoxia encompassed from 9 meters and below and the bulge of dissolved oxygen values from 12 to 15 meters was no longer present (Figure 8). Subsequent loss of hypolimnetic DO recovery is associated with hypolimnetic operational issues.
Figure 8. Temperature and Dissolved Oxygen Vertical Profile Site 1: June 19, 2013 – August 15, 2013

21
As the ambient temperatures cooled from the extreme heat experienced at the end of July, thermal stratification weakened, shrinking the hypolimnion from 6 meters in depth to 9 meters in depth. Return of SDOX to operation was noted mid-August but complete anoxia followed other additional operational issues. The consequence of mixing this large volume of anoxic water was witnessed through depressed surface DO values during September 25, 2013 (Figure 9). By mid-October, water column and sediment oxygen demands were met and a homogenous isothermal water column was observed.
Figure 9. Temperature and Dissolved Oxygen Vertical Profile Site 1: August 21, 2013 – December 18, 2013. Showing complete turnover and recovery of DO.
22
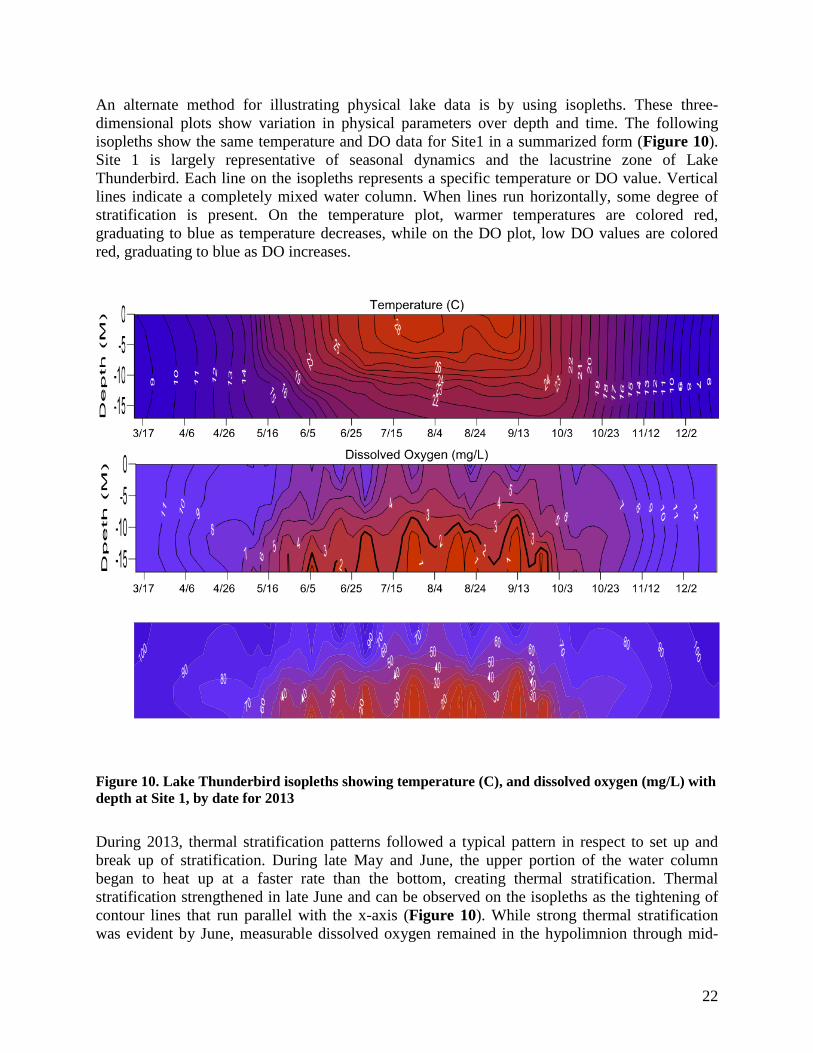
An alternate method for illustrating physical lake data is by using isopleths. These three-dimensional plots show variation in physical parameters over depth and time. The following isopleths show the same temperature and DO data for Site1 in a summarized form (Figure 10). Site 1 is largely representative of seasonal dynamics and the lacustrine zone of Lake Thunderbird. Each line on the isopleths represents a specific temperature or DO value. Vertical lines indicate a completely mixed water column. When lines run horizontally, some degree of stratification is present. On the temperature plot, warmer temperatures are colored red, graduating to blue as temperature decreases, while on the DO plot, low DO values are colored red, graduating to blue as DO increases.
Figure 10. Lake Thunderbird isopleths showing temperature (C), and dissolved oxygen (mg/L) with depth at Site 1, by date for 2013
During 2013, thermal stratification patterns followed a typical pattern in respect to set up and break up of stratification. During late May and June, the upper portion of the water column began to heat up at a faster rate than the bottom, creating thermal stratification. Thermal stratification strengthened in late June and can be observed on the isopleths as the tightening of contour lines that run parallel with the x-axis (Figure 10). While strong thermal stratification was evident by June, measurable dissolved oxygen remained in the hypolimnion through mid-
23
July. Dissolved oxygen levels had plunged by July 25, when dissolved oxygen concentrations were found approaching zero in waters nine meters and below. Complete mixis had occurred by late October, bringing isothermal, fully oxygenated conditions throughout the entire water column. Dissolved oxygen profiles and isopleths reveal unusual patterns of dissolved oxygen distribution in the hypolimnion. Normally, bacterial respiration and consumption of dead algae depletes oxygen trapped in the hypolimnion due to the lack of mixing with the upper water layer. In 2013, it was frequently found that the top (8-11 meters) had a lower concentration of dissolved oxygen than the middle of the hypolimnion (11-13 meters). This is most evident in the July 2 profile where dissolved oxygen concentrations approach zero from nine to ten meters before rebounding above one mg/L from twelve to fifteen meters. This pattern was illustrated on a seasonal basis through the isopleths by the breakup of the dark two mg/L contour throughout the summer period, and the many pockets of one mg/L, that can be found throughout the summer (Figure 10). When strong anaerobic conditions occur, elements other than oxygen are utilized as terminal electron acceptors in the decomposition process. This results in nutrients and other constituents being released from the sediment interface into the isolated waters of the hypolimnion. When mixing events occur, these released nutrients trapped in the hypolimnion are fluxed to the surface waters where they can further stimulate algal growth. The partial mixing events are evident when examining the oxygen isopleths as the blue area (higher oxygen content) pushes down into the red area (lower oxygen content). While this principle holds true for the 2013 season, the increased presence of oxygen in the hypolimnion equated to a reduction in the release of the nutrients and other constituents from the sediment and should reduce turnover associated rise in algal biomass. Dissolved oxygen is also lowered in the epilimnion by high plant and animal respiration rates, but is offset by high photosynthetic rates and physical mixing of atmospheric oxygen into the water. The areas of intense blue at the surface in Figure 10 represent oxygen production by excess algae growth with epilimnetic (surface) dissolved oxygen percent of saturation well above 100%. Supersaturation as the epilimnetic water warms is evidence of high algal productivity; epilimnetic waters below the saturation point indicate the decomposition of detrital material, which uses more oxygen than is available from the mixed epilimnion and/or diffusion with the atmosphere.
24
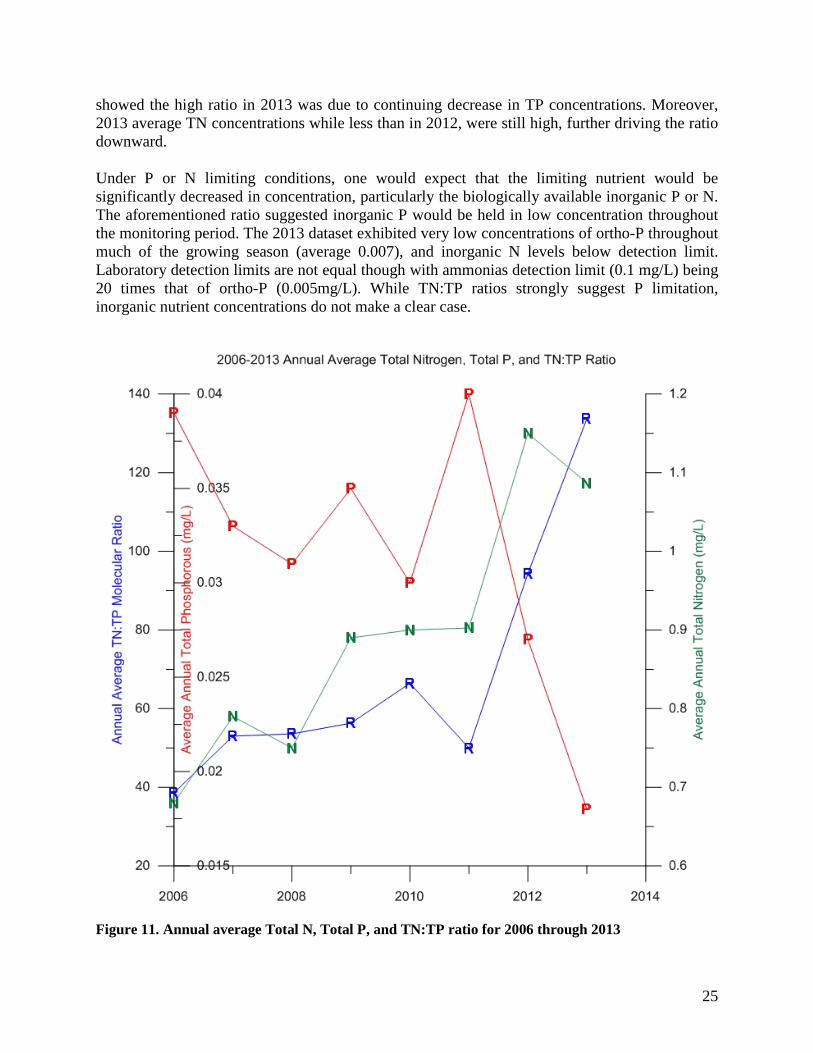
Nutrients and Chlorophyll-a High nitrogen and phosphorus loading, or nutrient pollution, has consistently ranked as one of the top causes of degradation in U.S. waters for more than a decade. Excess nitrogen (N) and phosphorus (P) lead to significant water quality problems including reduced spawning grounds and nursery habitats for fish species, fish kills, hypoxic/anoxic conditions, harmful algal blooms, taste and odor problems in finished drinking water, public health concerns related to recreation and increased organic content of drinking water sources. Several measures of N and P were made during monitoring visits, including dissolved and total forms. Dissolved nutrient concentrations consist of nutrients that are available for algal growth, such as ortho-P, ammonia, nitrate and nitrite. High dissolved nutrient concentrations in the epilimnion generally indicate that nutrients are immediately available for (and not limiting to) algal growth, while hypolimnetic concentrations are nutrients that could be available for future algal growth. Nitrogen and phosphorus concentrations in the epilimnion can also indicate what may be limiting algal growth. Generally, when both N and P are readily available, neither is a limiting nutrient to algal growth, and excessive Chl-a values are expected. When high P concentrations are readily available in comparison to very low N concentrations, algal growth may be N limited. High to excessive levels of algal growth, or primary production, can be expected under nitrogen-limited conditions, which can also give a competitive advantage to undesirable cyanobacteria (blue-green algae). In the absence of adequate dissolved N, certain blue-greens have the ability to convert atmospheric N into a usable form by way of specialized cells called heterocysts. These blue-green algae are the only type of algae that may have heterocysts, and are generally implicated for producing harmful toxins, and chemicals that cause taste and odor problems in public water supplies. There has been no documentation of blue-green algae blooms at Lake Thunderbird during our monitoring, but the frequency and severity of blue-green algae blooms have recently increased in Oklahoma, resulting in measurable amounts of cyanotoxins to be found in afflicted waterbodies. The taste and odor compounds geosmin and MIB, which have been detected in recent years, confirms that nuisance blue-green populations exist in Lake Thunderbird. With regard to nutrient limitation, P as the limiting nutrient is desired for most freshwater systems. Under P limiting conditions, desirable green algae will typically be present. A recent study by Dzialowski et al. (2005) has broken the molecular ratio into three ranges, wherein a TN to TP ratio, TN:TP, of less than or equal to 18 indicates a nitrogen-limited waterbody, ratios of 20-46 indicate a co-limitation of N and P, and waters having ratios greater than 65 are regarded as phosphorus-limited. In most eutrophic reservoirs, a co-limitation condition is more of a “no-limitation,” where both nutrients are readily available in significant amounts. Lake Thunderbird has had TN:TP ratios mostly in the 40’s to 60’s over the years, indicating the lake was phosphorus–limited and co-limited. Since the low in 2006, when all sample dates in the lake fell within a co-limitation range of N and P, the ratio has trended upward (Figure 11). In 2013, for all but the sampling date in the fall, data indicated strong phosphorous limiting conditions, with an average TN:TP ratio of 68 (Figure 12). Examination of TN:TP constituents
25
showed the high ratio in 2013 was due to continuing decrease in TP concentrations. Moreover, 2013 average TN concentrations while less than in 2012, were still high, further driving the ratio downward. Under P or N limiting conditions, one would expect that the limiting nutrient would be significantly decreased in concentration, particularly the biologically available inorganic P or N. The aforementioned ratio suggested inorganic P would be held in low concentration throughout the monitoring period. The 2013 dataset exhibited very low concentrations of ortho-P throughout much of the growing season (average 0.007), and inorganic N levels below detection limit. Laboratory detection limits are not equal though with ammonias detection limit (0.1 mg/L) being 20 times that of ortho-P (0.005mg/L). While TN:TP ratios strongly suggest P limitation, inorganic nutrient concentrations do not make a clear case.
Figure 11. Annual average Total N, Total P, and TN:TP ratio for 2006 through 2013

26
Figure 12. 2013 Site 1 surface TN:TP molecular ratio
Phosphorus – P Total phosphorus and ortho-P concentrations produced patterns typical of seasonal ecological cycles in lakes (Figure 13). The highest surface TP was noted at the beginning of the monitoring season after the first flushing inflows; on April 26, TP was observed at 0.175 mg/L, nearly 5 times that of any other Site 1 surface sample. After this exceptionally high spring value the TP concentration in the reservoir decreased until it reached the detection limit (.005 mg/L) on August 15, 2013. In 2013, the mean surface TP concentration at the surface of Site 1 (excluding the excessive spring value) was 0.020, 60% less than the 2006-2012 historical annual average 0.034 mg/L. Surface ortho-P started the season high before decreasing throughout the spring and early summer, reaching a stable level around 0.007 mg/L. Bottom and hypolimnetic ortho-P followed an opposite trend, starting the year at low concentrations and increasing throughout the stratification period before lake destratification mixed the water column. The buildup of hypolimnetic ortho-P is evidence of the settling of decomposing algae from the epi- and metalimnion, in addition to active release from the anoxic sediment (Figure 14). Rise in surface

27
ortho-P in September coincided with the turnover timeframe, indicating that portions of the nutrient rich hypolimnion were mixing into the less nutrient rich surface waters. This mixing coincides with a depression in surface DO, confirming the source of the nutrients.
Figure 13: 2013 Lake Thunderbird surface Ortho-P and TP, by date, at Site 1.
Figure 14: 2013 Lake Thunderbird total phosphorus and orthophosphorus. Contours with depth, by date, at Site 1

28
Figure 15: Surface Total and Ortho-P data from the three riverine sites.
Nitrogen – N Total nitrogen and DO concentrations also produced patterns somewhat typical of seasonal ecological cycles in lakes (Figure 16). Surface total Kjeldahl nitrogen showed a pattern of a general increase over the summer before dropping in the winter while dissolved forms of N fell below detection at the surface through most of the summer.
0
0.05
0.1
0.15
0.2
0.25
3/17/2013 5/6/2013 6/25/2013 8/14/2013 10/3/2013 11/22/2013 1/11/2014
P (m
g/L)
Riverine Total and Ortho-P
Site 6 TP
Site 8 TP
Site 11 TP
Site 6 OP
Site 8 OP
Site 11 OP

29
Figure 16. 2012 Lake Thunderbird NO2-NO3, Ammonia, Total Kjeldahl N, and Total N contours with depth, by date, at Site 1
The two most likely forces driving the surface N dynamics seen in the dataset are epilimnetic algae growth (uptake) and hypolimnetic sediment release of ammonia. These two forces were seen operating in 2013, as dissolved inorganic N plunged with rising Chl-a during the start of summer, while a spike of ammonia was detected in September following a deepening of epilimnetic waters mixing ammonia rich hypolimnetic waters to the surface. Examination of ammonia and nitrate distribution with depth and over time showed a general increase in ammonia in the hypolimnion over time as ammonia is released from the sediment under anoxic conditions and was also formed as a decomposition product of senescent algae cells and detrital material. Ammonia concentrations in the hypolimnion gradually rose until the breakdown of thermal stratification mixed these ammonia rich hypolimnetic waters to the surface. In the hypolimnion, nitrate does not serve as a macronutrient, but as an electron source for anaerobic metabolism. Nitrate remained in detectable concentrations through the end of July, indicating that oxygen sufficient for nitrification was present through this timeframe. Nitrate remained depleted in the hypolimnion throughout the rest of the summer until fall turnover broke thermal stratification and nitrate was present throughout the water column under oxygenated conditions.
30
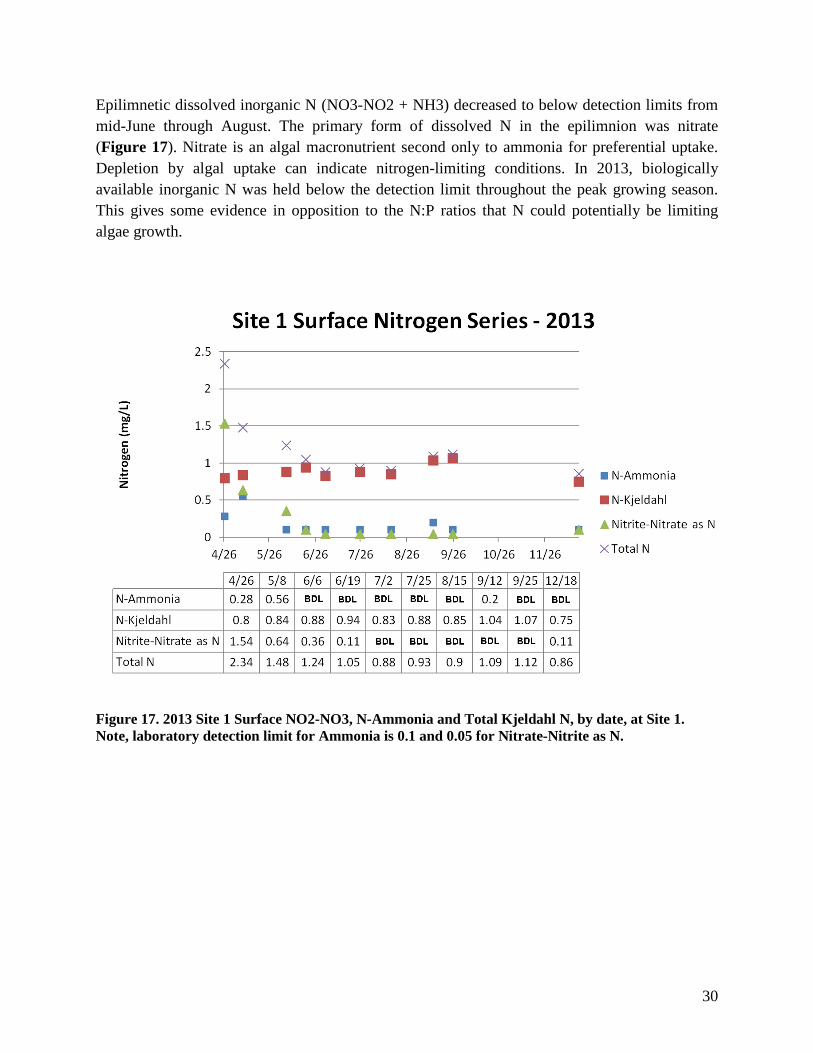
Epilimnetic dissolved inorganic N (NO3-NO2 + NH3) decreased to below detection limits from mid-June through August. The primary form of dissolved N in the epilimnion was nitrate (Figure 17). Nitrate is an algal macronutrient second only to ammonia for preferential uptake. Depletion by algal uptake can indicate nitrogen-limiting conditions. In 2013, biologically available inorganic N was held below the detection limit throughout the peak growing season. This gives some evidence in opposition to the N:P ratios that N could potentially be limiting algae growth.
Figure 17. 2013 Site 1 Surface NO2-NO3, N-Ammonia and Total Kjeldahl N, by date, at Site 1. Note, laboratory detection limit for Ammonia is 0.1 and 0.05 for Nitrate-Nitrite as N.
31
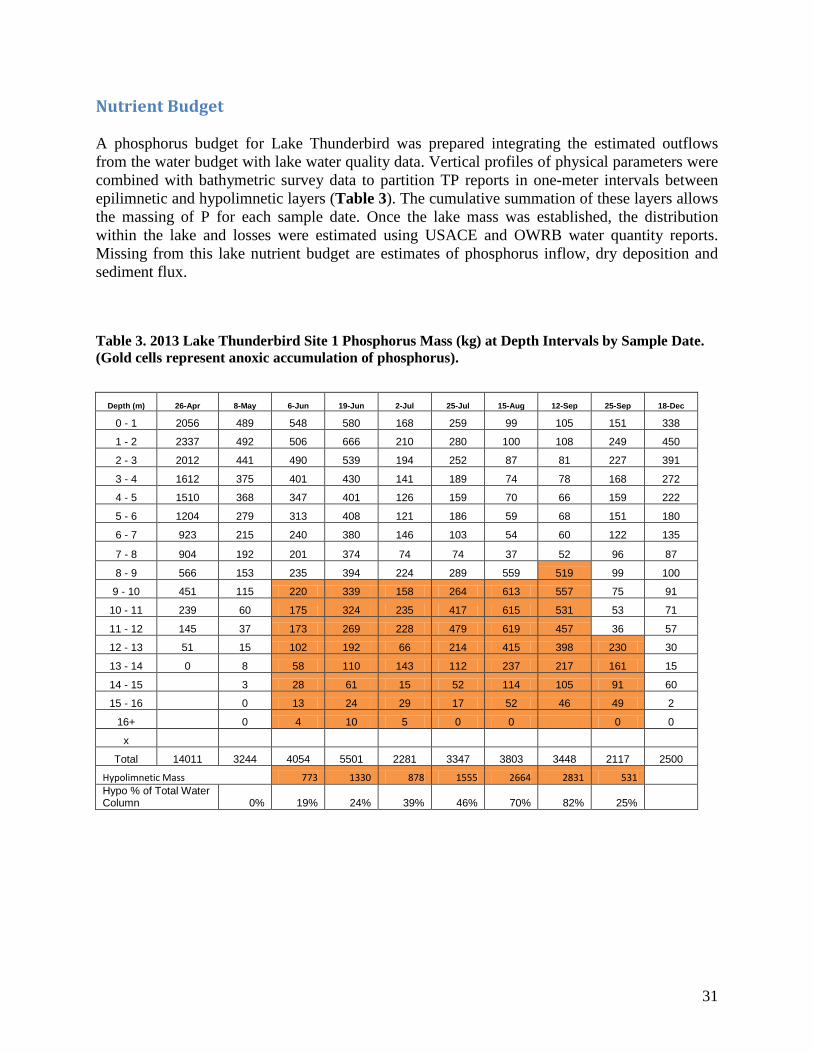
Nutrient Budget A phosphorus budget for Lake Thunderbird was prepared integrating the estimated outflows from the water budget with lake water quality data. Vertical profiles of physical parameters were combined with bathymetric survey data to partition TP reports in one-meter intervals between epilimnetic and hypolimnetic layers (Table 3). The cumulative summation of these layers allows the massing of P for each sample date. Once the lake mass was established, the distribution within the lake and losses were estimated using USACE and OWRB water quantity reports. Missing from this lake nutrient budget are estimates of phosphorus inflow, dry deposition and sediment flux.
Table 3. 2013 Lake Thunderbird Site 1 Phosphorus Mass (kg) at Depth Intervals by Sample Date. (Gold cells represent anoxic accumulation of phosphorus).
Depth (m) 26-Apr 8-May 6-Jun 19-Jun 2-Jul 25-Jul 15-Aug 12-Sep 25-Sep 18-Dec
0 - 1 2056 489 548 580 168 259 99 105 151 338
1 - 2 2337 492 506 666 210 280 100 108 249 450
2 - 3 2012 441 490 539 194 252 87 81 227 391
3 - 4 1612 375 401 430 141 189 74 78 168 272
4 - 5 1510 368 347 401 126 159 70 66 159 222
5 - 6 1204 279 313 408 121 186 59 68 151 180
6 - 7 923 215 240 380 146 103 54 60 122 135
7 - 8 904 192 201 374 74 74 37 52 96 87
8 - 9 566 153 235 394 224 289 559 519 99 100
9 - 10 451 115 220 339 158 264 613 557 75 91
10 - 11 239 60 175 324 235 417 615 531 53 71
11 - 12 145 37 173 269 228 479 619 457 36 57
12 - 13 51 15 102 192 66 214 415 398 230 30
13 - 14 0 8 58 110 143 112 237 217 161 15
14 - 15 3 28 61 15 52 114 105 91 60
15 - 16 0 13 24 29 17 52 46 49 2
16+ 0 4 10 5 0 0 0 0
x
Total 14011 3244 4054 5501 2281 3347 3803 3448 2117 2500
Hypolimnetic Mass 773 1330 878 1555 2664 2831 531 Hypo % of Total Water
Column 0% 19% 24% 39% 46% 70% 82% 25%

32
The constructed budget demonstrates pre-stratification lake P mass in 2013 of approximately 3200 kg. This falls in line with the prestratification mass average from the past 5 years of 3300 kg (2008:4000 kg, 2009:3600 kg, 2010:3700 kg, 2011:4100 kg, 2012:1024 kg). The exceptionally high values present at the end of April can be attributed to several moderately sized inflow events that preceded the sampling. While the high values can be explained, they also stand to highlight the threat high nutrient levels pose in the watershed. Besides the exceptionally high total phosphorous mass at the start of the year, May and June TP mass was in line with the historical dataset, 4000-5000 kg. As summer progressed, instead of increasing phosphorous levels in the lake as witnessed in the past, epilimnetic phosphorous levels decreased, bringing the TP mass for the lake down with it. Between late June and early July the phosphorous mass decreased by over half, which included a large decrease in concentration within the thermally isolated hypolimnetic layer. This marked decrease highlights the use of phosphorus by algae and loss to the hypolimnion, but also serves to show that little upward flux of P from the metalimnion and hypolimnion was occurring during this period. Overall TP mass in the lake were at historic lows for a non-drought year, with levels in August (~3500 kg) at approximately half of normal August values (~7000). Data examined from 2007, a hydraulically similar year (post-drought/high inflows/summer releases) was found to have the highest summer TP masses of any year on record with water column concentrations reaching 11,500 kg. Lastly, it is worthwhile mentioning that reduction in extent and duration of anoxia (areal anoxia) within the water column in 2013, when compared to the 2005-2009 average, should correspond to a reduction in anaerobically mediated sediment P release. Using calculations based on Nurnberg (2005) and specifically developed for Lake Thunderbird by OWRB, it was calculated that anaerobically mediated sediment P release was reduced by 60%, equivalent to 14% of the average annual TP load (OWRB 2011).
Riverine Nutrients Nutrient sampling was also performed in each of Lake Thunderbird’s three major tributaries riverine zones. These samples serve as an indicator of external nutrient load to the lake, providing timing and magnitude of nutrient loading to the lake. Plots illustrating riverine data for 2013 can be viewed in Appendix B. Riverine total phosphorous observations followed a similar pattern in each of the reservoirs riverine zones, where values were exceptionally high in the spring, gradually decreasing throughout the summer, before rebounding after the high inflows in August. Each site reached its minimum concentration for the year during the December winter sample. The Little River and Dave Blue Creek Riverine sites had higher concentrations than Dave Blue Creek, most notably the peak TP concentration was over .2 mg/L for each of these sites. Ortho-P followed the same general trend as TP in the riverine sites but showed vary little rebound with the large summer inflows in August. Like phosphorus measures, nitrogen measures followed a similar pattern in each of the riverine zones. Riverine total Kjeldahl nitrogen started the year off around 0.8 mg/L, oscillating throughout the summer, before returning to spring values in December. Nitrate-nitrite followed
33
a pattern more similar to that of phosphorous measures, starting the spring with exceptionally high values before decreasing to below detection by the start of summer. Values remained below detection limit throughout the summer. Riverine data has been collected since 2008 for the Little River (Site 6) and Hog Creek (Site 8) sites, 2009 for Dave Blue Creek (Site 11) sites. Box plots and scatter plots of these data can be viewed in Appendix B. No sites showed any significant decrease or increase of nutrient values over time. While no significant trend is evident, it should be pointed out that for the measures of TP, ortho-P, and nitrate-nitrite, the last two seasons have seen greatly increased annual site maximum concentrations from the past.
Chlorophyll-a – Chl-a
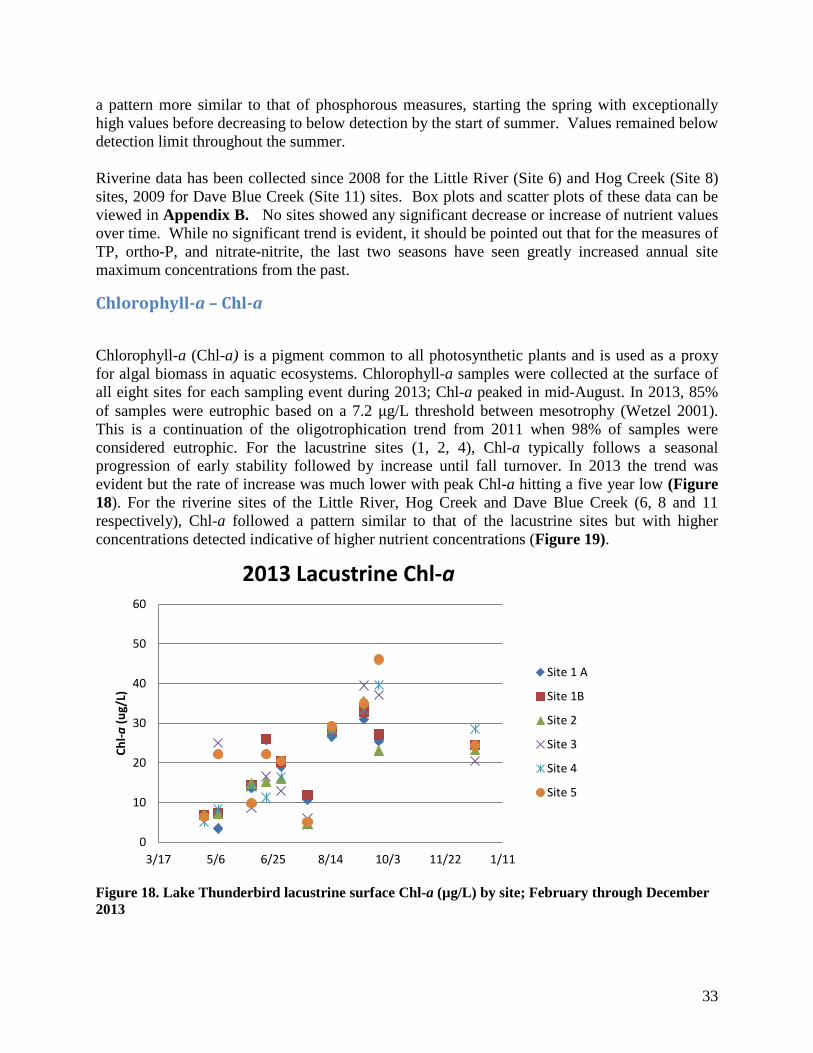
Chlorophyll-a (Chl-a) is a pigment common to all photosynthetic plants and is used as a proxy for algal biomass in aquatic ecosystems. Chlorophyll-a samples were collected at the surface of all eight sites for each sampling event during 2013; Chl-a peaked in mid-August. In 2013, 85% of samples were eutrophic based on a 7.2 µg/L threshold between mesotrophy (Wetzel 2001). This is a continuation of the oligotrophication trend from 2011 when 98% of samples were considered eutrophic. For the lacustrine sites (1, 2, 4), Chl-a typically follows a seasonal progression of early stability followed by increase until fall turnover. In 2013 the trend was evident but the rate of increase was much lower with peak Chl-a hitting a five year low (Figure 18). For the riverine sites of the Little River, Hog Creek and Dave Blue Creek (6, 8 and 11 respectively), Chl-a followed a pattern similar to that of the lacustrine sites but with higher concentrations detected indicative of higher nutrient concentrations (Figure 19).
Figure 18. Lake Thunderbird lacustrine surface Chl-a (µg/L) by site; February through December 2013
0
10
20
30
40
50
60
3/17 5/6 6/25 8/14 10/3 11/22 1/11
Chl-a
(ug/
L)
2013 Lacustrine Chl-a
Site 1 A
Site 1B
Site 2
Site 3
Site 4
Site 5

34
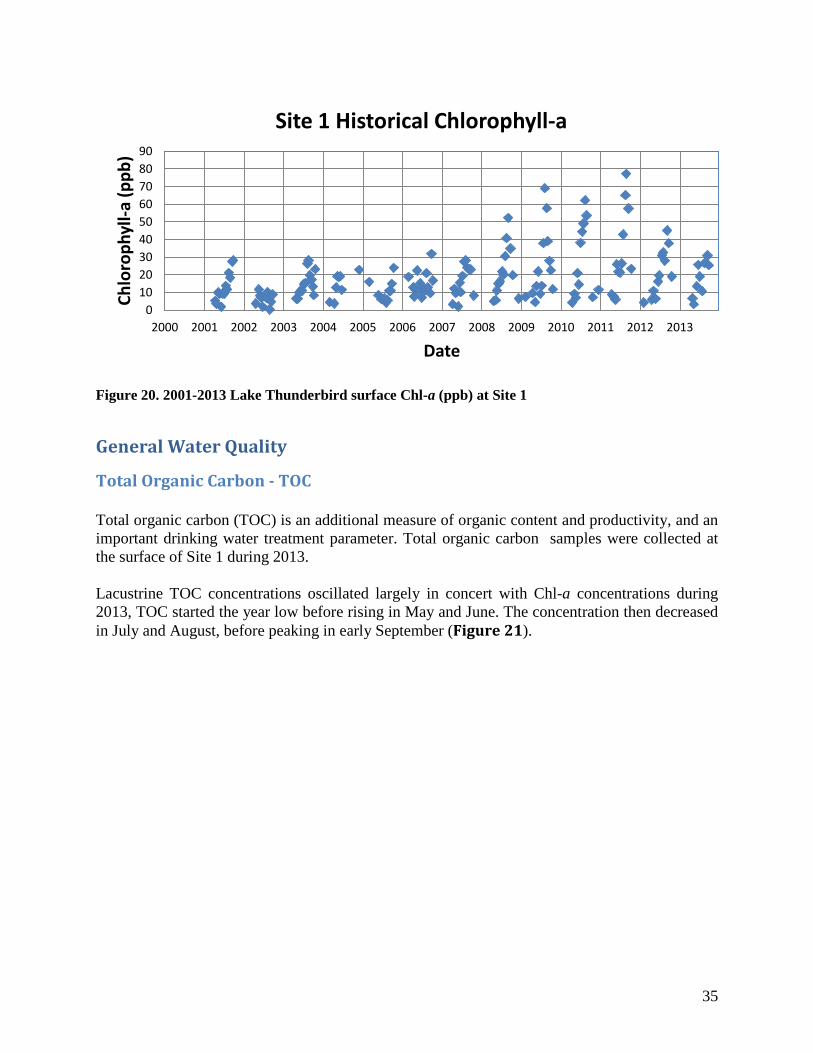
Figure 19. Lake Thunderbird riverine surface Chl-a (g/L) by site; May through December For the 2013 sampling season the lake wide average Chl-a at Lake Thunderbird was 20.5 µg/L. This represented a large reduction from the lake wide average of 24.5 µg/L from 2012, 36 µg/L from 2011, and the 2007-2010 historical average of 25.9 µg/L. Observed peak lacustrine Chl-a was also greatly reduced from the previous five years with Site 1 maximum values of 33 µg/L representing the lowest peak at Site 1 since 2007 (Figure 20).
0
20
40
60
80
100
120
3/17 5/6 6/25 8/14 10/3 11/22 1/11
Chl-a
(ug/
L)
2013 Riverine Chl-a
Site 6 (Little River)
Site 8 (Hog Creek)
Site 11 (Dave Blue Creek)
35
Figure 20. 2001-2013 Lake Thunderbird surface Chl-a (ppb) at Site 1
General Water Quality
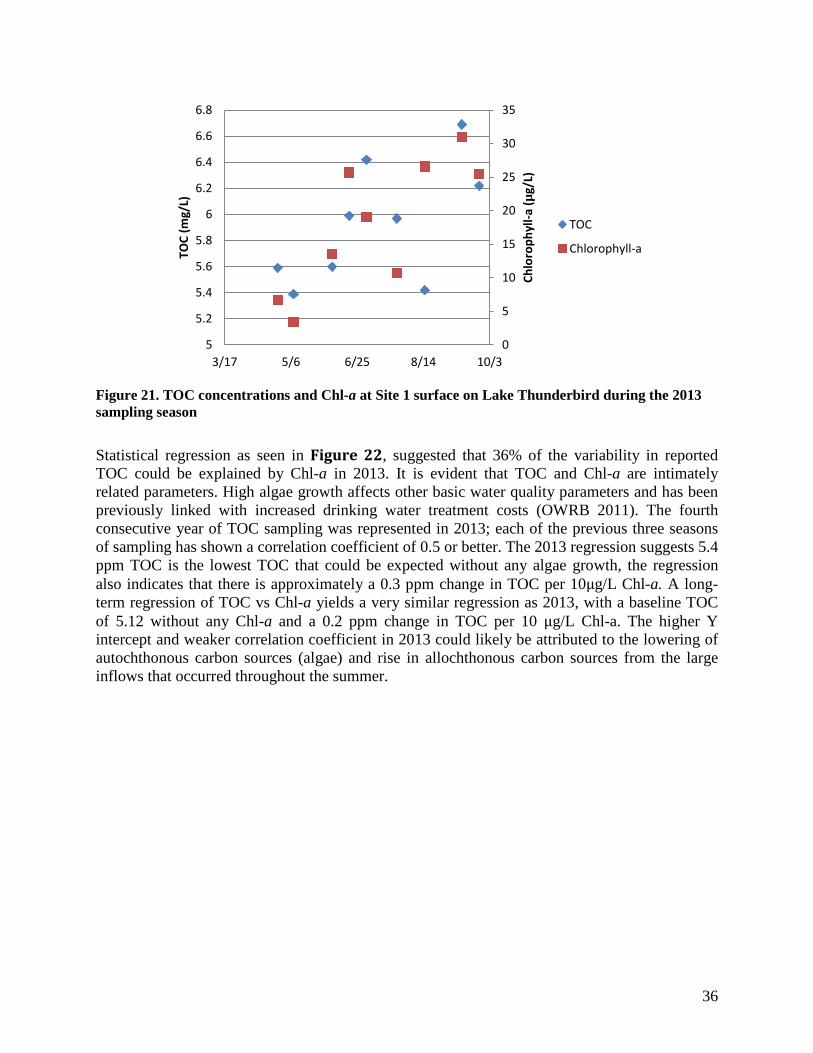
Total Organic Carbon - TOC Total organic carbon (TOC) is an additional measure of organic content and productivity, and an important drinking water treatment parameter. Total organic carbon samples were collected at the surface of Site 1 during 2013. Lacustrine TOC concentrations oscillated largely in concert with Chl-a concentrations during 2013, TOC started the year low before rising in May and June. The concentration then decreased in July and August, before peaking in early September (Figure 21).
0 10 20 30 40 50 60 70 80 90
2000 2001 2002 2003 2004 2005 2006 2007 2008 2009 2010 2011 2012 2013
Chlo
roph
yll-a
(ppb
)
Date
Site 1 Historical Chlorophyll-a
36
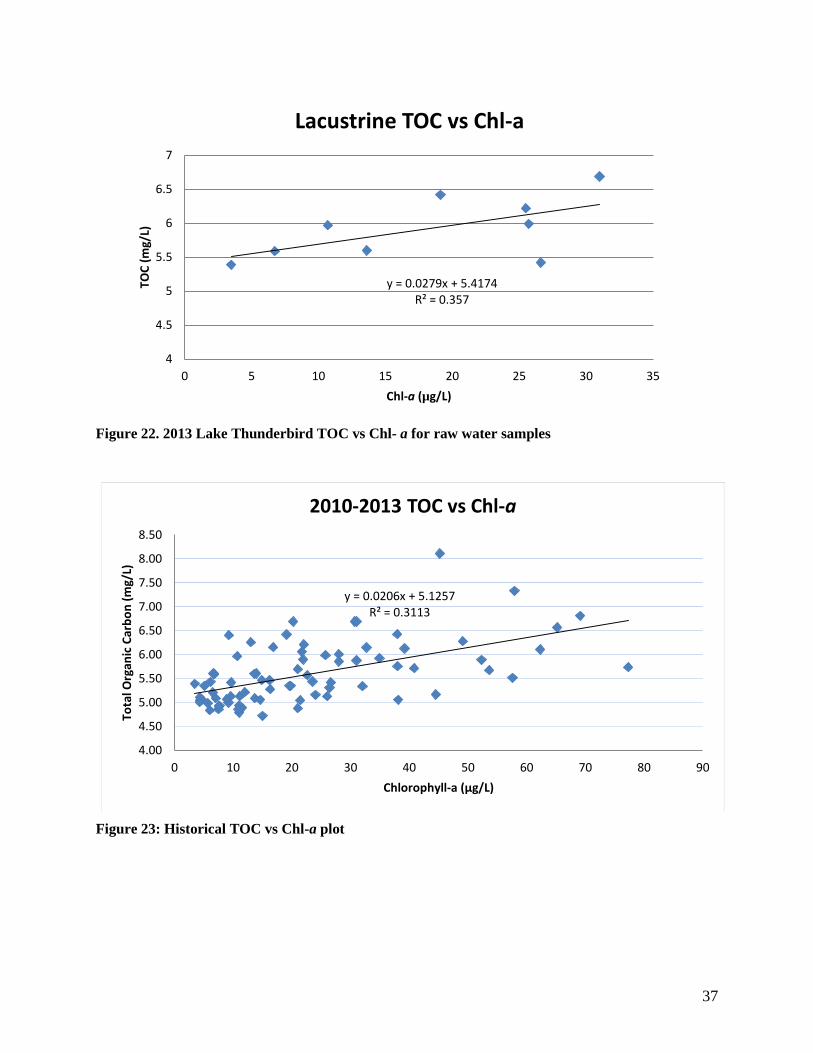
Figure 21. TOC concentrations and Chl-a at Site 1 surface on Lake Thunderbird during the 2013 sampling season Statistical regression as seen in Figure 22, suggested that 36% of the variability in reported TOC could be explained by Chl-a in 2013. It is evident that TOC and Chl-a are intimately related parameters. High algae growth affects other basic water quality parameters and has been previously linked with increased drinking water treatment costs (OWRB 2011). The fourth consecutive year of TOC sampling was represented in 2013; each of the previous three seasons of sampling has shown a correlation coefficient of 0.5 or better. The 2013 regression suggests 5.4 ppm TOC is the lowest TOC that could be expected without any algae growth, the regression also indicates that there is approximately a 0.3 ppm change in TOC per 10µg/L Chl-a. A long-term regression of TOC vs Chl-a yields a very similar regression as 2013, with a baseline TOC of 5.12 without any Chl-a and a 0.2 ppm change in TOC per 10 µg/L Chl-a. The higher Y intercept and weaker correlation coefficient in 2013 could likely be attributed to the lowering of autochthonous carbon sources (algae) and rise in allochthonous carbon sources from the large inflows that occurred throughout the summer.
0
5
10
15
20
25
30
35
5
5.2
5.4
5.6
5.8
6
6.2
6.4
6.6
6.8
3/17 5/6 6/25 8/14 10/3
Chlo
roph
yll-a
(µg/
L)
TOC
(mg/
L)
TOC
Chlorophyll-a
37
Figure 22. 2013 Lake Thunderbird TOC vs Chl- a for raw water samples
Figure 23: Historical TOC vs Chl-a plot
y = 0.0279x + 5.4174 R² = 0.357
4
4.5
5
5.5
6
6.5
7
0 5 10 15 20 25 30 35
TOC
(mg/
L)
Chl-a (µg/L)
Lacustrine TOC vs Chl-a
y = 0.0206x + 5.1257 R² = 0.3113
4.00
4.50
5.00
5.50
6.00
6.50
7.00
7.50
8.00
8.50
0 10 20 30 40 50 60 70 80 90
Tota
l Org
anic
Car
bon
(mg/
L)
Chlorophyll-a (µg/L)
2010-2013 TOC vs Chl-a

38
Trophic State Index - TSI Trophic state is defined as the total algal biomass in a waterbody at a specific time and location. For lakes and reservoirs, the Trophic State Index (TSI) of Carlson (1977) is the most common measure of algal biomass and is used as the trophic index by the United States Environmental Protection Agency. Four surface variables; Chl-a, Secchi depth, TP and TN can be used independently to estimate algal biomass (Carlson 1977, Kratzer 1981). Of these four, chlorophyll yields the most accurate measure, as it is the most direct measure of algal biomass. Secchi depth is historically the most inaccurate at Lake Thunderbird as high-suspended solids, due to the clay watershed soil, leads to relatively low water clarity throughout the year. Lake Thunderbird’s TSI values for the four variables are displayed in Figure 24, and range from 27-81 throughout the year. Lake Thunderbird starts the year in eutrophic to hypereutrophic conditions (TSI 50-80), then as the year progresses TP concentration lowers and TSI Chl-a stays relatively stable around 60. It should be noted that this seasonal progression is nearly opposite of what has historically been seen in the reservoir. A typical progression starts out the year low and nutrient metrics, as well as algal biomass proxy, rise throughout the summer. Relatively high TSI measures at the start of 2013 can be attributed to the high inflows in the spring that brought with them nutrient rich waters with high suspended solids. As the year progressed TP levels plunged while Chl-a remained relatively constant. Trophic state indices for TN and Secchi disk followed a pattern similar to TP but less severe.
Figure 24. Carlson's Trophic State Index values for Lake Thunderbird 2013 at Site 1.
By examining the interrelationships between TSI variables one can also discern algal limitation. In Figure 25, TSI (Chl-a) - TSI (TP) is plotted on the vertical axis with TSI (Chl-a)-TSI (SD)
0
10
20
30
40
50
60
70
80
90
2/25 4/16 6/5 7/25 9/13 11/2 12/22
TSI
TSI TP
TSI Chl-a
TSI SD
TSI TN

39
plotted on the horizontal. In this plot all but three data points fall in the upper left quartile indicating Chl-a is under-predicted by TP demonstrating phosphorous limiting conditions, and over-predicted by transparency indicating that transparency is dominated by non-algal factors such as turbidity or color. Further examination reveals that the two data points that fall into the lower left quartile, which indicate over-prediction by TP (e.g. phosphorus surplus) and under-prediction by transparency (e.g. high turbidity), are generated from data collected in April and May. This indicates that light likely limited algal growth during the spring in the period of high inflows, which brought high nutrient levels and suspended solids into the reservoir. The last point which falls in the upper right quartile indicate under prediction by TP (e.g. possible phosphorus limitation) and under prediction by transparency (e.g. low turbidity). By combining the visual representations of the data from Figure 24 and Figure 25, it can be seen that as the growing season progresses, the under prediction of TSI (Chl-a) by TSI (TP) widens, indicating stronger phosphorous limiting conditions during the July to September timeframe in 2013.
Figure 25. Potential nutrient limited and nonnutrient-limited causes for the deviation of biomass-based trophic state index.

40
pH, Oxidation-Reduction (redox) Potentials, and Dissolved Metals Increases in surface pH during the summer months indicate high rates of photosynthesis, while lower hypolimnetic pH is due to the buildup of bacterial respiration byproducts. Sinking organic matter in summer months (due to high algal production) stimulates decomposition processes in the hypolimnion. High and low pH corresponds to peak algal productivity. High rates of photosynthesis will temporarily elevate pH as carbon dioxide is stripped from the water column in the epilimnion, while catabolism of the settling algae depresses pH in the hypolimnion. Lake Thunderbird followed a typical eutrophic pattern of pH in 2013 in lacustrine sites (1,2,3 and 4), where pH peaked in mid-summer at the surface during the time of highest algal productivity and was lowest at the lake sediment interface (pH of approximately 6.8) due to decomposition processes within hypolimnion (Figure 26). Unlike in previous years, the riverine sites functioned much more similarly to the lacustrine sites, with Chl-a and pH generally falling in line with the surface values for much of rest of the lake. This is in contrast to the previous summer, where all riverine pH samples collected exceeded a value of 8. Oklahoma’s WQS state, “pH values shall be between 6.5 and 9.0 in waters designated for fish and wildlife propagation”. The maximum pH value recorded in 2013 was 8.7 and the lowest was 6.6.
Figure 26. 2013 Lake Thunderbird pH (S.U.) versus Depth Over Time: Site 1
The biogeochemical cycling of inorganic nutrients is regulated largely by changes in oxidation-reduction potential (ORP) or redox states, and plays a major role in the recycling of sediment bound phosphorous, iron, and manganese. Under oxygenated conditions, redox potentials remain highly positive (300-500 mV). Normally, as oxygen concentrations approach zero, redox potential begins to drop in proportion to anaerobic metabolism. In early 2013, oxygenated conditions were present throughout the water column and redox potentials remained high. During the May 24 site visit, thermal stratification became evident and oxygen levels began decreasing in the hypolimnion. Sixty-two days later (July 25) oxygen levels began to approach 0 and ORP levels began to decrease but stayed above the 100mV threshold which indicates strong reducing conditions. By August 15, strong reducing conditions were observed from 9 meters and below and remained there until fall brought complete mixis of the water column (Figure 27). It is important to note that literature sources state that sediment bound phosphorus and common metals, such as iron and manganese, will desorb as redox potential falls below 100 mV (Lerman 1978). Low redox potential is also associated with the production of sulfide and methane, as electron acceptors for anaerobic metabolism become scarce. Therefore, the duration and extent of strong reducing conditions should have a direct impact on the desorption of these compounds as well.

41
Figure 27. 2013 Lake Thunderbird oxidation-reduction potential (mV) versus depth (M) over time: Site 1.
Taste and Odor Complaints The City of Norman provided data on the number of taste and odor complaints from their customers in 2013. Because Lake Thunderbird is the major source of raw water for the city, water quality parameters in the lake can be correlated with complaints in the final finished water. Taste and odor causing compounds can be detected by individuals at the tap in extremely low concentrations (~5 ng/L) (Graham et al 2008). The majority of these compounds are by-products of high algal productivity. The most commonly known drinking water taste and odor compounds, geosmin and 2-methylisoborneol (MIB), are produced primarily by cyanobacteria. Historically the lake has had a spike in complaints that coincide with high Chl-a values and the fall turnover timeframe. Lab work on the finished drinking water revealed the presence of MIB and Geosmin during these high complaint times, indicating the presence of blue-green algae in the reservoir. Predicting the regular taste and odor issues that have occurred yearly during this timeframe, the City of Norman operated an additional treatment measure, particulate activated carbon (PAC), to the drinking water treatment process. The PAC unit is known for its ability to remove taste and odor compounds from finished drinking water, but also adds a considerable cost to the drinking water treatment. The use of this additional treatment process makes the lack of taste and odor complaints during the fall of 2013 a potentially misleading number. While Chl-a was markedly lower in 2013 than it has been for the past 5 years, the PAC unit would have masked any taste and odor compounds that would have been present. In 2013, a new timeframe of taste and odor complaints was witnessed in January and December of 2013 (Figure 28). The finished drinking water was sent out for laboratory analysis and confirmed the presence of MIB and Geosmin during this timeframe, indicating the presence of a significant blue-green algae population. While the presence of blue-green algae populations in the winter is not unique to Oklahoma, nor Lake Thunderbird, the noted high number of taste and odor complaints is indicating a species shift to a taste and odor producing blue-green algae taxa, such as Anabaena (OWRB 2004, Grayson County 2013, City of Tulsa 2013).

42
Figure 28. Taste and odor complaints to the City of Norman during 2012
Water Quality Standards All Oklahoma surface waters are subject to Oklahoma’s Water Quality Standards (OAC 785:45) and Implementation Rules (OAC 785:46 ), designed to maintain and protect the quality of the waters of the state. Oklahoma Water Quality Standards (OWQS) are a set of rules adopted by Oklahoma in accordance with the federal Clean Water Act, applicable federal regulations, and state pollution control and administrative procedure statutes. Water Quality Standards serve a dual role: they establish water quality benchmarks and provide a basis for the development of water-quality based pollution control programs, including discharge permits, which dictate specific treatment levels required of municipal and industrial wastewater dischargers. Identification and protection of beneficial uses are vital to water quality standards implementation. Currently recognized beneficial uses listed in the OWQS Appendix A for Lake Thunderbird include Public and Private Water Supply, Fish and Wildlife Propagation, and Primary Body Contact Recreation. Because of its designated beneficial use as a Public and Private Water Supply, and its relatively small watershed, the OWQS also designates Lake Thunderbird a Sensitive Public Water Supply (SWS). Physical, chemical, and biological data on Lake Thunderbird were used to ascertain the condition of lake waters and determine if lake water quality supports the beneficial uses and SWS criterion. The Oklahoma Water Quality Standards Implementation Rules contain Use Support Assessment Protocols (USAP) for Oklahoma waterbodies. Developed in coordination with all Oklahoma environmental agencies, the USAP establish a consistent and scientific decision methodology for determining whether a waterbodies beneficial uses are supported, outlining minimum data requirements for that decision methodology. In the following sections, Lake Thunderbird’s water quality parameters will be discussed with an emphasis on their accordance with the OWQS. Sites 1 through 6 are historical sites originally monitored by the states Beneficial Use Monitoring Program, Sites 8 and 11 were added as additional monitoring sites to gain perspective on the two
0 2 4 6 8
10 12 14 16
Num
ber o
f Com
plai
tns
Taste and Odor Complaints

43
other main tributaries of the lake, but are not used for USAP purposes.
Dissolved Oxygen – DO Dissolved oxygen criteria are designed to protect the diverse aquatic communities of Oklahoma. For warm water aquatic communities, such as Lake Thunderbird, two assessment methodologies apply to protect fish and wildlife propagation: surface and water-column/volumetric (OAC 785:46-15-5). Lake Thunderbird fully supports both its surface and volumetric criteria for the monitoring period in 2013. Maximum water column anoxia peaked at 15.67% of the lake volume on September 12, 2013, bringing the lake well under the 50% volumetric threshold for anoxia. No surface water violations occurred in 2013 with minimum surface DO registered at 5.44 mg/L on August 15, 2013 at Site 1, above the summer minimum surface criteria of 4.0 mg/L.
Chlorophyll-a – Chl-a Oklahoma surface drinking water supplies are sensitive and vulnerable to eutrophication. Communities can experience substantial hardship and costs to treat water adversely affected by excess algae. Blue-green algae (cyanobacteria) blooms are considered a principal source of compounds that cause taste and odor problems. Several toxic and carcinogenic compounds are also produced by blue-green algae. For this reason, OWQS has identified a class of public water supplies, where additional protection from new point sources and additional loading from existing point sources is needed, as Sensitive Public and Private Water Supplies (SWS). Lake Thunderbird is listed as SWS within OWQS and as such is required not to exceed the long-term average (10 years) Chl-a concentration criterion of 10 µg/L at a depth of 0.5 meters. For the 2013 sampling season the lake wide average Chl-a at Lake Thunderbird was 21.7 µg/L, exceeding the SWS Chl-a criterion, but significantly reduced from the lake wide average of 24.6 µg/L in 2012 and 36 µg/L in 2011 and the ten year historical average of 23.2 µg/L.
Water Clarity Turbidity and Secchi disk depth are ways of measuring the water clarity and amount of suspended particles in a lake. While natural to pristine lakes often have Secchi disk depths of several meters, Oklahoma reservoirs typically have a majority of Secchi depth readings measuring less than one meter. In Lake Thunderbird, Secchi disk depths ranged from a 2012 mean of 19 centimeters at Site 6 to a mean of 64 centimeters at Site 1. The lacustrine sites (1, 2, and 4) had the greatest Secchi depths, while the riverine or transition zone sites had the lowest (Figure 29). When a site had a Secchi depth greater than 40 cm, turbidity values were within WQS 99% of the time.
44
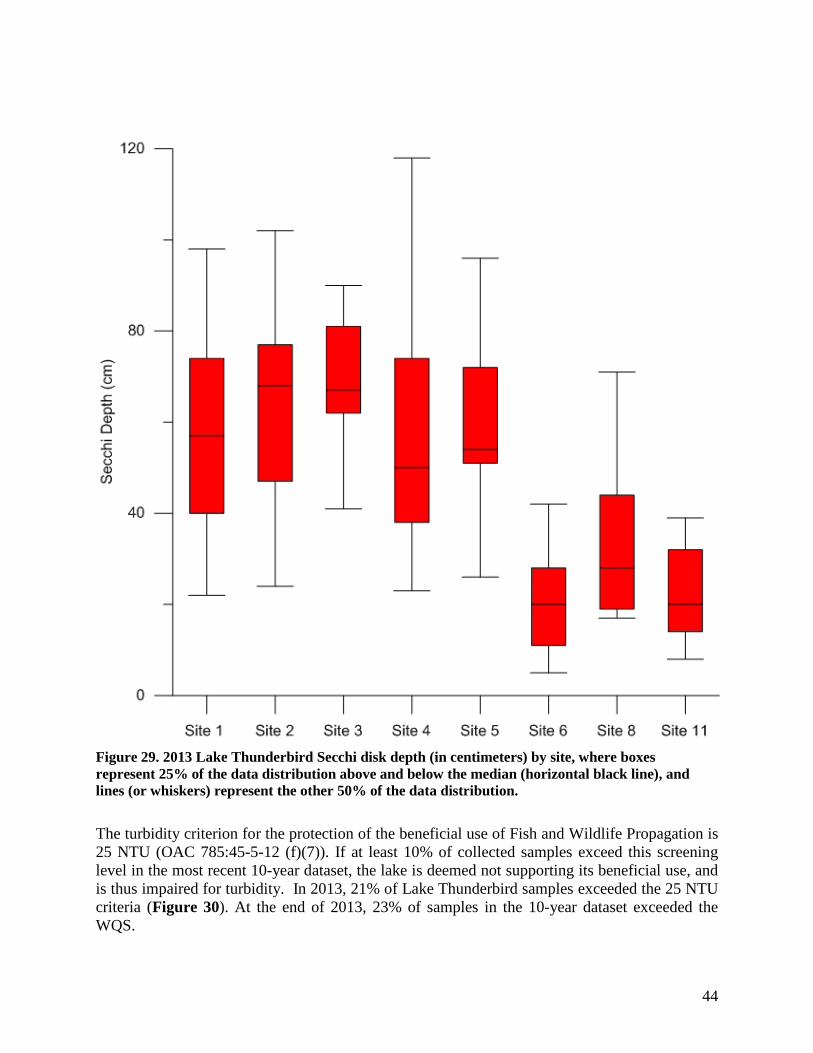
Figure 29. 2013 Lake Thunderbird Secchi disk depth (in centimeters) by site, where boxes represent 25% of the data distribution above and below the median (horizontal black line), and lines (or whiskers) represent the other 50% of the data distribution.
The turbidity criterion for the protection of the beneficial use of Fish and Wildlife Propagation is 25 NTU (OAC 785:45-5-12 (f)(7)). If at least 10% of collected samples exceed this screening level in the most recent 10-year dataset, the lake is deemed not supporting its beneficial use, and is thus impaired for turbidity. In 2013, 21% of Lake Thunderbird samples exceeded the 25 NTU criteria (Figure 30). At the end of 2013, 23% of samples in the 10-year dataset exceeded the WQS.

45
Figure 30. 2013 Lake Thunderbird turbidity (NTU), by site, where boxes represent 25% of the data distribution above and below the median (horizontal black line), and lines (or whiskers) represent the other 50% of the data distribution (horizontal blue line represents state water quality standard).
46
Supersaturated Dissolved Oxygen Injection System (SDOX) The summer of 2013 marked the third season of operation for the supersaturated dissolved oxygen injection system (SDOX) installed at Lake Thunderbird in 2010. It is designed to operate through the entire stratification window, oxygenating the lower five meters of the lake without disrupting thermal stratification (Figure 31 and Figure 32). The system works by withdrawing water from the deepest area of the hypolimnion approximately 16 meters in depth (at conservation pool), supersaturating this water under pressurized conditions, and then re-injecting it at a separate location 12 meters in depth. At full capacity, this system is designed to treat 1,536 gallons per minute while delivering 5,202 lb DO/day, providing oxidant to the bottom 2000 acre-feet of the lake, encompassing 480 acres of nutrient rich sediment. The first real year of operation took place in 2013 since large modifications occurred in both the systems components and operation. Data from the first two years of operation suggested that the system was inducing vertical mixing within the water column (OWRB 2012). After reviewing all options with the system owner/operator, COMCD, and the system manufacturer, BlueNGreen, it was decided to change the discharge nozzle to help diffuse the force from one opening to many openings (Figure 33). In addition to the change in nozzle, the system was also modified to run at full capacity out of the south line, and all operation out of the north line ceased. Lastly, while the system operated largely without issue during the first two years of operation, the third year’s operation was marked by frequent breakdowns (Table 4). Due to the system components failures the oxygenation unit ran for approximately 75 out of a potential 121 days (~60% of the time). Table 4: 2013 Operational Log SDOX Unit.
Date Comment 6/4/2013 Started SDOX 6/11/2013 Found off, turned back on 7/4/2013 Air valve broke. Found spraying water. Turned OFF. 7/8/2013 Repaired and placed back ON line. 7/9/2013 Found OFF; caused by leak at air valve. 7/10/2013 Placed ON line. 7/23/2013 Found running but nipple on air valve spraying water. Turned OFF. 7/24/2013 Repaired and placed back ON line. 7/26/2013 Found broken air valve saddle. Turned OFF. 7/29/2013 Placed back ON line. 8/14/2013 OFF for a few hours. Later turned ON. 8/27/2013 Found OFF. Broken shaft coupler and deformed flex coupling above
tank. System offline until after fall turnover.
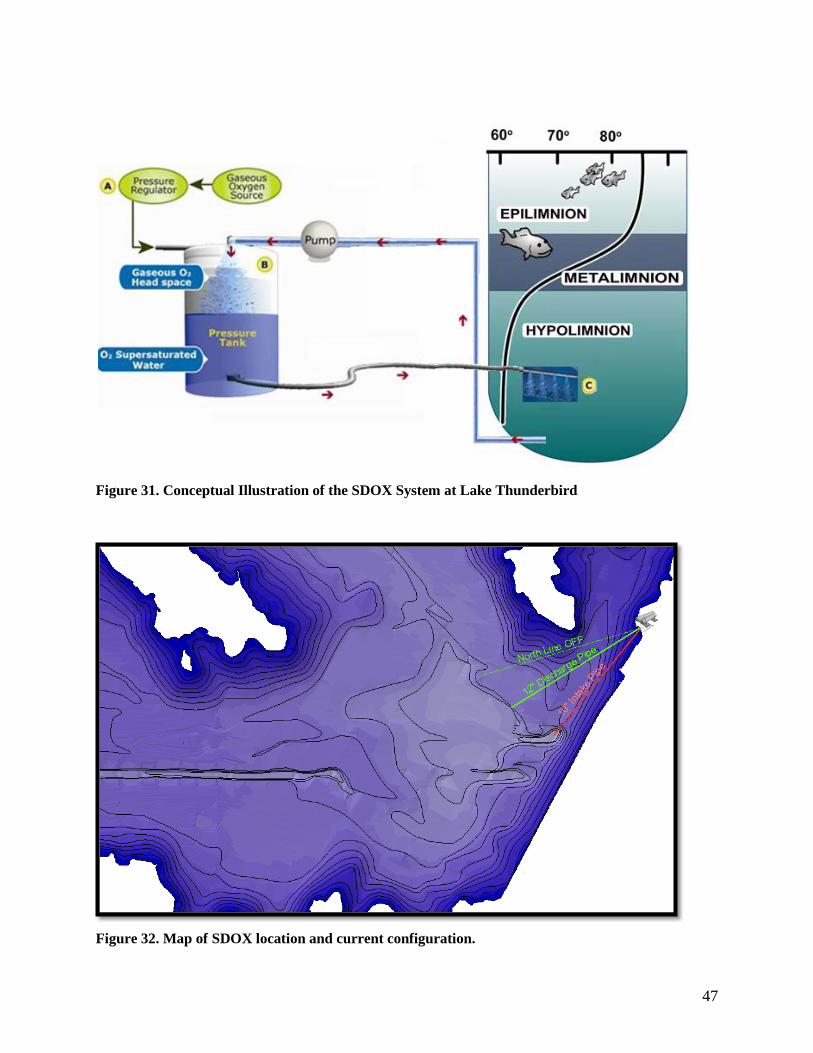
47
Figure 31. Conceptual Illustration of the SDOX System at Lake Thunderbird
Figure 32. Map of SDOX location and current configuration.

48
Figure 33. Schematic of the modified nozzle
In the previous sections of this report, the 2013 dataset was not focused on performance of the SDOX unit. In this section, the SDOX unit’s performance and effect on collected data will be discussed. When oxygen is present, it is used as the terminal electron acceptor in respiration, allowing the reduction-oxidation potential in the hypolimnion to be spared from the drop that is witnessed when other compounds are reduced through anaerobic respiration. The drop in redox potential increases the solubility of a wide range of nutrients and metals, causing a large sediment flux during the late summer months. If the SDOX system is able to provide an oxygenated hypolimnion, potential benefits include reduction of the nutrient load by minimizing the recycling of nutrients from the sediment and mitigation of peak Chl-a values. The introduction of oxygen in the hypolimnion should also lower dissolved metals, such as iron and manganese, in the water column.
SDOX Effect on Thermal Stratification One of the advertised advantages of SDOX over traditional aeration techniques is the ability to oxygenate without disruption of thermal stratification. In the first year of operation, thermal gradation was greatly reduced from the historical dataset, creating a water column that had much more uniform temperatures from top to bottom. It was also noted that the bottom temperature continually increased throughout the entire summer of 2011 until isothermal conditions were reached creating the turnover event. In 2012, a somewhat similar situation was observed where

49
bottom water conditions were much warmer than normal and heated at a higher rate than what is noted in the historical dataset. After the system modifications occurred in early July of 2012, the rate of temperature increase at the bottom slowed noticeably (0.034 C°/day 12’{July 6, 2012-August 28, 2012}, 0.085 C°/day 11’{July 7, 2011- August 25, 2011}). In 2013, the effect of the system modification continued to be observed with a normal rate of heating noted in the lake bottom (0.033 C°/day {June 19, 2013-September 25, 2013}). To help illustrate the SDOX systems effect on heat distribution throughout the water column, a comparison of relative thermal resistance has also been provided for similar dates. In Figure 34, the seasonal temperature isopleths reveal that water-column temperatures in 2011 and 2012 were much more uniform than a typical year (represented by 2009) or 2013. In 2011, instead of the cold discharged water sinking toward its density depth, the released water appeared to mix upwards to approximately 8 meters in depth. In 2012, similar findings were observed in the beginning of the year before modifications were made in July. Reduced thermal gradation in the pre-modification operational window was made apparent in the relative thermal resistance plot (Figure 35). After the system modifications occurred in 2012, the mixing layer appeared to drop by two meters to approximately 10 meters in depth, confining the mixing largely within the hypolimnion, resulting in a more normalized thermal gradient. In 2013, the changes witnessed in late 2012 continued, confining thermal resistance mixing to a tight band (Figure 36).
Figure 34. 2009, 2011, 2012, and 2013 seasonal temperature plots for Site 1.
-15-10-50
ept
()
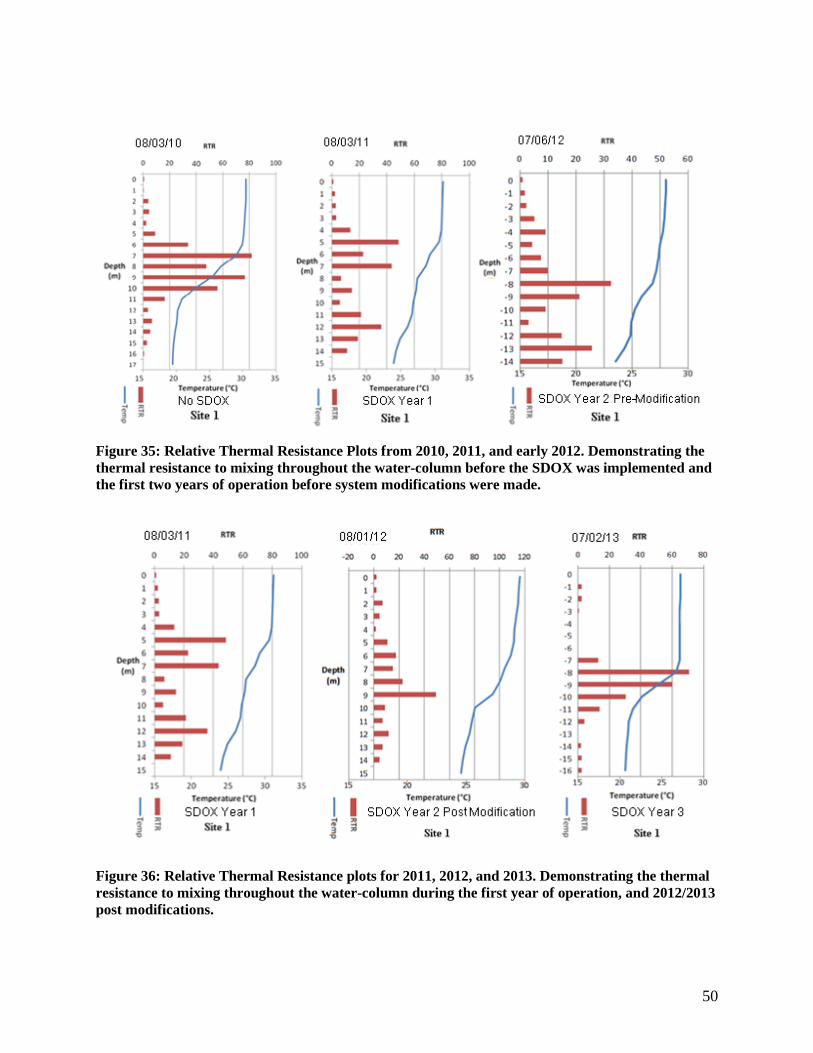
50
Figure 35: Relative Thermal Resistance Plots from 2010, 2011, and early 2012. Demonstrating the thermal resistance to mixing throughout the water-column before the SDOX was implemented and the first two years of operation before system modifications were made.
Figure 36: Relative Thermal Resistance plots for 2011, 2012, and 2013. Demonstrating the thermal resistance to mixing throughout the water-column during the first year of operation, and 2012/2013 post modifications.
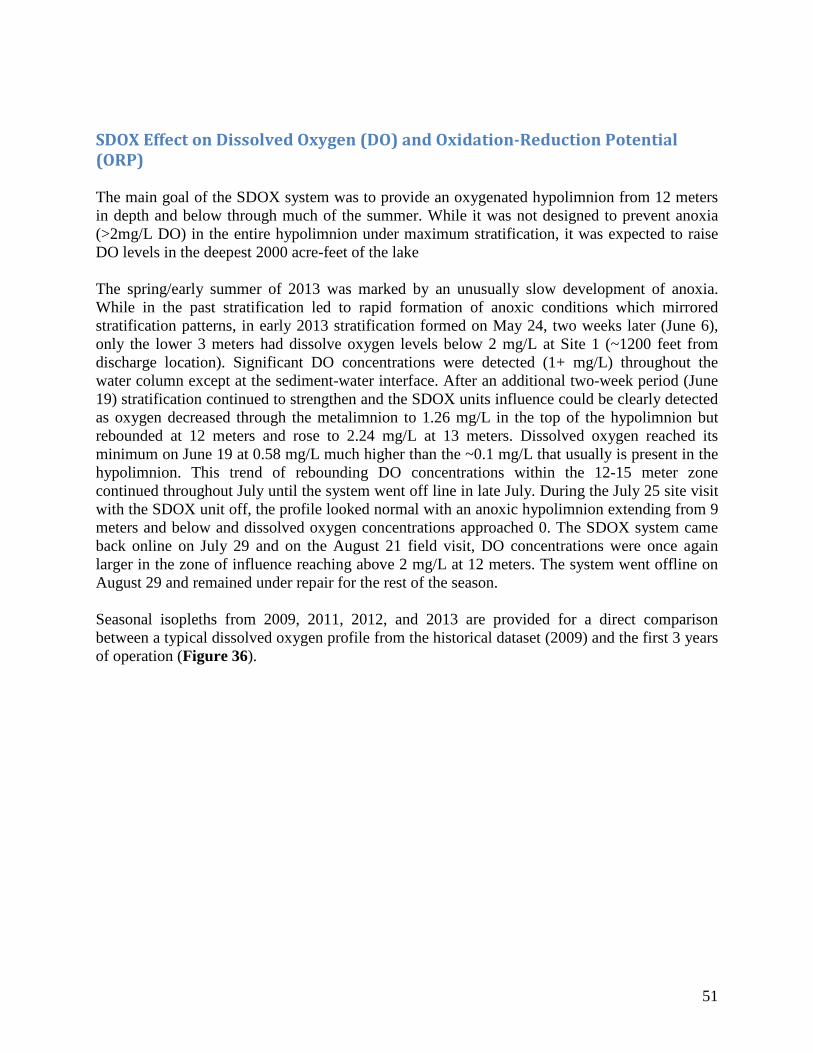
51
SDOX Effect on Dissolved Oxygen (DO) and Oxidation-Reduction Potential (ORP) The main goal of the SDOX system was to provide an oxygenated hypolimnion from 12 meters in depth and below through much of the summer. While it was not designed to prevent anoxia (>2mg/L DO) in the entire hypolimnion under maximum stratification, it was expected to raise DO levels in the deepest 2000 acre-feet of the lake The spring/early summer of 2013 was marked by an unusually slow development of anoxia. While in the past stratification led to rapid formation of anoxic conditions which mirrored stratification patterns, in early 2013 stratification formed on May 24, two weeks later (June 6), only the lower 3 meters had dissolve oxygen levels below 2 mg/L at Site 1 (~1200 feet from discharge location). Significant DO concentrations were detected (1+ mg/L) throughout the water column except at the sediment-water interface. After an additional two-week period (June 19) stratification continued to strengthen and the SDOX units influence could be clearly detected as oxygen decreased through the metalimnion to 1.26 mg/L in the top of the hypolimnion but rebounded at 12 meters and rose to 2.24 mg/L at 13 meters. Dissolved oxygen reached its minimum on June 19 at 0.58 mg/L much higher than the ~0.1 mg/L that usually is present in the hypolimnion. This trend of rebounding DO concentrations within the 12-15 meter zone continued throughout July until the system went off line in late July. During the July 25 site visit with the SDOX unit off, the profile looked normal with an anoxic hypolimnion extending from 9 meters and below and dissolved oxygen concentrations approached 0. The SDOX system came back online on July 29 and on the August 21 field visit, DO concentrations were once again larger in the zone of influence reaching above 2 mg/L at 12 meters. The system went offline on August 29 and remained under repair for the rest of the season. Seasonal isopleths from 2009, 2011, 2012, and 2013 are provided for a direct comparison between a typical dissolved oxygen profile from the historical dataset (2009) and the first 3 years of operation (Figure 36).
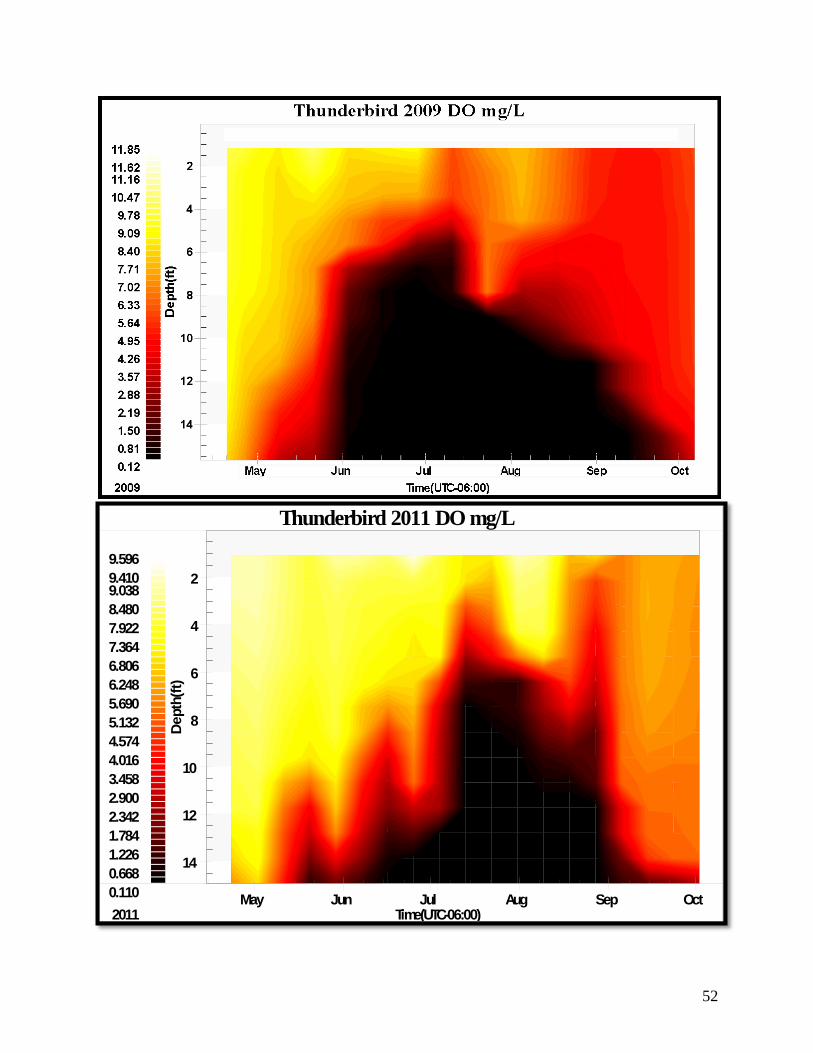
52
Thunderbird 2011 DO mg/L
Dept
h(ft)
Time(UTC-06:00)May
2011Jun Jul Aug Sep Oct
14
12
10
8
6
4
2
0.1100.6681.2261.7842.3422.9003.4584.0164.5745.1325.6906.2486.8067.3647.9228.4809.0389.4109.596

53
Figure 37. 2009, 2011, 2012, and 2013 Seasonal Dissolved Oxygen Plot for Site 1.

54
Site 1, which is located in an isolated pocket of the lakes deepest area, is not always representative of the lakes large hypolimnetic pool, which is more directly treated by the SDOX unit. On August 21, 2013, water quality profile data were collected in a linear fashion from the SDOX south nozzle. The results showed that supersaturated conditions existed within a localized area around the nozzle, with oxygenated conditions presented in a narrow depth band around the discharge depth up to 2100 ft away (Figure 38). This data is likely under representative of the SDOX’s influence through much of the summer. Data were collected after the SDOX had been turned off for a significant period of time in July and had to overcome the large hypolimnetic oxygen deficit that was observed through the fully anoxic hypolimnion that was present on July 25 and August 15 site visits. Hypolimnetic oxygen demand would also likely be the highest of the season as bottom temperatures were higher at this time. Never the less, Figure 37, aptly illustrates the SDOX’s ability to selectively effect hypolimnetic water quality.
Figure 38: August 21, 2013 SDOX Oxygen Distribution from discharge nozzle.
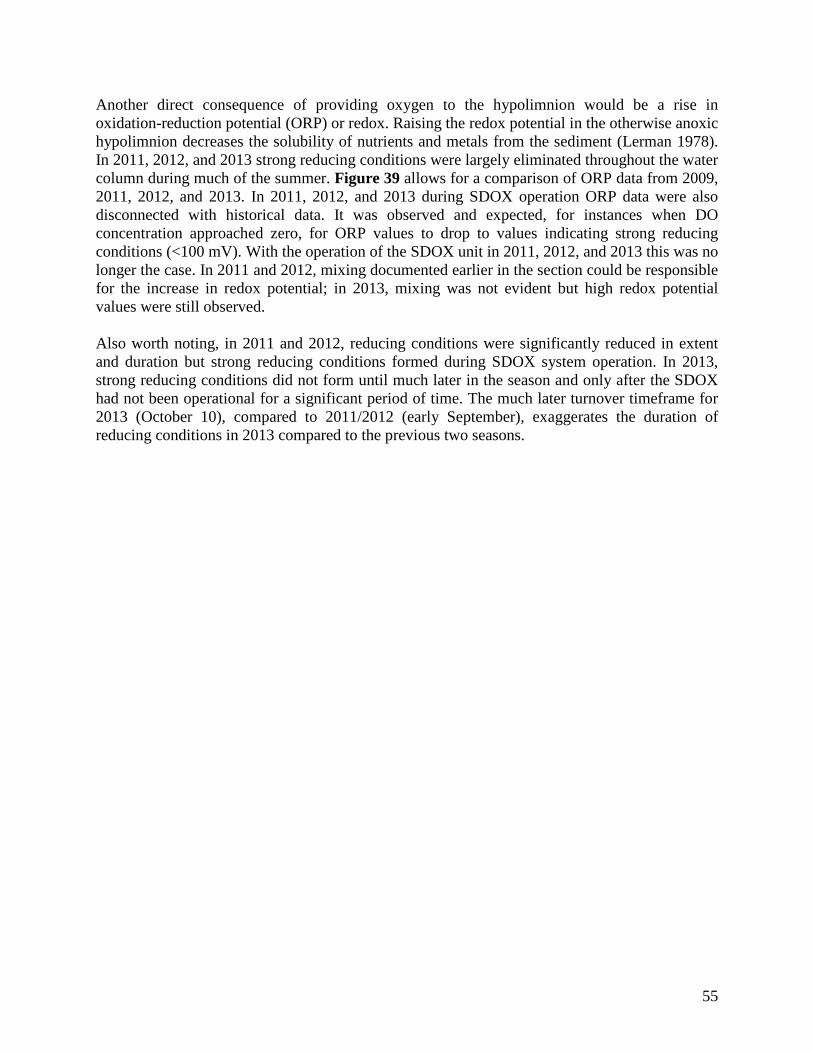
55
Another direct consequence of providing oxygen to the hypolimnion would be a rise in oxidation-reduction potential (ORP) or redox. Raising the redox potential in the otherwise anoxic hypolimnion decreases the solubility of nutrients and metals from the sediment (Lerman 1978). In 2011, 2012, and 2013 strong reducing conditions were largely eliminated throughout the water column during much of the summer. Figure 39 allows for a comparison of ORP data from 2009, 2011, 2012, and 2013. In 2011, 2012, and 2013 during SDOX operation ORP data were also disconnected with historical data. It was observed and expected, for instances when DO concentration approached zero, for ORP values to drop to values indicating strong reducing conditions (<100 mV). With the operation of the SDOX unit in 2011, 2012, and 2013 this was no longer the case. In 2011 and 2012, mixing documented earlier in the section could be responsible for the increase in redox potential; in 2013, mixing was not evident but high redox potential values were still observed. Also worth noting, in 2011 and 2012, reducing conditions were significantly reduced in extent and duration but strong reducing conditions formed during SDOX system operation. In 2013, strong reducing conditions did not form until much later in the season and only after the SDOX had not been operational for a significant period of time. The much later turnover timeframe for 2013 (October 10), compared to 2011/2012 (early September), exaggerates the duration of reducing conditions in 2013 compared to the previous two seasons.
56
Figure 39. Lake Thunderbird 2009, 2011, 2012, and 2013 oxidation-reduction potential isopleths

57
Figure 40. Temperature, Oxidation-Reduction Potential, and Dissolved Oxygen by depth: July 1 2010, July 7 2011, July 6 2012, and July 2 2013.
58
SDOX Effect on Nutrients, and Chlorophyll-a The ultimate goals of the SDOX system lied not only in the chemical changes it could directly provide in the hypolimnion (i.e. increased dissolved oxygen, raise oxidation-reduction potential), but also induce the biological changes by reducing phosphorous loading from the sediment. This load has been documented to fuel the rise in Chl-a during the late-summer/fall turnover timeframe, in-turn causing a rise in TOC, drinking water treatment costs, potential for carcinogenic disinfectant by-products in finished drinking water, and taste and odor complaints. Empirical observations during 2013 showed that the SDOX system had a large impact on nutrient dynamics in the reservoir, resulting in a reduction in Chl-a. Normally TP concentrations start the season high after spring rains, dip lower during the early summer period before rising in late summer when entrainment of phosphorous rich hypolimnetic waters cause TP to rise, bringing a significant Chl-a rise. In the spring of 2013, the highest phosphorous levels ever detected in the reservoir were detected after the first samples were taken following spring rains. Despite this large input of phosphorous from external sources, TP concentrations became progressively lower throughout the season before reaching the lab detection limit in mid-August through September, before slightly rising in October. This created a system where algae growth was limited by phosphorus for growth. Chl-a was observed at its lowest levels since 2007. While there are several ongoing watershed projects under development in both the Little River and Hog Creek arms of the lake, these demonstrations are not likely to account for the large nutrient reductions witnessed in the lake, as inflow concentrations were the largest on record. In addition, spring and early summer Chl-a values when external nutrient sources dominate, were on par with the 2008-2011 timeframe when Chl-a values consistently peaked over 60 µg/L during late summer. In previous reports it has been demonstrated that when Chl-a peaks, there is very little to no external nutrient sources making internal nutrient dynamics the dominant source of nutrients for this late timeframe of the season. The large reduction in peak Chl-a in 2013, 49% reduction from 2008 to 2012, should largely be attributed to the reduction of internal phosphorus loading. In addition to the observed empirical TP values in the lake and lowered algal biomass, a method developed by Nurnberg (2005) to calculate anaerobically mediated sediment P release provides an idea of the amount of sediment P release reduction. This was done by comparing the areal anoxia and sediment phosphorous release rate of 2013 to the values calculated for 2005 to 2009 (OWRB 2011). Based on the Nurnberg method and assuming a constant release rate under anoxic conditions, it was calculated that sediment P release was reduced by approximately 60% from the five-year average. This is equivalent to 14% of the average total annual TP load (2120 kg) (OWRB 2011). Two-sample t-test statistical analysis of the historical dataset of Site 1 TP and Chl-a (before and after SDOX operation), revealed significant differences. Mean TP at Site 1 during the internal loading window, August-September, decreased significantly (.02 mg/L) after SDOX operation (0.017 +/- 0.009 n=9) than when compared to the mean TP concentration before SDOX operation (0.037+/- 0.010 n=10) (two-sample t-test, P-Value < 0.001). Mean Chl-a at Site 1 during the internal loading window, August-September, also decreased significantly (17.9 µg/L)
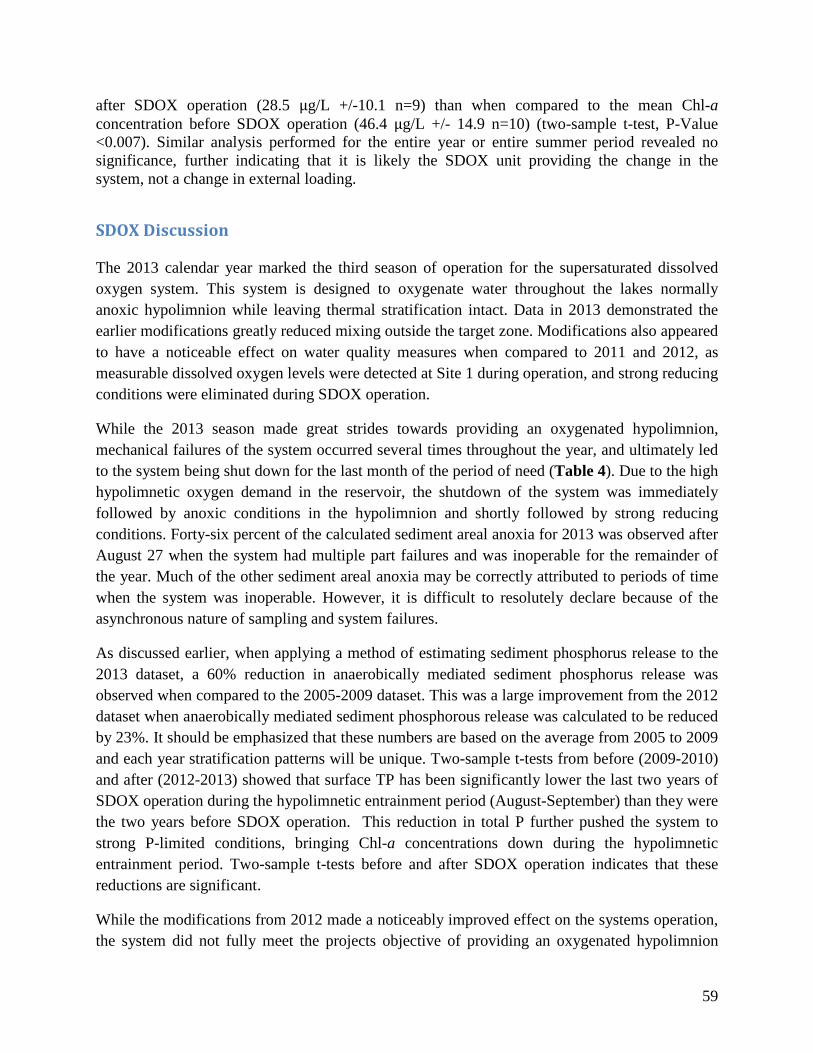
59
after SDOX operation (28.5 µg/L +/-10.1 n=9) than when compared to the mean Chl-a concentration before SDOX operation (46.4 µg/L +/- 14.9 n=10) (two-sample t-test, P-Value <0.007). Similar analysis performed for the entire year or entire summer period revealed no significance, further indicating that it is likely the SDOX unit providing the change in the system, not a change in external loading.
SDOX Discussion The 2013 calendar year marked the third season of operation for the supersaturated dissolved oxygen system. This system is designed to oxygenate water throughout the lakes normally anoxic hypolimnion while leaving thermal stratification intact. Data in 2013 demonstrated the earlier modifications greatly reduced mixing outside the target zone. Modifications also appeared to have a noticeable effect on water quality measures when compared to 2011 and 2012, as measurable dissolved oxygen levels were detected at Site 1 during operation, and strong reducing conditions were eliminated during SDOX operation.
While the 2013 season made great strides towards providing an oxygenated hypolimnion, mechanical failures of the system occurred several times throughout the year, and ultimately led to the system being shut down for the last month of the period of need (Table 4). Due to the high hypolimnetic oxygen demand in the reservoir, the shutdown of the system was immediately followed by anoxic conditions in the hypolimnion and shortly followed by strong reducing conditions. Forty-six percent of the calculated sediment areal anoxia for 2013 was observed after August 27 when the system had multiple part failures and was inoperable for the remainder of the year. Much of the other sediment areal anoxia may be correctly attributed to periods of time when the system was inoperable. However, it is difficult to resolutely declare because of the asynchronous nature of sampling and system failures.
As discussed earlier, when applying a method of estimating sediment phosphorus release to the 2013 dataset, a 60% reduction in anaerobically mediated sediment phosphorus release was observed when compared to the 2005-2009 dataset. This was a large improvement from the 2012 dataset when anaerobically mediated sediment phosphorous release was calculated to be reduced by 23%. It should be emphasized that these numbers are based on the average from 2005 to 2009 and each year stratification patterns will be unique. Two-sample t-tests from before (2009-2010) and after (2012-2013) showed that surface TP has been significantly lower the last two years of SDOX operation during the hypolimnetic entrainment period (August-September) than they were the two years before SDOX operation. This reduction in total P further pushed the system to strong P-limited conditions, bringing Chl-a concentrations down during the hypolimnetic entrainment period. Two-sample t-tests before and after SDOX operation indicates that these reductions are significant.
While the modifications from 2012 made a noticeably improved effect on the systems operation, the system did not fully meet the projects objective of providing an oxygenated hypolimnion

60
from 12 meters in depth to the bottom of the lake. Undoubtedly, the inability to keep the SDOX system operable for 40% of the operating window had a significant effect on the ability to meet project goals but other issues were evident. During late June and July Site 1 observations, the lake experienced oxygenation from 12 to 16 meters, with the last 0.5 meters approaching 0 mg/L. The lack of oxygen at the sediment interface suggests that the amount of oxygen being supplied is inadequate to overcome sediment oxygen demand, likely meaning the system is undersized to fully oxygenate the target zone when warmer hypolimnetic conditions drive up biological reactions, increasing sediment/hypolimnetic oxygen demand.
The other shortcoming of the system lies in the reliance on the density seeking principle the SDOX system was designed upon: supersaturated waters reinjected at 12 meters would seek their density gradient from the depth it was pulled from ~16 meters, oxygenating the hypolimnion from the bottom up. This has been found not to be the case, with rises in dissolved oxygen concentrations always being found near the injection depth ~12 meters at 1600 meters away with elevated readings below. In hindsight, it appears it would have been beneficial to locate the discharge location at the deepest location possible to oxygenate the lake from the bottom up, and to constrain localized mixing to the deepest part of the water column as much as possible. At this time, there are no additional modifications to the SDOX system planned. A full, uninterrupted operating season under the current configuration will be beneficial to display the full potential of the current system.
Lastly, while some significant positive effects have been witnessed during the first three years of SDOX operation, it has been suggested that oxygenation systems will decrease hypolimnetic oxygen demand over time, as there will be less “carry over” of latent demand from year to year as large amounts of settled organic matter are incrementally broken down (Gantzer 2008).

61
Discussion
Water Quality For the past 14 years, OWRB has monitored the water quality at Lake Thunderbird observing the consequences of cultural eutrophication, degraded water quality, which over time have become more severe, including increasingly high Chl-a, elevated TOC, elevated pH and supersaturation of DO. As 2013 represented the first year where the trend was resolutely reversed, the lowered algal biomass (measured through Chl-a) was directly responsible for the relief witnessed in pH and surface DO measures. Trophic State Index Chl-a indicated mesotrophic conditions in the early spring, with eutrophic conditions throughout the summer and fall. Absent are the hypereutrophic TSI Chl-a values in the 70’s and 80’s that have been present in the past. Anoxia occurred during the summer months, but was often broke up by the SDOX system’s influence in the 12 to 15 meter range. Strong reducing conditions were absent throughout much of the summer, and only appeared after extended SDOX system failures. During this time, phosphorous and metals were released back into the water column and likely entrained during fall turnover. The infusion of hypolimnetic waters with external oxygen by the SDOX system installed in 2010 and operating in 2013, clearly helped reduce the extent and duration of low dissolved oxygen and low to negative ORP and likely anaerobically mediated sediment P release as well. Harmful algal blooms, or HABs, are another consequence of cultural eutrophication that can lead to many environmental problems. Cyanobacteria, or blue-green algae, are the most common group of harmful algae in freshwaters. Several species of cyanobacteria occur in and dominate phytoplankton communities in Oklahoma waters, including Lake Thunderbird. Taste and odor causing compounds such as geosmin and MIB (2-methylisoborneol) are released from blue-green algal cells following lyses, or senescence, and decomposition. This causes problems in public drinking water supply lakes because of the difficulty in removing these chemicals beyond detection limits in the treatment process. The City of Norman has historically received taste and odor complaints attributable to the presence of these compounds in finished drinking water and detected these compounds in the raw and treated waters in 2013, including the winter. In addition, blue-green algae have the capability to produce multiple toxins that can cause skin irritations, harm or lethality to humans, livestock, and pets that drink from untreated contaminated water sources. If cultural eutrophication was to continue unabated, risks of HABs and their associated consequences will continue to increase. The significant lowering of peak and average Chl-a in 2013 indicates the lake has begun to move in the right direction.
State Water Quality Standards In 2013, Lake Thunderbird was listed on Oklahoma’s 303(d) list of the Water Quality Integrated Report as impaired due to low DO, with the official cause of these impairments unknown. Data collected in 2013 were analyzed for beneficial use impairments in accordance with the USAP (OAC 785:46-15) of the OWQS. In 2013, Lake Thunderbird was found to be supporting its Fish and Wildlife Propagation beneficial use in regard to DO. The USAP assessments are done on the most recent 10-year dataset. Therefore, this single year of meeting WQS will not remove Lake Thunderbird from the 303(d) list for DO. In addition, Lake Thunderbird was not meeting the 10

62
µg/L Chl-a requirement for Sensitive Public and Private Water Supply (SWS) or the 25 NTU standard of turbidity.
Closing Remarks During the past few years, significant achievements have been made in modeling Lake Thunderbird’s watershed and internal P load, allowing for better understanding of the P mass-balance for Lake Thunderbird. Regression analysis with Lake Thunderbird water quality data and City of Norman drinking water treatment data, indicate that organic enrichment through increased algal biomass is increasing TOC within the reservoir. The 2012 calendar year represented the first year since 2007 that peak Chl-a had been reduced, and 2013 represented another large reduction in peak Chl-a from 2012. Significant nutrient reduction from the surrounding watershed, particularly in the Little River area (OWRB 2011), are critical to bring Chl-a within Oklahoma Water Quality Standards of 10 µg/L.

63
References Carlson, R.E. 1977. A trophic state index for lakes. Limnology and Oceanography. 22:361-369. COMCD, 2006. Rock Creek Watershed Analysis and Water Quality Evaluation. Prepared for the Central Oklahoma Master Conservancy District. August 2006. Dzialowski, A.R., S.-H. Wang, N.-C. Lim, W. W. Spotts, and D.G. Huggins. 2005. Nutrient limitation of phytoplankton growth in central plains reservoirs, USA. Journal of Plankton Research 27(6): 587-595. Gantzer, Paul. 2008. Controlling Oxygen, Iron and Manganese in Water-Supply Reservoirs Using Hypolimnetic Oxygenation. Dissertation submitted to the Faculty of the Virginia Polytechnic Institute and State University. Graham, J.L., K.A. Loftin, A.C. Ziegler, and M.T. Meyer. 2008. Guidelines for design and sampling for cyanobacterial toxin and taste-and-odor studies in lakes and reservoirs: U.S. Geological Survey Scientific Investigations Report 2008-5038. Reston, Virginia. Kratzer, Charles and P. Brezonik. “A Carlson-Type Trophic State Index for Nitrogen in Florida Lakes”. Journal of the American Water Resources Association. 17.4 (1981) 713-715. Print. Lerman, Abraham, and P. Baccini. Lakes--chemistry, geology, physics. Springer, 1978. 98-99. Print. Nurnberg, Gertrud. "Phosphorous Release from Anoxic Sediments: What We Know and How We Can Deal With It." Limnetica. 10.1 (1994): 1-4. Print.
Nurnberg, Gertrud. "Quantification of Internal Phosphorous Loading in Polymictic Lakes." Limnology 29. (2005): n. pag. Web. 30 Mar 2011. OAC, Oklahoma Administrative Code. 2008. Title 785, Oklahoma Water Resources Board: Chapter 45, Oklahoma’s Water Quality Standards, and Chapter 46, Implementation of Oklahoma’s Water Quality Standards. http://www.oar.state.ok.us/oar/codedoc02.nsf/frmMain?OpenFrameSet&Frame=Main&Src=_75tnm2shfcdnm8pb4dthj0chedppmcbq8dtmmak31ctijujrgcln50ob7ckj42tbkdt374obdcli00_ OCS, Oklahoma Climatological Survey. 2011. Rainfall Summary Statistics, 20011. http://climate.mesonet.org/rainfall_update.html Oklahoma Department of Environmental Quality. 2010. The State of Oklahoma 2010 Water Quality Assessment Integrated Report.
http://www.deq.state.ok.us/wqdnew/305b_303d/2010/2010%20Oklahoma%20Integrated%20Report.pdf OWRB, Oklahoma Water Resources Board. 2011. Technical Reports. Developing In-Lake BMPs to Enhance Raw Water Quality of Oklahoma’s Sensitive Water Supply http://www.owrb.ok.gov/studies/reports/reports.php Wetzel, R.G. 2001. Limnology: Lake and River Ecosystems. San Diego, Elsevier Academic Press.

64
Appendix A: Quality Control Data Tabular Summary of Chlorophyll-a Quality Control Samples: replicate (Sites 1 a & b) and duplicate sample as Site 9
Date Chlorophyll-a Paired
Site 1 a Site 1 b Site 9 Average SD 4/26/2013 6.73 6.95 7.67 7.1 0.49 5/8/2013 3.46 7.46 3.74 4.9 2.23 6/6/2013 13.6 14.4 7.06 11.7 4.03
6/19/2013 25.7 26 15.4 22.4 6.04 7/2/2013 19.1 20.4 20.4 19.9 0.75
7/25/2013 10.7 12 8.94 10.6 1.54 8/15/2013 26.6 28.1 23.8 26.2 2.18 9/12/2013 31 33 32.9 32.3 1.13 9/25/2013 25.5 27.2 23.5 25.4 1.85
12/18/2013
24.5 24.3 24.4 0.14
AVG SD 2.04
Min 0.14
Max 6.04
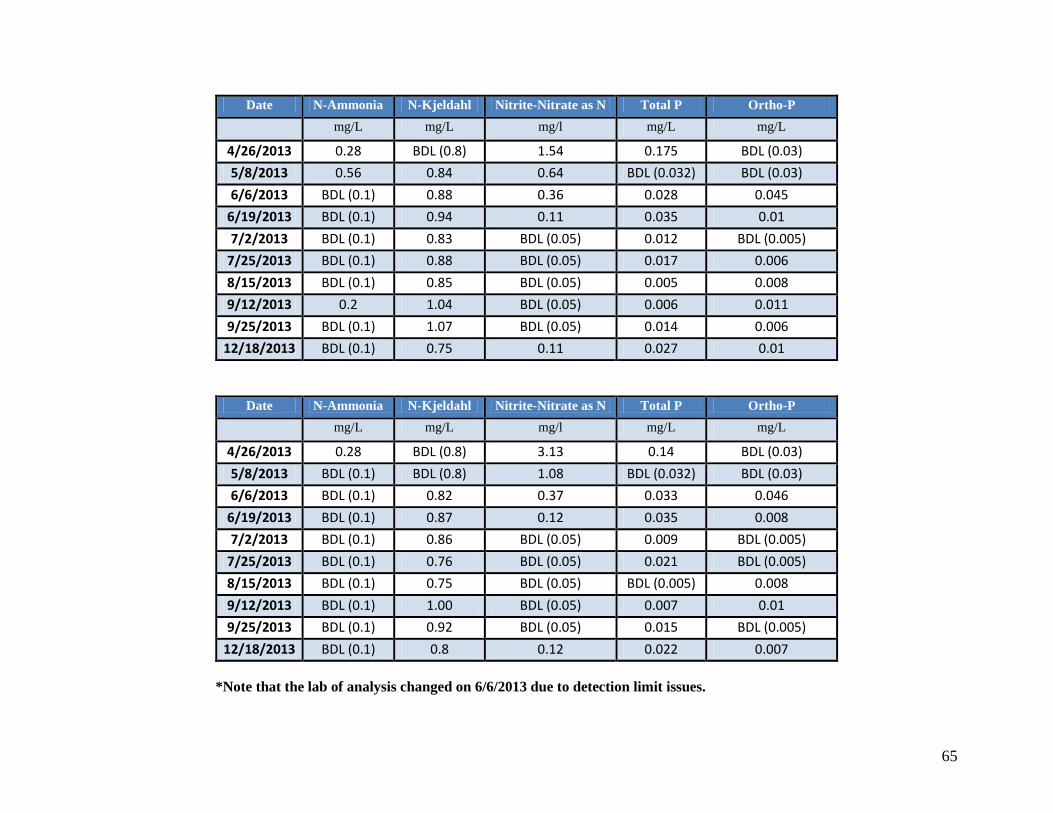
65
Date N-Ammonia N-Kjeldahl Nitrite-Nitrate as N Total P Ortho-P mg/L mg/L mg/l mg/L mg/L
4/26/2013 0.28 BDL (0.8) 1.54 0.175 BDL (0.03) 5/8/2013 0.56 0.84 0.64 BDL (0.032) BDL (0.03) 6/6/2013 BDL (0.1) 0.88 0.36 0.028 0.045
6/19/2013 BDL (0.1) 0.94 0.11 0.035 0.01 7/2/2013 BDL (0.1) 0.83 BDL (0.05) 0.012 BDL (0.005)
7/25/2013 BDL (0.1) 0.88 BDL (0.05) 0.017 0.006 8/15/2013 BDL (0.1) 0.85 BDL (0.05) 0.005 0.008 9/12/2013 0.2 1.04 BDL (0.05) 0.006 0.011 9/25/2013 BDL (0.1) 1.07 BDL (0.05) 0.014 0.006
12/18/2013 BDL (0.1) 0.75 0.11 0.027 0.01
Date N-Ammonia N-Kjeldahl Nitrite-Nitrate as N Total P Ortho-P mg/L mg/L mg/l mg/L mg/L
4/26/2013 0.28 BDL (0.8) 3.13 0.14 BDL (0.03) 5/8/2013 BDL (0.1) BDL (0.8) 1.08 BDL (0.032) BDL (0.03) 6/6/2013 BDL (0.1) 0.82 0.37 0.033 0.046
6/19/2013 BDL (0.1) 0.87 0.12 0.035 0.008 7/2/2013 BDL (0.1) 0.86 BDL (0.05) 0.009 BDL (0.005)
7/25/2013 BDL (0.1) 0.76 BDL (0.05) 0.021 BDL (0.005) 8/15/2013 BDL (0.1) 0.75 BDL (0.05) BDL (0.005) 0.008 9/12/2013 BDL (0.1) 1.00 BDL (0.05) 0.007 0.01 9/25/2013 BDL (0.1) 0.92 BDL (0.05) 0.015 BDL (0.005)
12/18/2013 BDL (0.1) 0.8 0.12 0.022 0.007
*Note that the lab of analysis changed on 6/6/2013 due to detection limit issues.

66
Appendix B: Riverine Nutrient Data
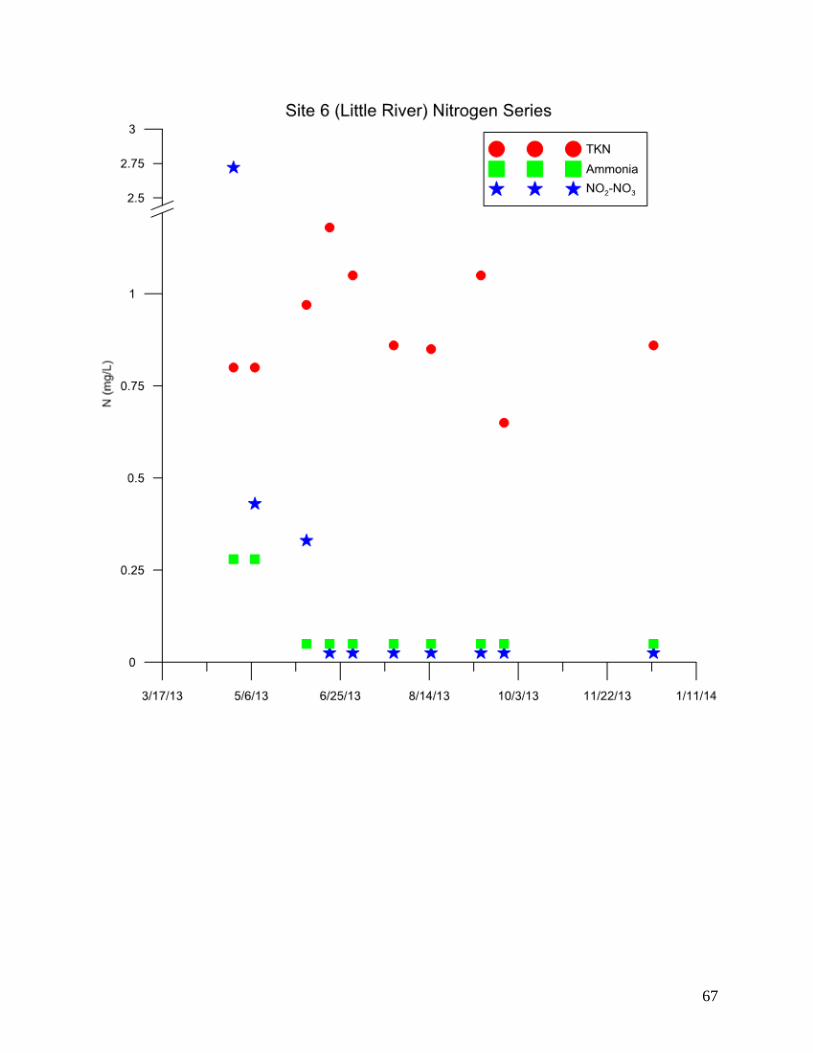
67

68
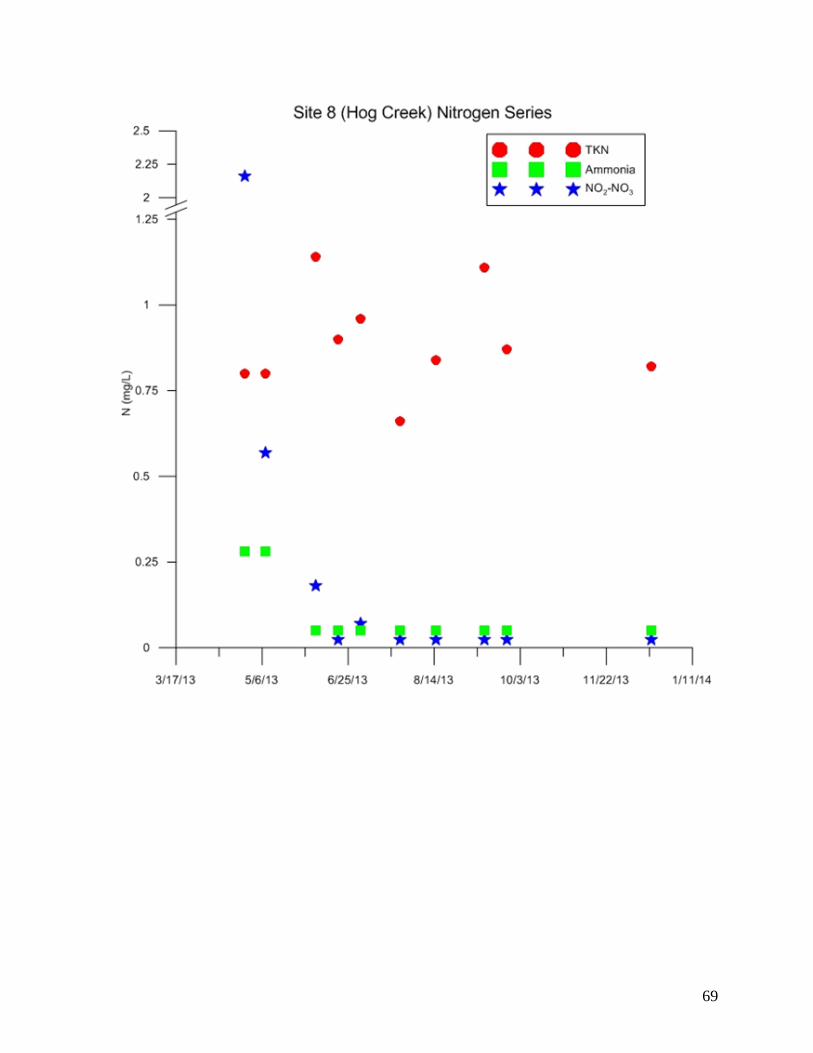
69

70

71
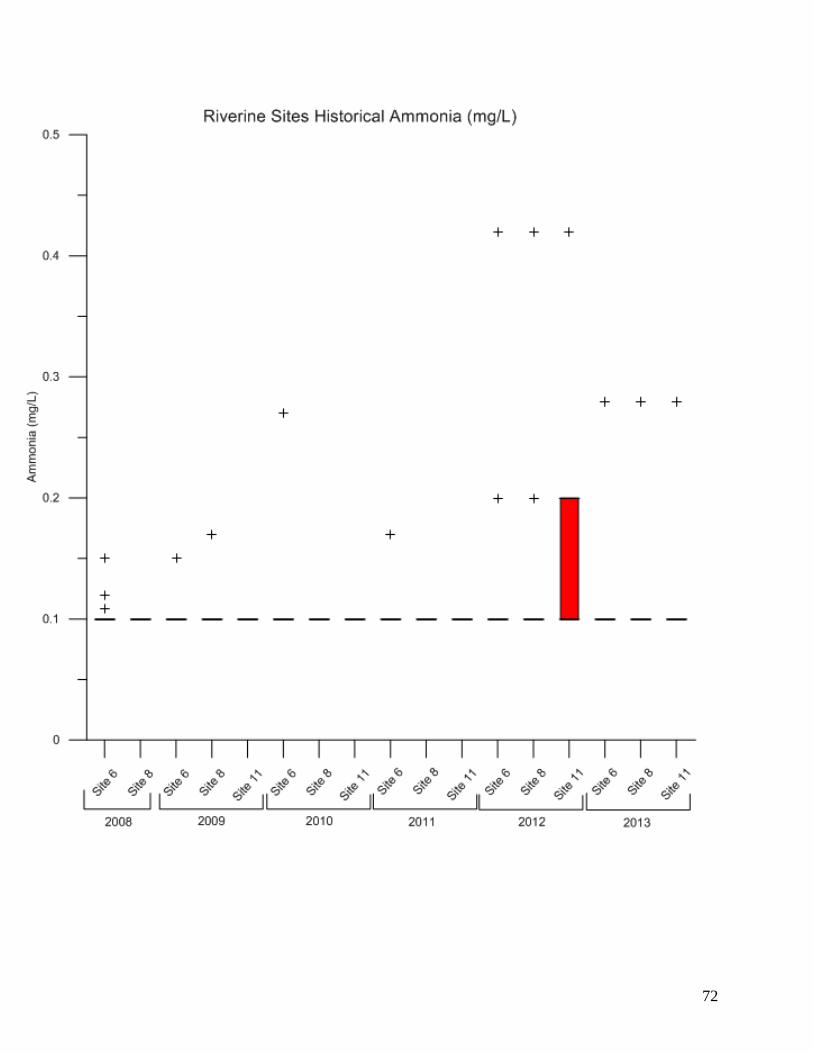
72
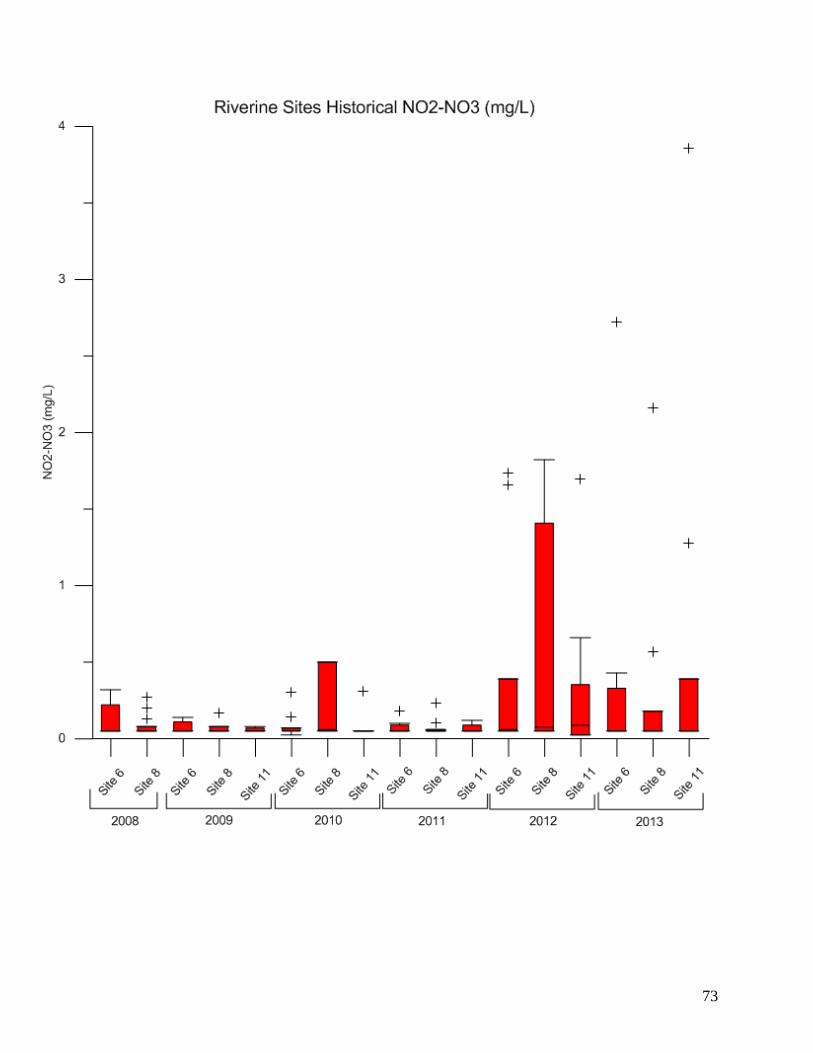
73
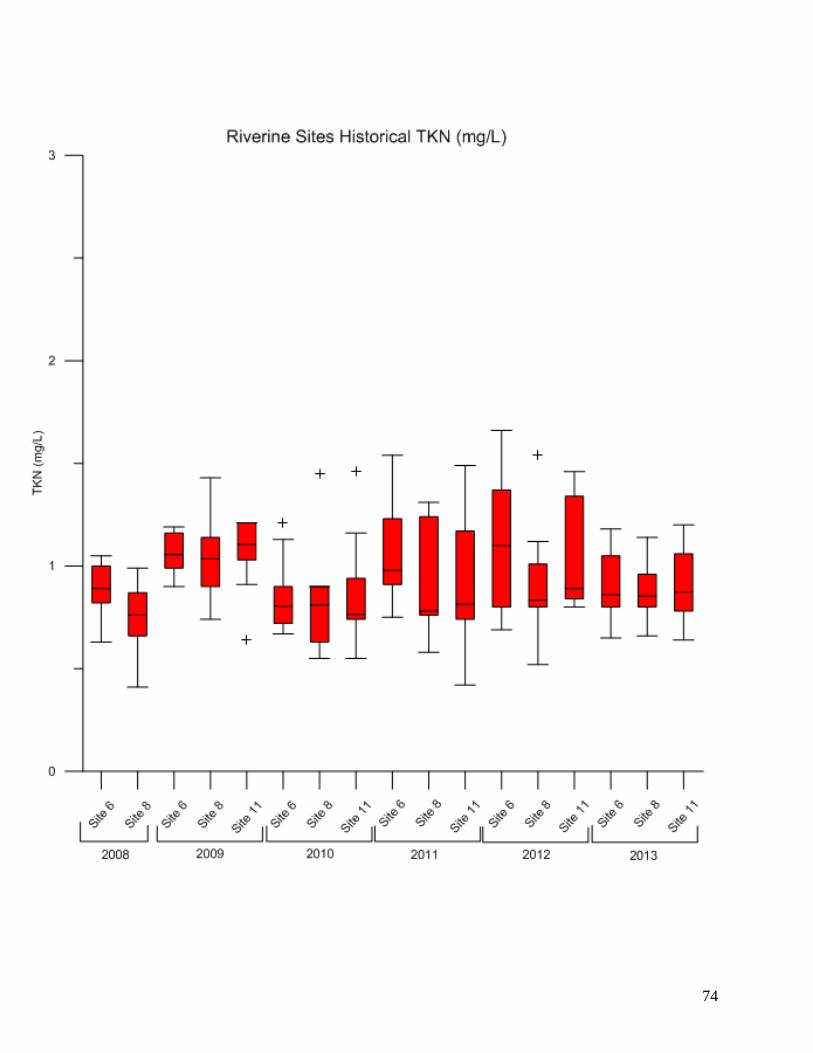
74
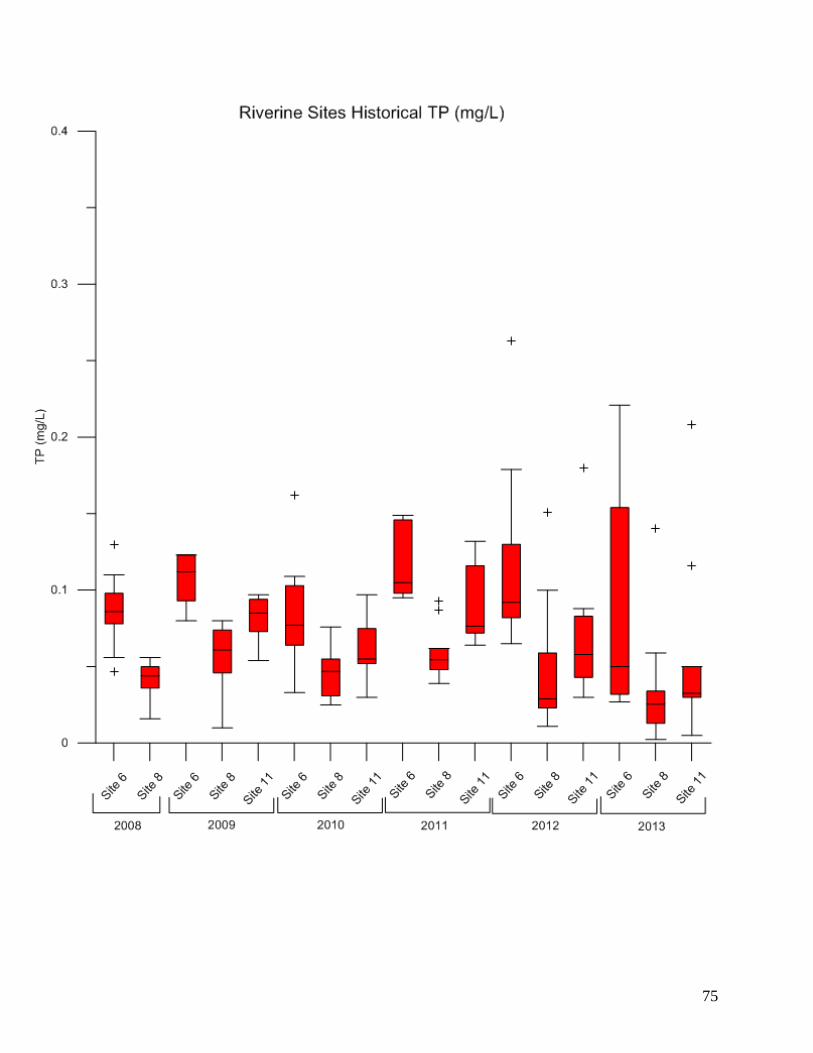
75

76

77
0
0.02
0.04
0.06
0.08
0.1
0.12
0.14
0.16
Oct-06 Feb-08 Jul-09 Nov-10 Apr-12 Aug-13 Dec-14
TP (m
g.L)
Site 6 (Litle River Arm) Total P
0
0.01
0.02
0.03
0.04
0.05
0.06
0.07
0.08
0.09
Oct-06 Feb-08 Jul-09 Nov-10 Apr-12 Aug-13 Dec-14
Ort
ho-P
(mg/
L)
Site 6 (Little River Arm) Ortho P
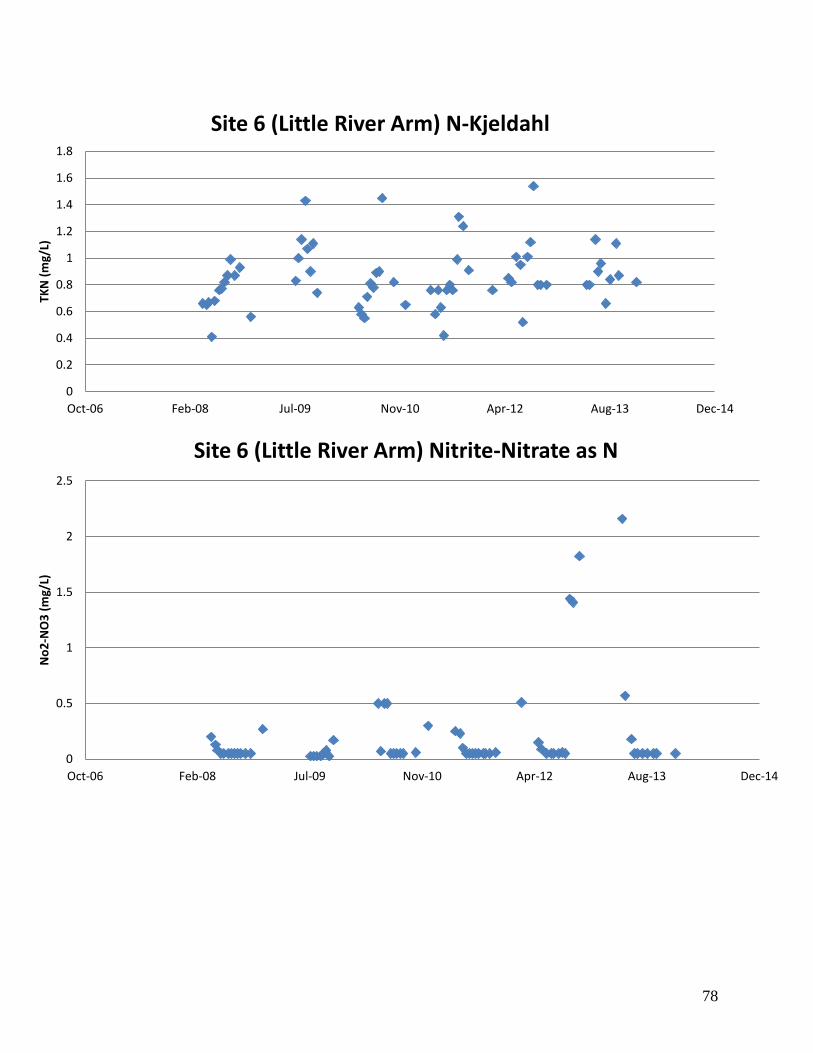
78
0
0.2
0.4
0.6
0.8
1
1.2
1.4
1.6
1.8
Oct-06 Feb-08 Jul-09 Nov-10 Apr-12 Aug-13 Dec-14
TKN
(mg/
L)
Site 6 (Little River Arm) N-Kjeldahl
0
0.5
1
1.5
2
2.5
Oct-06 Feb-08 Jul-09 Nov-10 Apr-12 Aug-13 Dec-14
No2
-NO
3 (m
g/L)
Site 6 (Little River Arm) Nitrite-Nitrate as N
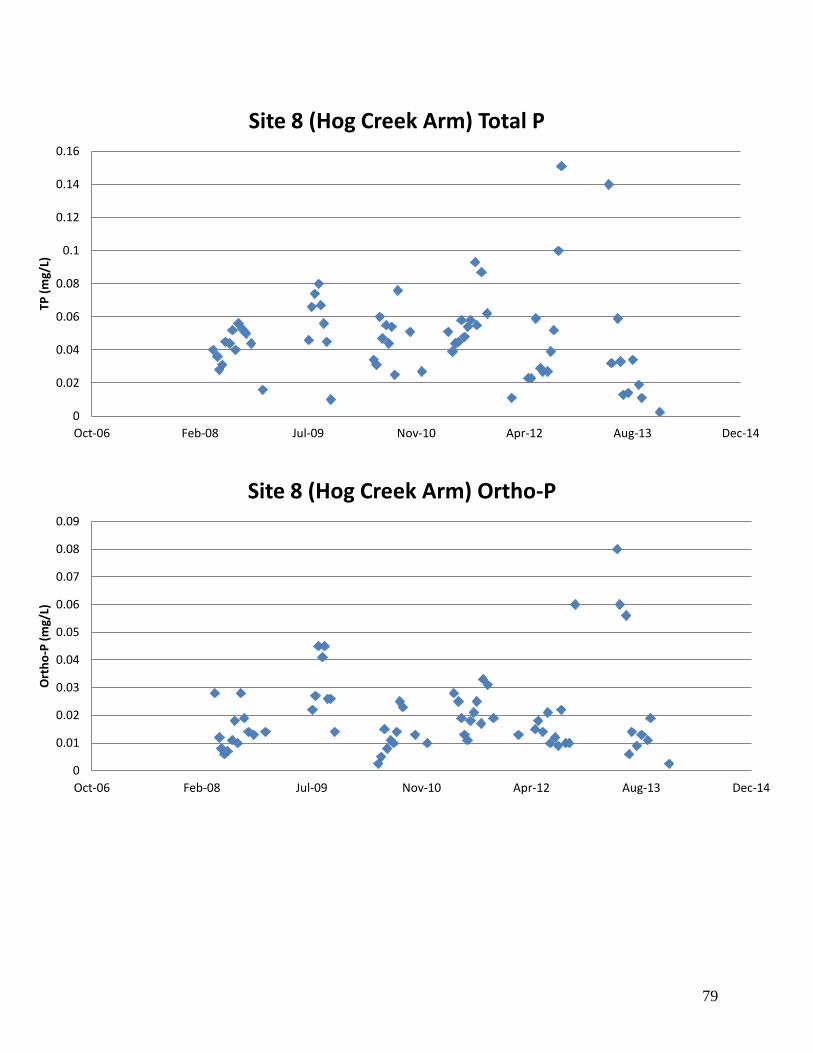
79
0
0.02
0.04
0.06
0.08
0.1
0.12
0.14
0.16
Oct-06 Feb-08 Jul-09 Nov-10 Apr-12 Aug-13 Dec-14
TP (m
g/L)
Site 8 (Hog Creek Arm) Total P
0
0.01
0.02
0.03
0.04
0.05
0.06
0.07
0.08
0.09
Oct-06 Feb-08 Jul-09 Nov-10 Apr-12 Aug-13 Dec-14
Ort
ho-P
(mg/
L)
Site 8 (Hog Creek Arm) Ortho-P
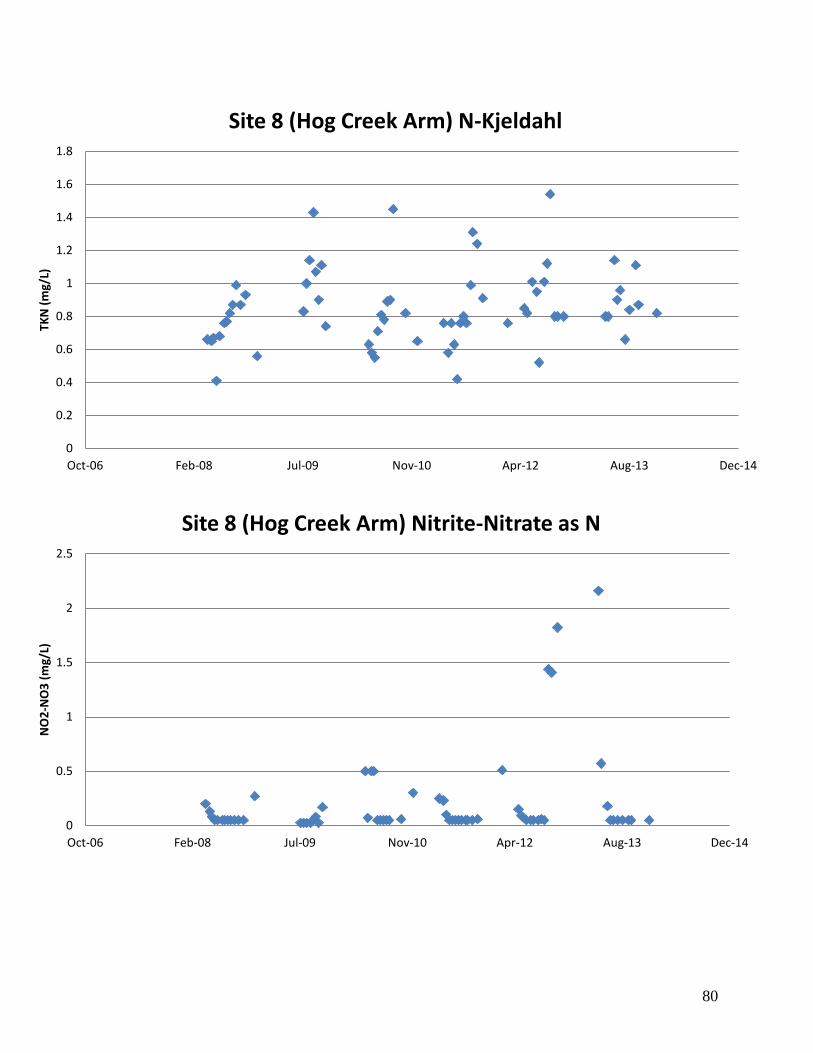
80
0
0.2
0.4
0.6
0.8
1
1.2
1.4
1.6
1.8
Oct-06 Feb-08 Jul-09 Nov-10 Apr-12 Aug-13 Dec-14
TKN
(mg/
L)
Site 8 (Hog Creek Arm) N-Kjeldahl
0
0.5
1
1.5
2
2.5
Oct-06 Feb-08 Jul-09 Nov-10 Apr-12 Aug-13 Dec-14
NO
2-N
O3
(mg/
L)
Site 8 (Hog Creek Arm) Nitrite-Nitrate as N

81
0
0.05
0.1
0.15
0.2
0.25
Dec-08 Jul-09 Jan-10 Aug-10 Feb-11 Sep-11 Apr-12 Oct-12 May-13 Nov-13 Jun-14
TP (m
g/L)
Site 11 (Dave Blue Creek Arm) Total P
0
0.02
0.04
0.06
0.08
0.1
0.12
0.14
0.16
Dec-08 Jul-09 Jan-10 Aug-10 Feb-11 Sep-11 Apr-12 Oct-12 May-13 Nov-13 Jun-14
Ort
ho-P
(mg/
L)
Site 11 (Dave Blue Creek Arm) Ortho-P

82
0
0.2
0.4
0.6
0.8
1
1.2
1.4
1.6
Dec-08 Jul-09 Jan-10 Aug-10 Feb-11 Sep-11 Apr-12 Oct-12 May-13 Nov-13 Jun-14
TKN
(mg/
L)
Site 11 (Dave Blue Creek Arm) N-Kjeldahl
0
0.5
1
1.5
2
2.5
3
3.5
4
4.5
Dec-08 Jul-09 Jan-10 Aug-10 Feb-11 Sep-11 Apr-12 Oct-12 May-13 Nov-13 Jun-14
NO
2-N
O3
(mg/
L)
Site 11 (Dave Blue Creek Arm) Nitrite-Nitrate as N