lake george beach - new york state department of ... george beach pollution source investigation...
TRANSCRIPT

LAKE GEORGE BEACH Pollution Source Investigation
April 2017
www.dec.ny.gov

Table of Contents EXECUTIVE SUMMARY ............................................................................................................................................ 1
INTRODUCTION ........................................................................................................................................................ 1
BACKGROUND ......................................................................................................................................................... 2
LAKE GEORGE BEACH FACILITIES ....................................................................................................................... 2
Beach and Swimming Area .................................................................................................................................... 2
Sanitary Facilities .................................................................................................................................................... 3
BACTERIOLOGICAL MONITORING ........................................................................................................................ 3
Indicators and Agency Standards ........................................................................................................................... 3
Bacteriological Results for Lake George Beach ..................................................................................................... 3
Lake George Beach Closures................................................................................................................................. 4
POTENTIAL POLLUTION SOURCES ....................................................................................................................... 4
Watershed Sources ................................................................................................................................................ 4
Nearshore Sources ................................................................................................................................................. 9
SUMMARY OF WATER QUALITY FINDINGS ........................................................................................................ 10
Shoreline Sampling ............................................................................................................................................... 10
Tributary Sampling ................................................................................................................................................ 11
Microbial Source Tracking (MST) Analysis ........................................................................................................... 11
SUMMARY OF PRELIMINARY POLLUTION SOURCE INVESTIGATION ............................................................ 11
FUTURE ACTIONS .................................................................................................................................................. 12
Water Quality Studies ........................................................................................................................................... 12
Pollution Source Investigation .............................................................................................................................. 12
Beach Maintenance and Operations .................................................................................................................... 12
REFERENCES ......................................................................................................................................................... 13
APPENDIX A: PRELIMINARY WATER QUALITY STUDIES ................................................................................. 14
Shoreline Monitoring ............................................................................................................................................. 14
Water Depth Analysis ........................................................................................................................................... 15
Tributary Monitoring .............................................................................................................................................. 16
Microbial Source Tracking (MST) ......................................................................................................................... 22
APPENDIX B: PRELIMINARY POLLUTION SOURCE INVESTIGATION ............................................................. 23
Sanitary Sewage ................................................................................................................................................... 24
Stormwater............................................................................................................................................................ 29
LAKE GEORGE BEACH | Preliminary Pollution Source Investigation (April 2017) i

EXECUTIVE SUMMARY The New York State Department of Environmental Conservation (DEC) owns and operates Lake George Beach (“Million Dollar Beach”) as part of Lake George Beach State Park. In August 2016, DEC closed the beach and the adjacent area known as “Dog Beach” due to bacteria levels that exceeded New York State Department of Health guidelines for bathing beaches.
In response, DEC developed and implemented a plan to track down potential sources of bacteria and took steps to prevent any further contamination of the lake and beach. The sampling plan consisted of intensive sampling for E.coli at multiple locations along the beach shoreline and the two tributaries that enter the lake adjacent to the beach. Special testing was done on samples with high E.coli concentrations to help determine the sources of bacteria.
Results of this sampling effort revealed the highest levels of E.coli, along with the presence of human bacteria, near the confluence of East Brook. These findings narrowed the focus of the investigation to nearby storm and sanitary sewer systems. Illicit discharges to storm sewer systems and overflows from sanitary sewer systems may have contributed human bacteria to East Brook.
The following work to identify and eliminate sources of human bacteria in the waters of Lake George in and around the beach has been conducted or is underway.
• DEC video-inspected the condition of all sanitary and stormwater lines that service Lake George Beach State Park, Lake George Battleground, and Lake George Battlefield to ensure that all DEC-owned sewer lines and connections are intact.
• The Town of Lake George slip lined a portion of its sanitary sewer system along Beach Road and continues to video-inspect its sanitary sewer collection system and perform necessary maintenance or repairs.
• The Lake George Association, working with the Town of Lake George, investigated the storm sewer system serving the nearby residential area to identify illicit discharges. Additional investigations are planned to determine if there are any illicit discharges from seasonal use properties and, if found, eliminate them.
• DEC will continue the current level of beach cleaning and raking to remove debris and other sources of pathogens.
• DEC will continue to monitor the water quality of the beach. Additional sampling will also be conducted to determine if there is a correlation between wet weather and high bacteria levels and, if so, develop a wet weather beach advisory and/or closure protocol.
Additionally, in order to further reduce the overall load of E.coli, DEC will consider measures to limit the presence of waterfowl on the beach and near the swimming area. Such measures may include harassment tactics, public education to reduce feeding of waterfowl, installation of enclosed garbage cans, and waterfowl population reduction.
INTRODUCTION In August 2016, the New York State Department of Environmental Conservation (DEC) closed Lake George Beach, also known as Million Dollar Beach, and all waters in the area known as Dog Beach due to bacteria levels that exceeded New York State Department of Health (DOH) guidelines for bathing beach water quality. In response, DEC developed and implemented a sampling plan to track down potential sources of bacteria and take steps to prevent further contamination of the lake and beach.
DEC staff coordinated water quality studies that followed criteria in the U.S. Environmental Protection Agency (EPA) Great Lakes Beach Sanitary Survey User Manual (USEPA 2008) and New York State Sanitary Code. EPA’s Great Lakes Beach Sanitary Survey Tool and corresponding manual were developed for evaluation of any beach environment, including both marine and freshwater beaches. The results of routine monitoring, special water quality studies, GIS analysis, and on-site investigations were considered in the preparation of this report. DEC consulted DOH regarding sampling design and investigation of potential sources of bacterial contamination.
LAKE GEORGE BEACH | Preliminary Pollution Source Investigation (April 2017) 1

BACKGROUND Lake George Beach is a popular recreational destination in the Adirondack Park. It is located on the southern end of Lake George, a Class AA-Special water suitable for use as a drinking water supply, public bathing beach, general recreation, and aquatic-life support. The Class AA–special designation also means there are no discharges or disposal of sewage, industrial wastes, or other wastes into the lake, as written in Title 6 of the New York State Codes, Rules and Regulations (6 NYCRR 701.3). As a result of this designation, the lake is considered a highly valued water resource in New York (DEC 2009).
Two tributaries, East Brook and West Brook, enter the lake in close proximity to the beach. East Brook flows into the lake approximately 150 yards from the eastern edge of the swim area, while West Brook enters the lake approximately 300 yards from the western edge of the swim area (Figure 1). A portion of the Lake George shoreline located west of the swim area is operated as a “dog beach,” where dogs are allowed access to the water and sand. Swimming is not permitted at any time at the dog beach.
Figure 1. Map of Lake George Beach and surrounding area
LAKE GEORGE BEACH FACILITIES Beach and Swimming Area Lake George Beach is located along the southern end of the Lake George shoreline and is approximately 400 yards long. It is operated as part of Lake George State Park and maintained by DEC. Routine beach maintenance occurs on a continual basis during the swimming season. Debris and trash are manually removed daily by park staff, and a grooming machine is also used daily at the beach. Swimming is only permitted in the guarded swim area. Exact bather counts are not recorded, however, it is estimated that hundreds of patrons visit the beach on a daily basis in the summer.
LAKE GEORGE BEACH | Preliminary Pollution Source Investigation (April 2017) 2

Sanitary Facilities Sanitary facilities are located near the beach and are sufficient to meet demand. The park has a large bathhouse located directly behind the designated swim area. The location of the bathhouses satisfies Recommended Standards for Bathing Beaches criteria that toilets should be provided within 500 feet of a public beach (GLUMRBOSSE 1990). The bathhouse is connected to the municipal sewer system owned and operated by the Town of Lake George.
BACTERIOLOGICAL MONITORING Indicators and Agency Standards DEC establishes water quality standards and other criteria for many substances, including pathogens. Regulation 6 NYCRR Part 703.4 sets ambient water quality standards for bacteria, using coliform as the bacteriological indicator. Routine beach monitoring samples from Lake George Beach have historically been analyzed for total and fecal coliform for consistency with this regulation. DEC routinely collects water samples at Lake George Beach for fecal coliform analysis. Single sample results are compared to Subpart 6-2 of the New York State Sanitary Code to determine acceptable bathing beach water quality. There are three main types of bacteriological indicators used to detect the presence of bacterial contamination in bathing beach water; coliform (total and fecal), Escherichia coli (E.coli), and Enterococci. Subpart 6-2 sets single sample thresholds based on the density of these bacteriological indicators (Table 1) (DOH 2011).
Table 1. Single Sample Bacteriological Indicator Levels in Freshwater
Bacteriological Indicator Upper Value Density Threshold
(col./100mL)
Fecal Coliform 1,000
Enterococci 61
E. coli 235
EPA’s 2012 Recreational Water Quality Criteria (RWQC) (USEPA 2012) recommends E.coli as the preferred bacteriological indicator for freshwater bathing beaches. Studies by Dufour, Cabelli and others (USEPA 1986) have shown that E.coli is a more reliable indicator of public health risk at freshwater beaches. DOH is in the process of updating the New York State Sanitary Code to reflect EPA’s criteria.
Bacteriological Results for Lake George Beach Bacteriological samples are collected from the swim area at Lake George Beach throughout the beach season (typically every other week). Water quality results from routine sample collection are usually low. On August 17, 2016, a routine sample exceeded the single sample standard. A resample collected on August 19, 2016, indicated low levels of fecal coliform. A second exceedance occurred on August 22, 2016, and was well above the single sample threshold. Based on multiple exceedances and no obvious source(s) of bacteria causing the exceedances, the decision was made to close the beach. Increased monitoring for bacteria (testing for both fecal coliform and E.coli indicators) and an investigation to identify potential pollution sources were initiated in response to the beach closure. An exceedance of the single sample threshold for E.coli occurred on August 26, 2016, while the beach was still closed to the public. Observed rainfall data collected from the Floyd Bennett Memorial Airport in Glens Falls was used for comparison to bacteriological results (Table 2).
LAKE GEORGE BEACH | Preliminary Pollution Source Investigation (April 2017) 3

Table 2. Monitoring Data (2016) Sample
Collection Date Fecal Coliform (col./100mL)
E.coli (col./100mL)
24-hour Rainfall (in.)
6/1/2016 8 0.00
6/15/2016 6 0.00
7/8/2016 880 0.87
7/13/2016 21 0.00
7/20/2016 5 0.00
8/3/2016 22 0.00
8/17/2016 1,160* 0.20
8/19/2016 22 0.00
8/22/2016 4,180* 0.34
8/23/2016 42 0.00
8/25/2016 10 7.3 0.00
8/26/2016 350 298.7** 0.07
8/27/2016 10 ND*** 0.00
8/29/2016 2 23.1 0.00
8/31/2016 12 3 0.00
9/1/2016 83.9 0.00
*Sample result exceeds single sample threshold of 1,000 col./mL for fecal coliform **Sample result exceeds single sample threshold of 235 col./100mL for E.coli ***Non-detectable
Lake George Beach Closures DEC bathing beaches are closed whenever there is a threat to public health or safety. During a closure, no one is permitted in the water. Beaches may be closed because of bacteriological results or environmental factors (e.g. low water clarity), or other unusual circumstances (e.g. severe storms, chemical spills, illness outbreaks).
Lake George Beach was closed for the first time on August 23, 2016, due to high levels of fecal coliform. The beach was closed for six days and was reopened on August 29, 2016, following a satisfactory sample result collected on August 27, 2016. The beach was officially closed for the season on September, 5, 2016 (Labor Day).
POTENTIAL POLLUTION SOURCES Watershed Sources After a water quality issue at a beach has been identified, an initial assessment of land cover/land uses within the contributing watershed of the beach can inform and focus additional water quality studies and a potential pollution source investigation. Pollutant loading into surface waters within a beach watershed generally increases as a watershed becomes more developed and more impervious surfaces are created. Developed areas also generally have a higher density of residential, commercial, or industrial facilities and associated wastewater that must be
LAKE GEORGE BEACH | Preliminary Pollution Source Investigation (April 2017) 4

managed either by sanitary sewer lines or on-site treatment systems. Pollutant loading can occur from non-developed land cover/land uses as well. Agricultural activities can contribute pollution to surface waters from livestock, manure spreading, or herbicide/pesticide applications. Forest or wetland areas can provide habitat for wildlife that can contribute bacteria to surface waters. Facilities with a State Pollutant Discharge Elimination System (SPDES) permit within the beach watershed area can be mapped and investigated to identify any impacts to bathing beach water quality. Other facilities that may sporadically impact beach water quality include marinas and private docks, where illicit discharges from vessels with marine sanitation devices may occur.
To help prioritize the follow-up investigation, watershed boundaries of the two nearest tributaries to the beach, West Brook and East Brook, were delineated using USGS StreamStats online tool (USGS 2016). The 2011 National Land Cover Database (Homer et. al 2015) data layer was analyzed within the watershed boundaries to determine the percentage of land cover types within each watershed. Facilities with SPDES permits were also mapped for each watershed.
West Brook Watershed
The watershed of West Brook is predominately forested (Table 3). Developed land uses (open space, low intensity, medium intensity and high intensity) comprise less than 10% of the watershed total. Most development is concentrated near the lower part of West Brook (east of Route 9) near its confluence with Lake George (Figure 2). Agricultural land uses (pasture/hay and cultivated crops) and wetlands comprise less than 2% of the total land cover of this watershed. Two SPDES permitted wastewater facilities are in the watershed and have discharges to groundwater (Figure 3).
Table 3. West Brook Watershed Area and Land Cover Categories Land Cover Category Watershed Area (Acres) Percent of Total Watershed (%)
Evergreen Forest 2099.18 38.14
Deciduous Forest 1674.85 30.43
Mixed Forest 993.21 18.05
Developed, Open Space 301.79 5.48
Developed, Low Intensity 113.87 2.07
Shrub/Scrub 88.29 1.60
Developed, Medium Intensity 74.72 1.36
Cultivated Crops 42.70 0.78
Open Water 42.70 0.78
Woody Wetlands 36.92 0.67
Developed, High Intensity 27.13 0.49
Emergent Herbaceous Wetland 6.89 0.13
Barren Land (Rock, Sand, Clay) 4.45 0.08
Grasslands/Herbaceous 1.11 0.02
Pasture/Hay 0.00 0.00
TOTAL 5503.37 100.00%
LAKE GEORGE BEACH | Preliminary Pollution Source Investigation (April 2017) 5

Figure 2. West Brook watershed boundary and land cover
Figure 3. Facilities with SPDES permits in the West Brook watershed
LAKE GEORGE BEACH | Preliminary Pollution Source Investigation (April 2017) 6
East Brook Watershed
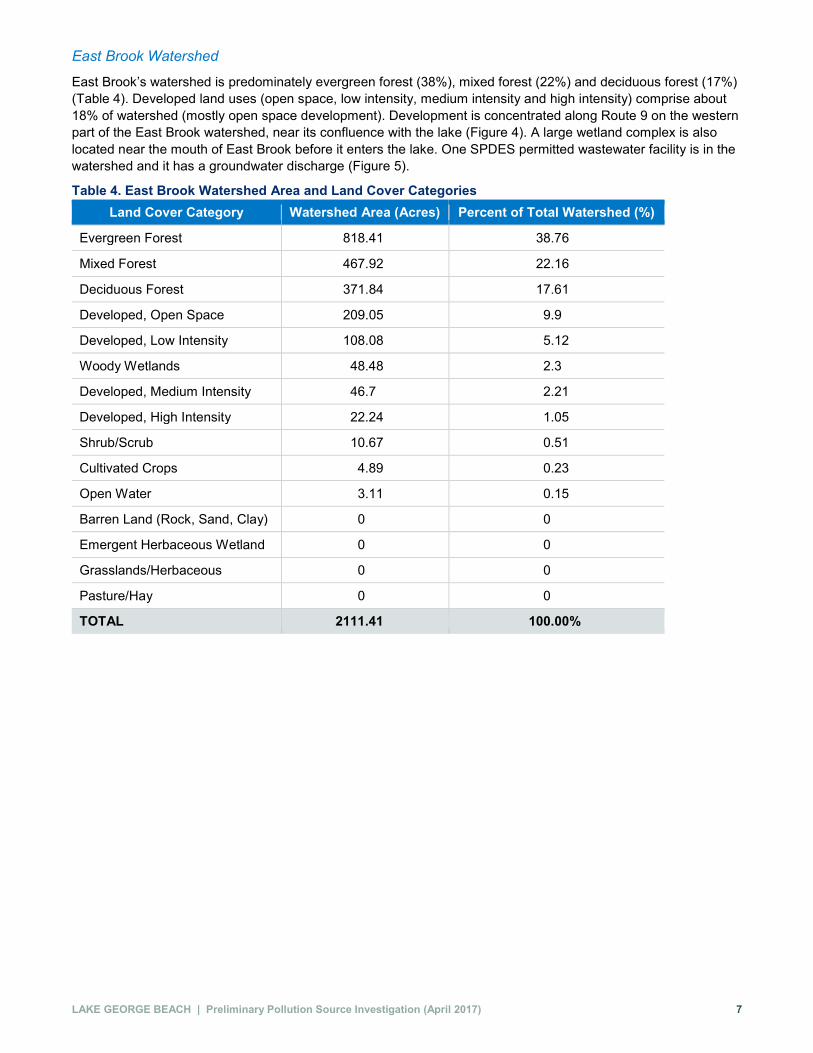
East Brook’s watershed is predominately evergreen forest (38%), mixed forest (22%) and deciduous forest (17%) (Table 4). Developed land uses (open space, low intensity, medium intensity and high intensity) comprise about 18% of watershed (mostly open space development). Development is concentrated along Route 9 on the western part of the East Brook watershed, near its confluence with the lake (Figure 4). A large wetland complex is also located near the mouth of East Brook before it enters the lake. One SPDES permitted wastewater facility is in the watershed and it has a groundwater discharge (Figure 5).
Table 4. East Brook Watershed Area and Land Cover Categories Land Cover Category Watershed Area (Acres) Percent of Total Watershed (%)
Evergreen Forest 818.41 38.76
Mixed Forest 467.92 22.16
Deciduous Forest 371.84 17.61
Developed, Open Space 209.05 9.9
Developed, Low Intensity 108.08 5.12
Woody Wetlands 48.48 2.3
Developed, Medium Intensity 46.7 2.21
Developed, High Intensity 22.24 1.05
Shrub/Scrub 10.67 0.51
Cultivated Crops 4.89 0.23
Open Water 3.11 0.15
Barren Land (Rock, Sand, Clay) 0 0
Emergent Herbaceous Wetland 0 0
Grasslands/Herbaceous 0 0
Pasture/Hay 0 0
TOTAL 2111.41 100.00%
LAKE GEORGE BEACH | Preliminary Pollution Source Investigation (April 2017) 7

Figure 4. East Brook watershed boundary and land cover
Figure 5. Facility with SPDES permit in the East Brook watershed
LAKE GEORGE BEACH | Preliminary Pollution Source Investigation (April 2017) 8

Nearshore Sources Localized conditions on the beach shoreline can provide the ideal environment for bacteria to survive and proliferate. Multiple studies have demonstrated that mats of filamentous green algae commonly found in beach environments can provide a niche for pathogenic bacteria and protect indicator bacteria from die-off (Olapade et al. 2006, Verhougstraete et al. 2010). Beach sand/sediments can also correlate to bacteria densities at some beaches. Some researchers have found that bacteria can thrive in beach sand, possibly contributing to the bacteria in beach water (Heaney et al. 2009). Bacteria left on nearshore beach sand from people, waterfowl or domestic animals can be washed into the water through storm runoff or wave action. Beach sand or sediment along the substrate of the swim area can also be disturbed by swimmers, redistributing bacteria into the water column.
The following sources were prioritized for follow-up investigation based on proximity to the beach and potential to create a persistent poor water quality at the beach.
Sanitary Sewage
Untreated sanitary sewage has the potential to discharge to the lake through leaking sanitary sewers, sanitary sewer overflows, illicit connections to storm sewers, and failed on-site septic systems discharging directly or indirectly to the lake and tributaries.
DEC issues wastewater permits for the following types of facilities:
• Individual wastewater permits for municipal discharges of domestic sewage, primarily from facilities not owned by a municipality, with or without the admixture of industrial wastewater that is collected and treated by a publicly owned treatment-works owned by a municipality
• Individual wastewater permits for private, commercial or institutional discharges of primarily domestic sewage without admixture of industrial waste; generally this refers to wastewater generated by a single facility or building complex under single ownership, and may or may not be publicly owned
• General wastewater permits to cover facilities that have a discharge to groundwater of 1,000 gallons per day (gpd) or more, and less than 10,000 gpd per outfall of treated sanitary sewage without the admixture of industrial wastes from on-site wastewater treatment systems serving private, commercial and institutional facilities. DOH has oversight and sets wastewater treatment standards for residential onsite systems less than 1,000 gallons in size (Appendix 75-A of New York Public Health Law).
Both the Village of Lake George and Town of Lake George1 own and operate a publicly owned sanitary sewer system that serves a portion of the West Brook and East Brook watersheds. Sanitary wastewater is collected and treated at the Village of Lake George Wastewater Treatment Plant prior to discharge to groundwater. In areas not served by the publicly owned sanitary sewer systems, on-site septic systems are utilized for treatment of sanitary wastewater.
Stormwater
Areas of high development with large areas of impervious surface can be a source of pollutants in stormwater discharges. As it flows across developed areas, stormwater runoff collects and transports pollutants and can rapidly discharge them to surface waters. Separate storm-sewer systems can also provide a conduit for illicit discharges of untreated sanitary waste. Stormwater management requires that stormwater be captured and infiltrated at a point away from streams and lakes. Infiltration of stormwater through the soils breaks down and suspends pollutants and nutrients. Impacts of stormwater runoff have been a concern with lake quality and several improvement projects have recently been completed to reduce the discharge of stormwater pollutants to the southern end of Lake George:
• A stormwater management complex of ponds and wetlands known as the West Brook Conservation Initiative was constructed to treat runoff from developed areas prior to discharge to West Brook. This project was developed from a partnership of the Lake George Association, Fund for Lake George, Lake George Land Conservancy, Village of Lake George, and Warren County.
1 Caldwell Sewer District is owned by the Town of Lake George
LAKE GEORGE BEACH | Preliminary Pollution Source Investigation (April 2017) 9

• Beach Road from Canada Street to Fort George Road was reconstructed by Warren County to include permeable pavement to infiltrate stormwater runoff (2011).
• A section of Beach Road on State lands and the Lake George Beach parking lot were reconstructed by DEC with porous asphalt and other storm water management features were added to protect water quality (2013).
• DEC incorporated stormwater management features into the reconstruction of the DEC parking lot and installation of a new boat launch (2014).
• Improvements were made by Warren County to stormwater management from Beach Road on the eastern side of East Brook, including hydrodynamic separators discharging directly to the Lake.
Prior to the new porous pavement system on Beach Road, its stormwater system featured rapid collection and straight piping of stormwater into Lake George. Stormwater is still conveyed in this manner in other parts of the West Brook and East Brook watershed. The Town of Lake George and Village of Lake George were designated as requiring coverage under the SPDES General Permit for Stormwater from Municipal Separate Storm Sewer Systems (MS4s) in 2013. They are in the process of developing stormwater management programs to mitigate the impacts associated with stormwater runoff, including mapping of stormwater outfalls and establishment of programs to detect and eliminate illicit discharges.
Waterfowl/Domestic Animals
In addition to human sources of bacteria, waterfowl, wildlife, and domestic animals (dogs) can contribute bacteria to surface water through their feces. Waterfowl and dogs feces, left either on the shoreline of the beach or in areas adjacent to the beach, can be carried by stormwater runoff to the swim area. DEC Region 5 staff have observed a frequent presence of waterfowl on the beach, in the parking lot that serves the park, and in a wetland area adjacent to the parking lot.
Traditional bacteriological analysis of beach water samples cannot determine if bacteria in the sample originated from human or non-human sources; specialized Microbial Source Tracking (MST) analysis can help to determine if bacteria originated from human sources or non-human sources (gulls, geese, ruminants, dogs).
SUMMARY OF WATER QUALITY FINDINGS DEC conducted several preliminary water quality studies in August/September of 2016 in order to focus follow-up field investigations of watershed and nearshore pollution sources. Studies included daily sampling at multiple locations along the Lake George shoreline, a single tributary sampling event of East Brook and West Brook, and collection of water samples for MST analysis. Additional data and information on preliminary water quality studies can be found in Appendix A.
Based on EPA epidemiological studies and criteria, and in consultation with DOH staff, samples collected during preliminary water quality studies were analyzed for E.coli and compared to the New York State Sanitary Code single sample standard for E.coli (235 col./100mL).
Shoreline Sampling Daily sampling along the shoreline indicated low levels of bacteria at four sites during dry weather conditions. Elevated E.coli concentrations were observed at all shoreline sample locations following a small amount of rainfall (0.07 in.), with three sample locations exceeding the single sample threshold for E.coli. With the exception of Sample Site #4 (Confluence of East Brook), E.coli levels returned to below the single sample threshold the day following the rainfall event. Sample Site #4 is located approximately 200 yards east of the beach area. Sample Site #4 consistently exceeded the single sample threshold for E.coli under both dry and wet weather conditions. During a single sampling event conducted under dry weather conditions, samples collected from each shoreline sample location at various wading depths (knee deep, waist deep, chest deep) contained low levels of E.coli. E.coli levels were very high in shallow water at Sample Site #4, though E.coli levels dropped in deeper water.
Based on the high level of maintenance performed on both the main beach and dog beach, as well as the results of the shoreline sampling, it is not believed that nearshore sources (algae, natural debris, waterfowl feces or dog feces) are a major contributing factor to the exceedances of bacteria in the swim area.
LAKE GEORGE BEACH | Preliminary Pollution Source Investigation (April 2017) 10

Tributary Sampling A single sampling event was conducted of East Brook and West Brook in early September 2016 under dry weather conditions.
West Brook: Samples collected from five locations in the stretch of stream located between I-87 and US Route 9 contained levels of E.coli well below the single sample standard for E.coli. Water clarity was excellent in the stream and there were no physical indicators (odor, color, wildlife) of bacterial sources observed at any of the sample locations.
East Brook: Samples collected at four out of five locations in the stretch of stream north of State Route 9L contained levels well below the single sample standard for E.coli. Water clarity was excellent at these four locations, and no obvious sources of bacteria were noted. Water clarity at sample site location located just upstream of shoreline Sample Site #4, was observed to be very turbid with opaque water clarity. Samples collected from this site contained high levels of E.coli. A suspected stormwater outfall pipe was observed near this location. East Brook also flows through a wetland area near the parking lot for Lake George Beach. Feathers and droppings from waterfowl were observed in the wetland during sampling, though water samples collected from the wetland area did not contain high levels of bacteria.
Microbial Source Tracking (MST) Analysis Using MST analysis, the presence of Bacteriodes associated with humans were detected in water samples collected at four shoreline sample sites and one tributary site. No Bacteriodes associated with non-human sources were detected in any of the water samples collected on multiple sample days. MST analysis only confirms the presence/absence of specific Bacteriodes markers associated with humans or non-human sources (dogs, ruminants, gulls or geese) but does not quantify the concentration of bacteria from each source.
SUMMARY OF PRELIMINARY POLLUTION SOURCE INVESTIGATION Based on preliminary water quality studies, it was confirmed that Lake George Beach generally has good water quality, but is vulnerable to bacteria loading during small wet weather events. Nearshore sources of pollution (algae, natural debris, beach sand/sediment, waterfowl/dog feces) did not appear to be a major contributing factor on days with poor water quality.
Wind and drift directions can push bacteria-laden water from tributaries towards the swim area, especially during storms. Elevated E.coli levels following a small rain event in samples collected at the confluence of West Brook and East Brook with Lake George indicate impacts from stormwater runoff.
High bacteria loading during dry weather conditions and the confirmed presence of bacteria associated with humans at the confluence of East Brook and Lake George has narrowed the primary focus of the investigation to storm sewer systems discharging to the East Brook and nearby sanitary systems. No other major pollution sources were identified in the West Brook or East Brook watersheds during the preliminary investigation in 2016.
Follow-up investigations of the storm sewer outfall adjacent to the Beach Road Bridge that passes over the mouth of East Brook were conducted in October and February 2016 to rule out illicit discharges. During the September sampling of East Brook, the water in this area appeared to be extremely turbid and opaque in color as compared to other locations on East Brook, where water was observed to be clear. Samples taken upstream of this outfall during the September sampling, in both the adjacent wetland area and the main stem of East Brook, indicated low levels of bacteria. Although follow-up investigations by DEC conducted under dry weather conditions did identify dry weather flows, no physical indicators of illicit discharge at the time of the follow-up inspections were found. On February 22, 2017, the Lake George Association, working in partnership with the Town and Village of Lake George, collected samples for fecal coliform at the 24” pipe and within the contributing drainage system of that pipe. The results of testing showed fecal coliform levels below the single sample threshold value at both the 24” outfall (115 col. /100 ml) and within the tributary (1 col./100 ml).
Sanitary sewer overflows or illicit discharges to the storm sewer system have the potential to discharge to surface water and require further evaluation and monitoring. An overflow discharge from the Caldwell Sewer System that
LAKE GEORGE BEACH | Preliminary Pollution Source Investigation (April 2017) 11

occurred in August 2016 did not appear to reach East Brook, nor impact the beach. A second overflow that occurred from the same system in December 2016 did discharge to East Brook. A Notice of Violation issued by DEC to the Town of Lake George in response to the second overflow required additional investigative and maintenance work on the sanitary sewer system. On February 28, 2017, the Lake George Association, working with the Town of Lake George, conducted dye tests of the sanitary sewer system to determine if any cross connections with the storm sewer system existed. This testing did not identify any cross connections or leakage from the sanitary sewer into the storm sewer system.
In early 2017, DEC video-inspected all DEC owned storm and sanitary sewers that service Lake George Beach State Park, Lake George Battleground, and Lake George Battlefield. All lines and connections were found to be in good condition with no evidence of exfiltration of sanitary sewage.
FUTURE ACTIONS Water Quality Studies Modified Routine Monitoring: Routine monitoring for E.coli can help inform beach closure decisions and provide an adequate baseline for additional studies. All bacteriological samples will continue to be analyzed by an ELAP Certified Laboratory. Sampling protocols will follow DEC and EPA standard operating procedures, including methods developed for bacteriological sample collection, observation of meteorological characteristics (i.e., rainfall, wind direction) and observation of other environmental factors (i.e., bird counts, shoreline debris) at the time of sampling. Sample results will continue to be compared to the single sample thresholds in the NYS Sanitary Code.
Additional Wet Weather Studies: Samples collected from the main stems of East Brook and West Brook did not indicate high levels of bacteria, however, these samples were collected during dry weather. Sampling data of the shoreline indicated that water quality is influenced by wet weather events. Additional studies will be conducted to rule out any other potential pollution sources, especially sources that could impact the beach during wet weather conditions. Sampling of tributary sites, along with sampling the swim area following rainfall, can help to determine if exceedances are wet weather driven. Additional data can also be used to develop a wet weather closure protocol for the beach, if a correlation between rainfall and exceedances can be established.
Pollution Source Investigation Additional Investigation of Stormwater System: Additional follow-up investigation of the stormwater system adjacent to East Brook will be conducted. The stormwater conveyance system serving the residential area surrounding Cedar Lane will be further delineated and investigated for potential illicit discharges.
Additional Investigation of the Caldwell Sewer System: The Town of Lake George will perform an evaluation of the sanitary sewer collection system (including camera investigation, inspection of each manhole, system condition) and perform any maintenance or repairs identified.
Inspection of DEC Sanitary and Stormwater System: DEC video-inspected all DEC-owned sanitary lines that service Lake George Beach State Park, Lake George Battleground, and Lake George Battlefield, and will evaluate the results to assure that all lines and connections are in good condition.
MS4 Program Implementation: The Village and Town of Lake George were designated as requiring coverage under the SPDES General Permit for Stormwater Discharges from Municipal Separate Storm Sewer Systems (MS4 General Permit) in 2013. Coverage under the MS4 General Permit requires the development of a stormwater management program to reduce the amount of pollutants carried by stormwater to waterbodies to the “maximum extent practicable”. The goal of the program is to improve water quality and protect recreational use of waterbodies. Once mapping of outfall locations is completed for the MS4 area, information related to outfalls can be used to identify additional pollution sources that may impact the beach and will help to prioritize remediation actions.
Beach Maintenance and Operations Bird Feces: Waterfowl can be a localized source of bacteria. The wetland complex located in the East Brook watershed provides quality habitat for waterfowl and contributes to their constant presence in the vicinity of the beach. Actions to limit the presence of waterfowl on the beach and near the swim area including harassment
LAKE GEORGE BEACH | Preliminary Pollution Source Investigation (April 2017) 12

tactics, public education to reduce feeding of waterfowl, and installation of enclosed garbage cans to deter birds. Bird population reduction will be considered by DEC Operations staff as appropriate.
Beach Cleaning: The current level of beach cleaning and raking will be continued. Since bird and dog feces, algae, natural debris, and garbage have been identified as contributors to poor water quality, cleaning of feces and removal of garbage/natural debris along nearshore areas prior to raking will be a priority. Though current data does not suggest that Dog Beach is a major source of bacteria at Lake George Beach, Dog Beach will also be groomed frequently to remove dog feces and prevent additional bacterial loading to Lake George.
Sand Replenishment: It was observed that the sand at Lake George Beach is of good quality and does not appear to be contributing to any water quality issues at this time. In the future, sand used to replenish the beach will be thoroughly washed and of a grain size sufficient to provide a quality swimming experience and minimize turbidity caused by swimmers. In addition, the source of the sand will be as similar as possible to naturally occurring sand in the area.
REFERENCES Great Lakes-Upper Mississippi River Board of State Sanitary Engineers (GLUMRBOSSE). 1990. Recommended
Standards for Bathing Beaches. Health Education Service, Albany, NY.
Heaney, C. D., Wade, T. J., Sams, E. A., Calderon, R.L., Beach, M., and Dufour, A.P. 2009. Contact with beach sand among beach-goers and risk of illness. American Journal of Epidemiology. Johns Hopkins Bloomberg School of Public Health, 170(2):164-172.
Homer, C.G., Dewitz, J.A., Yang, L., Jin, S., Danielson, P., Xian, G., Coulston, J., Herold, N.D., Wickham, J.D., and Megown, K., 2015. Completion of the 2011 National Land Cover Database for the conterminous United States-Representing a decade of land cover change information. Photogrammetric Engineering and Remote Sensing. 81(5): 345-354.
New York State Department of Environmental Conservation (DEC). 2009. Waterbody Inventory/Priority Water Body List for Lake George (1006-0016). Bureau of Watershed Assessment and Research, Division of Water.
New York State Department of Health (DOH). 2011. State Sanitary Code, Subpart 6-2: Bathing Beaches. Bureau of Community Environmental Health and Food Protection.
Olapade, O.A., Depas, M.M., Jensen, E.T. and McLellan, S.L. 2006. Microbial Communities and Fecal Indicator Bacteria Associated with Cladophora Mats on Beach Sites along Lake Michigan Shores. Applied and Environmental Microbiology. 72(3):1932-1938.
US Environmental Protection Agency (US EPA). 1986. Bacteriological Ambient Water Quality Criteria for Marine and Fresh Recreational Waters. Office of Research and Development, Microbiology and Toxicology Div., Cincinnati, OH and Office of Water Regulation and Standards, Criteria and Standards Div., Washington, D.C.
US Environmental Protection Agency (US EPA). 2008. Great Lakes Beach Sanitary Survey User Manual. Office of Science and Technology.
US Environmental Protection Agency (US EPA). 2012. Recreational Water Quality Criteria. Health and Criteria Division, Office of Science and Technology and Office of Water. https://www.epa.gov/wqc/2012-recreational-water-quality-criteria-documents. Retrieved October 3, 2016.
US Geological Survey (USGS). 2016. New York StreamStats Program. http://water.usgs.gov/osw/streamstats/new_york.html. Accessed October 3rd, 2016.
Verhougstraete, M.P., Bayappanahalli, M.N., Rose, J.B., Whitman, R.L. 2010. Cladophora in the Great Lakes: impacts on beach water quality and human health. Water Science & Technology. 62(1):68-76.
LAKE GEORGE BEACH | Preliminary Pollution Source Investigation (April 2017) 13
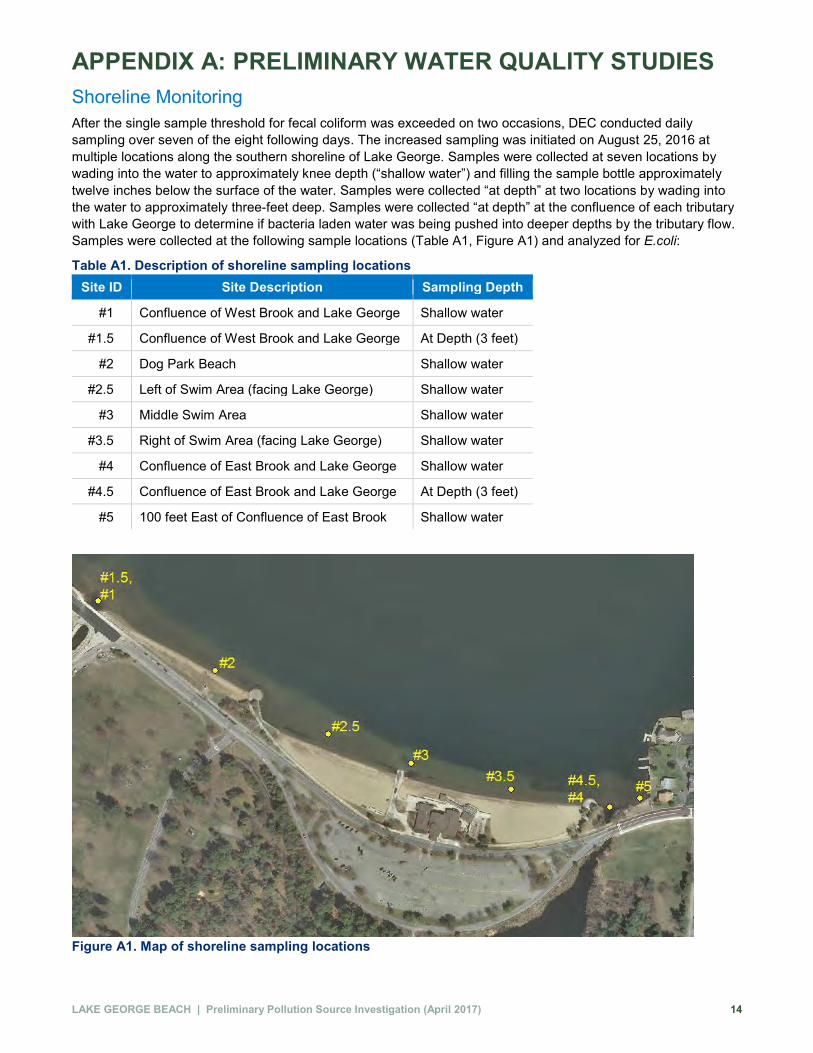
APPENDIX A: PRELIMINARY WATER QUALITY STUDIES Shoreline Monitoring After the single sample threshold for fecal coliform was exceeded on two occasions, DEC conducted daily sampling over seven of the eight following days. The increased sampling was initiated on August 25, 2016 at multiple locations along the southern shoreline of Lake George. Samples were collected at seven locations by wading into the water to approximately knee depth (“shallow water”) and filling the sample bottle approximately twelve inches below the surface of the water. Samples were collected “at depth” at two locations by wading into the water to approximately three-feet deep. Samples were collected “at depth” at the confluence of each tributary with Lake George to determine if bacteria laden water was being pushed into deeper depths by the tributary flow. Samples were collected at the following sample locations (Table A1, Figure A1) and analyzed for E.coli:
Table A1. Description of shoreline sampling locations Site ID Site Description Sampling Depth
#1 Confluence of West Brook and Lake George Shallow water
#1.5 Confluence of West Brook and Lake George At Depth (3 feet)
#2 Dog Park Beach Shallow water
#2.5 Left of Swim Area (facing Lake George) Shallow water
#3 Middle Swim Area Shallow water
#3.5 Right of Swim Area (facing Lake George) Shallow water
#4 Confluence of East Brook and Lake George Shallow water
#4.5 Confluence of East Brook and Lake George At Depth (3 feet)
#5 100 feet East of Confluence of East Brook Shallow water
Figure A1. Map of shoreline sampling locations
LAKE GEORGE BEACH | Preliminary Pollution Source Investigation (April 2017) 14

Results from the increased shoreline sampling are shown below (Table A2). Results in red exceeded the single sample threshold for E.coli (235 col./100mL).
Table A2. E.coli results from increased shoreline sampling
Date West Brook Confluence
Dog Park
Beach Left
Beach Middle Beach
Right Beach
East Brook Confluence
East of East
Brook Rainfall
(in.)
SITE ID 1 1.5 2 2.5 3 3.5 4 4.5 5
08/25/2016 140.1 30.9
7.3
613.1
0.0
08/26/2016 613.1 248.9 164.8 298.7 10.9 1,732.9 153.9 0.07
08/27/2016
ND* 10 ND* ND* 380
32 0.0
08/29/2016 60.2 1.0 < 1 3.1 23.1 5.2 517.2 155.2 36.9 0.0
08/30/2016 63.7 3.0 6.3 < 1 3.0 <1 613.1 2.0 86.0 0.0
08/31/2016 78 ND* 4 12 2 10 420 5 30 0.0
09/01/2016 75.9 6.3 17.3 107.6 83.9 4.1 290.9 6.3 111.2 0.0 *non-detectable
Consistently high levels of E.coli were detected in samples taken from Sample Site #4, in shallow water at the confluence of East Brook. Every sample taken from this site exceeded the single sample threshold for E.coli. Samples taken from Sample Sites #1, #2 and #3 exceeded the single sample threshold following a small amount of rainfall. E.coli levels returned to well below the standard the following day.
Water Depth Analysis On September, 06, 2016, bacteriological samples were collected at three distant points from the shoreline at each sample location: (1) shallow water (approximately knee deep); (2) middle water (approximately waist deep); and (3) deep water (approximately chest deep). Multiple distance points from the shoreline were sampled to determine if high bacteria levels were limited to the nearshore area of the beach. Results from samples taken at each depth are shown below (Table A3). Results in red exceeded the single sample threshold for E.coli (235 col./100mL).
Table A3. E.coli levels at various water depths
Sampling Depth
Site ID
1 2 2.5 3 3.5 4 5
Shallow 39.9 26.9 21.3 23.1 22.8 1,299.7 10.9
Middle 1.0 (Site 1.5) 2.0 6.3 5.2 2.0 R*- 1.0
4.1 (Site 4.5)
13.4
Deep < 1 2.0 2.0 4.1 3.1 1.0 5.2 *replicate sample
Overall, bacteria levels were well below the 235 col./100 mL standard for E.coli at multiple depths. Only one sample collected in shallow water exceeded the standard, at Sample Site #4. The bacteria level decreased significantly in samples taken from waist deep (4.1 col./100mL) and chest deep water (1.0 col./100mL) at that location.
LAKE GEORGE BEACH | Preliminary Pollution Source Investigation (April 2017) 15

Tributary Monitoring On September, 06, 2016, bacteriological samples were collected from two streams within the watershed of the beach, West Brook and East Brook. Water quality parameters (water temperature, specific conductance, pH, dissolved oxygen, and turbidity) were also measured, and visual observations (water clarity, water color, odor, wildlife presence, algae presence) were recorded at each sample location. Sites were selected based on proximity to potential pollution sources, land cover and mapped sewer lines. Sampling was conducted under dry weather conditions.
West Brook. Samples were collected from five sample sites (Figure A2, Figure A3). Water quality parameters, visual observations, and E.coli results are listed in Table A4. All samples showed levels of E.coli well below the single sample standard. Water clarity was excellent at all sites and no physical indicators (odor, color, wildlife) of bacterial sources were observed.
Figure A2. West Brook sampling site locations
Swim Area
LAKE GEORGE BEACH | Preliminary Pollution Source Investigation (April 2017) 16

Sample Site WB-A, facing Sample Site WB-B, facing Sample Site WB-C, facing upstream
Sample Site WB-D, facing Sample Site WB-E, facing
Figure A3. Photographs of West Brook sample sites
LAKE GEORGE BEACH | Preliminary Pollution Source Investigation (April 2017) 17

Table A4. Water quality parameters, visual observations, and E.coli results for West Brook sample sites
Sample Site
Location
E.coli Sample
Time
E.coli Sample Result (col./
100mL)
Hydrolab Water Conditions
Latitude Longitude
GPS Accuracy
(feet)
Water Temp.
(°C) Conductivity
(µs/cm) pH D.O. Depth (cm)
Water Clarity (desc.)
Water Color
Odor (Y/N?)
Debris Present?
(Y/N)
Wildlife Present?
(Y/N) (Types/#)
Algae Present?
(Y/N)
WB-A 43.41753 -73.71262 14 9:23 26.2 R* - 24.9 11.2 447 7.4 10.0 50.0 Clear None N N N
Y - Green filament-
ous
WB-B 43.4166 -73.71439 47 9:10 19.9 11.0 426 7.4 10.0 30.0 Clear None N N N Y - Green filament-
ous
WB-C 43.41619 -73.71671 20 8:53 12.2 10.4 272 7.5 10.7 30.0 Clear None N N N Y - Green filament-
ous
WB-D 43.41635 -73.71714 27 8:40 9.6 10.4 262 7.6 10.8 50.0 Clear None N N N Y - brown filament-
ous
WB-E 42.92859 -73.80272 43 8:20 9.8 10.0 215 7.5 11.0 50.0 Clear None N N N N
*replicate sample
LAKE GEORGE BEACH | Preliminary Pollution Source Investigation (April 2017) 18

East Brook. Samples were collected from six sample sites (Figure A4, Figure A5). Water quality parameters, visual observations, and E.coli results are listed in Table A5. Sample Site EB-A contained very high levels of E.coli, and the water was observed as opaque. A corrugated metal pipe was observed in close proximity to the sample location. Sample Site EB-B and EB-C showed elevated levels approaching or slightly above the single sample standard, but no other physical indicators of bacterial sources were observed.
Figure A4. East Brook sampling sites locations
Swim Area
LAKE GEORGE BEACH | Preliminary Pollution Source Investigation (April 2017) 19

Sample Site EB-A, facing Beach Road Sample Site EB-B, facing north Sample Site EB-C, facing south
Sample Site EB-D, facing upstream Sample Site EB-E, facing south Sample Site EB-F, facing
Figure A5. Photographs of East Brook sample sites
LAKE GEORGE BEACH | Preliminary Pollution Source Investigation (April 2017) 20

Table A5. Water quality parameters, visual observations, and E.coli results for East Brook sample sites
Sample Site
Location
E.coli Sample
Time
E.coli Sample Result (col./
100mL)
Hydrolab Water Conditions
Latitude Longitude
GPS Accuracy
(feet)
Water Temp.
(°C) Conductivity
(µs/cm) pH D.O. Depth (cm)
Water Clarity (desc.)
Water Color
Odor (Y/N?)
Debris Present?
(Y/N)
Wildlife Present?
(Y/N) (Types/#)
Algae Present?
(Y/N)
EB-A 43.41719 -73.70090 12 11:30 1299.7 R* - 980.4 16.3 532 7.3 7.4 80.0 Opaque Brown N N N
Y - floating green/ brown mats
EB-B 43.41574 -73.70238 9 11:19 248.1 18.5 535 7.6 10.1 40.0 Clear None N N
Y- 5-10 Ducks, 1 blue heron
N
EB-C 43.41501 -73.70278 8 11:11 201.4 17.7 528 7.7 10.7 40.0 Clear None N N N N
EB-D 43.41380 -73.70170 29 10:20 43.5 12.7 523 7.8 10.5 30.0 Clear None N N N Y -
filament-ous
EB-E 43.41343 -73.70065 26 10:07 24.3 12.5 523 7.7 10.5 30.0 Clear None N N N Y - brown filament-
ous
EB-F 43.41310 -73.70029 28 9:51 36.9 12.4 522 7.7 10.6 50.0 Clear None N N N Y -
filament-ous
*replicate sample
LAKE GEORGE BEACH | Preliminary Pollution Source Investigation (April 2017) 21

Microbial Source Tracking (MST) In order to help determine the source of indicator bacteria at the beach, water samples were collected for MST analysis by the DOH Wadsworth Laboratory. MST is a set of techniques used to determine whether fecal bacteria is being introduced into surface water through human, wildlife or domestic animal sources. PCR and qPCR analysis are used to differentiate between bacteria associated with different human/animal hosts. Unlike traditional bacteriological analysis methods, MST does not quantify the amount of bacteria in a sample. Water samples must be tested for E.coli prior to MST analysis to determine if there is enough bacteria present in a sample to run the PCR and qPCR analysis. Samples were analyzed using the MST primers listed in Table A6.
Table A6. MST Primers and References Assay Target Reference
PCR
GenBac (32F/Bac708R) General Bacteriodales Bernhard and Field 2000a
HF183 (HF183/Bac708R) Human Bernhard and Field 2000a
Hum163 (Hum163F/Hum163R)
Human Shanks et al. 2007
Dog (BP1093F/BP1095R) Dog unpublished
Ruminant (CF128/Bac708R) Ruminant Bernhard and Field 2000b
Goose (GFDF/R) Geese Green et al. 2012
Gull (Gull2F/2R) Gull Lu et al. 2008
qPCR
HF183 (HF183/BacR287) Human Green et al. 2014
Hum2 (HumM2F/HumM2R) Human Shanks et al. 2009
Hum3 (HumM3F/HumM3R) Human Shanks et al. 2009
One liter water samples were collected following a small amount of rainfall on August 25, 2016, and August 26, 2016, from multiple shoreline locations. Additional samples were collected from three locations on both East Brook and West Brook on September 6, 2016. PCR and qPCR analysis were not completed for samples that contained low levels of E.coli (less than 100 E.coli/100ml). Bacteriodes associated with humans were detected in water samples collected on all three sampling days (Table A7). In each case, multiple primer sets or primer/probe sets were used. Other assays used to detect bacteria originating from non-human sources: Dog (BP1093F/BP1095R), Ruminant (CF128/Bac708R), Gull (Gull2F/R) and Goose (GFDF/R), were negative in all analyzed samples.
Table A7. Microbial Source Tracking (MST) Analysis Results Sample
Date Sample ID E. coli
(col./100 mL) Positive Markers (PCR) Positive Markers (qPCR) Final Source
Determination
8/25/2016
Site #1 140.1 General Bacteria, Hum 163 HumM3, HF183 Human
Site #2 30.9 No analysis completed
Site #3 7.3 No analysis completed
Site #4 613.1 General Bacteria, Hum163 HumM2, HumM3, HF183 Human
Field Blank N/A None None None
8/26/2016
Site #1 613.1 General Bacteria, HF183, Hum163
HumM3, HF183 Human*
LAKE GEORGE BEACH | Preliminary Pollution Source Investigation (April 2017) 22

Sample Date Sample ID
E. coli (col./100 mL) Positive Markers (PCR) Positive Markers (qPCR)
Final Source Determination
Site #2 248.9 General Bacteria, Hum163 HumM3, HumM2 Human
Site #2.5 164.8 None None Unknown
Site #3 298.7 General Bacteria, HF183, Hum163
HumM2 Human
Site #3.5 10.9 No analysis completed
Site #4 1,072.5 General Bacteria, Hum163 HumM2, HumM3, HF183 Human*
Site #5 153.9 None None Unknown
Field Blank N/A None None None
9/6/2016 WB-A 26.2 No analysis completed
WB-C 12.2 No analysis completed
WB-D 9.6 No analysis completed
EB-A 1299.7 General Bacteria, Hum163 HumM3, HF183 Human*
EB-D 43.5 No analysis completed
EB-E 24.3 No analysis completed
Field Blank N/A None None None
* Endpoint PCR was also conducted using the qPCR-based HF183/BacR287 primer pair.
Appendix A: References Bernhard, A.E. and Field, K.G., 2000a. Identification of nonpoint sources of fecal pollution in coastal waters by
using host-specific 16S ribosomal DNA genetic markers from fecal anaerobes. Applied and environmental microbiology, 66(4), pp.1587-1594.
Bernhard, A.E. and Field, K.G., 2000. A PCR assay to discriminate human and ruminant feces on the basis of
host differences in Bacteroides-Prevotella genes encoding 16S rRNA. Applied and environmental microbiology, 66(10), pp.4571-4574.
Green, H. C., Dick, L. K., Gilpin, B., Samadpour, M., & Field, K. G. 2012. Genetic markers for rapid PCR-based
identification of gull, Canada goose, duck, and chicken fecal contamination in water. Applied and environmental microbiology, 78(2), 503-510.
Green, H.C., Haugland, R.A., Varma, M., Millen, H.T., Borchardt, M.A., Field, K.G., Walters, W.A., Knight, R.,
Sivaganesan, M., Kelty, C.A. and Shanks, O.C., 2014. Improved HF183 quantitative real-time PCR assay for characterization of human fecal pollution in ambient surface water samples. Applied and environmental microbiology, 80(10), pp.3086-3094.
Lu, J., Santo Domingo, J. W., Lamendella, R., Edge, T., & Hill, S. (2008). Phylogenetic diversity and molecular
detection of bacteria in gull feces. Applied and environmental microbiology, 74(13), 3969-3976. Shanks, O.C., Santo Domingo, J.W., Lu, J., Kelty, C.A. and Graham, J.E., 2007. Identification of bacterial DNA
markers for the detection of human fecal pollution in water. Applied and environmental microbiology, 73(8), pp.2416-2422.
Shanks, O. C., Kelty, C. A., Sivaganesan, M., Varma, M., & Haugland, R. A. (2009). Quantitative PCR for genetic
markers of human fecal pollution. Applied and environmental microbiology, 75(17), 5507-5513.
LAKE GEORGE BEACH | Preliminary Pollution Source Investigation (April 2017) 23

APPENDIX B: PRELIMINARY POLLUTION SOURCE INVESTIGATION High bacteria loading during dry weather conditions and the confirmed presence of bacteria associated with humans in nearby tributaries narrowed the focus of the follow up pollution source investigation to nearby sanitary systems and storm sewer systems within the watershed of the beach. Nearshore sources of pollution did not appear to be a major contributing factor on days with poor water quality.
Sanitary Sewage Residential, commercial, or industrial facilities and associated wastewater must be managed either by sanitary sewer lines or on-site treatment systems. Portions of the West Brook and East Brook watersheds are served by publicly owned sewer systems owned either by the Town of Lake George (Caldwell Sewer District) (Figure B1, Figure B2) or the Village of Lake George. The publicly owned sewer systems convey untreated sanitary sewage to the Village of Lake George Waste Water Treatment Plant, located on Prospect Mountain Highway within the watershed of West Brook.
Concerns have been raised in the past regarding the Lake George Waste Water Treatment Plant and potential seepage areas in the West Brook watershed. The Lake George Waste Water Treatment Plant has several large lagoons that infiltrate treated wastewater before discharging to groundwater. Bacteriological samples collected during the tributary sampling event on September 6, 2016, downstream of the wastewater treatment plant did not indicate high levels of bacteria. There were no observations of any seepages during the tributary sampling.
Two sewage overflow incidents from the Caldwell Sewer System occurred in 2016. On August 25, 2016, DEC received a report from a private citizen describing a detectable sewage smell and visual evidence of an overflow from a town sewage manhole on Route 9L near the Lake George Elementary School, located in the East Brook watershed. DEC responded to the report and discovered a manhole discharging sewage into a roadside ditch. DEC determined that the overflow originated from the Town of Lake George’s POSS area at Manhole #109 (Figure B3), which is located approximately 0.5 mile from the beach. Per an agreement between the Town and Village of Lake George, the Village of Lake George investigated, jetted the sewer to restore services, cleaned the area and disinfected the area with lime.
Recently adopted regulations under the Sewage Pollution Right to Know Act (6 NYCRR Parts 750 and 621) require owners and operators of publicly owned treatment works and publicly owned sanitary sewer systems to report untreated and partially treated sewage discharges to DEC and health authorities immediately, but in no case more than two hours from discovery of the discharge. The Town of Lake George filed the appropriate notification with DEC and DOH, however, the notification occurred several hours after the required notification period under the Sewage Pollution Right to Know regulation. Operators must properly notify DEC and DOH within two hours of discovery of a discharge. DEC issued a Notice of Violation (NOV) to the Town of Lake George Caldwell Sewer District for discharging waste from an unpermitted discharge point and failure to timely report a discharge. Though the duration and quantity of the overflow was unknown; the flow appeared to be confined to the roadside ditch along Route 9L with no evidence that the overflow reached East Brook. Bacteriological samples collected on September 6, 2016, from East Brook downstream of the observed overflow site (EB-E, EB-D) did not indicate high levels of bacteria.
According to the Town of Lake George, the sanitary sewer from Manhole #90, located on Route 9L, to Manhole #83, located in the Million Dollar Beach parking lot, was slip-lined in September 2016. On October 25, 2016, DEC staff inspected manholes #83 and #84 to confirm the integrity of the manholes and the condition of the manhole connections following the recent slip-lining project. Both manholes were observed and no issues were identified. The annular space between the new lines and the host pipe had grout present to seal it.
On December 29, 2016, DEC received a report of another overflow of the sanitary sewer on Route 9L. A follow-up inspection found sanitary sewage discharging from an unmarked manhole (MH #90A) and running into a stormwater drainage ditch into East Brook, as noted on Figure B4. In response, DEC issued a second NOV to the Town of Lake George Caldwell Sewer District requiring additional investigative and maintenance work for the sanitary sewer system. In response to the NOV, the town has retained an engineer and committed to a schedule for further investigative work on the condition of the sanitary sewer system, as depicted in Figure B5.
LAKE GEORGE BEACH | Preliminary Pollution Source Investigation (April 2017) 24

Figure B1. Map of Caldwell Sewer District lines near West Brook
Figure B2. Map of Caldwell Sewer District lines near East Brook
West Brook
East Brook
LAKE GEORGE BEACH | Preliminary Pollution Source Investigation (April 2017) 25

Figure B3. Map of Caldwell Collection System and August 25, 2016 overflow site
August 2016 overflow site
LAKE GEORGE BEACH | Preliminary Pollution Source Investigation (April 2017) 26

Figure B4. Map of Caldwell collection system and December 29, 2016 overflow site
Figure B5. Planned investigative work of Caldwell Sewer System
LAKE GEORGE BEACH | Preliminary Pollution Source Investigation (April 2017) 27

In early 2017, DEC hired a contractor to video-inspect the condition of all DEC -owned storm and sanitary sewers that service Lake George Beach State Park, Lake George Battleground, and Lake George Battlefield. All lines and connections were reported to be in good condition with no evidence of exfiltration of sanitary sewage.
Figure B6. Photo of video inspection crew
LAKE GEORGE BEACH | Preliminary Pollution Source Investigation (April 2017) 28

Stormwater During the tributary sampling event on September 6, 2016, a potential stormwater outfall was identified near Sample Site EB-A. A 24” corrugated metal pipe was observed adjacent to the stone arch culvert that conveys flows from East Brook under Beach Road into the lake. A drainage swale channel was also observed in an overgrown area within the East Brook wetland area, as identified on Figure B7.
Figure B7. Photos of 24’’corrugated metal stormwater pipe and drainage swale located near East Brook and Beach Road
Drainage
24” Corrugated Metal
Drainage Swale East Brook
Beach Parking
LAKE GEORGE BEACH | Preliminary Pollution Source Investigation (April 2017) 29

DEC conducted follow up investigations of the stormwater system in the vicinity of the 24” corrugated pipe. It was determined that the pipe was an outlet for the drainage system serving Bloody Pond Road located to the east of Route 9L (Figure B8). Stormwater drainage structures at the intersection of Bloody Pond Road and 9L direct runoff under Route 9L through a 24” corrugated metal pipe that combines with runoff from the Garrison Restaurant parking lot and other residential properties. Stormwater is conveyed through a series of channels and culverts to a manhole on the west side of Cedar Lane. The stormwater conveyance system includes a series of pipes (blue lines) and surface flows (red lines), as depicted in Figure B8.
Figure B8. Stormwater conveyance system between Bloody Pond Road and East Brook.
Drainage
DEC Dye Test Location
Cedar Lane
Garrison Restaurant Parking Lot
LAKE GEORGE BEACH | Preliminary Pollution Source Investigation (April 2017) 30

Dye testing performed by DEC on January 30, 2017, confirmed that during low flow periods, the drainage channel to the east of the Cedar Lane manhole discharges through the 24” corrugated metal pipe near the mouth of East Brook). A secondary outlet (shown in Figure B9) with an invert elevation ~1 foot above the inlet at the Cedar Lane manhole conveys high flows to a stone-lined channel that also discharges to East Brook (Figures B8, B9).
Figure B9. Photo of Cedar Lane Manhole with 24’’ corrugated metal pipe
Dry weather discharges were observed from the 24’’ corrugated metal pipe outlet into East Brook (Figure B10).
Figure B10. Photos of dry weather flows from 24’’ corrugated metal pipe into East Brook (photos taken January 28, 2017)
Dry weather flow
LAKE GEORGE BEACH | Preliminary Pollution Source Investigation (April 2017) 31

Although there were no physical indicators of pollutants in the discharge observed from the 24” corrugated metal pipe, DEC worked with the Lake George Association, the Village of Lake George, and the Town of Lake George to further investigate the potential for illicit discharges in this area. On February 22, 2017, the Lake George Association, working in partnership with the Town and Village of Lake George, collected samples for fecal coliform at the 24” pipe and within a tributary near Beatty Lane. The results of this testing showed fecal coliform levels below the single sample threshold value (1,000 col./100 ml for freshwater) at both the 24" outfall (115 col./100 ml) and within the tributary (1 col./100 ml).
Figure B11. Photos from February 22, 2017 sampling effort
LAKE GEORGE BEACH | Preliminary Pollution Source Investigation (April 2017) 32

On February 28, 2017, the Lake George Association working with the Town of Lake George conducted dye tests of the sanitary sewer system to determine if there were any cross connections with the storm sewer system. This testing did not identify any cross connections or leakage from the sanitary sewer into the storm sewer system. The town plans to further investigate the condition of the sanitary sewer lines using closed circuit television beginning in the spring of 2017 (Figure B5).
Figure B12. Dye testing locations
A follow-up sample of East Brook collected by DEC on January 5, 2017 in the approximate location of EB-A (approximately 10 feet from the 24” corrugated metal pipe - mid channel) contained levels of E.coli (19 col./100 ml) and fecal coliform (19 col./100ml) well below the single sample standards for these parameters, 235 col./100 ml and 1000 col./100 ml, respectively. Additional follow-up investigations of the stormwater conveyance system adjacent to East Brook and serving the residential area surrounding Cedar Lane are being planned to identify any illicit discharges from seasonal use properties and eliminate any that are found
LAKE GEORGE BEACH | Preliminary Pollution Source Investigation (April 2017) 33
