lagged rejuvenation of groundwater indicates …groundwater flow models, we could reproduce the...
TRANSCRIPT

U S I N G WAT E R A G E TO E X P L O R E H YD RO LOG I C A LP RO C E S S E S I N CON T R A S T I N G E NV I R ONMEN T S
Lagged rejuvenation of groundwater indicates internal flowstructures and hydrological connectivity
Tamara Kolbe1,2 | Jean Marçais3,4 | Jean-Raynald de Dreuzy5,6 |
Thierry Labasque5 | Kevin Bishop1
1Department of Aquatic Sciences and
Assessment, Swedish University of Agricultural
Science, Uppsala, Sweden
2Section of Hydrogeology and
Hydrochemistry, Institute of Geology, Faculty
of Geoscience, Geoengineering and Mining,
TU Bergakademie Freiberg, Freiberg, Germany
3Institut de Physique du Globe de Paris,
Université de Paris, Paris, France
4INRAE, UR RiverLy, F-69625 Villeurbanne,
France
5Géoscience Rennes—UMR 6118, Université
de Rennes, Centre National de la Recherche
Scientifique (CNRS), Rennes, France
6Observatoire des Sciences de l'Univers de
Rennes (OSUR)—UMS 3343, Université de
Rennes, Centre National de la Recherche
Scientifique (CNRS), Rennes, France
Correspondence
Tamara Kolbe, Section of Hydrogeology and
Hydrochemistry, Institute of Geology, Faculty
of Geoscience, Geoengineering and Mining,
TU Bergakademie Freiberg, Freiberg, Germany.
Email: [email protected]
Funding information
Swedisch University of Agricultural Sciences,
Department of Aquatic Sciences and
Assessment
Abstract
Large proportions of rainwater and snowmelt infiltrate into the subsurface before
contributing to stream flow and stream water quality. Subsurface flow dynamics
steer the transport and transformation of contaminants, carbon, weathering products
and other biogeochemistry. The distribution of groundwater ages with depth is a key
feature of these flow dynamics. Predicting these ages are a strong test of hypotheses
about subsurface structures and time-varying processes. Chlorofluorocarbon (CFC)-
based groundwater ages revealed an unexpected groundwater age stratification in a
0.47 km2 forested catchment called Svartberget in northern Sweden. An overall
groundwater age stratification, representative for the Svartberget site, was derived
by measuring CFCs from nine different wells with depths of 2–18 m close to the
stream network. Immediately below the water table, CFC-based groundwater ages of
already 30 years that increased with depth were found. Using complementary
groundwater flow models, we could reproduce the observed groundwater age strati-
fication and show that the 30 year lag in rejuvenation comes from return flow of
groundwater at a subsurface discharge zone that evolves along the interface
between two soil types. By comparing the observed groundwater age stratification
with a simple analytical approximation, we show that the observed lag in rejuvena-
tion can be a powerful indicator of the extent and structure of the subsurface dis-
charge zone, while the vertical gradient of the age-depth-relationship can still be
used as a proxy of the overall aquifer recharge even when sampled in the discharge
zone. The single age stratification profile measured in the discharge zone, close to
the aquifer outlet, can reveal the main structure of the groundwater flow pattern
from recharge to discharge. This groundwater flow pattern provides information on
the participation of groundwater in the hydrological cycle and indicates the lower
boundary of hydrological connectivity.
K E YWORD S
CFCs, groundwater age stratification, groundwater recharge, hillslope storage Boussinesq
equations, Krycklan, subsurface discharge, subsurface hydrological connectivity
Received: 11 October 2019 Accepted: 11 March 2020
DOI: 10.1002/hyp.13753
This is an open access article under the terms of the Creative Commons Attribution License, which permits use, distribution and reproduction in any medium,
provided the original work is properly cited.
© 2020 The Authors. Hydrological Processes published by John Wiley & Sons Ltd.
2176 Hydrological Processes. 2020;34:2176–2189.wileyonlinelibrary.com/journal/hyp

1 | INTRODUCTION
The time water has spent in a catchment gives information on hydro-
logical processes, solute transport and chemical reactions along flow
paths. While a large proportion of stream water measured at the out-
let is young, with a mean age of 3 months (Jasechko et al., 2017),
water stored in a catchment is much older with ages of weeks for local
flow systems and ages of millions of years for regional flow systems
(Berghuijs & Kirchner, 2017; Gabrielli, Morgenstern, Stewart, &
McDonnell, 2018; Gleeson, Befus, Jasechko, Luijendijk, &
Cardenas, 2016). Water ages increase rapidly with depth and longer
flow paths that follow the structure of the aquifer and connections to
the surface (Cardenas, 2007; Vogel, 1967). Dating stream water at the
outlet informs catchment hydrology about catchment functioning at
short timescales, but groundwater dynamics at larger timescales are
often unseen either due to the choice of tracers or the small portion
of older groundwater in the stream. The groundwater age (the time a
water parcel has spent in the aquifer from the recharge location at the
water table to the sampling location) provides complementary infor-
mation on the subsurface hydrological cycle including water origin,
flow paths, storage capacity and water quality (Haitjema, 1995;
Kazemi, Lehr, & Perrochet, 2006). When measuring groundwater ages
in wells, ages can provide access to some overall features of the
groundwater flow dynamics through adapted inference methods, for
example Lumped Parameter Models (LPM) that have been developed
to extract invaluable information from point-like age data (Åkesson
et al., 2015; Jurgens, Böhlke, & Eberts, 2012; Kolbe et al., 2016;
Maloszewski & Zuber, 1996; Marçais, de Dreuzy, Ginn, Rousseau-
Gueutin, & Leray, 2015). Used within the right concept of flow struc-
tures, the points with dated groundwater are useful proxies of
difficult-to-access groundwater dynamics. With more cost-effective
access to chemical analysis, age data are increasingly measured in well
networks, thus giving information on spatial patterns and stratification
of ages (Ayraud et al., 2008; Cook, Solomon, Plummer, Busenberg, &
Schiff, 1995; Gerber, Purtschert, Hunkeler, Hug, & Sültenfuss, 2018;
Visser, Broers, Heerdink, & Bierkens, 2009). Upslope, age stratifica-
tions give useful information on localized recharge and heterogeneity
patterns (McMahon, Plummer, Böhlke, Shapiro, & Hinkle, 2011).
Downslope, closer to discharge from the aquifer to surface water, age
stratifications are still influenced by the recharge conditions, but also
by the overall aquifer structure. The subsurface to surface interactions
become also more intense close the outflow boundary-making infer-
ences even more complex (Modica, Buxton, & Plummer, 1998).
Groundwater ages at downslope locations conceptually bear informa-
tion on groundwater dynamics from recharge to discharge, but is it
possible to resolve key groundwater characteristics (recharge, aquifer
structure, surface/subsurface interactions) from such age data? What
is the information content of downslope groundwater ages measured
close to the outflow into the surface water network? Are they more
influenced by the recharge from further upslope or by the closer
downslope discharge? How can these be interpreted? Could an age
stratification be reconstructed from different locations or should it be
strictly determined from sampling at different depths at the same
location? How much should an age stratification be resolved to be
useful?
Answers to these practical and fundamental questions are neces-
sary to use downslope age patterns to inform the groundwater
dynamics and their interaction with surface and shallow subsurface
flows. In an unconfined aquifer, the age T at depth z is theoretically
independent of the horizontal location and only related to the volume
to recharge ratio as given by
T =θHRln
HH−z
� �ð1Þ
with a uniform recharge R, a constant thickness H and a homogeneous
porosity θ (Equation 1, Vogel, 1967). Recharge processes rejuvenate
groundwater at the water table. Under the assumptions that the hori-
zontal extent of the aquifer is much larger than its vertical extent, and
that the horizontal velocities are decreasing logarithmically with
depth, this will result in an aging of groundwater while circulating
deeper into the aquifer. Under such idealized conditions, the age
stratification can be reconstructed from any sampling locations of the
aquifer far enough from the water divide and the discharge zone. At
single locations or transects in recharge zones, groundwater ages at
different depths have indeed been proven to follow the expected log-
arithmic increase with depth in several hydrogeological settings.
There, groundwater ages are governed by only a few parameters and
Equation (1) can be used to estimate recharge volumes (Gates, Steele,
Nasta, & Szilagyi, 2014; Harrington, Cook, & Herczeg, 2002;
Kozuskanich, Simmons, & Cook, 2014; McMahon et al., 2011).
Investigations on the distribution of groundwater ages within
unconfined aquifers have shown the impact of geological heterogene-
ities (e.g. aquifer properties and structures) and boundary conditions
(e.g. groundwater recharge or artificial drainage networks) on the age-
depth-relationship (Böhlke, 2002; Cook & Böhlke, 2000; Jurgens
et al., 2012; Leray, de Dreuzy, Bour, Labasque, & Aquilina, 2012).
Jiang, Wan, Cardenas, Ge, and Wang (2010) investigated the impact
of exponentially decreasing hydrogeological parameters, like in hard-
rock aquifers, on age stratifications by numerical modelling and could
show that groundwater ages increase with depths in recharge zones
while a rejuvenation near the discharge zones takes place. Field and
modelling investigations in aquifers with additional artificial heteroge-
neities, such as drainage networks that are often found in agricultural
areas, indicate that relatively old groundwater ages evolve at shallow
depths. In such cases, artificial heterogeneities have been found to
have a stronger impact on age stratifications than aquifer scale het-
erogeneity or non-uniform groundwater recharge (Broers, 2004).
Dunkle et al. (1993) demonstrate by field measurements that the ver-
tical age-depth gradients are smaller and the groundwater ages at the
water table are larger in discharge areas, confined zones and areas
with a low hydraulic gradient than in recharge areas. This is due to
restricted groundwater recharge in these locations, a feature that has
been also observed by other authors (Böhlke, Wanty, Tuttle, Delin, &
Landon, 2002). Non-uniform recharge conditions have been numeri-
cally investigated by Cook and Solomon (1997). Results show that the
KOLBE ET AL. 2177

age stratification is perturbed in areas without recharge, resulting in
increased groundwater ages at the water table. Such age stratifica-
tions with older groundwater ages at the water table are known as
lagged systems and display a discontinuous rejuvenation of ground-
water at the water table (Leray, Engdahl, Massoudieh, Bresciani, &
McCallum, 2016). As the types and changes of land use, topography
and soil types influence groundwater recharge, these factors also
influence the groundwater age stratification (Houben, Koeniger, &
Sültenfuß, 2014).
Leray et al. (2016), Jurgens et al. (2012) and IAEA (2006) summa-
rize some adaptations and further developments of Equation (1) that
have been derived by these observed deviations to approximate
groundwater age stratifications. Even with consideration of these fac-
tors, it is challenging to estimate the distribution of groundwater ages
within aquifers. Nevertheless, we hypothesize that sampling full
flowlines at several locations and different depths downslope close to
the stream network would provide useful information about overall
groundwater flow dynamics. By sampling close to the stream network
we expect to get the age of the full flow path. By sampling at different
depths and distances from the stream network, we also expect to get
information that can help to estimate the recharge volume.
In this study, we investigate the information content of down-
slope measured groundwater ages and the possibility to single out key
groundwater characteristics (recharge, aquifer structure, surface/sub-
surface interactions). Sampling locations were chosen from existing
wells at the Svartberget study site, a sub-catchment of the Krycklan
catchment in northern Sweden. Sampling locations were already exis-
ting and located downslope with different depths and not necessarily
on the same transect. We explored the overall groundwater age pat-
tern and revealed underlying information on recharge and discharge
processes by applying a numerical groundwater flow model. By com-
paring our measured groundwater age stratification with a simple ana-
lytical approximation, we demonstrate how this overall age
stratification gives insights into the groundwater flow dynamics from
recharge to discharge locations. These insights are the basis for fur-
ther defining the lower boundary for water taking part in the local
hydrological cycle, a proxy for the subsurface hydrological connectiv-
ity. These insights are also useful for understanding biogeochemical
fluxes and their impact on water quality at the catchment scale.
2 | STUDY SITE
2.1 | General description
The study site Svartberget (64�140N, 19�460E, 0.47 km2) is located in
the long-term research catchment Krycklan, one of the most
instrumented and monitored catchments in the world (Laudon
et al., 2013). Hydrometric data and water stable isotopes are recorded
at the outlet and monitoring wells. The topography ranges from
F IGURE 1 Location of the Svartberget study site in northern Sweden (a) with its topography (b) its soil types (c) and the tree volume (d)
2178 KOLBE ET AL.

234 to 306 m with a mean elevation of 274 m and is characterized by
gentle slopes (Figure 1). The climate is cold and humid with a mean
temperature of 1.8 �C. The average period of snow cover is 168 days;
the mean precipitation is 614 mm/a and mean runoff is 321 mm/a
(Laudon et al., 2013). There are two stream channels within the study
site that were deepened during the 1910s to improve forest drainage.
The main channel, Kallkällbäcken, originates from a mire that covers
18% of the area. The other channel, Västrabäcken, goes parallel to it
and they merge close to the outlet (C7) of the Svartberget study site.
Besides the open mire area, the vegetation cover consists of pine and
spruce forest (82% of the area) (Figure 1). Regarding the soil types,
65% of the area is covered by glacial till, 18% by peat and 16% by thin
soils. Geophysical methods have shown that the soil depth varies
between 0 and 22 m with a mean depth of 11.5 m to the bedrock
(Lindqvist, Nilsson, & Gonzalez, 1989). Within the glacial till that
covers the bedrock a distinction between the dense basal till nearest
the bedrock and the shallow ablation till up to 3 m depth has to be
made (Nyberg, Stähli, Mellander, & Bishop, 2001). The shallow abla-
tion till, with a higher hydraulic conductivity than the dense basal till,
is primarily transmitting the water in the subsurface (Pinder &
Celia, 2006). The bedrock is gneiss (meta-greywache) and poorly
weathered (Grabs, Seibert, Bishop, & Laudon, 2009). The bedrock
contains horizons of biotite-plagioclase and graphite-sulphide schists
(Mason, 1991).
2.2 | Hydrological functioning
Investigations on the hydrological functioning of the Svartberget site
have been undertaken since 1980 by combinations of hydrometric
and water stable isotope methods as well as modelling tools (Bishop,
Grip, & O'Neill, 1990; Karlsen et al., 2016; Laudon et al., 2013;
Laudon, Sjöblom, Buffam, Seibert, & Mörth, 2007; Ledesma
et al., 2018; Peralta-Tapia et al., 2015; Peralta-Tapia, Sponseller,
Tetzlaff, Soulsby, & Laudon, 2015). Studies have shown that stream
water consists of over 80–90% of pre-stored water due to flashy
responses from glacial till soils (Rodhe, 1989). The high proportions of
pre-stored water in stream water is congruent with mass balance cal-
culations based on the distribution of catchment storages, water
fluxes and flow paths (Amvrosiadi, Seibert, Grabs, & Bishop, 2017).
Within hours of rainfall or snowmelt, a rapid transmission of pre-
stored water with dynamically varying chemical properties to the
stream has been observed. Researchers explain this behaviour by the
concept of transmissivity feedback (Bishop, 1991). A transmissivity
feedback evolves due to an increase of the saturated hydraulic con-
ductivity towards the surface. When the water table rises and reaches
the higher hydraulic conductivities, the rise of the water table slows
down and water flows within the shallow permeable layer to the
stream. At Svartberget ablation till with higher hydraulic conductivities
has been observed up to 3 m depth below the land surface at the
water divide (Nyberg et al., 2001). When the layer with higher hydrau-
lic conductivities gets activated, shallow subsurface flow spends in
average not longer than 2 years in the subsurface (Amvrosiadi
et al., 2017). Streams are strongly incised (sometimes due to human
intervention to increase drainage in the headwater catchments) and
the transiently activated permeable layer transmits most of the annual
flow primarily during periods of high flow, for example in spring during
snowmelt. Little overland flow has been observed at the site even
during high flow seasons, because of the high infiltration capacity of
the till (Rodhe, 1989). It has been shown that water table elevations
and stream discharge are strongly correlated providing some insights
into the runoff generation and the export of solutes (Ameli
et al., 2016; Bishop, Seibert, Köhler, & Laudon, 2004; Ledesma
et al., 2018). All these findings provide insights on the hydrological
functioning on the timescale of month to a few years, but little is
known about the groundwater dynamics beyond a few years, the
groundwater that flows in the less permeable layer. But especially this
water sustains low flows in streams, and in fact defines the chemistry
of stream flow during most of the year (Ledesma et al., 2013). Little is
known about flow structures from groundwater recharge to discharge
zones and the vertical extent of groundwater taking part in the hydro-
logical cycle. Quantifying the age of this water is crucial for
weathering and biogeochemical reactions as well as for determining
the export of nutrients and weathering products from the aquifer.
3 | METHODS
3.1 | Chlorofluorocarbon measurements anddetermination of apparent groundwater ages
Depending on the timescale of groundwater flow dynamics, an appro-
priate age tracer has to be selected to date groundwater (Kazemi
et al., 2006). Chlorofluorocarbons (CFCs) as atmospheric tracers have
been widely used to date groundwater up to some decades and to
infer aquifer characteristics. It is assumed that CFC concentrations are
in equilibrium with the atmosphere above the water table for unsatu-
rated zones of less than 5 m (Engesgaard et al., 2004; Schwientek,
Maloszewski, & Einsiedl, 2009) before being recharged in the aquifer
by recharge processes and further transported conservatively with
groundwater flow. A comparison among the measured CFCs (CFC-11,
CFC-12 and CFC-113) gives insight into their conservative nature and
potential degradation, sorption or contamination. The limitations of
this tracer are extensively discussed in Busenberg and Plummer (1992)
and Cook and Solomon (1997).
We collected groundwater samples at specific depths in nine indi-
vidual sampling locations in till soils within the Svartberget study site in
September 2017 (Figure 1). The specific sampling depths covered sam-
pling intervals of maximum 1 m ranging from the water table to a depth
of 16.7 m below the water table and were located in the basal till below
the lowest observed water table (Appendix, Table A1). All sampling
locations are downslope with distances of 20 and 80 m from the stream
network. The unsaturated zone thickness measured at the sampling
locations was between 0.9 and 2.7 m. CFC concentrations were
analysed at the OSUR analytical platform ‘CONDATE Eau’ at the Uni-
versity of Rennes in France. By sampling flowlines at given depths, we
KOLBE ET AL. 2179

assume sampling of flowlines with consistent groundwater ages. By
knowing the atmospheric CFC concentrations in time and the concen-
tration in the sample, we can determine the recharge year and there-
fore calculate the apparent age of our sample (Kazemi et al., 2006).
3.2 | Conceptual subsurface flow
The shallow ablation till layer with higher hydraulic conductivities that
transmits most of the water and the denser basal till layer with lower
hydraulic conductivities below give evidence for the subsurface struc-
ture being a two-layered system (Jutebring Sterte, Johansson, Sjöberg,
Huseby Karlsen, & Laudon, 2018). At the sampling date, the water table
and stream discharge were low, which testifies that the shallow perme-
able layer was not being fully activated. At locations downslope where
the less permeable layer was fully saturated and therefore the shallow
permeable layer activated, that is groundwater was discharging from
the less permeable to the shallow permeable layer. Groundwater flow
mainly occurred in the less permeable layer. When it rains the shallow
permeable layer is activated as soon as the water table rises up to this
layer and water is transmitted laterally to the stream. The hydraulic con-
ductivity and porosity within each of the two layers are assumed to be
homogenous as there are no other specific geological irregularities
observed besides the decline in hydraulic conductivity with depth. The
fresh bedrock is assumed to be impermeable and flat.
3.3 | Simulation of groundwater ages
We simulated groundwater flow and transport using the hillslope stor-
age Boussinesq equations that have been further developed to account
for a two-layered system with return flow (Marçais, de Dreuzy, &
Erhel, 2017). The interface between the two layers (shallow permeable
and deep less permeable layer) has been interpolated from field infor-
mation, that is geophysical measurements (Lindqvist et al., 1989). The
hillslope storage Boussinesq equations yield a 1D approximation of the
subsurface flow by integrating the discharge transversally to the slope
direction. The discharge is proportional to the width of the transect pro-
file. The simulation of transport is performed in 2D (Harman &
Kim, 2019; Pollock, 1988; Strack, 1984). We applied the equations to a
representative hillslope that has been generated from a DEM with a
resolution of 5 m by taking all cells with the same distance to the
stream and calculating a mean elevation, and the corresponding width
(Figure 2). The width function was fitted by a typical exponential func-
tion to prevent local seepage formations not representative of catch-
ment scale connectivity (Troch, van Loon, & Hilberts, 2002).
An annual mean infiltration of 321 mm (mean net-precipitation
from 1981 till 2017) is taken to simulate steady-state groundwater
flow and applied to the top of the model domain. The hydrogeological
parameters (i.e. porosity and hydraulic conductivity) are assigned to
each of the two layers. Regarding the well-studied shallow permeable
layer, it has been shown that the hydraulic conductivity follows an
exponential decrease with depth. In the simplified two-layered sys-
tem, a homogeneous porosity of 0.4 and homogeneous hydraulic con-
ductivity of 22.88 m d−1 have been assigned. These values represent
mean values for a mean thickness of the permeable layer of 1.5 m
(Ameli et al., 2016; Amvrosiadi et al., 2017; Bishop, 1991; Nyberg
et al., 2001). The homogeneous porosity and homogeneous hydraulic
conductivity of the deeper less permeable layer are calibrated against
CFC-12 concentrations (see Section 4.1) measured in different wells
covering a variety of depths and distances to the stream (see Figure 2
showing the different depths and distance to the stream network).
The MATLAB built-in function fminsearch (Lagarias, Reeds, Wright, &
Wright, 1998) is used to minimize the objective function Φ(k, θ):
F IGURE 2 From the Svartberget catchment (inset to the left), we extracted a representative hillslope with elevation (solid black line) plottedagainst the distance to the stream. Also plotted are the interface between the shallow permeable and deeper less permeable layer (black, dashedline), the bottom of the aquifer (black, dotted line) as well as the width of the hillslope (blue, dashed line) and the fitted width (blue solid line). Theelevations of sampling locations are marked with open circles at the respective distances of the sampling from the stream
2180 KOLBE ET AL.
Φ k,θð Þ=
P9i=1
CmodCFC i k,θ,xi,zið Þ−Cobs
CFCiðxi,ziÞ��� ���
P9i=1
CobsCFCi xi ,zið Þ
ð2Þ
where k and θ are respectively the hydraulic conductivity and the
porosity of the less permeable layer in the model, CmodCFC is the modelled
CFC-12 concentration and CobsCFC the measured CFC-12 concentration
at a depth zi from the water table and at a distance xi from the stream
for the nine different sampling locations. Modelled CFC-12 concen-
trations are derived by convoluting the historical CFC-12 atmospheric
concentrations CinCFC with the residence time distribution pRT for each
of the sampling locations (Equations 3 and 4).
CmodCFC t,mRT,α,λð Þ=
ð +∞
0∁inCFC t−uð ÞpRT u,mRT,α,λð Þdu ð3Þ
with
pRT t,mRT,α,λð Þ= mRT λ
4παt3
� �1=2
exp −t−mRTð Þ2λ4αmRT t
!ð4Þ
where α is the dispersivity (in m), λ is the travelled distance of the par-
ticle and mRT the mean residence time of the particles. α is assumed
to be equal to 0.1λ (Gelhar, 1992). mRT and λ depends on the hydrau-
lic conductivity k and of the porosity θ chosen for the simulation but
also depends on the sampling location (xi, zi).
Each modelled groundwater age represents the mean residence
time from the calibrated model. The calibrated model is then used to
show the distribution of groundwater ages within the representative
hillslope and to determine the groundwater recharge volume to the
less permeable layer. A sensitivity analysis, presented in the discussion
section, shows how the infiltration rate impacts the partitioning of the
amount that discharges through the shallow permeable layer and the
deeper less permeable layer, as well as resulting distributions of
groundwater ages.
4 | RESULTS
4.1 | Measured CFC-based groundwater ages
The CFC-based groundwater ages presented here are based on
CFC-12 measurements. All of the CFC-based groundwater ages
were compared among each other to evaluate their conservative
behaviour. The comparison revealed differences in ages of less than
7 years between the CFCs. CFC-11 based groundwater ages were
higher than CFC-12 and CFC-113 based groundwater ages (see
Appendix, Table A1). This pattern has been typically observed in
environments with microbial degradation and is supported by the
anoxic conditions at the site (Dunkle et al., 1993; IAEA, 2006). As
CFC-12 is known to be less reactive than CFC-11 and CFC-113, the
CFC-12 based groundwater ages are taken here as the most reliable
groundwater ages and the ones chosen for use in the rest of this
study. An ambiguous interpretation of CFC-12 concentrations with
respect to the peak in atmospheric concentrations can be precluded,
as determined concentrations indicated ages older than this range
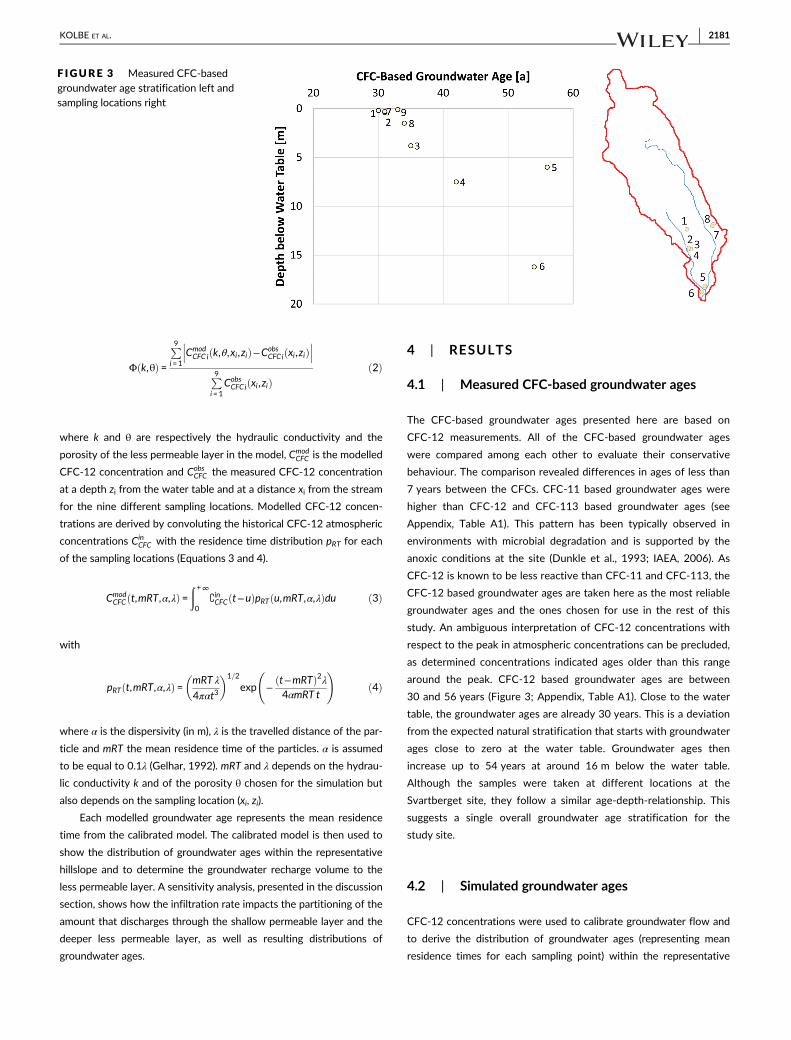
around the peak. CFC-12 based groundwater ages are between
30 and 56 years (Figure 3; Appendix, Table A1). Close to the water
table, the groundwater ages are already 30 years. This is a deviation
from the expected natural stratification that starts with groundwater
ages close to zero at the water table. Groundwater ages then
increase up to 54 years at around 16 m below the water table.
Although the samples were taken at different locations at the
Svartberget site, they follow a similar age-depth-relationship. This
suggests a single overall groundwater age stratification for the
study site.
4.2 | Simulated groundwater ages
CFC-12 concentrations were used to calibrate groundwater flow and
to derive the distribution of groundwater ages (representing mean
residence times for each sampling point) within the representative
F IGURE 3 Measured CFC-basedgroundwater age stratification left andsampling locations right
KOLBE ET AL. 2181
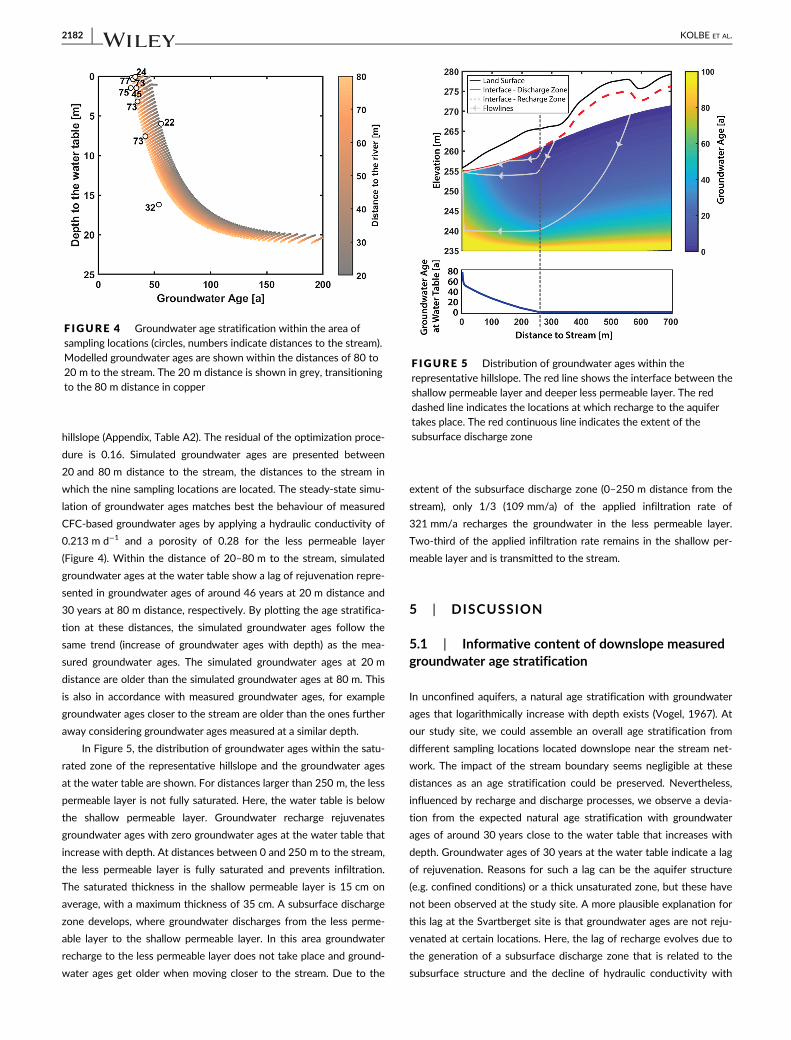
hillslope (Appendix, Table A2). The residual of the optimization proce-
dure is 0.16. Simulated groundwater ages are presented between
20 and 80 m distance to the stream, the distances to the stream in
which the nine sampling locations are located. The steady-state simu-
lation of groundwater ages matches best the behaviour of measured
CFC-based groundwater ages by applying a hydraulic conductivity of
0.213 m d−1 and a porosity of 0.28 for the less permeable layer
(Figure 4). Within the distance of 20–80 m to the stream, simulated
groundwater ages at the water table show a lag of rejuvenation repre-
sented in groundwater ages of around 46 years at 20 m distance and
30 years at 80 m distance, respectively. By plotting the age stratifica-
tion at these distances, the simulated groundwater ages follow the
same trend (increase of groundwater ages with depth) as the mea-
sured groundwater ages. The simulated groundwater ages at 20 m
distance are older than the simulated groundwater ages at 80 m. This
is also in accordance with measured groundwater ages, for example
groundwater ages closer to the stream are older than the ones further
away considering groundwater ages measured at a similar depth.
In Figure 5, the distribution of groundwater ages within the satu-
rated zone of the representative hillslope and the groundwater ages
at the water table are shown. For distances larger than 250 m, the less
permeable layer is not fully saturated. Here, the water table is below
the shallow permeable layer. Groundwater recharge rejuvenates
groundwater ages with zero groundwater ages at the water table that
increase with depth. At distances between 0 and 250 m to the stream,
the less permeable layer is fully saturated and prevents infiltration.
The saturated thickness in the shallow permeable layer is 15 cm on
average, with a maximum thickness of 35 cm. A subsurface discharge
zone develops, where groundwater discharges from the less perme-
able layer to the shallow permeable layer. In this area groundwater
recharge to the less permeable layer does not take place and ground-
water ages get older when moving closer to the stream. Due to the
extent of the subsurface discharge zone (0–250 m distance from the
stream), only 1/3 (109 mm/a) of the applied infiltration rate of
321 mm/a recharges the groundwater in the less permeable layer.
Two-third of the applied infiltration rate remains in the shallow per-
meable layer and is transmitted to the stream.
5 | DISCUSSION
5.1 | Informative content of downslope measuredgroundwater age stratification
In unconfined aquifers, a natural age stratification with groundwater
ages that logarithmically increase with depth exists (Vogel, 1967). At
our study site, we could assemble an overall age stratification from
different sampling locations located downslope near the stream net-
work. The impact of the stream boundary seems negligible at these
distances as an age stratification could be preserved. Nevertheless,
influenced by recharge and discharge processes, we observe a devia-
tion from the expected natural age stratification with groundwater
ages of around 30 years close to the water table that increases with
depth. Groundwater ages of 30 years at the water table indicate a lag
of rejuvenation. Reasons for such a lag can be the aquifer structure
(e.g. confined conditions) or a thick unsaturated zone, but these have
not been observed at the study site. A more plausible explanation for
this lag at the Svartberget site is that groundwater ages are not reju-
venated at certain locations. Here, the lag of recharge evolves due to
the generation of a subsurface discharge zone that is related to the
subsurface structure and the decline of hydraulic conductivity with
F IGURE 4 Groundwater age stratification within the area ofsampling locations (circles, numbers indicate distances to the stream).Modelled groundwater ages are shown within the distances of 80 to20 m to the stream. The 20 m distance is shown in grey, transitioningto the 80 m distance in copper
F IGURE 5 Distribution of groundwater ages within therepresentative hillslope. The red line shows the interface between theshallow permeable layer and deeper less permeable layer. The reddashed line indicates the locations at which recharge to the aquifertakes place. The red continuous line indicates the extent of thesubsurface discharge zone
2182 KOLBE ET AL.

depth (Figure 5). The subsurface discharge zone is not obviously visi-
ble from topographic and other catchment metrics, but is well con-
strained by field data and confirmed by our modelling approach as
well as other catchment observations. For example, Klaminder, Grip,
Mörth, and Laudon (2011) investigated the importance of carbon min-
eralization and pyrite oxidation for silicate weathering at the study
site and showed increasing pH, concentration of inorganic C, base cat-
ions, SO4 and Si while O2 concentrations decreased with increasing
distance from the water divide along the hillslope. Infiltrating ground-
water would provoke an increase of O2 concentrations as recharging
water is enriched in O2. Their results promote our hypothesis of
groundwater discharge at these locations that prevent infiltration.
For future age tracer interpretations at the site, our findings sug-
gest an exponential piston flow model as the most appropriate LPM
for simulating a groundwater age distribution in a fully screened well
located in a discharge zone (Jurgens et al., 2012; Maloszewski &
Zuber, 1996).
The downslope age stratification presented here provides inher-
ent information on groundwater dynamics within recharge and dis-
charge, but it is necessary to apply a simple analytical approximation
to reveal key characteristics from the measured groundwater age
stratification, like the recharge volume or the relation between
recharge and subsurface discharge zone. With these two measures
we would then not only get information about the recharge volume
commonly measured in recharge zones, but we also gain additional
information about the connectivity of the groundwater body with the
surface, in this study represented by the subsurface discharge zone.
5.2 | Interpretation and analytical approximationof groundwater age stratification
There have been numerous age stratifications reported in the litera-
ture with the development of analytical solutions to predict and
assess age stratifications from a few aquifer parameters. An analytical
solution involving a subsurface discharge zone, such as we do here,
has not yet been reported. The generation of a discharge zone pre-
vents water from infiltrating into the aquifer, acting like a confinement
at this location (Figure 6a) (IAEA, 2006). Thus we propose to apply an
analytical solution for lagged systems described as aquifer systems
where the aquifer type changes from unconfined to confined condi-
tions (Figure 6b). The groundwater ages at any location in the area
where subsurface discharge occurs depends on the characteristics of
both, the unconfined part and the ‘confined’ part of the aquifer. In our
F IGURE 6 (a) Graphical presentation of the representative hillslope and generation of the discharge zone in the discharge area.(b) Presentation of the idealized aquifer and mean groundwater ages. (c) Measured groundwater ages versus depth and derived meangroundwater ages
KOLBE ET AL. 2183
case, this is the part where the subsurface discharge zone develops.
The controlling parameters are the area of the recharge zone Ar and
the area of the discharge zone Ad, together with the thickness of the
aquifer H, the groundwater recharge R as well as porosity θ of the
geological medium that determines the slope of the age-depth-rela-
tionship. The analytical approximation demonstrates that the ratio
between the area of recharge zone and the area of the discharge zone
Ad/Ar can be obtained by the observed mean groundwater age-related
to the discharge zone τd,obs of 31 years divided by the observed mean
groundwater age-related to the recharge zone τr,obs of 26 years
(Figure 6c). Measured groundwater ages indicate a ratio of Ad/Ar of
1.2. Comparing this result to our model results with a modelled dis-
charge area of 0.3 km2 and a modelled recharge area of 0.2 km2 (Ad/
Ar = 1.5), shows that the Ad/Ar ratio can be obtained by the observed
groundwater ages with an error of 20%.
When applying the analytical solution for lagged systems just a
few aquifer characteristics are needed to get a first estimate of the
aquifer functioning. To fit the analytical solution to measured ground-
water ages, the observed groundwater age stratification has to be
resolved to a certain extent meaning that measurements close to the
water table and along the full depth of the aquifer are necessary.
Deviations from the analytical solution might be due to heterogene-
ities in the subsurface or recharge.
5.3 | Impact of infiltration rates on groundwaterage stratification
The aquifer is exposed to strong seasonal changes with a variation of
infiltration rates affecting subsurface flow. Here, we present a sensi-
tivity analysis on the infiltration rate. While this is not a substitute for
a fully transient simulation, it still clearly shows the potential impact
of the partitioning of the infiltration rate into the amount that dis-
charges through the shallow permeable layer and the deeper less per-
meable layer. The aquifer receives high volumes of water during
snowmelt in spring. In summer and winter, there is less infiltration due
to less rainfall and snow accumulation on the surface. Intermediate
infiltration occurs during autumn due to occasional rainfall events
(Karlsen et al., 2016). Considering these extreme variations in infiltra-
tion rates, the connection between the shallow permeable layer and
the less permeable layer vary to a certain extent.
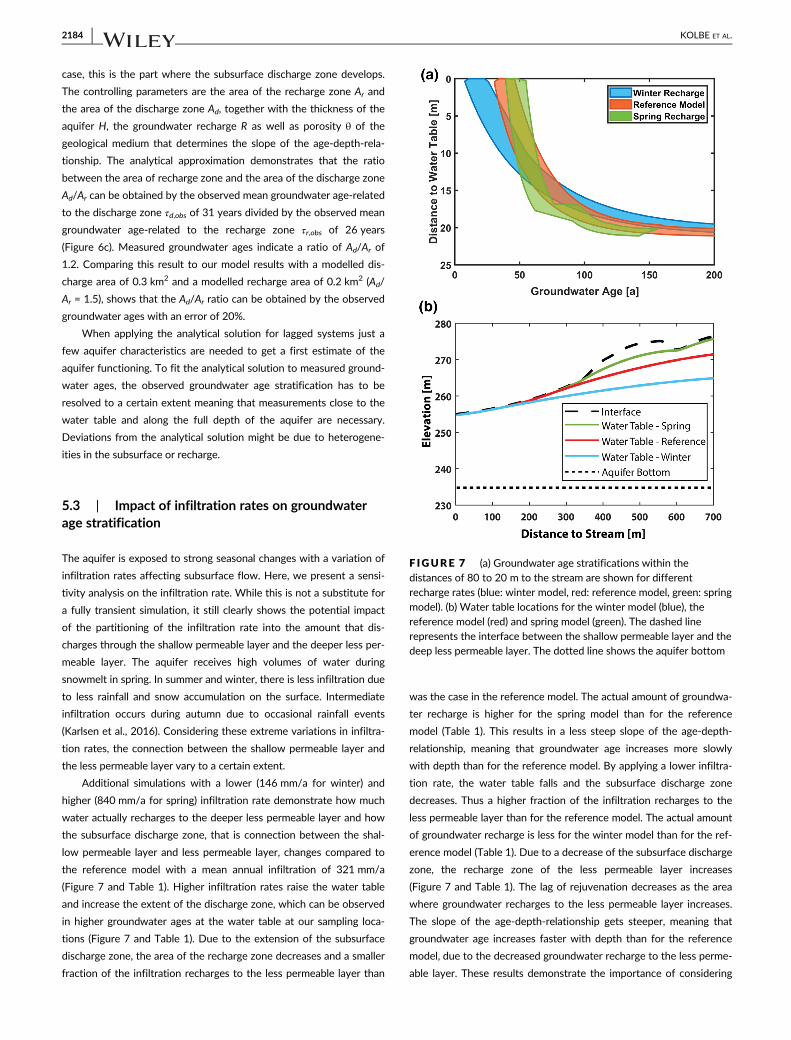
Additional simulations with a lower (146 mm/a for winter) and
higher (840 mm/a for spring) infiltration rate demonstrate how much
water actually recharges to the deeper less permeable layer and how
the subsurface discharge zone, that is connection between the shal-
low permeable layer and less permeable layer, changes compared to
the reference model with a mean annual infiltration of 321 mm/a
(Figure 7 and Table 1). Higher infiltration rates raise the water table
and increase the extent of the discharge zone, which can be observed
in higher groundwater ages at the water table at our sampling loca-
tions (Figure 7 and Table 1). Due to the extension of the subsurface
discharge zone, the area of the recharge zone decreases and a smaller
fraction of the infiltration recharges to the less permeable layer than
was the case in the reference model. The actual amount of groundwa-
ter recharge is higher for the spring model than for the reference
model (Table 1). This results in a less steep slope of the age-depth-
relationship, meaning that groundwater age increases more slowly
with depth than for the reference model. By applying a lower infiltra-
tion rate, the water table falls and the subsurface discharge zone
decreases. Thus a higher fraction of the infiltration recharges to the
less permeable layer than for the reference model. The actual amount
of groundwater recharge is less for the winter model than for the ref-
erence model (Table 1). Due to a decrease of the subsurface discharge
zone, the recharge zone of the less permeable layer increases
(Figure 7 and Table 1). The lag of rejuvenation decreases as the area
where groundwater recharges to the less permeable layer increases.
The slope of the age-depth-relationship gets steeper, meaning that
groundwater age increases faster with depth than for the reference
model, due to the decreased groundwater recharge to the less perme-
able layer. These results demonstrate the importance of considering
F IGURE 7 (a) Groundwater age stratifications within thedistances of 80 to 20 m to the stream are shown for differentrecharge rates (blue: winter model, red: reference model, green: springmodel). (b) Water table locations for the winter model (blue), thereference model (red) and spring model (green). The dashed linerepresents the interface between the shallow permeable layer and thedeep less permeable layer. The dotted line shows the aquifer bottom
2184 KOLBE ET AL.

the partitioning of the infiltration amount and pose a limitation for
estimating a mean groundwater age Tmean only from an estimated
groundwater recharge value R by knowing the thickness of the satu-
rated zone H and the porosity θ (Tmean = θHR ).
5.4 | Relevance beyond our study site
By analysing a single overall groundwater age stratification from
downslope sampling locations, the extent of groundwater contributing
to the hydrological cycle can be defined. Connections of the deep
groundwater with the surface can be informed by extracting the verti-
cal slope of the age-depth-relationship that provides information
about the recharge volume. Connectivity between the deep ground-
water in the less permeable layer and the shallow groundwater in the
shallow permeable layer can be defined by extracting the lag of reju-
venation that indicates the extent of the discharge zone in relation to
the recharge zone. Overall, the distribution of ages with depths marks
the vertical hydrological connectivity, that is timescales and related
depths taking part in the local hydrological cycle. This is an important
measure for hydro(geo)logists, ecologists, and water resource man-
agers as the transport of water, including the division into local flow
systems that discharge to the nearest watercourse, and regional
groundwater flow systems, has implications for the transport of con-
taminants, chemical weathering and biogeochemical fluxes
(Erlandsson et al., 2016; Maher & Chamberlain, 2014).
In general, hydrological connectivity has been described as ‘the
water mediated transport of matter, energy and organisms within or
between hydrological elements of the hydrological cycle’ (Ali,
Oswald, Spence, & Wellen, 2018; Bracken & Croke, 2007), but
depending on the researcher's background and spatial as well as
temporal scale of investigation this term has been adapted as no
universal definition exists (Michaelides & Chappell, 2009). Neverthe-
less, researchers agree that hydrological connectivity can be sepa-
rated into structural connectivity (structure of the subsurface,
i.e. spatial distribution of hydrogeological parameter or lithology)
and functional connectivity (description of process, i.e. flow or type
of boundary conditions) that are mutually dependent (Renard &
Allard, 2013). Speaking in terms of structural and functional connec-
tivity related to our findings, we clearly observe a strong control of
the processes (functional connectivity) occurring at the Svartberget
site. The subsurface discharge zone generates a lag of rejuvenation
that impacts the recharge volume to the less permeable layer and
vice versa.
Such a subsurface discharge zone is not only relevant at the
Svartberget site. The decline in hydraulic conductivity with depth that
led to this subsurface process has been found in many other environ-
ments. These include weathered and fractured media as well as
porous media (Jiang, Wan, Wang, Ge, & Liu, 2009), in glacial till catch-
ments (Grip, 2015; Nyberg, 1995) and in forested catchments, as the
increased root density can increase the efficiency of preferential flow
paths forming a near surface permeable zone.
6 | CONCLUSION
In the study, a single overall groundwater age stratification provided
spatially and temporally distributed information about the groundwa-
ter recharge and discharge relationship. By measuring groundwater
ages downslope from different sampling locations we derive a specific
age vs depth relationship that is distinct from other studies and pro-
vides useful insights on groundwater dynamics. We emphasize two
measures extracted from the groundwater age stratification, (1) the
lag of rejuvenation that indicates the extent of the subsurface dis-
charge zone in relation to the recharge zone. Here, the discharge zone
acts as a confinement of the aquifer and hinders aquifer recharge.
(2) The increase of ages with depth yields information about the
recharge volume.
At our site this lag of rejuvenation is due to a hydrodynamic
effect, the generation of the subsurface discharge zone, which evolves
between a highly permeable to less permeable subsurface layer. The
two-layered system originates from the subsurface structure, the
strong decline in hydraulic conductivity with depth, which is a com-
mon feature not specific to our study site. This has been observed in
various other locations, suggesting that the findings here are also
applicable to other sites. This subsurface discharge zone might espe-
cially occur in catchments that are characterized by till soils or in other
catchments with rapid changes of hydraulic conductivity with depth.
By selecting a simple analytical approximation for this groundwa-
ter age stratification, we demonstrate a strong capability to infer fur-
ther information about the aquifer from groundwater age data. These
insights provide a basis for linking water and biogeochemical fluxes in
groundwater that also affect surface water quality. Furthermore, we
elaborate a metric for describing subsurface hydrological connectivity
TABLE 1 Summary of model results for simulations with different infiltration rates I and the resulting distance to the steam withinsubsurface discharge occurs Ld, the groundwater recharge to the deeper less permeable layer Rdeep layer, mean groundwater age at samplinglocations τw, lag of rejuvenation τd (mean groundwater age-related to the discharge zone) as well as mean groundwater age-related to therecharge zone τr
Simulation I (mm/a) Ld (m) Rdeep layer (mm/a) τd (a) τr (a) τw (a)
Reference 321 240 109 (34% of total) 36 28 64
Winter 146 95 94 (64% of total) 14 46 60
Spring 840 340 177 (21% of total) 42 21 63
KOLBE ET AL. 2185

not merely at our study site, but rather as a general tool and for com-
parison of individual study sites.
ACKNOWLEDGMENTS
This project has been funded by the Swedish University of Agricul-
tural Sciences (SLU), Department of Aquatic Sciences and Assessment.
Many thanks to the Krycklan catchment study (KCS) group and espe-
cially to Hjalmar Laudon and Johannes Tiwari for their help through-
out the process. KCS is supported by the Swedish Science Foundation
SITES, ForWater, Future Forest, Kempe Foundation and SKB. Many
thanks also to Reinert Huseby Karlsen for his support and Anna
Nydahl for the pleasant company during the field campaign.
DATA AVAILABILITY STATEMENT
The data that support the findings of this study are available from the
corresponding author upon reasonable request.
ORCID
Tamara Kolbe https://orcid.org/0000-0001-7943-9953
REFERENCES
Åkesson, M., Suckow, A., Visser, A., Sültenfuβ, J., Laier, T., Purtschert, R., &Sparrenbom, C. J. (2015). Constraining age distributions of groundwa-
ter from public supply wells in diverse hydrogeological settings in
Scania, Sweden. Journal of Hydrology, 528, 217–229. https://doi.org/10.1016/j.jhydrol.2015.06.022
Ali, G., Oswald, C., Spence, C., & Wellen, C. (2018). The T-TEL method for
assessing water, sediment, and chemical connectivity. Water Resources
Research, 54(2), 634–662. https://doi.org/10.1002/2017WR020707
Ameli, A. A., Amvrosiadi, N., Grabs, T., Laudon, H., Creed, I. F.,
McDonnell, J. J., & Bishop, K. (2016). Hillslope permeability architec-
ture controls on subsurface transit time distribution and flow paths.
Journal of Hydrology, 543, 17–30. https://doi.org/10.1016/j.jhydrol.
2016.04.071
Amvrosiadi, N., Seibert, J., Grabs, T., & Bishop, K. (2017). Water storage
dynamics in a till hillslope: The foundation for modeling flows and
turnover times. Hydrological Processes, 31(1), 4–14. https://doi.org/10.1002/hyp.11046
Ayraud, V., Aquilina, L., Labasque, T., Pauwels, H., Molenat, J., Pierson-
Wickmann, A. C., et al. (2008). Compartmentalization of physical and
chemical properties in hard-rock aquifers deduced from chemical and
groundwater age analyses. Applied Geochemistry, 23(9), 2686–2707.https://doi.org/10.1016/j.apgeochem.2008.06.001
Berghuijs, W. R., & Kirchner, J. W. (2017). The relationship between
contrasting ages of groundwater and streamflow. Geophysical
Research Letters, 44(17), 8925–8935. https://doi.org/10.1002/
2017GL074962
Bishop, K. (1991). Episodic increases in stream acidity, catchment flow
pathways and hydrograph separation (Ph. D. thesis). Univ. of
Cambridge.
Bishop, K., Seibert, J., Köhler, S., & Laudon, H. (2004). Resolving the double
paradox of rapidly mobilized old water with highly variable responses
in runoff chemistry. Hydrological Processes, 18(1), 185–189. https://doi.org/10.1002/hyp.5209
Bishop, K. H., Grip, H., & O'Neill, A. (1990). The origins of acid runoff in a
hillslope during storm events. Journal of Hydrology, 116(1–4), 35–61.https://doi.org/10.1016/0022-1694(90)90114-D
Böhlke, J.-K. (2002). Groundwater recharge and agricultural contamina-
tion. Hydrogeology Journal, 10(1), 153–179. https://doi.org/10.1007/s10040-001-0183-3
Böhlke, J. K., Wanty, R., Tuttle, M., Delin, G., & Landon, M. (2002). Denitri-
fication in the recharge area and discharge area of a transient agricul-
tural nitrate plume in a glacial outwash sand aquifer, Minnesota. Water
Resources Research, 38(7), 10-1–10-26. https://doi.org/10.1029/
2001WR000663
Bracken, L. J., & Croke, J. (2007). The concept of hydrological connectivity
and its contribution to understanding runoff-dominated geomorphic
systems. Hydrological Processes, 21(13), 1749–1763. https://doi.org/10.1002/hyp.6313
Broers, H. P. (2004). The spatial distribution of groundwater age for differ-
ent geohydrological situations in the Netherlands: Implications for
groundwater quality monitoring at the regional scale. Journal of Hydrol-
ogy, 299(1–2), 84–106. https://doi.org/10.1016/j.jhydrol.2004.04.023Busenberg, E., & Plummer, L. N. (1992). Use of chlorofluorocarbons (CCl3F
and CCl2F2) as hydrologic tracers and age-dating tools: The alluvium
and terrace system of central Oklahoma. Water Resources Research, 28
(9), 2257–2283. https://doi.org/10.1029/92WR01263
Cardenas, M. B. (2007). Potential contribution of topography-driven
regional groundwater flow to fractal stream chemistry: Residence time
distribution analysis of Tóth flow. Geophysical Research Letters, 34(5),
L05403. https://doi.org/10.1029/2006GL029126
Cook, P. G., & Böhlke, J.-K. (2000). Determining timescales for groundwa-
ter flow and solute transport. In Environmental tracers in subsurface
hydrology (pp. 1–30). Boston, MA: Springer US.
Cook, P. G., & Solomon, D. K. (1997). Recent advances in dating young
groundwater: Chlorofluorocarbons, H-3/He-3 and Kr-85. Journal of
Hydrology, 191(1–4), 245–265. https://doi.org/10.1016/s0022-1694(96)03051-x
Cook, P. G., Solomon, D. K., Plummer, L. N., Busenberg, E., & Schiff, S. L.
(1995). Chlorofluorocarbons as tracers of groundwater transport pro-
cesses in a shallow, silty sand aquifer. Water Resources Research, 31(3),
425–434. https://doi.org/10.1029/94wr02528
Dunkle, S. A., Plummer, L. N., Busenberg, E., Phillips, P. J., Denver, J. M.,
Hamilton, P. A., … Coplen, T. B. (1993). Chlorofluorocarbons (CCl3F
and CCl2F2) as dating tools and hydrologic tracers in shallow ground-
water of the Delmarva Peninsula, Atlantic Coastal Plain, United States.
Water Resources Research, 29(12), 3837–3860. https://doi.org/10.
1029/93WR02073
Engesgaard, P., Højberg, A. L., Hinsby, K., Jensen, K. H., Laier, T., Larsen, F.,
… Plummer, L. N. (2004). Transport and time lag of chlorofluorocarbon
gases in the unsaturated zone, Rabis Creek, Denmark. Vadose Zone
Journal, 3(4), 1249–1261. https://doi.org/10.2136/vzj2004.1249Erlandsson, M., Oelkers, E. H., Bishop, K., Sverdrup, H., Belyazid, S.,
Ledesma, J. L. J., & Köhler, S. J. (2016). Spatial and temporal variations
of base cation release from chemical weathering on a hillslope scale.
Chemical Geology, 441, 1–13. https://doi.org/10.1016/J.CHEMGEO.
2016.08.008
Gabrielli, C. P., Morgenstern, U., Stewart, M. K., & McDonnell, J. J. (2018).
Contrasting groundwater and streamflow ages at the Maimai water-
shed. Water Resources Research, 54(6), 3937–3957. https://doi.org/10.1029/2017WR021825
Gates, J. B., Steele, G. V., Nasta, P., & Szilagyi, J. (2014). Lithologic influ-
ences on groundwater recharge through incised glacial till from profile
to regional scales: Evidence from glaciated Eastern Nebraska. Water
Resources Research, 50(1), 466–481. https://doi.org/10.1002/
2013WR014073
Gelhar L. W. (1992). Stochastic Subsurface Hydrology, Prentice-Hall.
Gerber, C., Purtschert, R., Hunkeler, D., Hug, R., & Sültenfuss, J. (2018).
Using environmental tracers to determine the relative importance of
travel times in the unsaturated and saturated zones for the delay of
nitrate reduction measures. Journal of Hydrology, 561, 250–266.https://doi.org/10.1016/J.JHYDROL.2018.03.043
Gleeson, T., Befus, K. M., Jasechko, S., Luijendijk, E., & Cardenas, M. B.
(2016). The global volume and distribution of modern groundwater.
Nature Geoscience, 9(2), 161–167. https://doi.org/10.1038/ngeo2590
2186 KOLBE ET AL.
Grabs, T., Seibert, J., Bishop, K., & Laudon, H. (2009). Modeling spatial pat-
terns of saturated areas: A comparison of the topographic wetness
index and a dynamic distributed model. Journal of Hydrology, 373(1–2),15–23. https://doi.org/10.1016/J.JHYDROL.2009.03.031
Grip, H. (2015). Sweden's first forest hydrology field study 1905-1926:
Contemporary relevance of inherited conclusions and data from the
Rokliden Hillslope. Hydrological Processes, 29(16), 3616–3631. https://doi.org/10.1002/hyp.10420
Haitjema, H. M. (1995). On the residence time distribution in idealized
groundwatersheds. Journal of Hydrology, 172(1–4), 127–146. https://doi.org/10.1016/0022-1694(95)02732-5
Harman, C. J., & Kim, M. (2019). A low-dimensional model of bedrock
weathering and lateral flow coevolution in hillslopes: 1. Hydraulic the-
ory of reactive transport. Hydrological Processes, 33(4), 466–475.https://doi.org/10.1002/hyp.13360
Harrington, G. A., Cook, P. G., & Herczeg, A. L. (2002). Spatial and temporal
variability of ground water recharge in Central Australia: A tracer
approach. Ground Water, 40(5), 518–527. https://doi.org/10.1111/j.1745-6584.2002.tb02536.x
Houben, G. J., Koeniger, P., & Sültenfuß, J. (2014). Freshwater lenses as
archive of climate, groundwater recharge, and hydrochemical evolution:
Insights from depth-specific water isotope analysis and age determina-
tion on the island of Langeoog, Germany. Water Resources Research, 50
(10), 8227–8239. https://doi.org/10.1002/2014WR015584
IAEA. (2006). Use of Chlorofluorocarbons in Hydrology: a guidebook.
International Atomic Energy Agency 291.
Jasechko, S., Perrone, D., Befus, K. M., Bayani Cardenas, M., Ferguson, G.,
Gleeson, T., et al. (2017). Global aquifers dominated by fossil ground-
waters but wells vulnerable to modern contamination. Nature Geosci-
ence, 10(6), 425–429. https://doi.org/10.1038/ngeo2943Jiang, X. W., Wan, L., Cardenas, M. B., Ge, S. M., & Wang, X. S. (2010).
Simultaneous rejuvenation and aging of groundwater in basins due to
depth-decaying hydraulic conductivity and porosity. Geophysical
Research Letters, 37, 5. https://doi.org/10.1029/2010gl042387
Jiang, X. W., Wan, L., Wang, X. S., Ge, S., & Liu, J. (2009). Effect of expo-
nential decay in hydraulic conductivity with depth on regional ground-
water flow. Geophysical Research Letters, 36(24), 3–6. https://doi.org/10.1029/2009GL041251
Jurgens, B.C., Böhlke, J.K., & Eberts, S.M. (2012). An Excel® workbook for
interpreting groundwater age distributions from environmental tracer
data.
Jutebring Sterte, E., Johansson, E., Sjöberg, Y., Huseby Karlsen, R., &
Laudon, H. (2018). Groundwater-surface water interactions across
scales in a boreal landscape investigated using a numerical modelling
approach. Journal of Hydrology, 560, 184–201. https://doi.org/10.
1016/J.JHYDROL.2018.03.011
Karlsen, R. H., Grabs, T., Bishop, K., Buffam, I., Laudon, H., & Seibert, J.
(2016). Landscape controls on spatiotemporal discharge variability in a
boreal catchment. Water Resources Research, 52(8), 6541–6556.https://doi.org/10.1002/2016WR019186
Kazemi, G. A., Lehr, J. H., & Perrochet, P. (2006). Groundwater age. Hobo-
ken, NJ: Wiley-Interscience.
Klaminder, J., Grip, H., Mörth, C. M., & Laudon, H. (2011). Carbon minerali-
zation and pyrite oxidation in groundwater: Importance for silicate
weathering in boreal forest soils and stream base-flow chemistry.
Applied Geochemistry, 26(3), 319–325. https://doi.org/10.1016/j.
apgeochem.2010.12.005
Kolbe, T., Marçais, J., Thomas, Z., Abbott, B. W., de Dreuzy, J.-R.,
Rousseau-Gueutin, P., … Pinay, G. (2016). Coupling 3D groundwater
modeling with CFC-based age dating to classify local groundwater cir-
culation in an unconfined crystalline aquifer. Journal of Hydrology, 543,
31–46. https://doi.org/10.1016/j.jhydrol.2016.05.020Kozuskanich, J., Simmons, C. T., & Cook, P. G. (2014). Estimating recharge
rate from groundwater age using a simplified analytical approach:
Applicability and error estimation in heterogeneous porous media.
Journal of Hydrology, 511, 290–294. https://doi.org/10.1016/J.
JHYDROL.2014.01.058
Lagarias, J. C., Reeds, J. A., Wright, M. H., & Wright, P. E. (1998). Conver-
gence properties of the Nelder–Mead simplex method in low dimen-
sions. SIAM Journal on Optimization, 9(1), 112–147. https://doi.org/10.1137/S1052623496303470
Laudon, H., Sjöblom, V., Buffam, I., Seibert, J., & Mörth, M. (2007). The role
of catchment scale and landscape characteristics for runoff generation
of boreal streams. Journal of Hydrology, 344(3–4), 198–209. https://doi.org/10.1016/j.jhydrol.2007.07.010
Laudon, H., Taberman, I., Ågren, A., Futter, M., Ottosson-löfvenius, M., &
Bishop, K. (2013). The Krycklan catchment study—A flagship infra-
structure for hydrology, biogeochemistry, and climate research in the
boreal landscape. Water Resources Research, 49, 7154–7158. https://doi.org/10.1002/wrcr.20520
Ledesma, J. L. J., Futter, M. N., Blackburn, M., Lidman, F., Grabs, T.,
Sponseller, R. A., … Köhler, S. J. (2018). Towards an improved concep-
tualization of riparian zones in boreal Forest headwaters. Ecosystems,
21(2), 297–315. https://doi.org/10.1007/s10021-017-0149-5Ledesma, J. L. J., Grabs, T., Futter, M. N., Bishop, K. H., Laudon, H., &
Köhler, S. J. (2013). Riparian zone control on base cation concentration
in boreal streams. Biogeosciences, 10(6), 3849–3868. https://doi.org/10.5194/bg-10-3849-2013
Ledesma, J. L. J., Kothawala, D. N., Bastviken, P., Maehder, S., Grabs, T., &
Futter, M. N. (2018). Stream dissolved organic matter composition
reflects the riparian zone, not upslope soils in boreal Forest headwa-
ters. Water Resources Research, 54(6), 3896–3912. https://doi.org/10.1029/2017WR021793
Leray, S., de Dreuzy, J.-R., Bour, O., Labasque, T., & Aquilina, L. (2012).
Contribution of age data to the characterization of complex aquifers.
Journal of Hydrology, 464–465, 54–68. https://doi.org/10.1016/j.
jhydrol.2012.06.052
Leray, S., Engdahl, N. B., Massoudieh, A., Bresciani, E., & McCallum, J.
(2016). Residence time distributions for hydrologic systems: Mecha-
nistic foundations and steady-state analytical solutions. Journal of
Hydrology, 543, 67–87. https://doi.org/10.1016/j.jhydrol.2016.01.068Lindqvist, G., Nilsson, L., & Gonzalez, G. (1989). Depth of till overburden
and bedrock fractures on the Svartberget catchment as determined by
different geophysical methods. University of Luleå, Luleå, Sweden, 16
Maher, K., & Chamberlain, C. P. (2014). Hydrologic regulation of chemical
weathering and the geologic carbon cycle. Science, 343(6178),
1502–1504. https://doi.org/10.1126/science.1250770Maloszewski, P. & Zuber, A. (1996). Lumped parameter models for the
interpretation of environmental tracer data (IAEA-TECDOC—910).
International Atomic Energy Agency (IAEA)
Marçais, J., de Dreuzy, J.-R., & Erhel, J. (2017). Dynamic coupling of sub-
surface and seepage flows solved within a regularized partition formu-
lation. Advances in Water Resources, 109, 94–105. https://doi.org/10.1016/J.ADVWATRES.2017.09.008
Marçais, J., de Dreuzy, J. R., Ginn, T. R., Rousseau-Gueutin, P., & Leray, S.
(2015). Inferring transit time distributions from atmospheric tracer
data: Assessment of the predictive capacities of lumped parameter
models on a 3D crystalline aquifer model. Journal of Hydrology, 525(0),
619–631. https://doi.org/10.1016/j.jhydrol.2015.03.055Mason, B. J. (Ed.). (1991). The surface waters acidification programme. Cam-
bridge: Cambridge University Press.
McMahon, P. B., Plummer, L. N., Böhlke, J. K., Shapiro, S. D., &
Hinkle, S. R. (2011). A comparison of recharge rates in aquifers of the
United States based on groundwater-age data. Hydrogeology Journal,
19(4), 779–800. https://doi.org/10.1007/s10040-011-0722-5Michaelides, K., & Chappell, A. (2009). Connectivity as a concept for
characterising hydrological behaviour. Hydrological Processes, 23(3),
517–522. https://doi.org/10.1002/hyp.7214Modica, E., Buxton, H. T., & Plummer, L. N. (1998). Evaluating the source
and residence times of groundwater seepage to streams, New Jersey
KOLBE ET AL. 2187
coastal plain. Water Resources Research, 34(11), 2797–2810. https://doi.org/10.1029/98WR02472
Nyberg, L. (1995). Water flow path interactions with soil hydraulic proper-
ties in till soil at Gårdsjön, Sweden. Journal of Hydrology, 170(1–4),255–275. https://doi.org/10.1016/0022-1694(94)02667-Z
Nyberg, L., Stähli, M., Mellander, P.-E., & Bishop, K. H. (2001). Soil frost
effects on soil water and runoff dynamics along a boreal forest tran-
sect: 1. Field investigations. Hydrological Processes, 15(6), 909–926.https://doi.org/10.1002/hyp.256
Peralta-Tapia, A., Sponseller, R. A., Ågren, A., Tetzlaff, D., Soulsby, C., &
Laudon, H. (2015). Scale-dependent groundwater contributions influ-
ence patterns of winter baseflow stream chemistry in boreal catch-
ments. Journal of Geophysical Research: Biogeosciences, 120(5),
847–858. https://doi.org/10.1002/2014JG002878Peralta-Tapia, A., Sponseller, R. A., Tetzlaff, D., Soulsby, C., & Laudon, H.
(2015). Connecting precipitation inputs and soil flow pathways to
stream water in contrasting boreal catchments. Hydrological Processes,
29(16), 3546–3555. https://doi.org/10.1002/hyp.10300Pinder, G. F., & Celia, M. A. (2006). Subsurface hydrology. Hoboken, NJ:
Wiley.
Pollock, D. W. (1988). Semianalytical computation of path lines for finite-
difference models. Ground Water, 26(6), 743–750.Renard, P., & Allard, D. (2013). Connectivity metrics for subsurface flow
and transport. Advances in Water Resources, 51, 168–196. https://doi.org/10.1016/J.ADVWATRES.2011.12.001
Rodhe, A. (1989). On the generation of stream runoff in till soils. Hydrology
Research, 20(1), 1–8. https://doi.org/10.2166/nh.1989.0001Schwientek, M., Maloszewski, P., & Einsiedl, F. (2009). Effect of the unsat-
urated zone thickness on the distribution of water mean transit times
in a porous aquifer. Journal of Hydrology, 373(3–4), 516–526. https://doi.org/10.1016/j.jhydrol.2009.05.015
Strack, O. D. L. (1984). Three-dimensional streamlines in Dupuit-
Forchheimer models. Water Resources Research, 20(7), 812–822.https://doi.org/10.1029/WR020i007p00812
Troch, P., van Loon, E., & Hilberts, A. (2002). Analytical solutions to a
hillslope-storage kinematic wave equation for subsurface flow.
Advances in Water Resources, 25(6), 637–649. https://doi.org/10.
1016/S0309-1708(02)00017-9
Visser, A., Broers, H. P., Heerdink, R., & Bierkens, M. F. P. (2009). Trends in
pollutant concentrations in relation to time of recharge and reactive
transport at the groundwater body scale. Journal of Hydrology, 369
(3–4), 427–439. https://doi.org/10.1016/J.JHYDROL.2009.02.008
Vogel, J. C. (1967). Investigation of groundwater flow with radiocarbon. In
IAEA (Ed.), Isotopes in hydrology (p. 15). Vienna: IAEA.
How to cite this article: Kolbe T, Marçais J, de Dreuzy J-R,
Labasque T, Bishop K. Lagged rejuvenation of groundwater
indicates internal flow structures and hydrological
connectivity. Hydrological Processes. 2020;34:2176–2189.
https://doi.org/10.1002/hyp.13753
APPENDIX
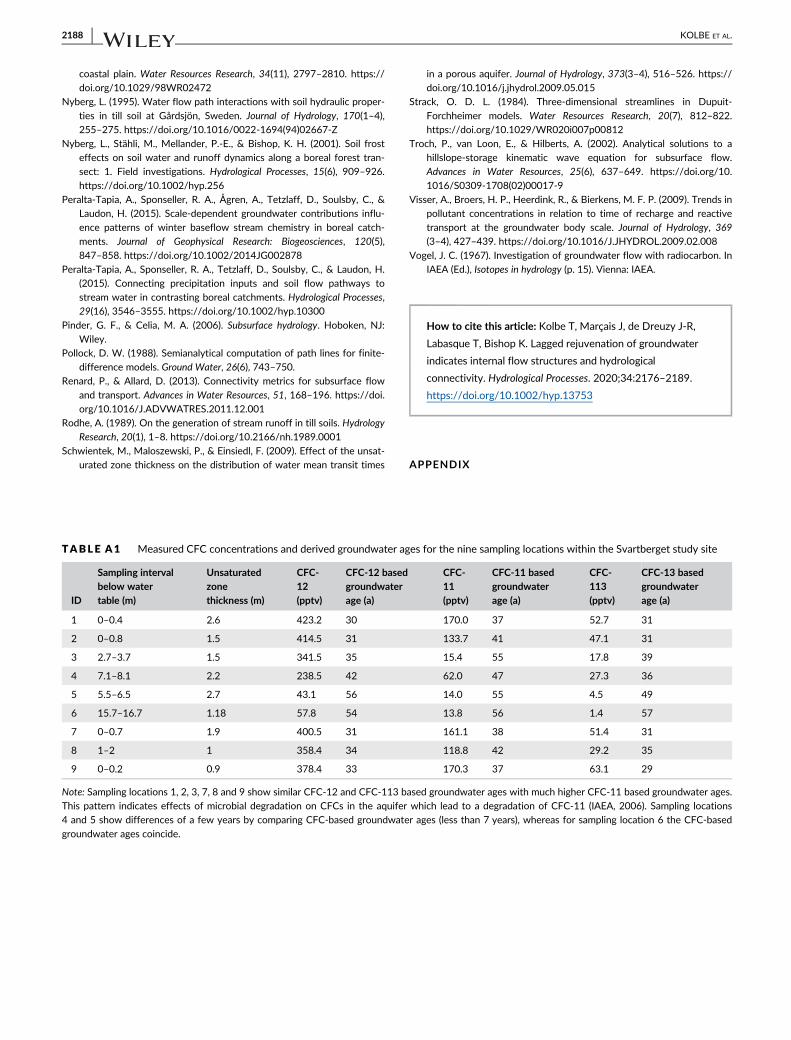
TABLE A1 Measured CFC concentrations and derived groundwater ages for the nine sampling locations within the Svartberget study site
ID
Sampling intervalbelow watertable (m)
Unsaturatedzonethickness (m)
CFC-12(pptv)
CFC-12 basedgroundwaterage (a)
CFC-11(pptv)
CFC-11 basedgroundwaterage (a)
CFC-113(pptv)
CFC-13 basedgroundwaterage (a)
1 0–0.4 2.6 423.2 30 170.0 37 52.7 31
2 0–0.8 1.5 414.5 31 133.7 41 47.1 31
3 2.7–3.7 1.5 341.5 35 15.4 55 17.8 39
4 7.1–8.1 2.2 238.5 42 62.0 47 27.3 36
5 5.5–6.5 2.7 43.1 56 14.0 55 4.5 49
6 15.7–16.7 1.18 57.8 54 13.8 56 1.4 57
7 0–0.7 1.9 400.5 31 161.1 38 51.4 31
8 1–2 1 358.4 34 118.8 42 29.2 35
9 0–0.2 0.9 378.4 33 170.3 37 63.1 29
Note: Sampling locations 1, 2, 3, 7, 8 and 9 show similar CFC-12 and CFC-113 based groundwater ages with much higher CFC-11 based groundwater ages.
This pattern indicates effects of microbial degradation on CFCs in the aquifer which lead to a degradation of CFC-11 (IAEA, 2006). Sampling locations
4 and 5 show differences of a few years by comparing CFC-based groundwater ages (less than 7 years), whereas for sampling location 6 the CFC-based
groundwater ages coincide.
2188 KOLBE ET AL.

TABLE A2 Modelled and measured CFC-12 concentrations for each of the nine sampling locations
ID
CFC-
12 modelled (pptv)
CFC-12
measured (pptv)
Mean residence time
(modelled) (a)
Apparent groundwater
age (a)
Mean travel
distance (m)
1 429 423 28 30 206
2 416 415 30 31 215
3 376 342 33 35 247
4 300 239 40 42 306
5 207 43 51 56 346
6 67 58 84 54 564
7 383 401 33 31 229
8 329 358 38 34 259
9 282 378 42 33 275
Note: The mean residence and mean travel distance of the particles reaching the sampling locations are derived from the calibrated model. The apparent
groundwater age is determined from measured CFC-12 concentrations.
KOLBE ET AL. 2189