lactic acid production using sweet potato processing waste
TRANSCRIPT
University of Arkansas, FayettevilleScholarWorks@UARK
Theses and Dissertations
8-2012
Lactic Acid Production Using Sweet PotatoProcessing WasteIrene PaganaUniversity of Arkansas, Fayetteville
Follow this and additional works at: http://scholarworks.uark.edu/etd
Part of the Food Microbiology Commons, and the Food Processing Commons
This Thesis is brought to you for free and open access by ScholarWorks@UARK. It has been accepted for inclusion in Theses and Dissertations by anauthorized administrator of ScholarWorks@UARK. For more information, please contact [email protected], [email protected].
Recommended CitationPagana, Irene, "Lactic Acid Production Using Sweet Potato Processing Waste" (2012). Theses and Dissertations. 439.http://scholarworks.uark.edu/etd/439

Lactic Acid Production Using Sweet Potato Processing Waste

Lactic Acid Production Using Sweet Potato Processing Waste
A thesis submitted in partial fulfillment
of the requirements for the degree of
Master of Science in Food Science
By
Irene Pagana
University of California at San Diego
Bachelor of Science in Biology, 1999
August 2012
University of Arkansas

ABSTRACT
Organic waste generated from industrial sweet potato canning is estimated to be 30% of
incoming raw material. This waste contains carbohydrates (sugars and starch) that could be used
as substrates for the production of useful compounds via fermentation (e.g. lactic acid), resulting
in the production of value-added products. The goal of this research project is to produce a
substrate from the sweet potato processing waste material that supports the growth of lactic acid
bacteria, which results in the production of lactic acid. The sweet potato waste product was
characterized, and found to contain 16.5% solids. The solids components were 18.5% ash, 4.4%
protein, and the rest assumed to be carbohydrates. The carbohydrate component was found to
contain 20.5% sugars, mostly in the form of sucrose, 19% soluble starch, and the rest assumed to
be fiber. Conditions for enzymatic starch hydrolysis were explored, and using 80U
glucoamylase/100 gram waste material for a 24 hour treatment at 35°C and pH 4 yielded a
greater than 95% conversion efficiency to glucose while minimizing total enzyme required.
Screening of 3 lactic acid bacteria strains in a control medium (YM Broth) yielded highest lactic
acid production by Lactobacillus rhamnosus. Different dilutions of the hydrolyzed sweet potato
waste, with and without pH control, were used as a fermentation substrate for L. rhamnosus, and
lactic acid production was highest in the undiluted hydrolyzed waste at pH set point 5.0, yielding
10g/L in 72 hours. Lactic acid production from sweet potato waste will provide a valuable
product from a waste stream for local processing facilities.

This thesis is approved for recommendation
to the Graduate Council.
Thesis Director:
___________________________________________ Dr. Ruben O Morawicki
Thesis Committee:
___________________________________________
Dr. Ya-Jane Wang
___________________________________________
Dr. Danielle Julie Carrier

THESIS DUPLICATION RELEASE
I hereby authorize the University of Arkansas Libraries to duplicate this thesis when needed for
research and/or scholarship.
Agreed _________________________________________
Irene Pagana
Refused _________________________________________
Irene Pagana
ACKNOWLEDGEMENTS
I would like to thank my advisor, Dr. Ruben Morawicki, for his guidance, patience, and
insight through the duration of my master’s thesis research. I would also like to thank my other
committee members, Dr. Ya-Jang Wang and Dr. Julie Carrier, for their invaluable scientific
guidance and advice. I thank my husband, Michael Pagana, and the rest of my family and friends
for their support. Lastly, I would like to especially thank my father, Ken Shackel, and my aunt,
Kathy King, whose constant pursuit of scientific knowledge is inspirational.

TABLE OF CONTENTS
CHAPTER 1: INTRODUCTION, PROJECT OBJECTIVES, AND LITERATURE
REVIEW.........................................................................................................................................1
INTRODUCTION.......................................................................................................................1
OBJECTIVES..............................................................................................................................3
LITERATURE REVIEW............................................................................................................3
Sweet potato processing and waste material production........................................................3
Fermentation of plant waste material.....................................................................................4
Importance of lactic acid.........................................................................................................5
Uses of lactic acid....................................................................................................................6
Lactic acid producing microorganisms.................................................................................10
Lactic acid production processes...........................................................................................15
Utilization of sweet potato waste product..............................................................................16
CHAPTER 2: TRANSFORMATION OF SWEET POTATO PROCESSING WASTE
INTO A FERMENTABLE SUBSTRATE.................................................................................18
INTRODUCTION.....................................................................................................................18
MATERIALS AND METHODS..............................................................................................18
Characterization of sweet potato processing waste...............................................................18
Solids content.....................................................................................................................19
Preparation of dried material for analyses.........................................................................19
Sugar and starch determination.........................................................................................19
Sugars analysis..................................................................................................................21
Ash content........................................................................................................................21
Protein, total nitrogen, and mineral analysis.....................................................................22
Thermal properties.............................................................................................................22
Hydrolysis of sweet potato processing waste.........................................................................22
Pre-hydrolysis treatment....................................................................................................22
Enzyme hydrolysis.............................................................................................................24
Statistical analysis.................................................................................................................27
RESULTS AND DISCUSSION................................................................................................29
Characterization of sweet potato processing waste...............................................................29
Hydrolysis of sweet potato processing waste.........................................................................31
Pre-hydrolysis treatment....................................................................................................31
Enzyme hydrolysis.............................................................................................................33
CONCLUSION..........................................................................................................................41
CHAPTER 3: FERMENTATION OF HYDROLYZED SWEET POTATO
PROCESSING WASTE..............................................................................................................42
INTRODUCTION.....................................................................................................................42
MATERIALS AND METHODS..............................................................................................42
Materials................................................................................................................................42
Methods..................................................................................................................................44
Growth and proliferation....................................................................................................44
Fermentation......................................................................................................................47
Glucose and lactic acid analysis........................................................................................49
Statistical analysis.................................................................................................................49

RESULTS AND DISCUSSION................................................................................................50
Comparison of LAB strains for growth and production........................................................50
Comparison of control medium to hydrolyzed sweet potato waste material.........................57
Production in hydrolyzed sweet potato waste material with pH control...............................60
CONCLUSION..........................................................................................................................65
CHAPTER 4: CONCLUSIONS AND FUTURE RESEARCH..............................................66
REFERENCES............................................................................................................................67
APPENDIX 1: VERIFICATION OF HPSEC-RI COLUMN PERFORMANCE................74
APPENDIX 2: HPSEC-RI PROFILES OF SWEET POTATO PROCESSING WASTE
WITH SPIKES OF GLUCOSE, FRUCTOSE, AND SUCROSE..........................................75
APPENDIX 3: HPLC PROFILE OF L.RHAMNOSUS CULTURE SUPERNATANTS.....76

LIST OF FIGURES
FIGURE 1.1 Common chemical reaction pathways of lactic acid
FIGURE 1.2 Stereoisomeric forms of lactic acid
FIGURE 2.1 Schematic representation of pre-hydrolysis treatment of sweet potato waste
FIGURE 2.2 Changes in reducing sugars on 1 g of sweet potato waste by the action of
18 mg α-amylase
FIGURE 2.3 Sweet potato processing waste hydrolysis at 3 h with α-amylase and
glucoamylase
FIGURE 2.4A-D HPSEC-RI profiles of sweet potato waste samples after 3 h with enzymatic
treatments
FIGURE 2.5 Hydrolysis of sweet potato waste by glucoamylase (U/100g waste)
FIGURE 3.1 Hausser brightline hemacytometer
FIGURE 3.2 Magnified hemacytometer counting chamber grid
FIGURE 3.3 Hemacytometer counts (VC/mL) of L. bulgaricus, L. delbrueckii, and
L. rhamnosus during growth in traditional media
FIGURE 3.4 The pH measurements of L. bulgaricus, L. delbrueckii, and L. rhamnosus
during growth in traditional media
FIGURE 3.5 Glucose concentration of L. bulgaricus, L. delbrueckii, and L. rhamnosus
during growth in traditional media
FIGURE 3.6 Lactic acid production of L. bulgaricus, L. delbrueckii, and L. rhamnosus
during growth in traditional media
FIGURE 3.7 L. bulgaricus lactic acid production kinetics
FIGURE 3.8 L. delbrueckii lactic acid production kinetics
FIGURE 3.9 L. rhamnosus lactic acid production kinetics
FIGURE 3.10 Hemacytometer cell counts (VC/mL) of L. rhamnosus grown in control
medium and hydrolyzed sweet potato waste
FIGURE 3.11 The pH values of L. rhamnosus grown in control medium and hydrolyzed
sweet potato waste
FIGURE 3.12 The glucose concentration at various time intervals of L. rhamnosus
growth
FIGURE 3.13 L. rhamnosus lactic acid production in control medium and hydrolyzed
sweet potato waste
FIGURE 3.14 Hemacytometer cell counts (VC/mL) of L. rhamnosus grown in undiluted
hydrolyzed sweet potato waste with various pH set points
FIGURE 3.15 The pH during growth of L. rhamnosus in undiluted hydrolyzed sweet
potato waste
FIGURE 3.16 Glucose concentrations during growth of L. rhamnosus in undiluted
hydrolyzed sweet potato waste
FIGURE 3.17 Lactic acid production during growth of L. rhamnosus in undiluted
hydrolyzed sweet potato waste

LIST OF TABLES
TABLE 1.1 Fermentation patterns and isomeric forms of lactic acid generated by
various microorganisms
TABLE 1.2 Lactic acid production by various lactic acid-producing bacteria using a
variety of biomass substrates
TABLE 2.1 Enzyme concentration used for each experimental condition
TABLE 2.2 Randomized blocks for enzyme hydrolysis
TABLE 2.3 Glucoamylase concentrations in randomized flask conditions
TABLE 2.4 Comparison of defined media formulations to whole sweet potato and the
sweet potato waste material
TABLE 2.5 Glucose concentrations resulting from enzyme hydrolysis of pre-treated
sweet potato processing waste
TABLE 3.1 Characteristics of LAB strains
TABLE 3.2 Waste material dilutions and final glucose concentrations
1
Chapter 1: INTRODUCTION, PROJECT OBJECTIVES, AND LITERATURE REVIEW
INTRODUCTION
The transformation of fruit and vegetable wastes from the food industry into value-added
products is desirable economically as well as environmentally. Plant materials that are either
composted or used as animal feed contain nutrients and carbon, which can be transformed into a
new product with unique or enhanced functionality. The canning industry estimates that up to
30% of the incoming raw material is designated as waste and not used for human consumption
(Schaub et al. 1996). Byproducts of the canning industry are usually discarded, composted, or
fed to ruminants. Other possible uses include extraction of bioactive compounds (Eguees et al.
2012, Babbar et al. 2011) and fermentation to produce a variety of value-added chemicals
(Kroyer 1991, Haddadin et al. 2001).
Previous research has shown that it is possible to use fruit, vegetable, and grain
byproducts as a base for fermentation media (Huang et al. 2005, John et al. 2007, Nakanishi et al.
2010, Shindo et al. 2004). Examples of waste streams previously evaluated include different fruit
pomaces, corn husks, sugarcane bagasse, spent grain, trimming vine shoots, and potato
processing wastewater. Products resulting from fermentation of canning wastes, such as ethanol,
methane, microbial protein, and lactic acid, have been researched and show potential for value
addition (Nigam 1999, Hills et al. 1982, El-Masry et al. 1991, John et al. 2005).
Production of lactic acid is desirable because it is prevalent in our food system and has
many uses, including flavor enhancement, preservation, and pH control. Not only is the use of
lactic acid well-documented and widely used as a food additive, it is also utilized in other
industries including bioplastics, chemicals, and cosmetics. Currently, lactic acid is being
2
produced by lactic acid bacteria (LAB) on a commercial scale with raw materials such as corn
starch (in the northern hemisphere) and cane sugar (in tropical and semitropical countries)
(Calabia et al. 2007).
LAB have been utilized for food preservation and flavor development for hundreds of
years and, over the years, the widespread use of LAB has resulted in the availability of a wide
variety of strains. Fermentations using certain LAB produce almost exclusively D (-) or L (+)
lactic acid, of which L (+) is the preferred form for the bioplastics industry (Datta et al. 1995).
Each strain has a different growth curve as well as different environmental and medium
requirements for acceptable yields. Conditions for optimal growth and lactic acid production
must be evaluated and optimized for each strain. The parameters requiring optimization include,
but are not limited to, the following: nutrients for growth and production, temperature, pH, time,
vessel size, and oxygen.
The processing of sweet potatoes generates a waste byproduct rich in minerals,
polysaccharides, and free sugars. With enzyme treatments, the starch can be broken down into
glucose, yielding a greater concentration of free sugars that may be a rich substrate for
fermentation. Production of lactic acid via fermentation of raw starch derived from sweet potato
has been successfully tested (Wongkhalaung 1995), but not waste material from sweet potato
processing.
The first goal of this project was to produce a fermentation substrate from the waste
stream of sweet potato processing that has the potential to support the growth of lactic acid
bacteria and the production of lactic acid. The second goal of this project was to find a LAB
strain that can grow and produce lactic acid with minimal supplementation of the sweet potato
3
substrate. The overall project goal was to put together a system that allows for an efficient use
and economical transformation of the sweet potato waste material generated by the canning and
processing industry.
OBJECTIVES
Objective 1: Determine suitable conditions for the conversion of sweet potato byproduct from
the food processing industry into a substrate suitable for subsequent fermentation into lactic acid.
Objective 2: Screen lactic acid bacteria strains to maximize the production of lactic acid using
substrate obtained in objective 1.
LITERATURE REVIEW
Sweet potato processing and waste material production
Sweet potato is a worldwide crop with production of over 100 million metric tons in 2009
(USDA Economics, Statistics, and Market Information website, 2012). The USDA estimates that
approximately 5% of total sweet potato production is lost during processing, generating 5 million
metric tons of waste annually (USDA Economics, Statistics, and Market Information website,
2012). Approximately 25% of all sweet potatoes produced in the US are canned, while the
remainder are purchased fresh or processed into frozen and dried products (Economic Research
Service, 2002). The canning industry generates up to 50% waste from the incoming raw material
(BOA, 1983).
Much of the usable waste from sweet potato canning processes is generated during the
peeling process. The peeling operation can be accomplished by several methods, including
mechanical abrasion, sodium hydroxide (lye), and high pressure steam. Mechanical abrasion is
4
seldomly used commercially due to excessive yield losses (Edmond, 1971), and lye peeling,
although efficient, results in the generation of large amounts of caustic waste and can discolor
the flesh (Walter and Schadel, 1982). Steam peeling, consisting of a short duration of exposure to
super heated steam and subsequent water washing, is an efficient and less wasteful peeling
process (Smith et al. 1983). Washings are high in nutrients including starch and free sugars, as
well as minerals and other trace elements (Colston and Smallwood Jr, 1973, Olaoye and Sanni,
1988).
Fermentation of plant waste materials
Since plant waste products from the canning industry can be high in nutrients, interest in
the use of these products for other than composting or animal feed has been growing. Knol et al.
(1978) proved the feasibility of producing biogas from fruit and vegetable canning wastes. Paige
and Boulton (1978) concluded that production of ethanol from canning and agricultural wastes
was economically viable. More recently, Del Campo et al. (2006) explored the production of
bioethanol from tomato, roasted red pepper, and artichoke wastes. Production of these value
added products is generally accomplished via fermentation with microorganisms, since a range
of products from biofuels to drugs to chemicals can be generated (Du et al. 2011).
Fermentation using microorganisms requires the generation of a usable energy source
from these plant waste materials, mainly carbohydrates. These can be in the form of refined (ex.
glucose, sucrose, and starch) or complex (cellulose, whole cereal grains, and waste materials).
However, the fermentation organism does not have the ability to convert these carbohydrates into
glucose for energy of growth and maintenance, so pretreatment of the plant waste material will
be necessary (Litchfield, 1996). Efficient hydrolysis of gelatinized starch generally requires

5
multiple enzymes or acid hydrolysis. Enzymatic hydrolysis is preferable to the use of acid due to
the toxic compounds formed during acid treatment (Gurgel et al. 1998). The enzymes previously
used for sweet potato starch hydrolysis include α-amylase, β-amylase, and glucoamylase (Baba
and Kainuma, 1987, Chang Rupp and Schwartz, 1988, Noda et al. 1992). Alpha-amylase causes
endohydrolysis of α-1,4 linkages and works quickly to reduce molecular weight and decrease
viscocity. Beta-amylase causes exohydrolysis from α-1,4 linkages, releasing individual maltose
units. Glucoamylase causes successive exohydrolysis of α-1,4 linkages, as well as α-1,6 linkages
to a slower extent, and results in glucose formation from starch. Alpha-amylase is commonly
used in laundry detergents to enhance stain removal, so large quantities are available at a low
cost, and the combination of α-amylase and glucoamylase is often used as a cost-effective,
enzymatic method to degrade starch into glucose (Kirk-Othmer, 2004). The energy source
generated by starch hydrolysis, namely glucose, is required by most microorganisms during
fermentation in order to manufacture the chemicals that are value-added products. One of the
chemicals of interest produced via fermentation is lactic acid, mainly produced by lactic acid
bacteria.
Importance of lactic acid
Lactic acid and LAB have been part of our food system for thousands of years; however,
the mechanism for preservation and sensory qualities bestowed by these bacteria was not
understood until the 19th
century with technological advances in microbiology. Since then,
studies have demonstrated that LAB not only produce compounds that decrease pH but also a
variety of antimicrobial agents that discourage the growth of other microbes (Vandenbergh
1993). In the food industry, lactic acid is used as a preservative, flavouring agent, pH buffer, and
acidulant (Narayanan et al. 2004). It is estimated that global demand will be 259,000 metric tons
6
by 2012 and 328,900 metric tons by 2015 (Global Industry Analysts 2011). NatureWorks LLC
(Blaine, Nebraska, USA) currently produces 140,000 metric tons (400 million pounds) of lactic
acid annually, and is currently looking for a site to build a second lactic acid facility (Vink et al.
2007). Lactic acid is one of the most widely used chemicals, not only in food, but also in the
medical, pharmaceutical, plastics, and cosmetic industries.
Uses of lactic acid
Lactic acid, 2-hydroxy-propanoic acid, is widely used because the structure lends itself to
a variety of chemical reactions—it consists of both a hydroxyl group and a carboxylic acid
group, as shown in Figure 1.1.

7
Figure 1.1. Common chemical reaction pathways of lactic acid (Fan et al. 2009)

8
Polymerization of lactic acid, with generation of dilactide as an intermediate, generates
poly lactic acid (PLA) (Figure 1.1). Commercially used as a bioplastic, this polymer can be
employed in a variety of applications ranging from clothing fibers to films to paper coatings
(Pang et al. 2010). Several research groups have been developing processes to produce PLA
materials, resulting in products that have similar crystallinity, glass transition temperatures,
melting temperatures, and flexibility as petroleum based plastic products (Nijenhuis et al. 1996,
Ouchi et al. 2003, Sarasua et al. 1998, Tsuji 2002, Wang et al. 2006). These groups have found
that a pure form of lactic acid allows for greater control of the final PLA product during
manufacturing. Two stereoisomers of lactic acid exist, L (+) and D (-) (Figure 1.2), and the
physical properties of PLA are directly influenced by the isomer used to manufacture this
material. Stereospecificity of the precursor for the production of PLA determines the clarity,
melting point, and strength of the bioplastic. Racemic lactic acid mixtures produce non-
crystalline PLA polymers with very low glass-transition temperatures and low melting points
(Pang et al. 2010). When first produced, PLA production was an expensive and labor intensive
process to go from fermentation substrate input to plastic output. Advances in technology, as
well as the opening of the first large scale polylactide (PLA) plant in 2002, have reduced the
production costs and enhanced the quality of PLA, making it more competitive with petroleum-
based plastics (Carole et al. 2004).

9
L (+) Lactic Acid D (-) Lactic Acid
Figure 1.2. Stereoisomeric forms of lactic acid

10
Recent studies predict a 37% increase in the consumption of bio-based plastics from 2007
to 2013 (Shen et al. 2009). Based on a report by the U.S. Department of Energy, PLA is one of
the top three bio-based plastics, and lactic acid is in the top 30 for value-added chemicals from
biomass (Energy Efficiency and Renewable Energy, 2004). Lactic acid can be produced via
chemical synthesis from fossil fuel feedstocks such as petroleum and natural gas. However, the
input is derived from a non-renewable source and the process generates a racemic mixture of
isomers, which is undesirable for the production of PLA, but microbiological fermentation can
yield either a mixture or a pure form of L (+) or D (-) depending on the LAB strain used (Caplice
et al. 1999).
Lactic acid producing microorganisms
The physical properties and characteristics of PLA products depend on the form of lactic
acid isomer used, which in turn depends on the organism used to produce it. Table 1.1 lists the
fermentation pattern as well as the isomer produced by selected lactic acid-producing bacteria
and fungi. LAB are gram-positive, facultative anaerobes or microaerophilic, and are classified as
either homofermentative or heterofermentative. Homofermentative LAB produce lactic acid
without other metabolic byproducts and a theoretical conversion of 1 mole glucose to 2 moles
lactic acid. Heterofermentative LAB produce lactic acid as well as other byproducts including
ethanol, diacetyl, and carbon dioxide; thus, conversion of 1 mol glucose results in less than 2 mol
lactic acid. For this reason, homofermentative LAB strains under ideal conditions have the
ability to produce higher lactic acid yields than heterofermentative strains (Litchfield 1996).

11
Table 1.1. Fermentation patterns and isomeric forms of lactic acid generated by various
microorganisms (Litchfield 1996)
Organism Fermentation Pattern Lactic Acid Isomer
Bacteria
Bacillus coagulans Heterofermentative L (+)
Bacillus laevolacticus Heterofermentative D (-)
Lactobacillus amylophilus Homofermentative L (+)
Lactobacillus amylovorus Homofermentative D/L
Lactobacillus casei subsp. casei Heterofermentative L (+)
Lactobacillus delbruekii subsp.
bulgaricus
Homofermentative D (-)
Lactobacillus helveticus Homofermentative D/L
Lactobacillus rhamnosus Heterofermentative L (+)
Lactococcus lactis subsp. lactis
subsp. cremoris
Homofermentative L (+)
Streptococcus faecalis Homofermentative L (+)
Streptococcus thermophilus Homofermentative L (+)
Sporolactobacillus inulinis Homofermentative D (-)
Fungi
Rhizopus arrhizus Heterofermentative L (+)
Rhizopus delmar Heterofermentative L (+)
Rhizopus oryzae Heterofermentative L (+)
Rhizopus stolonifer Heterofermentative L (+)
Rhizopus sp. G-36 Heterofermentative L (+)
12
Fungi are also used for lactic acid production, most commonly Rhizopus arrhizus and
Rhizopus oryzae. Yields from direct fermentation of potato starch wastewater with Rhizopus
arrhizus and Rhizopus oryzae were 1.02 g lactic acid/g starch and 0.78 g lactic acid/g starch,
respectively, and the maximum productivities (per liter of wastewater) were 0.67 g/L/h and 0.40
g/L/h, respectively (Huang et al. 2005). Furthermore, using Rhizopus arrhizus to ferment waste
potato starch, Zhang et al. (2010) reported a lactic acid yield of 0.865 g lactic acid/g glucose with
a maximum productivity of 2.2 g/L/h. Both studies produced similar values for conversion of
glucose to lactic acid, but Zhang et al. (2010) reported a volumetric productivity of 3-5 times
higher than Huang et al. (2005).
Although the advantages of using fungi include a simpler nutrient requirement, the
capability to hydrolyze starch, and the means to metabolize high concentrations of glucose, the
main disadvantage is the production of high levels of byproduct, including ethanol and fumaric
acid (John et al. 2007). Even though recent yields from fungi-based systems indicate that this
might be a viable production system, the predominant lactic acid production systems continue to
be based on LAB (John et al. 2007).
According to Litchfield (1996), the best bacterial strain for lactic acid production depends
on the desired isomer, input substrate, production process temperature and pH, and productivity.
One common bacterial strain used for lactic acid production is Lactobacillus delbrueckii. Ray et
al. (1991) reported that the strain was capable of a lactic acid yield of 69% on the basis of
glucose weight (0.69 g lactic acid/g glucose). More recently, John et al. (2005) reported that L.
delbrueckii produced 0.249 g lactic acid/g starch under nutrient limited conditions and without
pH control. Another study utilizing L. delbrueckii was published recently by Lu et al. (2009) in
which unpolished rice saccharificate, wheat bran powder, and yeast extract were used as the

13
culture medium. The lactic acid yield was 0.73 g/g starch and the productivity rate was 1.5 g/L/h.
Fukushima et al. (2004) reported large-scale lactic acid yields of 0.66 g/g sugar. The main carbon
source in the medium was hydrolyzed rice starch, and the strains screened in the study were: (1)
seven different lactobacilli strains, including L. casei, L. bulgaricus, L. delbrueckii, L. helveticus;
(2) five different lactococci strains; and (3) two sporolactobacilli strains. Overall, the L.
delbrueckii strains produced the most lactic acid.
Other strains that have been used for the production of lactic acid from a variety of
substrates are Lactobacillus rhamnosus, Lactobacillus lactis, Lactobacillus paracasei,
Lactobacillus pentosus, and Lactobacillus amylophilus (Table 1.2). Shindo et al. (2004)
fermented spent grain, a by-product of beer production, with L. rhamnosus; the fermentation
yielded 0.475 g/g sugar. L. lactic is reported to utilize cellobiose efficiently with yields as high as
0.8 g lactic acid/g cellobiose with a maximum productivity rate of 1.66 g/L/h (Singhvi et al.
2010). Nakanishi et al. (2010) used L. paracasei to ferment sugars from canned pineapple syrup
and were able to generate 0.93 g/g sugar in a pH controlled process. Additionally, Bustos et al.
(2005) used L. pentosus to produce lactic acid at a rate of 0.36 g/L/h from trimming waste of
vine shoots while Altaf et al. (2007) used L. amylophilus to produce 0.78 g lactic acid/g starch
from corn flour supplemented with red lentil flour and baker’s yeast.
A comparison of these studies (Table 1.2) reveals there is not one “perfect”
microorganism for the production of lactic acid, but the best candidate depends on available
nutrients, duration of production process, and method of production. Since production of lactic
acid from canning byproducts must be economically viable, using the best possible
microorganism for fermentation is crucial to optimizing production and maximizing product
output.

14
Table 1.2. Lactic acid production by various lactic acid-producing bacteria using a variety of
biomass substrates (Wang et al. 2010)
Lactic Acid
Substrate
Organism
Concentration
(g/L)
Productivity
(g/L/h)
Yield
(g/g substrate)
Alfalfa Fibers L. delbrueckii 35.4 0.75 0.35
L. plantarum 46.4 0.64 0.46
Apple Pomace L. rhamnosus 32.5 5.4 0.88
Barley Bran Hydrolysates L. pentosus 33.0 0.60 0.57
Cellobiose and Cellotriose L. delbrueckii 90.0 2.3 0.90
Cellulose L. delbrueckii 65.0 0.18 -
Corncob L. pentosus 26.0 0.34 0.53
Lignocellulosic
Hydrolysates
L. sp RKY2 27.0 6.7 0.90
Molasses L. delbrueckii 166 4.2 0.87
L. rhamnosus 73.0 2.9 0.97
Paper Sludge B. coagulan 36D1 92.0 0.96 0.77
B. coagulan P4-
102B
91.7 0.82 0.78
Rice Bran L. delbrueckii 28.0 0.78 0.28
Sugarcane Bagasse Bacillus sp. strain 55.5 0.39 0.77
Lactococcus lactis 10.9 0.17 0.36
Trimming Vine Shoots L. pentosus 24.0 0.51 0.76
Wastepaper L. delbrueckii 31.0 - -
Wheat Bran Hydrolysate L. bifermentans 62.8 1.2 0.83
Wood Hydrolysate Enterococcus
faecalis
93.0 1.7 0.93
Xylose L. plantarum 41.2 - 0.82
Corncob Molasses Bacillus sp. strain 74.7 0.38 0.50

15
Lactic acid production processes
Even though lactic acid production capability is dictated, to a large extent, by the
microorganism used for fermentation, the media and process are also significant factors in
determining the success of a production process, with growth medium being a key factor. In
testing various carbon sources, Olaoye et al. (2008) found that glucose and galactose were the
preferred carbon sources for various strains of Lactobacillus pediococcus, while Calabia et al.
(2007) found that sucrose from sugar cane and sugar beet juice was an acceptable carbon source,
without modification, for L. delbruekii. In contrast, Chervaux et al. (2000) found the fastest
growth in 22 different strains occurred with media comprised of lactose as opposed to glucose,
mannose, or fructose. Nitrogen sources are also an important factor in microbial growth media,
and commercial formulations for LAB, such as LB Broth and MRS Broth, contain protein
hydrolysates from soy, casein, meat, yeast, or other sources. As sweet potatoes are low in overall
protein content (Purcell et al. 1978), choosing the appropriate LAB strain will be critical because
the addition of supplements would decrease the economic benefit of transforming this waste into
a value-added product.
Although growth medium is a key factor in determining success of a fermentation process,
mode of production is also important. The three main modes of production used for fermentation
are batch, fed-batch, and continuous. Continuous production, also called perfusion, is an
effective method to achieve high cell densities and produce large quantities of product (Ohashi et
al. 1999). Unfortunately, bench-top versions of this production mode require specialized,
expensive equipment and extensive optimization. The time and money investment for this
technology renders it impractical for most applications. Alternatively, current batch and fed-
batch technologies are simple, inexpensive, and high throughput compared with perfusion

16
(Huber et al. 2009). Shake flasks are a reasonable representative of the bioreactor batch mode,
and are a commonly used method for small scale development and optimization of lactic acid
production using LAB (Mel et al. 2008, Yu et al. 2008, De Lima et al. 2010).
Utilization of sweet potato waste product
Ray and Ward (2006) specifically mention sweet potato waste may be a good candidate
for microbial fermentation due to the abundant supply in several Asian countries. Furthermore, it
is currently only being used as animal feed. Sistrunk and Karim (1977) showed that fermentation
of lye-peelings from sweet potatoes extends storage life for livestock feed. In addition, sweet
potato residue has been fermented to generate tetracycline (Yang et al. 1989, Yang et al. 1990),
microbial proteins (Yang 1993, Aziz et al. 2002, Wang et al. 2008), and ethanol (Moore et al.
2008). However, in each study, the sweet potato residue is generated in the lab by peeling the
raw potatoes, steaming the flesh, and sieving to break up large clumps. Several studies examine
fermentation of sweet potato with lactic acid bacteria (Ray et al. 1991, Jiang et al. 1993,
Wongkhalaung 1995), but the fermentation substrate is always the flesh of the sweet potato–raw,
cooked, or dried. Sweet potato flesh has been used to make several valuable products, including
ethanol, citric and lactic acid, and sugar syrups (Palaniswami et al. 2008).
Studies on the nutritional properties of sweet potatoes indicate the presence of several
essential amino acids (Purcell et al. 1978), high levels of starch and free sugars (Ravindran et al.
1995), and a peel composition of cellulose, pectic substances, and hemicellulose (Noda et al.
1994). However, it is noted by Noda et al. (1992) that starch properties and chemical
composition is subject to cultivar and tuber developmental stage. Type of sweet potato
processing, whether they are peeled via mechanical methods, with lye, or by steam, also affects

17
the chemical composition of the processing waste. Previous research involves the use of sugar
generated from sweet potato starch, so it is very likely that the residual starch in sweet potato
processing waste could be converted to glucose and used for the same purpose. No research
exists on the fermentation of sweet potato processing waste from a canning facility for
production of a value added product.

18
Chapter 2: TRANSFORMATION OF SWEET POTATO PROCESSING WASTE INTO
A FERMENTABLE SUBSTRATE
INTRODUCTION
Waste from the sweet potato canning process is a potential source of nutrients that can be
turned into useful products via fermentation. Fermentation of several different plant waste
materials has already been proven possible, and in some cases, economically viable. Sweet
potatoes are produced globally, potentially providing an endless stream of substrate for
transformation. Fermentation requires a usable carbon source, which is generally glucose. This is
obtained through hydrolysis of starch, and several enzymes specifically and efficiently complete
this task. Enzymes can be a costly reagent in this type of process, and it is important to minimize
their cost as much as possible, since this is a process for turning waste material into a value
added product.
Objective 1: Determine suitable conditions for the conversion of sweet potato byproduct from
the food processing industry into a substrate suitable for subsequent fermentation into lactic acid.
MATERIALS AND METHODS
A 20-gallon bucket of sweet potato waste material harvested at the steam peeler
discharge—primarily comprised of peel and water with residual flesh—was provided by Allen
Canning, Inc. (Siloam Springs, AR, USA) in September 2010.
Characterization of sweet potato processing waste
The sweet potato waste was divided into gallon-sized Ziploc© bags with each bag
containing 480-500g. Bags were stored at -20°C until use. To thaw waste material, bags were
held at 4°C for 48-72 h, or until the waste material was free of ice crystals.
19
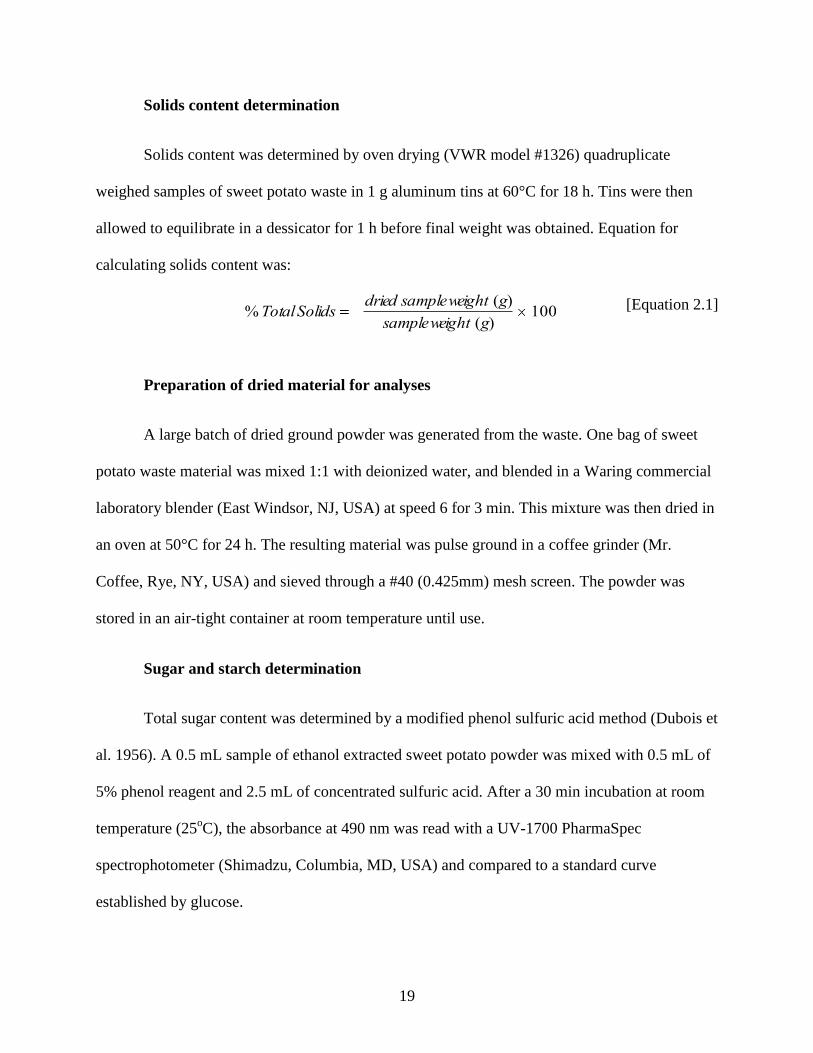
Solids content determination
Solids content was determined by oven drying (VWR model #1326) quadruplicate
weighed samples of sweet potato waste in 1 g aluminum tins at 60°C for 18 h. Tins were then
allowed to equilibrate in a dessicator for 1 h before final weight was obtained. Equation for
calculating solids content was:
[Equation 2.1]
Preparation of dried material for analyses
A large batch of dried ground powder was generated from the waste. One bag of sweet
potato waste material was mixed 1:1 with deionized water, and blended in a Waring commercial
laboratory blender (East Windsor, NJ, USA) at speed 6 for 3 min. This mixture was then dried in
an oven at 50°C for 24 h. The resulting material was pulse ground in a coffee grinder (Mr.
Coffee, Rye, NY, USA) and sieved through a #40 (0.425mm) mesh screen. The powder was
stored in an air-tight container at room temperature until use.
Sugar and starch determination
Total sugar content was determined by a modified phenol sulfuric acid method (Dubois et
al. 1956). A 0.5 mL sample of ethanol extracted sweet potato powder was mixed with 0.5 mL of
5% phenol reagent and 2.5 mL of concentrated sulfuric acid. After a 30 min incubation at room
temperature (25oC), the absorbance at 490 nm was read with a UV-1700 PharmaSpec
spectrophotometer (Shimadzu, Columbia, MD, USA) and compared to a standard curve
established by glucose.
%TotalSolidsdried sampleweight (g)
sampleweight (g)100

20
Total starch was determined using Megazyme’s Total Starch assay kit (Dublin, Ireland)
after an ethanol pre-wash step to remove free sugars. The ethanol pre-wash procedure was the
addition of 5.0 mL of 80% (v/v) aqueous ethanol to 100 mg sample in a 15 mL centrifuge tube,
with incubation at 85°C for 5 min. Then an additional 5 mL of ethanol was added, and the
contents were mixed on a vortex mixer. The tube was centrifuged for 10 min at 1,800 x g in a
Beckman Coulter Allegra X-22R with SX4250 rotor, and the supernatant was discarded. The
pellet was resuspended in 10 mL of 80% aqueous ethanol, and mixed on a vortex mixer. The
tube was centrifuged at 1,800 x g for 10 min, and the supernatant was carefully removed. The
resulting pellet was used for total starch determination by addition 3 mL of thermostable α-
amylase (100 U/mL in 100 mM sodium acetate buffer, pH 5.0) and incubation in a boiling water
bath for 12 min, with vortex mixing at 4, 8, and 12 min. The tube was then placed in a 50°C
water bath for 5 min, and 0.1 mL of amyloglucosidase (3300 U/mL) was added, mixed by
vortexing, and incubated at 50°C for 30 min. The volume of tube was then adjusted to 10 mL
with deionized water, and centrifuged at 1,800 x g for 10 min. 1.0 mL of supernatant was diluted
with 9.0 mL deionized water, and 0.1 mL of this solution was transferred to the bottom of a glass
test tube (16x100 mm). 3.0 mL of Glucose Determining Reagent (glucose oxidase plus
peroxidase plus 4-aminoantipyrine in 1.0 M potassium phosphate buffer with 0.22 M p-
hydrobenzoic acid and 0.4% sodium azide) was added, and the tube was incubated at 50°C for 20
min. Absorbance at 510 nm was read and compared with the D-glucose control. Calculation of
total starch was as follows:
[Equation 2.2]
Where:
ΔA = Absorbance of sample at 510 nm read against a reagent blank
ΔAbs = Absorbance of glucose standard at 510 nm read against a reagent blank
%Starch A9
Abs
21
Sugars analysis
The identity of sugars in the sweet potato processing waste was determined using high-
performance size exclusion chromatography with refractive index detection (HPSEC-RI)
(Waters, Milford, MA, USA). The system consisted of a 1515 HPLC pump with a manual
injector valve, a 50-μL sample loop, and a 2410 refractive index detector maintained at 40 ºC.
Sugars were separated by two Shodex columns, an OH Pack SB-802 HQ (300 x 8 mm), and an
OH Pack SB-804 HQ (300 x 8 mm) connected in series and maintained at 55ºC by a column
heater, preceded by a Shodex OH pack SB-G (50 x 6 mm) guard column. The mobile phase was
0.1 M NaNO3 with 0.2% NaN3 (NaNO3 8.499 g + NaN3 0.2 g in 1 L distilled water) at a flow
rate of 0.4 mL/min. Samples for HPSEC-RI were prepared by adding 5 g of sweet potato waste
powder to 25 g HPLC grade water, and mixing at 50°C for 15 min. Samples were then
centrifuged at 1,800 x g for 10 min and the resulting supernatant was filtered through a 0.45-μm
nylon membrane before injection.
Ash content
Ash content of the sweet potato waste was determined using a modified AACC method
08-17, Ash in Starch. Triplicate crucibles were first placed in a muffle furnace and held at 600°C
for one h, and then allowed to equilibrate to room temperature in a dessicator overnight. Three g
of sweet potato waste powder were added to each crucible, heated on a hot plate until fully
carbonized, placed in a muffle furnace, and burned at 600°C for 16 h. Crucibles containing the
burned sample were then placed in a dessicator and cooled to room temperature for one h before
weighing. Calculation of ash content was as follows:
[Equation 2.3]
% Ash (as is)Ash weight (g)
Sample weight (g)100

22
Protein, total nitrogen, and mineral analysis
Protein and mineral analysis were conducted by a contract lab (Agricultural Diagnostic
Laboratory, Fayetteville, AR, USA). Total nitrogen was determined using combustion with
LECO FP428 nitrogen analyzer, and mineral elements were determined using a concentrated
nitric acid/hydrogen peroxide digest on a heated block and analysis by SPECTRO ICP.
Thermal properties
Thermal properties were assessed by a differential scanning calorimeter (DSC, Perkin-
Elmer Co., Norwalk, Conn., USA). Approximately 10 mg of sweet potato waste powder was
weighed into a steel DSC pan, and 20 µL of deionized water was added with a microsyringe. The
mixture was hermetically sealed and equilibrated at room temperature for 24 h prior to heating
from 25°C to 120°C at 10°C/min. An empty pan was used as reference.
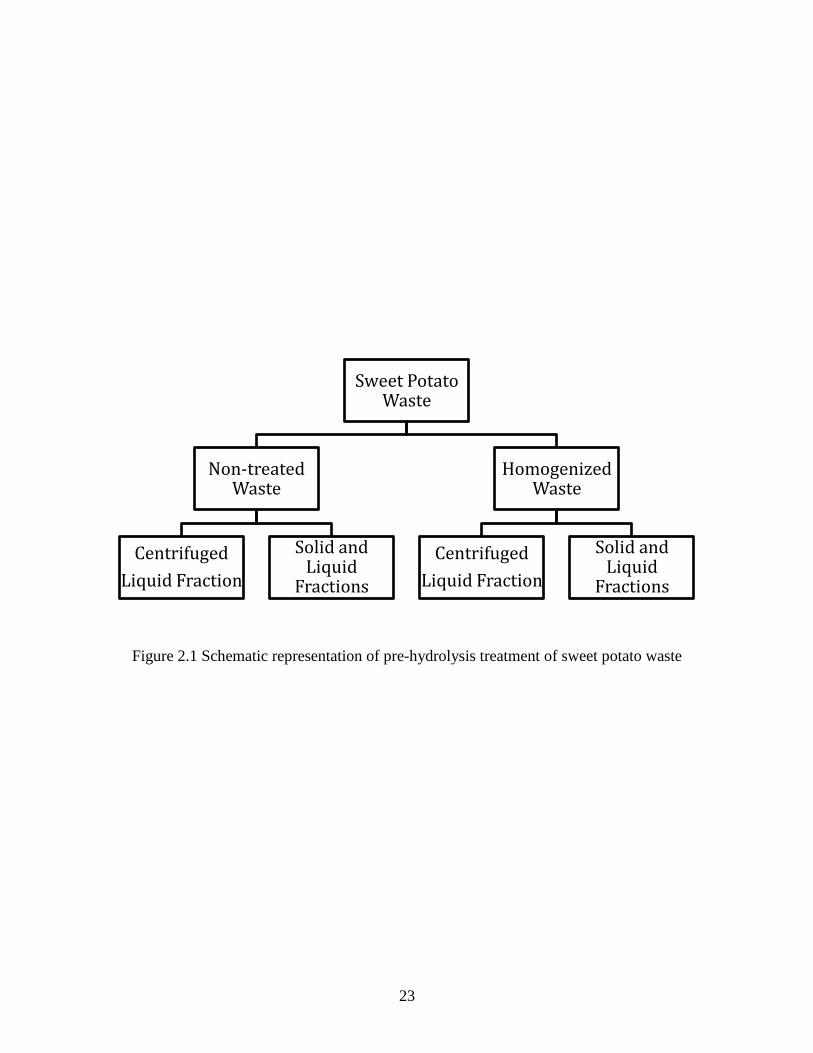
Hydrolysis of sweet potato processing waste
Pre-hydrolysis treatment
Thawed sweet potato waste was mixed 1:1 with deionized water, and boiled in a covered
glass container for 5 min to decrease microbial load. Mixture was cooled to 35°C, and half of the
mixture was removed and homogenized with a Waring commercial laboratory blender at speed 6
for 3 min. The portion of waste remaining was further split and one-half was centrifuged at 3,900
x g for 30 min while the remainder was untreated. Following centrifugation, the liquid fraction
was isolated and the solids were discarded. The homogenized mixture was also split into two
portions—one centrifuged and one untreated (Figure 2.1).
23
Figure 2.1 Schematic representation of pre-hydrolysis treatment of sweet potato waste
Sweet Potato Waste
Non-treated Waste
Centrifuged
Liquid Fraction
Solid and Liquid
Fractions
Homogenized Waste
Centrifuged
Liquid Fraction
Solid and Liquid
Fractions
24
Enzyme hydrolysis
Effectiveness of pre-hydrolysis treatments was tested by addition of 100 U of
glucoamylase (MP Biomedicals LLC, Solon, OH, USA) to 50 g sample in duplicate for each of
the 4 pretreatment conditions, which were then incubated at 37°C for 24 h. One mL samples
were extracted at various time points, placed in a boiling water bath for 5 min to inactivate the
enzyme, and centrifuged at 3,900 x g for 10 min. The resulting supernatant was analyzed for
glucose concentration using Megazyme’s GOPOD assay kit (glucose oxidase/peroxidase). The
assay kit procedure was addition of 1.5 mL of Glucose Determining Reagent to 0.05 mL sample
and incubated at 45°C for 20 min. Absorbance at 510 nm was read and compared with the D-
glucose control. Calculation of glucose concentration was as follows:
[Equation 2.4]
Where:
ΔAsample = Absorbance of sample at 510 nm read against a reagent blank
ΔAstandard = Absorbance of glucose standard at 510 nm read against a reagent blank
Effectiveness of sweet potato processing waste starch hydrolysis by α-amylase (MP
Biomedicals LLC, Solon, OH, USA) was measured using a modified Park-Johnson assay for
reducing sugars. One gram of sweet potato waste powder was mixed with 30 mL deionized
water, the pH adjusted to 6.5 with 1 M KOH, and heated to 35°C on a magnetic stirring platform.
Eighteen mg of α-amylase was added, and samples were taken at time 0, 1, 2, and 3 h. Samples
were then placed in a boiling water bath for 5 min to inactivate the enzyme, and centrifuged at
3,900 x g for 10 min. Liquid was retained for analysis, and solids pellet was discarded. One mL
of the liquid sample, diluted to contain approximately 5 μg of reducing sugars, was mixed with 1
mL of reagent A (0.5 g K3Fe(CN)6 dissolved in 1 L deionized water) and 1 mL of reagent B (4.8
D Glucose (mg/mL)Asample
Astandarddilution factor
25
g Na2CO3 + 9.2 g NaHCO3 + 0.65 g KCN dissolved in 1 L deionized water) in a ground glass
stoppered test tube (1.5 cm x 20 cm) and heated in a boiling water bath for 20 min. After cooling
for 5 min in running tap water, 2.5 mL of reagent C (3 g NH4Fe(SO4)2 dissolved in 1 L of 0.05 M
H2SO4) was added and allowed to stand at room temperature for 20 min. Absorbance was
determined at 715 nm, and reducing sugars were calculated using a standard curve generated by
maltose.
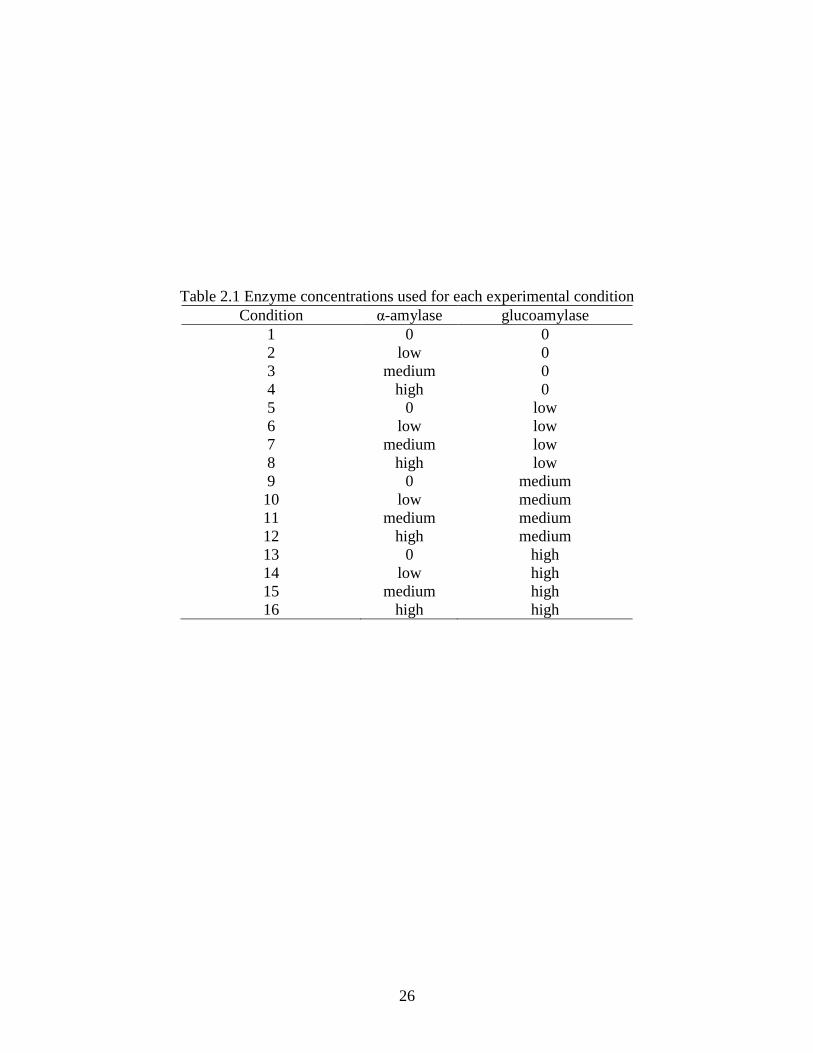
Enzyme hydrolysis of sweet potato waste by α-amylase and glucoamylase was completed
by adding 35 g of sweet potato waste material (as is) and various enzyme concentrations to 250
mL Erlenmeyer flasks on a Barnstead/Thermolyne (Dubuque, IA, USA) heat controlled stirring
platform and incubated at 37°C for 3 h. Experimental conditions are shown in Table 2.1. Alpha-
Amylase concentrations were: low = 0.001 g of enzyme per gram of waste material, medium =
0.01 g of enzyme per gram of waste material, and high = 0.1 g of enzyme per gram of waste
material. Glucoamylase concentrations were: low = 10 units of enzyme per gram of waste
material, medium = 50 units of enzyme per gram of waste material, and high = 200 units of
enzyme per gram of waste material.
26
Table 2.1 Enzyme concentrations used for each experimental condition
Condition α-amylase glucoamylase
1 0 0
2 low 0
3 medium 0
4 high 0
5 0 low
6 low low
7 medium low
8 high low
9 0 medium
10 low medium
11 medium medium
12 high medium
13 0 high
14 low high
15 medium high
16 high high

27
Each condition was run in duplicate and sampled at time 0, 1 h, and 3 h, and enzyme
effectiveness was measured using GOPOD assay kit. Conditions 1-16 were randomized and,
since a maximum of 4 conditions could be tested per run due to equipment limitations, blocked
for run using JMP 9.0 software (Cary, NC, USA). Blocks were grouped as shown in Table 2.2.
Enzyme hydrolysis of sweet potato waste by glucoamylase was completed by adding 35
g of waste material (as is), which was at pH 5.0, and enzyme concentrations of 0.4 U, 0.8 U, 2.0
U, or 4.0 U (U=units enzyme per gram waste material) to 250 mL Erlenmeyer flasks on a heat
controlled stirring platform and incubated at 37°C for 24 h. Triplicate conditions were
randomized (Table 2.3) but not blocked, since all conditions were in the same run. Enzyme
effectiveness was measured using GOPOD assay kit.
Statistical analysis
Statistical analysis was performed using JMP 9.0 software (Cary, NC, USA).
Experiments were designed as a full factorial and completely randomized (with or without
block), and analysis was ANOVA (p < 0.05), followed by least square means comparison
(α=0.05) using Tukey HD. All statistical models were set up to test for main effects as well as
effect interactions.

28
Table 2.2 Randomized blocks for enzyme hydrolysis
Run 1 Condition
1 4,13,15,1
2 6,5,10
3 16,11,14
4 1,11,2
5 13,7,8
6 3,2,7
7 9,15,4
8 6,12,10
9 8,5,9
10 14,16,12,3
Table 2.3 Glucoamylase concentrations in randomized flask conditions
Condition Glucoamylase
1 0.4 U
2 2.0 U
3 0.4 U
4 2.0 U
5 0.8 U
6 0.8 U
7 4.0 U
8 4.0 U
9 0.8 U
10 2.0 U
11 0.4 U
12 4.0 U
29
RESULTS AND DISCUSSION
Characterization of sweet potato processing waste
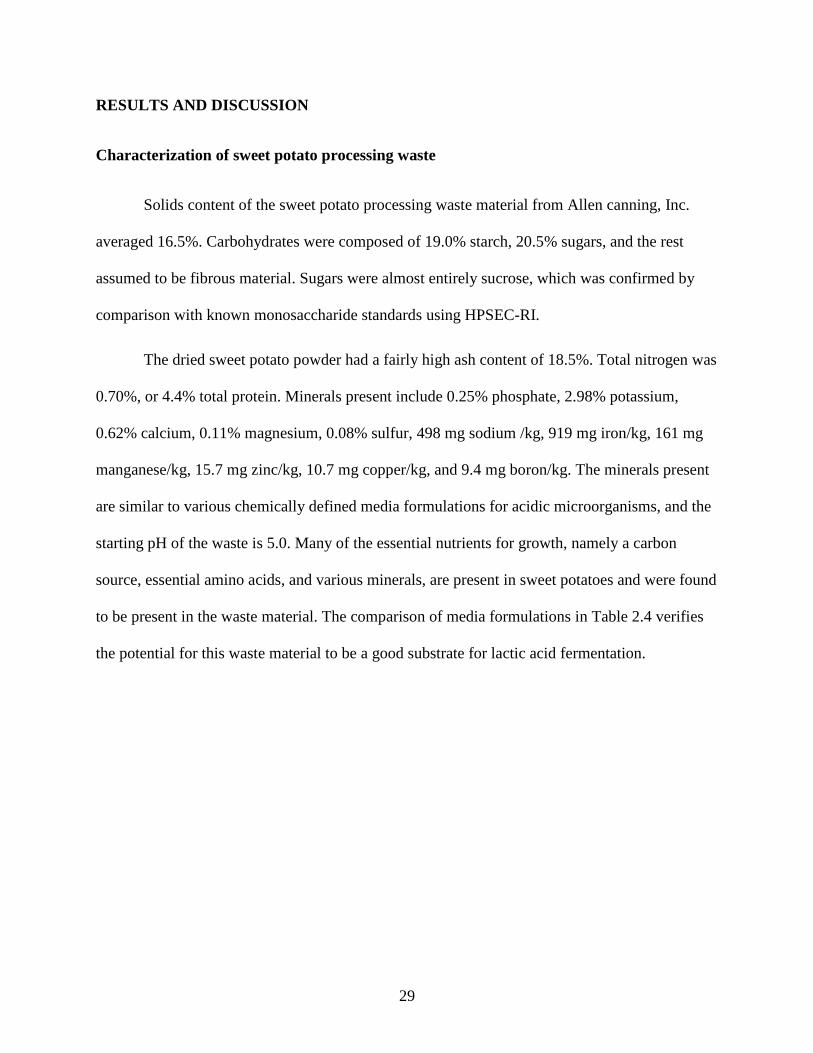
Solids content of the sweet potato processing waste material from Allen canning, Inc.
averaged 16.5%. Carbohydrates were composed of 19.0% starch, 20.5% sugars, and the rest
assumed to be fibrous material. Sugars were almost entirely sucrose, which was confirmed by
comparison with known monosaccharide standards using HPSEC-RI.
The dried sweet potato powder had a fairly high ash content of 18.5%. Total nitrogen was
0.70%, or 4.4% total protein. Minerals present include 0.25% phosphate, 2.98% potassium,
0.62% calcium, 0.11% magnesium, 0.08% sulfur, 498 mg sodium /kg, 919 mg iron/kg, 161 mg
manganese/kg, 15.7 mg zinc/kg, 10.7 mg copper/kg, and 9.4 mg boron/kg. The minerals present
are similar to various chemically defined media formulations for acidic microorganisms, and the
starting pH of the waste is 5.0. Many of the essential nutrients for growth, namely a carbon
source, essential amino acids, and various minerals, are present in sweet potatoes and were found
to be present in the waste material. The comparison of media formulations in Table 2.4 verifies
the potential for this waste material to be a good substrate for lactic acid fermentation.

30
Table 2.4 Comparison of defined media formulations to whole sweet potato and the sweet potato
waste material
Component MPLa
CDM1b
Wine
CDMc
Sweet
Potatod,e
Sweet Potato Processing
Waste
Carbon
Sources
Lactose
Glucose
Fructose
Sucrose
D-Ribose
Nucleic
and
Amino
Acids
Adenine
Cytosine
Guanine
Thymine
Xanthine
Uracil
L-Glutamine
Essential Amino Acids
Salts,
Trace
Elements,
Minerals,
Selective
Agents
Sodium thioglycolate
Tween 80
Na2HPO4
NaH2PO4.H2O
KH4PO4
K2HPO4
Potassium acetate
Sodium acetate
NaCl
CaCl2
MgSO4.7H2O
MnSO4.H2O
NH4Cl
FeSO4.7H2O
(NH4)6Mo7O24.4H2O
CoCl2.6H2O
H3Bo3
CuSO4
ZnSO4.7H2O
Cobalamin (B12)
Riboflavin
Ca pantothenate
Niacin
Nicotinic Acid
Folic Acid
Pyridoxal a Chervaux et al. (2000)
Pyridoxine b Savijoki et al. (2006)
Thiamin c Terrade et al. (2009)
p-Aminobenzoate d,e
Kotecha and Kadam D-Biotin (1998) and Purcell et al.
Myo-inositol (1978) Choline Chloride

31
DSC analysis proved the state of starch in the waste material was already gelatinized,
because replicates showed no endotherms at typical starch gelatinization temperatures of 50-
80°C. Endotherms are a graphical representation of thermal events, and since gelatinization is
defined as a melting of starch crystalline structure (Zobel et al. 1988), presence of an endotherm
denotes a change in starch structure–there is a change in phase from crystalline to non-
crystalline–which requires additional energy/heat. The state of starch in the sweet potato
processing waste is important because it dictates the treatment required for enzymatic hydrolysis.
A starch granule in its raw/native state is not easily digestible by enzymes, whereas gelatinized
starch has lost its crystalline structure and is easily accessible to enzyme action.
Hydrolysis of sweet potato processing waste
Pre-hydrolysis treatment
Pretreatment was applied in an attempt to release additional hydrolysable starch from the
solids fraction of the sweet potato waste. Comparison of glucose concentration after enzyme
treatment (Table 2.5) yielded no significant difference between the non-treated sweet potato
waste and pre-treatment homogenization. Removal of solids before enzyme treatment resulted in
a significantly lower glucose concentration than hydrolysis of the whole material, indicating that
there are additional starch particles in the solids fraction that are accessible to enzyme action. It
was determined that pretreatment of the waste material by blending or centrifugation was not
necessary to obtain maximum hydrolysis yields. This is advantageous due to the minimal
processing required to hydrolyze this waste material into a fermentable substrate.

32
Table 2.5 Glucose concentrations resulting from enzyme hydrolysis of pre-treated sweet potato
processing waste. Means sharing the same letter are not significantly different
Treatment Glucose concentration (g/L)
Non-treated solids and liquids fraction 11.38a
Non-treated centrifuged liquid fraction 8.69b
Homogenized solids and liquids fraction 11.41a
Homogenized centrifuged liquid fracton 11.48a
33
Enzyme hydrolysis
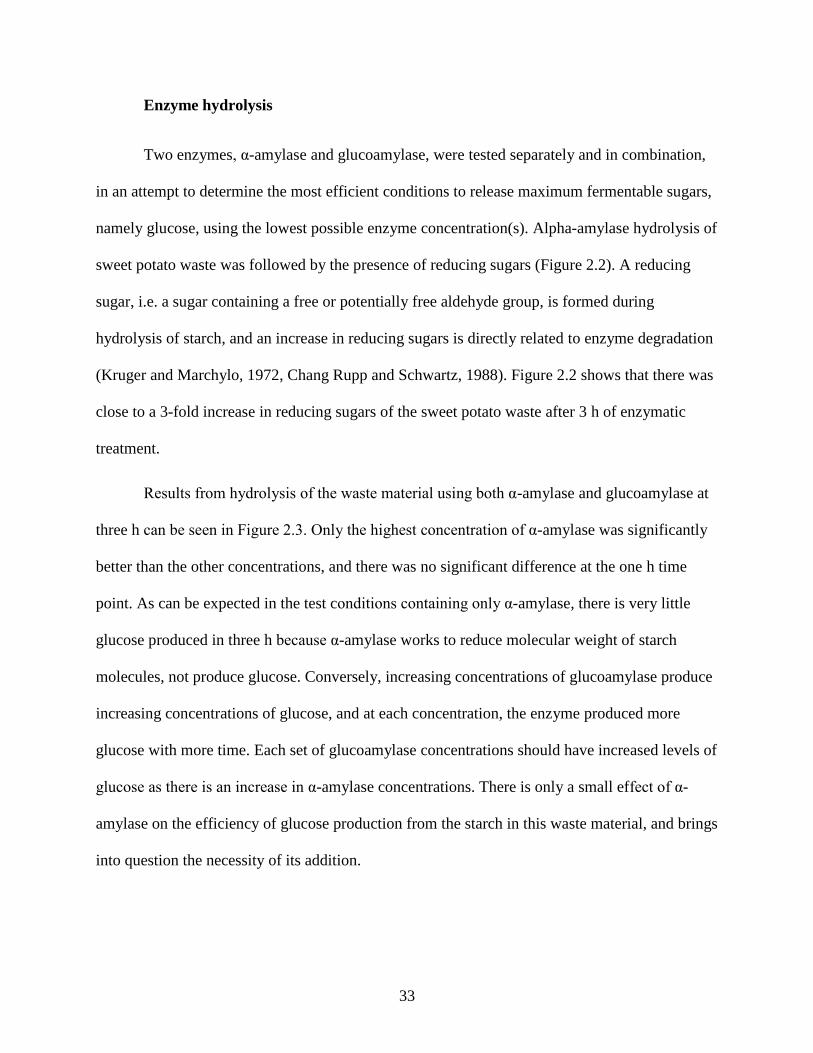
Two enzymes, α-amylase and glucoamylase, were tested separately and in combination,
in an attempt to determine the most efficient conditions to release maximum fermentable sugars,
namely glucose, using the lowest possible enzyme concentration(s). Alpha-amylase hydrolysis of
sweet potato waste was followed by the presence of reducing sugars (Figure 2.2). A reducing
sugar, i.e. a sugar containing a free or potentially free aldehyde group, is formed during
hydrolysis of starch, and an increase in reducing sugars is directly related to enzyme degradation
(Kruger and Marchylo, 1972, Chang Rupp and Schwartz, 1988). Figure 2.2 shows that there was
close to a 3-fold increase in reducing sugars of the sweet potato waste after 3 h of enzymatic
treatment.
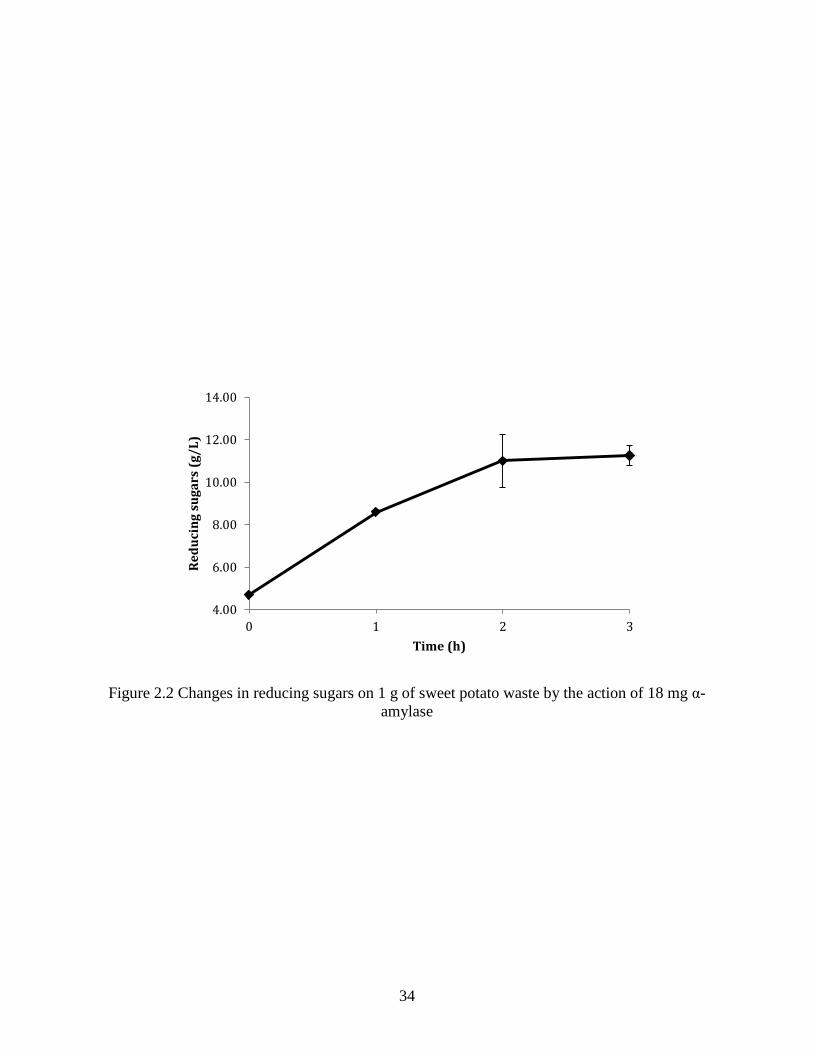
Results from hydrolysis of the waste material using both α-amylase and glucoamylase at
three h can be seen in Figure 2.3. Only the highest concentration of α-amylase was significantly
better than the other concentrations, and there was no significant difference at the one h time
point. As can be expected in the test conditions containing only α-amylase, there is very little
glucose produced in three h because α-amylase works to reduce molecular weight of starch
molecules, not produce glucose. Conversely, increasing concentrations of glucoamylase produce
increasing concentrations of glucose, and at each concentration, the enzyme produced more
glucose with more time. Each set of glucoamylase concentrations should have increased levels of
glucose as there is an increase in α-amylase concentrations. There is only a small effect of α-
amylase on the efficiency of glucose production from the starch in this waste material, and brings
into question the necessity of its addition.
34
Figure 2.2 Changes in reducing sugars on 1 g of sweet potato waste by the action of 18 mg α-
amylase
4.00
6.00
8.00
10.00
12.00
14.00
0 1 2 3
Re
du
cin
g s
ug
ars
(g
/L
)
Time (h)
35
Figure 2.3 Sweet potato processing waste hydrolysis at 3 h with α-amylase and glucoamylase
0
lo
med
high
0.00
0.50
1.00
1.50
2.00
2.50
3.00
3.50
4.00
4.50
5.00
0lo
medhigh
glucoamylase concentration
Glu
cose
(g
/L
)
alpha-amylase concentration

36
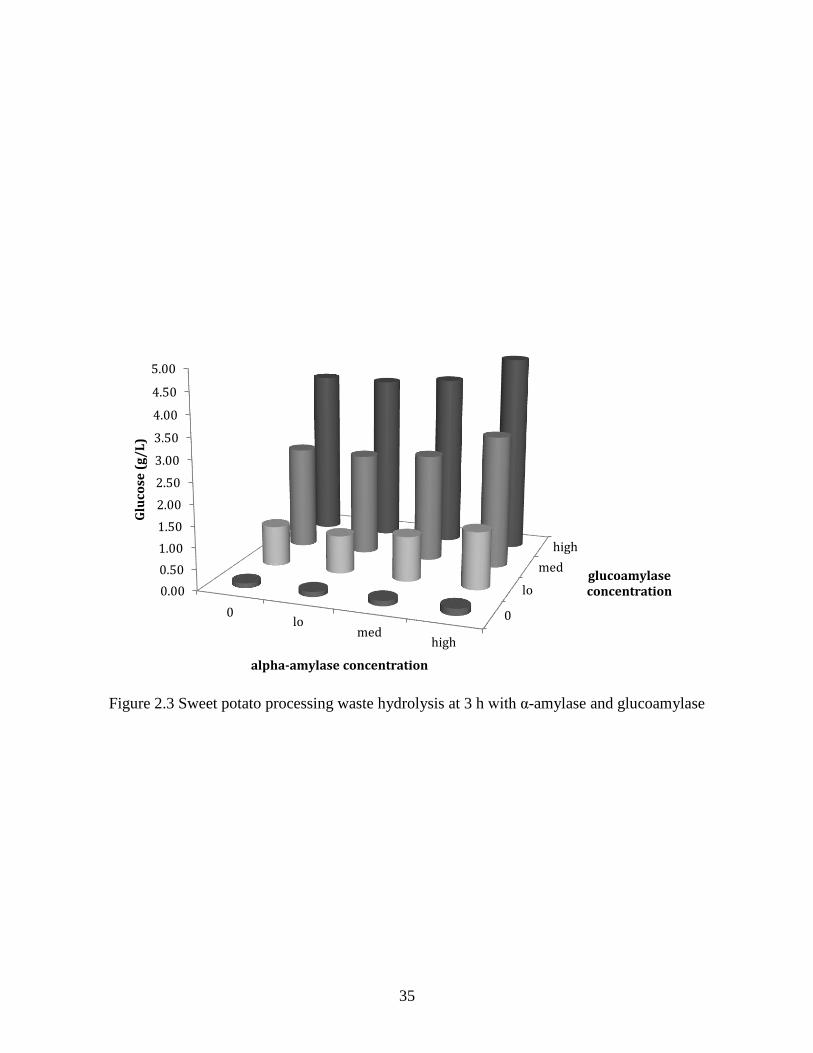
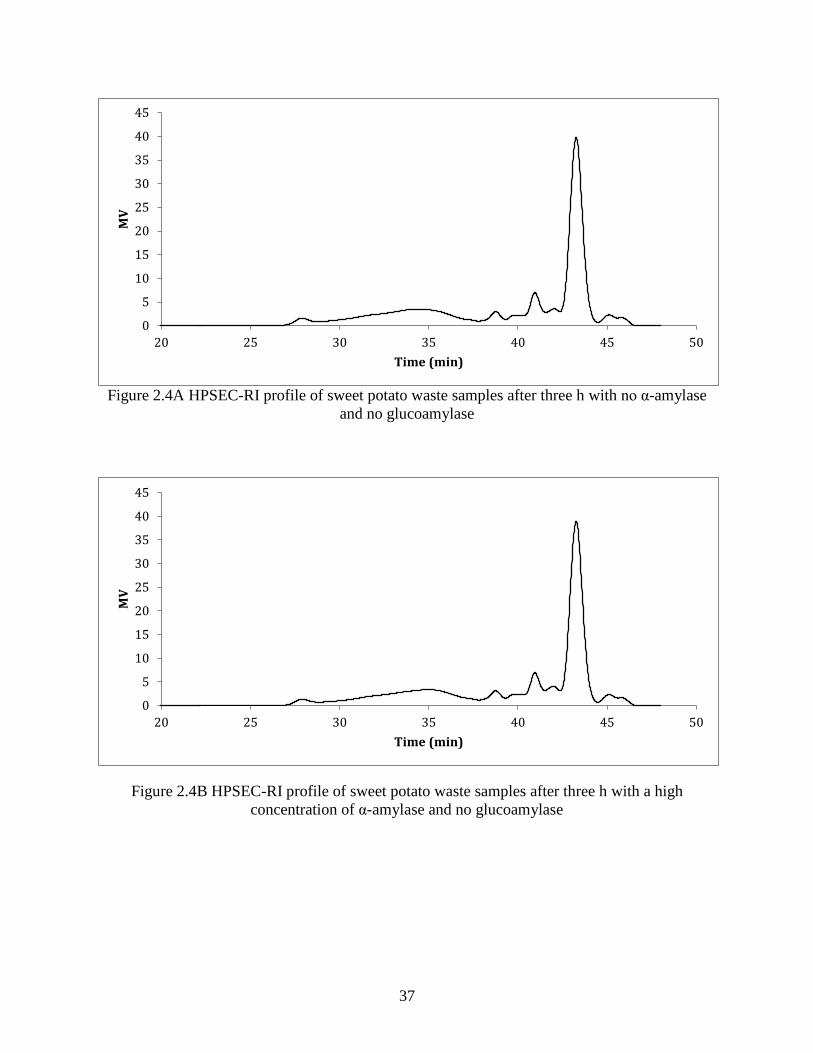
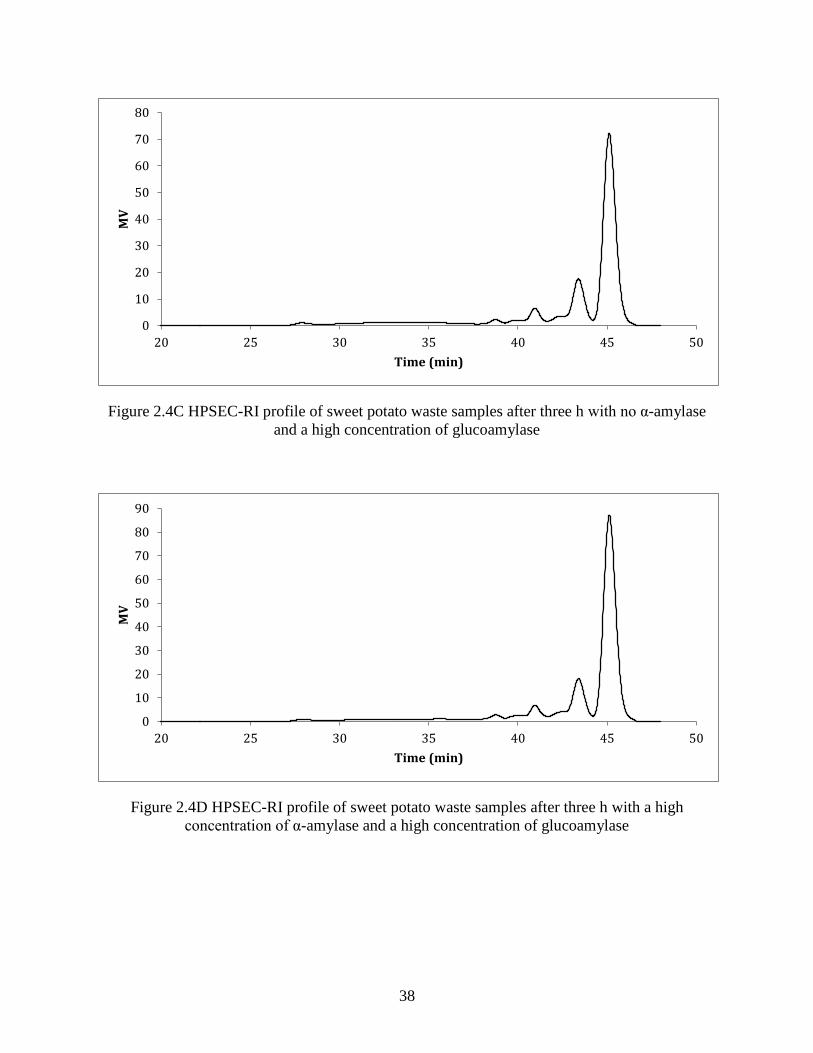
Figure 2.4A represents the sweet potato waste material with no enzyme treatment. These
peaks are starch fragments, and are likely present due to the processing conditions used at the
canning facility where this waste material is produced. The steam peeling process results in
destruction of the starch granules and fragmentation of the amylose and amylopectin. The heat
and pressure have broken apart the starch molecules, and consequently reduced the components
to dextrins easily hydrolyzed by glucoamylase alone. This is also a likely explanation for why
there is no gelatinization endotherm during DSC, since there are no intact crystalline structures.
Figure 2.4B, C, and D represent the samples taken from the enzyme treated sweet potato
waste after three h. A comparison of plots A and B indicate almost no effect of α-amylase on size
decrease of the starch fragments. A comparison of plots A and C indicate the action of
glucoamylase is effective in hydrolysis of the starch fragments to glucose (peak present at 45.3
min), and a comparison of plots C and D indicate a very slight synergistic effect of the two
enzymes in producing glucose.
37
Figure 2.4A HPSEC-RI profile of sweet potato waste samples after three h with no α-amylase
and no glucoamylase
Figure 2.4B HPSEC-RI profile of sweet potato waste samples after three h with a high
concentration of α-amylase and no glucoamylase
0
5
10
15
20
25
30
35
40
45
20 25 30 35 40 45 50
MV
Time (min)
0
5
10
15
20
25
30
35
40
45
20 25 30 35 40 45 50
MV
Time (min)
38
Figure 2.4C HPSEC-RI profile of sweet potato waste samples after three h with no α-amylase
and a high concentration of glucoamylase
Figure 2.4D HPSEC-RI profile of sweet potato waste samples after three h with a high
concentration of α-amylase and a high concentration of glucoamylase
0
10
20
30
40
50
60
70
80
20 25 30 35 40 45 50
MV
Time (min)
0
10
20
30
40
50
60
70
80
90
20 25 30 35 40 45 50
MV
Time (min)

39
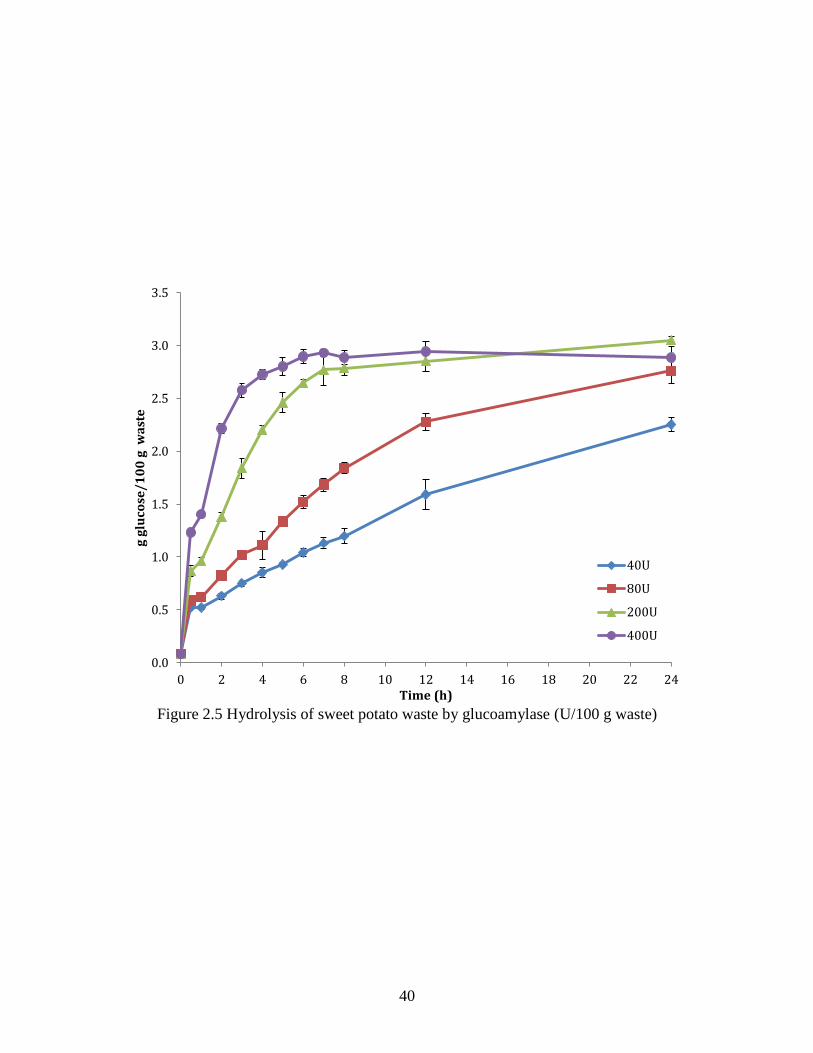
Due to the minimal effects of α-amylase and the likely presence of starch fragments seen
in the HPSEC-RI profiles, it was determined that the only enzyme necessary for hydrolysis of the
sweet potato waste was glucoamylase. This enzyme was tested on the sweet potato processing
waste for the lowest concentration that would yield maximum glucose in 24 h. Figure 2.5
indicates that the enzyme activity continues through 24 h, since the lowest enzyme concentration
is still increasing in glucose at the last tested time point. The use of a higher concentration of
glucoamylase results in a faster conversion of starch to glucose, with the highest concentration
completing hydrolysis within six h. Theoretical hydrolysis of 100 g sweet potato waste, with a
solids content of 17% and soluble starch content within the solids of 19%, is 3.2 g of glucose. At
24 h, all levels of glucoamylase concentrations tested, with the exception of the lowest, result in
very close to maximum theoretical yield. It is quite possible that the lowest concentration of
enzyme would eventually reach this level of hydrolysis given more time. As a result, it is
possible to use lower enzyme concentrations and still achieve the same level of hydrolysis. For
the purpose of this set of experiments, a balance of enzyme concentration and time to full
hydrolysis was required. The chosen hydrolysis conditions moving forward will be 80 U/100
gram of sweet potato waste with an incubation time of 24 h.
40
Figure 2.5 Hydrolysis of sweet potato waste by glucoamylase (U/100 g waste)
0.0
0.5
1.0
1.5
2.0
2.5
3.0
3.5
0 2 4 6 8 10 12 14 16 18 20 22 24
g g
luco
se/
10
0 g
wa
ste
Time (h)
40U
80U
200U
400U

41
CONCLUSION
The waste produced from sweet potato canning facilities is a potentially good source for a
fermentation substrate. The presence of several essential nutrients indicates the possibility that
this substrate could be used for fermentation without supplementation. The steam peeling
process results in starch that is fragmented due to the extreme temperature used. This
fragmentation results in a simpler hydrolysis process, since no pretreatment of the starch in the
waste material is required for efficient enzyme hydrolysis. Glucoamylase action on the available
starch fragments in the sweet potato processing waste provided levels of glucose that are
comparable to several commercially used fermentation media (Table 2.4). For full hydrolysis of
available starch in 24 h, the minimal enzyme concentration was 80 U/100 g of sweet potato
waste material.

42
Chapter 3: FERMENTATION OF HYDROLYZED SWEET POTATO PROCESSING
WASTE
INTRODUCTION
Fermentation of hydrolyzed agro-wastes using lactic acid bacteria (LAB) is affected by
substrate, LAB strain, and production mode and parameters (John et al. 2007). There are many
strains of LAB, and each displays a unique set of nutritional requirements and production
kinetics (Litchfield 1996), therefore it is critical to match strain to substrate for optimal
production of lactic acid. Due to the recent uses for lactic acid in the bioplastics industry, LAB
that produce only one stereoisomer will be evaluated for growth and production in the
hydrolyzed sweet potato waste. Some tools used to evaluate and compare strains include: viable
cell counts, pH monitoring and controlling, glucose consumption, and lactic acid production.
Production of lactic acid from the hydrolyzed sweet potato production waste was the goal of this
project, and all of these tools were used to evaluate and optimize production. The objective of
this chapter (Objective 2 of the research) was to screen lactic acid bacteria strains that would
maximize the production of lactic acid using as a substrate hydrolyzed sweet potato waste
obtained in Chapter 2.
MATERIALS AND METHODS
Materials
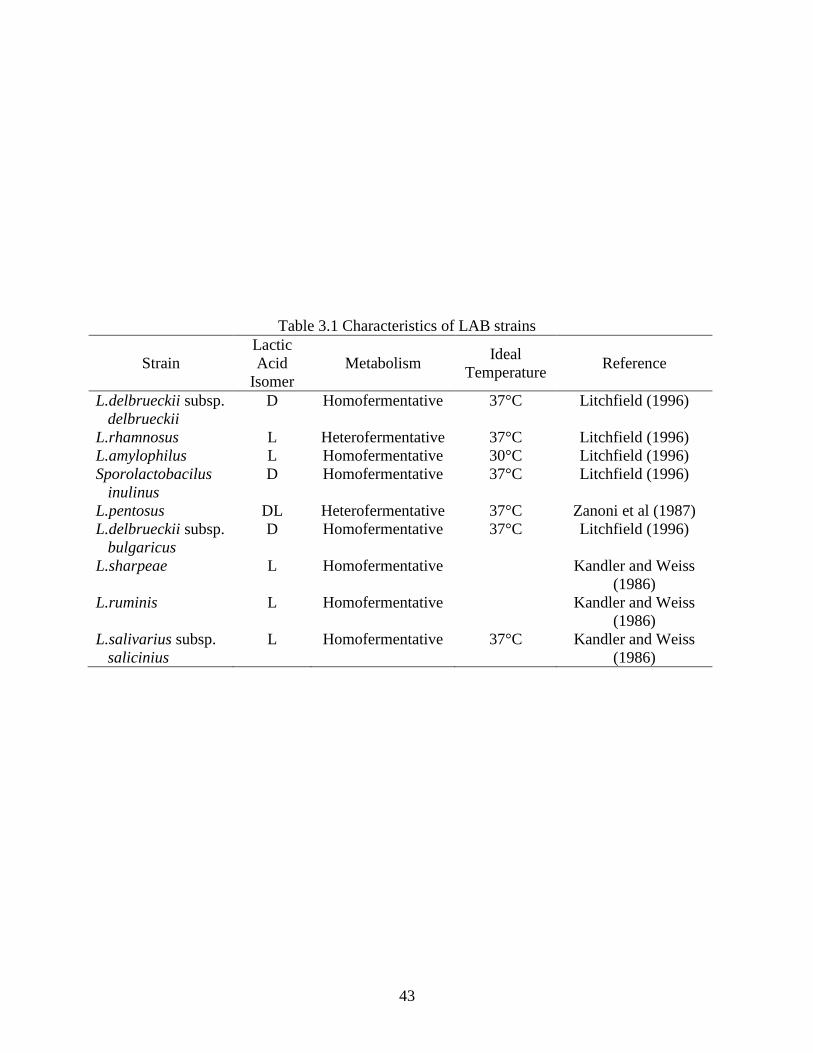
Nine LAB were received from the USDA Agriculture Research Service (Washington,
DC, USA). Each strain was a dried pellet contained in a glass vial, and the general characteristics
of each strain are listed in Table 3.1.
43
Table 3.1 Characteristics of LAB strains
Strain
Lactic
Acid
Isomer
Metabolism Ideal
Temperature Reference
L.delbrueckii subsp.
delbrueckii
D Homofermentative 37°C Litchfield (1996)
L.rhamnosus L Heterofermentative 37°C Litchfield (1996)
L.amylophilus L Homofermentative 30°C Litchfield (1996)
Sporolactobacilus
inulinus
D Homofermentative 37°C Litchfield (1996)
L.pentosus DL Heterofermentative 37°C Zanoni et al (1987)
L.delbrueckii subsp.
bulgaricus
D Homofermentative 37°C Litchfield (1996)
L.sharpeae L Homofermentative Kandler and Weiss
(1986)
L.ruminis L Homofermentative Kandler and Weiss
(1986)
L.salivarius subsp.
salicinius
L Homofermentative 37°C Kandler and Weiss
(1986)
44
Each glass vial was stored at 4°C until use. All manipulation of live cell cultures was
completed in a class II type A2 biosafety cabinet (ESCO, Hatboro, PA, USA) using sterile
technique. The growth medium used for strain comparison was Difco YM Broth (Becton
Dickinson, Franklin Lakes, NJ, USA), which was solubilized by addition of 21.0 g powder into 1
L MilliQ water and filtered through a sterile 0.22-μm polyethersulfone (PES) membrane from
Corning (Corning, NY, USA). To preserve LAB by freezing, dimethylsulfoxide (DMSO) from
Sigma Aldrich (St. Louis, MO) was used as a media supplement to YM Broth, and vials, a
freezing jar, and freezer storage boxes were all obtained from Nalgene (Rochester, NY, USA).
Enumeration of cells was accomplished using a Hausser Scientific brightline hemacytometer
(Horsham, PA, USA), and cell viability was assessed using a 0.4% trypan blue liquid solution
from Amresco (Solon, OH, USA). Lactic acid standards used for detection and quantification
method development were 85% pure L-lactic acid (Purac, Lincolnshire, IL, USA), 95% pure D-
lactic acid (Sigma-Aldrich, St Louis, MO, USA), and an 85% pure equal mixture of D (-) and L
(+) lactic acid (Sigma-Aldrich, St Louis, MO, USA). Cell culture supernatants for lactic acid
analysis were passed through 0.45-μm Nylon syringe filters from Acrodisc (Pall, Port
Washington, NY, USA). Hydrolyzed sweet potato waste used for fermentation was diluted using
MilliQ filtered water (Millipore, Germany), and any pH adjustment during fermentation was
achieved with dropwise addition of 1 M NaOH. After each sampling event, culture vessels were
flushed with filtered nitrogen gas for 5 s and then tightly sealed.
Methods
Growth and proliferation
Initial cultures received from the USDA-ARS were reanimated by suspension of the
pellet in 20 mL of fresh growth medium in a sterile 250 mL flask. Flasks were incubated at 30-

45
37°C, depending on strain requirements, on a MaxQ 4450 shaking platform (Thermo Scientific,
Waltham, MA, USA) maintained at 95 rpm. After 24-48 h, backup cultures were frozen in
growth medium supplemented with DMSO to a final concentration of 10% in sterile, 2 mL
freezing vials. These vials were placed in a freezing jar and stored at −80°C for 24 h. Frozen
vials were then transferred to a storage box and stored at −80°C until use.
For growth, each vial of a desired LAB strain was quickly thawed by submersion in a
water bath set at 37°C. Once there were no longer any visible ice crystals, the contents of the vial
were placed in 8 mL of growth medium and centrifuged at 1,900 x g for 5 min. Once the
resulting supernatant was discarded, the cell pellet was resuspended in 20 mL growth medium,
transferred to a sterile 250 mL flask, flushed with filtered nitrogen gas, and incubated at 30-37°C
with shaking at 95 rpm.
Cells were counted using a hemacytometer with counting chambers (as shown in Figures
3.1 and 3.2) and a microscope with a 45x objective (Bausch and Lomb, Rochester, NY, USA).
Cell suspension was diluted in YM broth to yield approximately 2-4x10⁶ viable cells per mL.
The diluted cell suspension was well mixed on a vortex mixer, and a 50 μL aliquot was mixed
with 50 μL trypan blue solution in a 1.5 mL Eppendorf tube. For analysis, a 10 μL sample of the
trypan blue dyed cell suspension was slowly injected under the cover slip and into the
hemacytometer chamber. One square millimeter of grid was counted, and cell concentration
calculated (according to Eq. 3.1). Dead cells were differentiated from live cells by color and
movement. Dark blue/black cells that were not visibly moving were counted as dead, and light
reflective white, light blue, or blue cells showing movement were counted as live.

46
Figure 3.1 Hausser brightline hemacytometer (image from www.dtc.pima.edu)
Figure 3.2 Magnified hemacytometer counting chamber grid (image from www.dtc.pima.edu)
47
ViableCells
mLnumberof cells in 1mm2 dilution factor
104mm2
mL [Equation 3.1]
Fermentation
Comparison of growth and production kinetics from the viable LAB strains was carried
out in duplicate sterile, 500 mL flasks with a fill volume of 200 mL, a starting cell inoculum of
1-2x10⁵ viable cells per mL (VC/mL), and incubation on a shaking platform set at 95 rpm and
37°C. All cultures were started at the same time, and samples were taken at set time intervals
between 0 and 72 h. After each sample point, flasks were flushed with nitrogen gas, resealed, and
returned to the shaker platform. Each culture sampling consisted of a 3-mL extraction of culture
liquid with a sterile pipette, placement of this sample into a 15-mL centrifuge tube, and vortex
mixing at medium-high speed for 30 s. An aliquot of each sample was diluted for cell count
determination with a hemacytometer, and the remainder of the sample was centrifuged at 3,900 x
g for 10 min. The pH of the resulting supernatant was determined by submersion of a sympHony
SP70P pH probe (VWR, Radnor, PA, USA). Following the pH determination, the supernatant
was transferred to 1.5 mL Eppendorf tubes and stored at −20°C for glucose and lactic acid
analysis. The cell pellet was discarded.
Fermentation using hydrolyzed sweet potato waste material (hydrolysis was achieved
according to the procedure outlined in chapter 3) was carried out in duplicate sterile, 500 mL
flasks with a fill volume of 200 mL, a starting cell inoculum of 1-2x10⁵ VC/mL, and incubation
on a shaking platform set at 95 rpm and 37°C. Sampling of flasks was according to the same
procedure as with growth and production kinetics (detailed in previous paragraph). Dilutions of
the hydrolyzed sweet potato waste material used for LAB growth and production kinetics are
shown in Table 3.2.

48
Table 3.2 Waste material dilutions and final glucose concentrations
Dilution Hydrolyzed Sweet Potato Waste MilliQ Water Final glucose concentration (g/L)
1:0 200 mL 0 mL 30
1:1 100 mL 100 mL 15
1:3 50 mL 150 mL 7.5

49
Fermentation using hydrolyzed sweet potato waste material with pH control was carried
out in duplicate sterile, 500 mL flasks with a fill volume of 200 mL, a starting cell inoculum of
1-2x10⁵ VC/mL, and incubation on a shaking platform set at 95 rpm and 37°C. Sampling of
flasks was according to the same procedure as with growth and production kinetics (detailed in
previous paragraph). The pH was maintained by the addition of sodium hydroxide each time the
flasks were sampled. Control of pH at the 5.0 set point required a total volume of 2.1 mL base
addition from 9-24 h, and the 4.0 set point required a total volume of 2.1 mL base addition from
21-48 h.
Glucose and lactic acid analysis
The supernatant taken from each sample during fermentation experiments was analyzed
for glucose by Megazyme GOPOD assay kit (Dublin, Ireland) as described in the previous
chapter. Lactic acid concentration was determined using high-performance liquid
chromatography (HPLC). The equipment was a Shimadzu (Shimadzu, Japan) consisting of two
pumps (Model), an autosampler (SIL-10AF) equipped with a 50-μL sample loop, adegasser
(DGV-20A3), column oven (CTO-20A) set at 65°C, and SPD-20AV UV-Vis detector set at 210
nm. Supernatant cell culture samples were thawed at 4°C, filtered through a 0.45-μm syringe
filter, and 50 μL injected. Separation was conducted on 2 Biorad Aminex HPX-87H organic acid
columns in series with aqueous 0.005 N H2SO4 at a flow rate of 0.3 mL/min. Concentrations
were determined by comparison to a standard curve generated using lactic acid standards.
Statistical analysis
All experimental conditions were completely randomized and run in duplicate. Reported
values were means ± the standard error.

50
RESULTS AND DISCUSSION
Comparison of LAB strains for growth and production
Upon reanimation from shipping vials, only three of the nine strains grew in the culture
media-L. delbrueckii subsp. delbrueckii, L. rhamnosus, and L. delbrueckii subsp. bulgaricus. A
probable explanation as to why the other six strains did not grow is their intolerance to oxygen.
LAB do not possess the ability to make catalase or superoxide dismutase, so the presence of
reactive oxygen species can be toxic (Kandler and Weiss 1986). Although each flask was flushed
with nitrogen gas, there may have been a small amount of residual oxygen dissolved in the liquid
medium that inhibited growth.
Since the ideal lactic acid production process should be simple, inexpensive, and easy to
implement, the three strains chosen for continued study were the most suitable because they were
the most tolerant of a microaerobic environment and grew well upon reanimation. A LAB strain
that can tolerate some amount of oxygen will be a more flexible candidate to meet production
goals than a strict anaerobe.
Hemacytometer counts, pH values, glucose, and lactic acid production of the three strains
are shown in Figures 3.3-3.6 respectively. Growth curves in Figure 3.3 show all three strains
have similar curve shapes, but L. bulgaricus and L. delbrueckii grew to a much higher cell
density than L. rhamnosus. One of the goals of this experiment was to see the three distinct
phases of growth-lag, exponential, and stationary. Unfortunately, the lag phase was not readily
observable for L. bulgaricus or L. delbrueckii. It probably occurred within the first nine h, but
was not observed because a sample was not taken during that time. Although counting by
hemacytometer allowed the differentiation of live and dead cells, there were very few dead cells,
51
and accurate enumeration was difficult because of the small cell size and tendency of all three
strains to grow in clusters of 2-10 cells. This is a common problem, however, since bacterial
cells are difficult to evaluate and accurately enumerate without expensive, specialized equipment
(Edwards 1996).
Initially, the culture pH of L. bulgaricus and L. delbrueckii dropped dramatically (Figure
3.4), corresponding with a rapid increase in cell number, but after 15 h, there was no change in
pH. This is the same time point when there is a transition from exponential to stationary growth
phase (Figure 3.3). Conversely, L. rhamnosus continued to produce compounds that deceased pH
throughout the exponential and stationary phases of growth. There is a notable decrease in pH
between 9 h and 18 h, corresponding almost exactly with the exponential phase of growth
(Figure 3.3), and then a continuous, gradual decline throughout the remainder of the experiment.
LABs that are more tolerant of lower pH would be advantageous for a lactic acid production
system, since they are less inhibited by the product they are producing. Based on tolerance to a
lower medium pH, L. rhamnosus would be the preferred candidate for lactic acid production.

52
Figure 3.3 Hemacytometer counts (VC/mL) of L. bulgaricus, L. delbrueckii, and L. rhamnosus
during growth in traditional media
Figure 3.4. The pH measurements of L. bulgaricus, L. delbrueckii, and L. rhamnosus during
growth in traditional media
0.0E+00
2.0E+07
4.0E+07
6.0E+07
8.0E+07
1.0E+08
1.2E+08
0 10 20 30 40 50
Via
ble
cel
ls/m
L
Time (h)
L.bulgaricus
L.rhamnosus
L.delbrueckii
3.00
3.50
4.00
4.50
5.00
5.50
6.00
6.50
0 10 20 30 40 50
pH
Time (h)
L.bulgaricus
L.rhamnosus
L.delbrueckii

53
Glucose utilization in Figure 3.5 shows a similar pattern to the pH drop in Figure 3.4.
Since L. bulgaricus and L. delbrueckii are homofermentative, it is assumed that they produce
lactic acid from glucose more efficiently than L. rhamnosus. It can be observed, however, that L.
rhamnosus continues to metabolize glucose throughout the duration of the experiment, whereas
the other strains stop after the exponential phase of growth. This is probably a function of the
sensitivity of these strains to low pH, which is corroborated by the data in Figure 3.4. Overall, L.
rhamnosus is the most tolerant and continues to metabolize despite a very low pH.
All of these measurements are indicators of the product of interest, specifically lactic
acid. A comparison of lactic acid production by each of the LAB strains (Figure 3.6) agrees with
the previous indicators of cell count, pH, and glucose consumption. L. rhamnosus continues to
produce lactic acid throughout the stationary growth phase, while L. bulgaricus and L.
delbrueckii stop after the exponential growth phase, probably due to pH inhibition. None of the
strains utilized all of the available glucose, although L. rhamnosus was still metabolizing at the
last time point sample. Given more time, it is very possible that most or all of the glucose could
have been utilized by L. rhamnosus.

54
Figure 3.5 Glucose concentration of L. bulgaricus, L. delbrueckii, and L. rhamnosus during
growth in traditional media
Figure 3.6 Lactic acid production of L. bulgaricus, L. delbrueckii, and L. rhamnosus during
growth in traditional media
7.00
7.50
8.00
8.50
9.00
9.50
10.00
0 10 20 30 40 50
Glu
cose
co
nce
ntr
ati
on
(g
/L)
Time (h)
L.bulgaricus
L.rhamnosus
L.delbrueckii
0.0
0.2
0.4
0.6
0.8
1.0
1.2
1.4
1.6
1.8
2.0
0 10 20 30 40 50
La
ctic
Aci
d (
g/L
)
Time (h)
L.bulgaricus
L.rhamnosus
L.delbrueckii

55
In order to complete a comparison of these three LAB for the purpose of selecting one for
fermentation in the hydrolyzed sweet potato waste material, calculations were made to determine
the efficiency of each strain at converting glucose to lactic acid. Production kinetics for each
strain are represented by Figures 3.7-3.9. The following equations (3.3 and 3.4) were used to plot
points and calculate the slope of a best fit line that represents the amount of lactic acid (product,
in grams) produced per gram of glucose (substrate) consumed:
Substrateconsumptiont S0 St [Equation 3.2]
Lacticacidproductiont Pt P0 [Equation 3.3]
S0 = glucose concentration at time 0
St = glucose concentration at time t
Pt = lactic acid concentration at time t
P0 = lactic acid concentration at time 0
The slopes from Figures 3.7-3.9 represent lactic acid production for L. bulgaricus, L.
delbrueckii, and L. rhamnosus, which were 0.43, 0.53, and 0.96 g lactic acid/g glucose,
respectively. Therefore, L. rhamnosus produced lactic acid much more efficiently than either of
the other strains and was chosen as the one strain to use for fermentation with the hydrolyzed
sweet potato waste material.
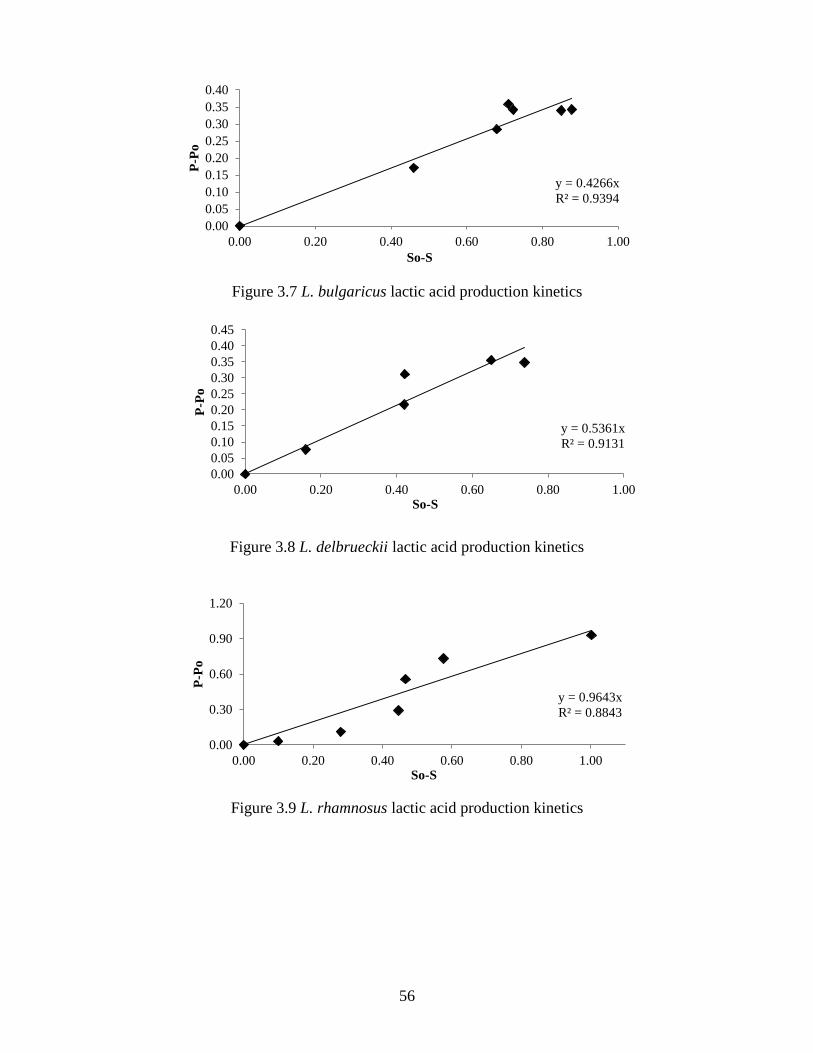
56
Figure 3.7 L. bulgaricus lactic acid production kinetics
Figure 3.8 L. delbrueckii lactic acid production kinetics
Figure 3.9 L. rhamnosus lactic acid production kinetics
y = 0.4266x
R² = 0.9394
0.00
0.05
0.10
0.15
0.20
0.25
0.30
0.35
0.40
0.00 0.20 0.40 0.60 0.80 1.00
P-P
o
So-S
y = 0.5361x
R² = 0.9131
0.00
0.05
0.10
0.15
0.20
0.25
0.30
0.35
0.40
0.45
0.00 0.20 0.40 0.60 0.80 1.00
P-P
o
So-S
y = 0.9643x
R² = 0.8843
0.00
0.30
0.60
0.90
1.20
0.00 0.20 0.40 0.60 0.80 1.00
P-P
o
So-S
57
Comparison of control medium to hydrolyzed sweet potato waste material
There was a concern that using the hydrolyzed material as is might create a highly
unbalanced osmotic environment for L. rhamnosus, due to the high concentration of glucose–
approximately 30 g/L. This is why 2 different dilutions (1:1 and 1:3), as well as the material as is
(1:0) were compared to the control medium (YM Broth) for growth and production. The growth
curves in Figure 3.10 show a similar rate of growth in the 1:3 diluted hydrolyzed sweet potato
waste material as in the control, but the 1:1 diluted and undiluted material support a faster
growth rate and a higher cell density. Due to high flask to flask variability, counting was
discontinued after 36 h, although samples for glucose and lactic acid analysis were gathered
through 70 h. L. rhamnosus grew better in the hydrolyzed sweet potato waste material than the
control medium.
The pH measurements (Figure 3.11) were very similar for all conditions throughout the
experimental time period. The hydrolyzed sweet potato waste material had a lower starting pH
than the control medium, but after 10 h, there was little difference.
Monitoring the factors of cell growth, pH, and substrate consumption is done mainly to
get an understanding of why or why not a system is producing a product, in this case, lactic acid.
However, maximizing the production of lactic acid is the ultimate objective, so the total lactic
acid concentration is the most vital factor in determining whether the ideal growth media for L.
rhamnosus is the control medium or the hydrolyzed sweet potato material. A comparison of
lactic acid concentrations (Figure 3.13) for each test condition reveals what the indicator
measurements were hinting at–L. rhamnosus in the undiluted hydrolyzed sweet potato waste
material produced more lactic acid in a 70-h period than the other conditions.

58
Figure 3.10 Hemacytometer cell counts (VC/mL) of L. rhamnosus grown in control medium and
hydrolyzed sweet potato waste
Figure 3.11 The pH values of L. rhamnosus grown in control medium and hydrolyzed sweet
potato waste
0.0E+00
1.0E+08
2.0E+08
3.0E+08
4.0E+08
5.0E+08
6.0E+08
7.0E+08
8.0E+08
0 5 10 15 20 25 30 35 40
Via
ble
cel
ls/m
L
Time (h)
1:3
1:1
1:0
YM Broth
3.0
3.5
4.0
4.5
5.0
5.5
6.0
0 10 20 30 40 50 60 70 80
pH
Time (h)
1:3
1:1
1:0
YM Broth

59
Figure 3.12 The glucose concentration at various time intervals of L. rhamnosus in control
medium (), 1:0 hydrolyzed sweet potato waste material (), 1:1 diluted hydrolyzed sweet
potato waste material (), and 1:3 diluted hydrolyzed sweet potato waste material ()
Figure 3.13 L. rhamnosus lactic acid production in control medium and hydrolyzed sweet potato
waste
0.0
1.0
2.0
3.0
4.0
5.0
6.0
7.0
8.0
0 10 20 30 40 50 60 70 80
La
ctic
Aci
d (
g/L
)
Time (h)
1:3
1:1
1:0
YM Broth
5
10
15
20
25
30
0 10 20 30 40 50 60 70 80
Glu
cose
(g
/L
)
Time (h)

60
It is important to note that the hydrolyzed sweet potato material already contains a small
amount of lactic acid, and the time zero points in Figure 3.13 have been adjusted by subtracting
out this amount. The enzyme hydrolysis process occurs for 24 h at 37°C, and is not done in
completely sterile conditions in order to mimic a potential production process at a canning
facility. Before incubation with L. rhamnosus, the hydrolyzed material is autoclaved, so there is
little chance that contaminating organisms are carried over from the hydrolysis process to the
production process. The scaled down production process (shake flask) is also conducted under
clean but not completely sterile conditions, in order to mimic a larger scale process. A
completely sterile process would be incredibly costly and time-consuming.
An analysis of production kinetics (data not shown) reveals the same conversion of
glucose to lactic acid–1.0 g lactic acid/g glucose–in all media formulations as in the previous
experiment (see Figure 3.9), as well as similar lactic acid concentrations in the control medium at
the same time points, demonstrating the reasonably good reproducibility of the shake flask
method.
Production in hydrolyzed sweet potato waste material with pH control
Several studies have confirmed the beneficial effects of pH control during production of
lactic acid (Calabia et al. 2007, Nakanishi et al. 2010, Zhang et al. 2010). There are different
methods to control pH, but the simplest to employ in a small scale experiment without
detrimental effects to the product is addition of base when pH drops below a set value. Figure
3.11 indicates a L. rhamnosus working pH range of 3.2-5, so the pH set points designated for this
experiment were 4.0, 5.0, and a control, which received no pH adjustment. Figure 3.14 shows

61
that growth of L. rhamnosus was affected by pH adjustment, but only at the 5.0 set point. The
cell counts of pH set point 4.0 and the control were within flask to flask variability.
It is possible that too much base addition would increase the medium osmolarity, and in
turn cause the bacterial cells to swell and eventually burst. Lactobacillus strains are generally
tolerant to high salt environments (Litchfield 1996), but can only survive up to a certain point.
For this reason, the addition of base to maintain pH set points was discontinued at 24 h for set
point 5.0, and 48 h for set point 4.0. Figure 3.15 shows pH values before adjustment, and directly
after adjustment, for the duration of the experiment.
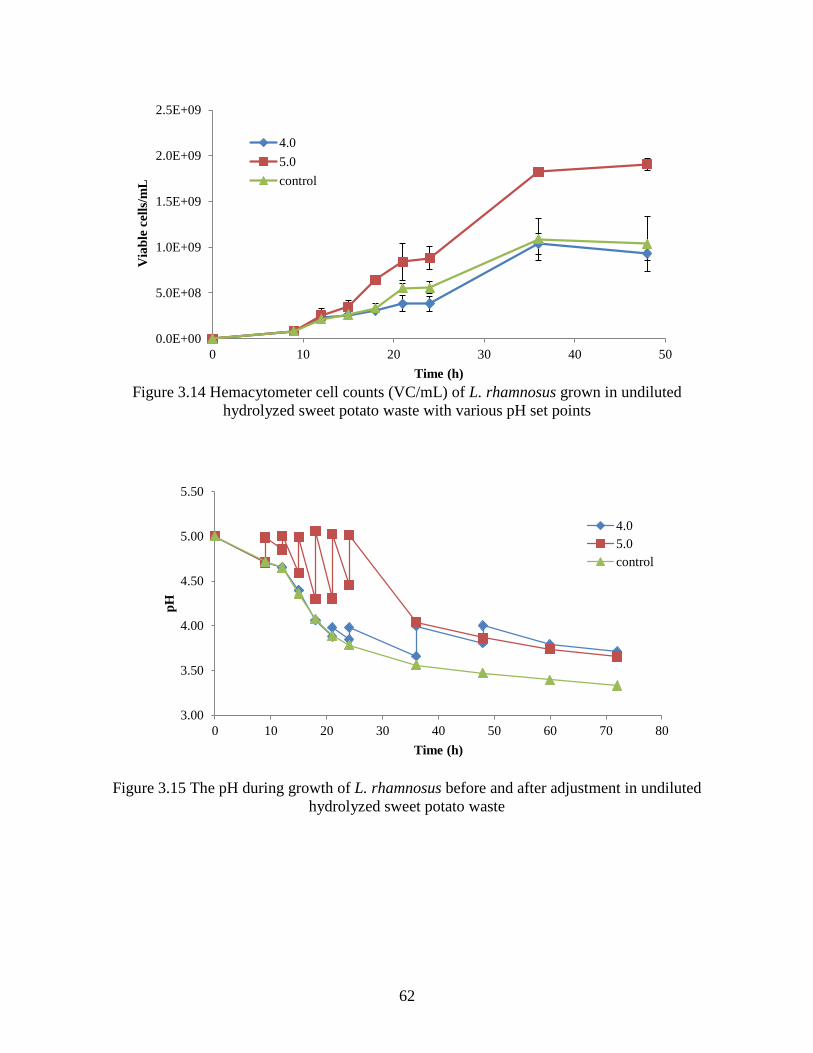
62
Figure 3.14 Hemacytometer cell counts (VC/mL) of L. rhamnosus grown in undiluted
hydrolyzed sweet potato waste with various pH set points
Figure 3.15 The pH during growth of L. rhamnosus before and after adjustment in undiluted
hydrolyzed sweet potato waste
0.0E+00
5.0E+08
1.0E+09
1.5E+09
2.0E+09
2.5E+09
0 10 20 30 40 50
Via
ble
cel
ls/m
L
Time (h)
4.0
5.0
control
3.00
3.50
4.00
4.50
5.00
5.50
0 10 20 30 40 50 60 70 80
pH
Time (h)
4.0
5.0
control

63
Figure 3.16 indicates that consumption of glucose by L. rhamnosus was generally higher
in the pH 5.0 set point than pH 4.0 set point or control. The slope of each line represents the rate
of glucose consumption, which is higher (steeper) at pH set point 5.0 than the other 2 treatments.
This is probably due to a higher number of cells in the flasks maintained at a pH of 5.0, but could
also be attributed to a higher rate of metabolism per cell. This can be calculated given accurate
cell counts, but as described earlier in this chapter, getting accurate cell counts was very difficult.
Any calculations based on those numbers would be highly suspect.
Not surprisingly, the pH set point of 5.0 had the highest supernatant lactic acid
concentration, while no pH control had the lowest (Figure 3.17). Interestingly, although the pH
5.0 set point condition had almost twice as many cells as the pH 4.0 set point and the control,
there was not twice the concentration of lactic acid. The rate of lactic acid production is faster
(has a steeper slope) in the first 36 h of production than in the last 24 h. This could be affected by
the increased osmotic pressure due to the addition of sodium hydroxide. Figure 3.14 indicates
that the exponential growth phase of this treatment corresponds with the faster rate of
production. Interestingly, the pH 4.0 set point condition did not exhibit the same change in
growth rate as the pH 5.0 set point. It is possible that the change in osmotic pressure caused by
the additional of excess base affects cells in the exponential growth phase more than it affects
cells in the stationary growth phase. Indeed, Piuri et al. (2005) found that modifications in cell
wall allow L. casei to swell in response to a high salt environment, which slows growth and
inhibits cell division when compared to cells grown without excess salt.

64
Figure 3.16 Glucose concentrations during growth of L. rhamnosus in undiluted hydrolyzed
sweet potato waste
Figure 3.17 Lactic acid production during growth of L. rhamnosus in undiluted hydrolyzed sweet
potato waste media
19.0
21.0
23.0
25.0
27.0
29.0
31.0
33.0
0 10 20 30 40 50 60 70 80
Glu
cose
co
nce
ntr
ati
on
(g
/L)
Time (h)
4.0
5.0
control
0.0
1.0
2.0
3.0
4.0
5.0
6.0
7.0
8.0
9.0
10.0
0 10 20 30 40 50 60 70 80
La
ctic
aci
d (
g/L
)
Time (h)
4.0
5.0
control

65
CONCLUSION
L. rhamnosus has the ability to effectively grow and produce lactic acid in hydrolyzed
sweet potato processing waste without further supplementation. A maximum lactic acid yield of
almost 10 g/L in the undiluted hydrolyzed sweet potato waste material shows great promise for
economical conversion of this waste material. L. rhamnosus can produce 1 g of lactic acid per 1
g glucose consumed, and an optimization of the production system starting with 30 g/L glucose
in the sweet potato waste could theoretically yield 30 g/L lactic acid.

66
Chapter 4: CONCLUSIONS AND FUTURE RESEARCH
Utilization of sweet potato processing waste for production of lactic acid has been proven
possible in this research. A simple hydrolysis process involving treatment with 80 U of
glucoamylase per 100 g of waste efficiently hydrolyzes the available starch into glucose within
24 h. Fermentation of this hydrolyzed waste using Lactobacillus rhamnosus and pH control
produced close to 10 g/L lactic acid. Optimization of production processes could result in higher
lactic acid yields, since approximately 66% of the available glucose remained unused.
Supplementation with other agricultural wastes rich in protein, as used by Altaf et al.
(2007) and Lu et al. (2009), might be a cost effective method to extend the logarithmic growth
phase and increase cell number. Simultaneous enzyme hydrolysis and fermentation could result
in reduced fermentation time, as would inoculation of higher starting cell densities. Another
possible improvement of lactic acid yields might be achieved using a continuous production
process. Perfusion technology results in increased cell densities, and the ability of L. rhamnosus
to produce lactic acid throughout the stationary growth phase makes this cell line a good
candidate for this technology. This research proves that sweet potato processing waste can be
used to produce lactic acid in batch mode, and the production of other value-added products is
possible via fermentation.

67
REFERENCES
Altaf MD, Venkateshwar M, Srijana M, Reddy G. 2007. An economical approach to L-(+) lactic
acid fermentation by Lactobacillus amylotrophus GV6 using inexpensive carbon and
nitrogen sources. Journal of Applied Microbiology 103(2):372-380
Auras R, Harte B, Selke S. 2004. An overview of polylactides as packaging material. Macromol
Biosci 4(9):835-864
Aziz NH, Mohen GI. 2002. Bioconversion of acid- and gamma-ray-treated sweet potato residue
to microbial protein by mixed cultures. Journal of Industrial Microbiology & Biotechnology
29(5):264-267
Baba T, Kainuma K. 1987. Partial hydrolysis of sweet-potato starch with β-amylase. Agricultural
and Biological Chemistry 51(5):1365-1371
Babbar N, Oberoi H, Uppal DS, Patil RT. 2011. Total phenolic content and antioxidant capacity
of extracts obtained from six important fruit residues. Food Research International 44(1):391-
396
BOA (Board on Agriculture). Underutilized Resources as Animal Feedstuffs. Washington DC:
The National Academies Press, 1983
Bustos G, Moldes AB, Cruz JM, Dominguez JM. 2005. Production of lactic acid from vine-
trimming wastes and viticulture lees using a simultaneous saccharification fermentation
method. Journal of the Science of Food and Agriculture 85:466-472
Calabia BP, Toikwa Y. 2007. Production of D-Lactic acid from sugarcane molasses, sugarcane
juice and sugar beet juice by Lactobacillus delbrueckii. Biotechnol Lett 29:1329-1332
Caplice E, Fitzgerald GF. 1999. Food Fermentations: role of microorganisms in food production
and preservation. International Journal of Food Microbiology 50(1-2):131-149
Carole TM, Pellegrino J, Paster MP. 2004. Opportunities in the industrial biobased products
industry. Applied Biochem and Biotechnol 113(116):871-885
Chang Rupp PL, Schwartz SJ. 1988. Characterization of the action of Bacillus subtilus alpha-
amylase on sweet potato starch, amylose and amylopectin. Journal of Food Biochemistry
12:191-203
Chervaux C, Ehrlich SD, Maguin E. 2000. Physiological study of Lactobacillus delbrueckii
subsp. bulgaricus strains in a novel chemically defined medium. Appl and Environ Micro
66(12):5306-5311
Colston NV, Smallwood Jr. C. 1973. Waste water characterization of sweet potato processing.
Water Pollution Control Federation 45(9)1972-1977
Datta R, Henry M. 2006. Lactic Acid: recent advances in products, processes and technologies-a
review. Journal of Chemical Technology & Biotechnology 81(7):1119-1129

68
De Lima CJB, Coelho LF, Contiero J. 2010. The use of response surface methodology on
optimization of lactic acid production: focus on medium supplementation, temperature and
pH control. Food Technology and Biotechnology 48(2):175-181
Del Campo I, Alegria I, Zazpe M, Echeverria M, Echeverria I. 2006. Diluted acid hydrolysis
pretreatment of agri-food wastes for bioethanol production. Industrial Crops and Products
24(3):214-221
Du J, Shao Z, Zha H. 2011. Engineering microbial factories for synthesis of value-added
products. Journal of Industrial Microbiology & Biotechnology 38(8)873-890
Economic Research Service, USDA. 2002. Commodity Spotlight: Sweet potatoes: getting to the
root of demand. Agricultural Outlook November 2002:13-17
Edmond JB. Sweet Potatoes: Production, Processing, Marketing. Westport, Connecticut: The
AVI Publishing Company, inc. 1971
Edwards C. 1996. Assessment of viability of bacteria by flow cytometry. Flow Cytometry
Applications in Cell Culture :291-310
Eguees I, Sanchez C, Mondragon I, Labidi J. 2012. Antioxidant activity of phenolic compounds
obtained by autohydrolysis of corn residues. Industrial Crops and Products 36(1):164-171
El-Masry HG, Ahmed MF. 1991. Utilization of some cannery wastes in microbial protein
production. Egyptian Journal of Botany 32(1-2):85-94
Fan Y, Zhou C, Zhu X. 2009. Selective catalysis of lactic acid to produce commodity chemicals.
Catalysis Reviews 51(3):293-324
Fukushima K, Sogo K, Miura S, Kimura Y. 2004. Production of D-lactic acid by bacterial
fermentation of rice starch. Macromol Biosci 4:1020-1027
Global Industry Analysts, inc. 2011. Lactic Acid: A global strategic business report.
http://www.strategyr.com/Lactic_Acid_Market_Report.asp
Gurgel PV, Furian SA, Martinez SER, Manchilha IM. 1998. Evaluation of sugarcane bagasse
acid hydrolyzate treatments for xylitol production. Brazilian Journal of Chemical
Engineering 15(3):309-312
Haddadin MSY, Abu-Reesh IM, Haddadin FTS, Abu Al-Rub MT, Robinson RK. 2001. Aspects
of the economic utilization of waste materials from tomato processing. Recent Dev in
Ag&Food Chem 5:113-123
Hills, DJ, Roberts DW. 1982. Conversion of tomato, peach, and honeydew solid waste into
methane gas. Transactions of the ASAE 25(3):820-826
Huang LP, Jin B, Lant P. 2005. Direct fermentation of potato starch wastewater to lactic acid by
Rhizopus oryzae and Rhizopus arrhizus. Bioprocess Biosyst Eng 27:229-238
69
Huber R, Scheidle M, Dittrich B, Klee D, Buch J. 2009. Equalizing growth in high-throughput
small scale cultivations via precultures operated in fed-batch mode. Biotechnology and
Bioengineering 103(6):1095-1102
Jiang L, Rozelle S, Huang J. 1993. Production, technology, and postharvest processing of sweet
potatoes in Sichuan Province. Unpublished report of CIP subproject 6211, pg 63
John RP, Nampoothiri KM, Pandey A. 2005. Solid-state fermentation for L-Lactic acid
production from agro wastes using Lactobacillus delbrueckii. Process Biochemistry 41:759-
763
John RP, Nampoothiri KM, Pandey A. 2007. Fermentative production of lactic acid from
biomass: an overview on process developments and future perspectives. Appl Microbiol
Biotechnol 74:524-534
Kander O, Weiss N. 1986. Section 14. Regular, nonsporing gram-positive rods pg. 1219-1226. In
Sneath PHA, Mari NS, Sharpe ME, and Holt JG (ed). Bergey’s Manual of Systematic
Bacteriology, vol.2. The Williams & Wilkins Co, Baltimore
Kirk-Othmer. 2004. Enzyme Applications, Industrial. In Encyclopedia of Chemical Technology
pp. 280-296. Wiley-Interscience, Hoboken. NJ
Knol W, Van der Most MM, De Waart J. 1978. Biogas production from anaerobic digestion of
fruit and vegetable waste, a preliminary study. Journal of the Science of Food and
Agriculture 29(9):822-830
Kotecha PM, Kadam SS. 1998. Sweet Potato. Food Science and Technology, issue Handbook of
Vegetable Science and Technology 86:71-97
Kroyer GT. 1991. Food processing wastes. In Bioconversion of Waste Materials to Industrial
Products (Martin, AM, ed) pp.293-311, Springer, NY, NY
Kruger JE, Lineback DR. 1987. Carbohydrate-degrading enzymes. In Enzymes and Their Role in
Cereal Technology (Stauffer CE, ed) pp.117-139. AACC, St Paul, MN
Kruger JE, Marchylo B. 1972. Use of reduced β-limit dextrin as substrate in an automated
amylase assay. Cereal Chemistry 49(4):453-458
Litchfield JH. 1996. Microbiological production of lactic acid. Advances in Applied
Microbiology 42:45-95
Lu Z, Lu M, He F, Yu L. 2009. An economical approach for D-lactic acid production utilizing
unpolished rice from aging paddy as major nutrient source. Bioresource Technology
100(6):2026-2031
Mel M, Abdul Karim MI, Salleh MRM, Amin NAM. 2008. Optimizing media of lactobacillus
rhamnosus for lactic acid fermentation. Journal of Applied Sciences 8(17)3055-3059

70
Moore K, Sherman C, Hymbaugh S, Mandijny S, Holmes L, Tirla C. 2008. Studies for the
production of ethanol from sweet potato remnants. Abstracts, 60th
Southeast Regional
Meeting of the American Chemical Society, Nov 12-15.
Nakanishi K, Ueno T, Sato S, Yoshi S. 2010. L-lactic acid production from canned pineapple
syrup by rapid sucrose catabolizing lactobacillus paracasei NRIC 0765. Food Sci Technology
16(3):239-246
Narayanan N, Roychoudhury PK, Srivastava A. 2004. L(+) lactic acid fermentation and its
product polymerization. Electronic Journal of Biotechnology 7(2):167-179
Nigam JN. 1999. Continuous ethanol production from pineapple cannery waste. Journal of
Biotech 72(3):197-202
Nijenhuis AJ, Colstee E, Grijpma DW, Pennings AJ. 1996. High molecular weight poly (L-
lactide) and poly (ethylene oxide) blends: thermal characterization and physical properties.
Polymer 37(26):5849-5857
Noda T, Takahata Y, Nagata T, Kumamoto, Monma M, Ibaraki. 1992. Digestibility of sweet
potato raw starches by glucoamylase. Starch/Starke 44(1):32-35
Noda T, Takahata Y, Nagata T, Kumamoto. 1992. Developmental changes in properties of sweet
potato starches. Starch/Starke 44(11):405-409
Noda T, Takahata Y, Kumamoto, Nagata T, Shibuya N, Ibaraki. 1994. Chemical composition of
cell wall material from sweet potato starch residue. Starch/Starke 46(6):232-236
Ohashi R, Yamamoto T, Suzuki T. 1999. Continuous production of lactic acid from molasses by
perfusion culture of lactococcus lactis using a stirred ceramic membrane reactor. Journal of
Bioscience and Bioengineering 87(5):647-654
Olaoye OA, Sanni CO. 1988. Mineral contents of agricultural products. Food Chemistry
30(1):73-77
Olaoye OA, Onilude AA, Dodd CER. 2008. Identification of Pediococcus spp. from beef and
evaluation of their lactic acid production in varying concentrations of different carbon
sources. Adv in Natural and Applied Sciences 2(3):197-207
Ouchi T, Kontani T, Ohya Y. 2003. Modification of polylactide upon physical properties by
solution-cast blends from polylactide and polylactide-grafted dextran. Polymer 44(14):3927-
3933
Paige D, Boulton R. 1978. The production of ethanol from agricultural waste-an economic
evaluation. University of California at Davis, Report CAEC-28:1-31
Palaniswami MS, Peter KV. 2008. Tuber & Root Crops: Vol.9. Horticulture Science Series, New
India Publishing, pgs 381-395
Pang X, Zhuang X, Tang Z, Chen X. 2010. Polylactic acid (PLA): research, development, and
industrialization. Biotechnol Journal 5(11):1125-1136

71
Piuri M, Sanchez-Rivas C, Ruzal SM. 2005. Cell wall modifications during osmotic stress in
Lactobacillus casei. Journal of Applied Microbiology 98(1):84-95
Purcell AE, Walter Jr WM, Giesbrecht FG. 1978. Protein and amino acids of sweet potato
(Ipomoea batatas (L.) Lam.) fractions. Journal of Agric Food Chem 28(3):699-701
Ravindran V, Ravindran G, Sivakanesan R, Rajaguru SB. 1995. Biochemical and nutritional
assessment of tubers from 16 cultivars of sweetpotato (Ipomoea batatas L.). Journal of Agric
Food Chem. 43:2646-2651
Ray LG, Mukherjee G, Majumdar SK. 1991. Production of lactic acid from potato fermentation.
Indian J. Exptl. Biol. 29:681-682
Ray RC, Ward OP. 2006. Microbial Biotechnology in Horticulture volume 1. Science Publishers,
Enfield, NH, pgs 365-366
Sarasua JR, Prud’homme RE, Wisniewski M, Le Borgne A, Spassky N. 1998. Crystallization
and melting behavior of polylactides. Macromolecules 31(12):3895-3905
Savijoki K, Suokko A, Palva A, Varmanen P. 2006. New convenient defined media for [35
S]
methionine labeling and proteomic analyses of probiotic lactobacilli. Letters in Applied
Microbiology. 42:202-209
Schaub SM, Leonard JJ. 1996. Composting: An alternative waste management option for food
processing industries. Trends Food Sci Technol 7(8):263-268
Shen L, Haufe J, Patel MK. 2009. Overview and market projection of emerging bio-based
plastics, PROBIP Final Report June 2009. www.epnoe.eu/research/Life-Cycle-Analysis.
Accessed Nov 2010
Shindo S, Tachibana T. 2004. Production of L-Lactic acid from spent grain, a by-product of the
beer industry. Journal Inst Brewing 110(4):347-351
Singhvi M, Joshi D, Adsul M, Varma A, Gokhale D. 2010. D(-)-lactic acid production from
cellobiose and cellulose by Lactiobacillus lactis mutant RM2-24. Green Chemistry 12:1106-
1109
Sistrunk WA, Karim IM. 1977. Disposal of lye-peeling wastes from sweet potatoes by
fermenting for livestock feed. Arkansas Farm Research 26(1):8
Smith DA, Turner JL, Hollingsworth MH. 1983. Peel and trim yield and quality of beets and
sweet potatoes peeling with superheated steam, saturated steam, and lye. Journal of the
American Society for Horticultural Science 107(6):1160-1163
Terrade N, Mira do Orduna R. 2009. Determination of the essential nutrient requirements of
wine-related bacteria from the genera Oenococcus and Lactobacillus. Intl Journal of Food
Microbiology 133:8-13
Tsuji H. 2002. Autocatalytic hydrolysis of amorphous-made polylactides: effects of l-lactide
content, tacticity, and enantiomeric polymer blending. Polymer 43(6):1789-1796
72
US Dept of Agriculture, Economics, Statistics, and Market Information website:
http://usda.mannlib.cornell.edu/MannUsda/viewDocumentInfo.do?documentID=1492. US
sweet potato statistics, table 36. Updated June 2011. Accessed Jan 2012
US Dept of Energy, Energy Efficiency and Renewable Energy website:
http://www1.eere.energy.gov/biomass/pdfs/35523.pdf. Top Value added chemicals from
Biomass, Volume 1. Aug 2004. Accessed Nov 2010
Walter Jr. WM, Schadel WE. 1982. Effect of lye peeling conditions on sweet potato tissue.
Journal of Food Science 47:813-817
Wang L, Zhao B, Liu B, Yu B, Ma C, Su F, Hua D, Li Q, Ma Y, Zu P. 2010. Efficient
production of L-lactic acid from corncob molasses, a waste by-product in xylitol production,
by a newly isolated xylose utilizing Bacillus sp. strain. Bioresource Technology
101(20):7908-7915
Wang Q, Chen S, Zhang J, Sun M, Liu Z, Yu Z. 2008. Co-producing lipopeptides and poly-γ-
glutamic acid by solid-state fermentation of Bacillus subtilis using soybean and sweet potato
residues and its biocontrol and fertilizer synergistic effects. Bioresource Technology
99(8):3318-3323
Wang ZY, Zhao YM, Wang F, Wang J. 2006. Synthesis of poly (lactic acid-co-glycolic acid)
serial biodegradable polymer materials via direct melt polycondensation and their
characterization. Journal of Applied Polymer Science 99(1):244-252
Wongkhalaung C. 1995. Lactic acid fermentation of sweetpotato. Kasetsart J (Nat Sci) 29:521-
526
Vandenbergh P. 1993. Lactic acid bacteria, their metabolic products and interference with
microbial growth. FEMS Microbiology Reviews 12(1-3):221-237
Vink ETH, Glassner DA, Kolstad JJ, Wooley J, O’Connor RP. 2007. The eco-profiles for current
and near-future NatureWorks® polylactide (PLA) production. Industrial Biotechnology
3(1):58-81
Yang SS, Ling MY. 1989. Tetracycline production with sweet potato residue by solid state
fermentation. Biotechnology and Bioengineering 33(8):1021-1028
Yang SS, Yuan SS. 1990. Oxytetracycline production by Streptomyces rimosus in solid state
fermentation of sweet potato residue. World Journal of Microbiology & Biotechnology
6(3):236-244
Yang SS. 1993. Protein enrichment of sweet potato residue with co-culture of amylolytic fungi
by solid-state fermentation. Biotechnology Advances 11(3):495-505
Yu L, Lei T, Ren X, Pei X, Feng Y. 2008. Response surface optimization of (+)-lactic acid
production using corn steep liquor as an alternative nitrogen source by Lactobacillus
rhamnosus CGMCC 1466. Biochemical Engineering Journal 39(3):496-502

73
Zanoni P, Farrow JAE, Phillips BA, Collins MD. 1987. Lactobacillus pentosus (Fred, Peterson,
and Anderson) sp. nov., nom. rev. International Journal of Systematic Bacteriology
37(4):339-341
Zhang Z, Jin B. 2010. L(+)-lactic acid production using sugarcane molasses and waste potato
starch: An alternative approach. International Sugar Journal 112(1333)17-22
Zobel HF, Young SN, Rocca LA. 1988. Starch gelatinization: an x-ray diffraction study. Cereal
Chemistry 65(6):443-446

74
APPENDIX 1: Verification of HPSEC-RI column performance using DMSO solubilized potato
starch (A) and isoamylase debranched potato starch (B)
0
1
2
3
4
5
6
7
8
20 25 30 35 40 45 50
MV
Time (min)
A B

75
APPENDIX 2: HPSEC-RI profiles of sweet potato processing waste (A) compared to sweet
potato processing waste with 1 mg/mL spikes of glucose (B), fructose (C), or sucrose (D)
0
5
10
15
20
20 25 30 35 40 45 50
MV
Time (min)
A B
0
5
10
15
20
20 25 30 35 40 45 50
MV
Time (min)
A C
0
5
10
15
20
25
30
20 25 30 35 40 45 50
MV
Time (min)
A D
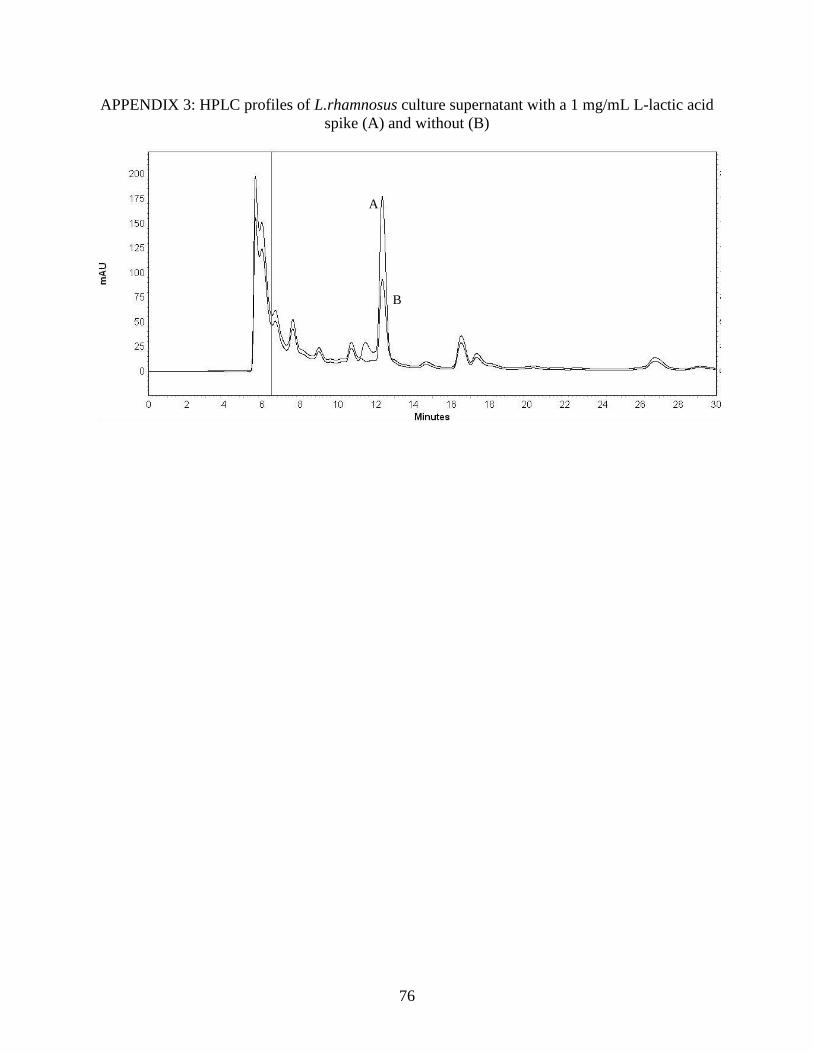
76
APPENDIX 3: HPLC profiles of L.rhamnosus culture supernatant with a 1 mg/mL L-lactic acid
spike (A) and without (B)
A
B