labour market overview chester
TRANSCRIPT

Synopsis: The following is a summary of labour market statistics for Chester and the surrounding areas. Its aim is to provide an understanding of the size and quality of the workforce within a reasonable commuting distance of Chester railway station.
Commuting distances from Chester railway station The map below shows the car commuting times of 10, 20, 30 and 45 minutes from Chester railway station. Travel times are based on 85% of road speed limits to account for the fact that traffic can travel slower than the actual speed limits
Map 1: Car commute times from Chester railway station.
Labour Market Overview Chester January 2020

2
Table 1: Population and Worker Availability
Population and Worker Availability
Car commute from Chester Railway station
Total Population*
16-74 Population* 16-24 Population* Total Economically Active**
Up to 10 minutes 112,166 82,256 13,719 56,374
Up to 20 minutes 317,467 229,371 31,949 159,520
Up to 30 minutes 1,299,673 955,279 154,719 629,067
Up to 45 minutes 2,894,413 2,106,850 306,617 1,416,367
* population information is from 2018 mid-year population estimates
** Economically active from Census 2011 (KS601EW) Contains public sector information licensed under the Open Government Licence v3.0
Within a 30 minutes commute there are over 600,000 economically active people potentially available for employment.
Table 2: Household access to cars or vans
Access to personal transport
Car commute from Chester Railway station
Total Households Households with 1 or more Car or
Van
Percentage of households with 1 or more Car or Van
Up to 10 minutes 47,104 35,545 75%
Up to 20 minutes 132,520 106,579 80%
Up to 30 minutes 542,830 391,484 72%
Up to 45 minutes 1,204,620 868,604 72%
Source: Census 2011 (KS404EW) Contains public sector information licensed under the Open Government Licence v3.0
Around three quarters of households have access to at least one motor vehicle across the commuting intervals.
Table 3: Workforce availability by occupation type.
Occupation Type
Car commute from Chester Railway station
Occupation Type Up to 10 minutes
Up to 20 minutes
Up to 30 minutes
Up to 45 minutes
1. Managers, Directors and Senior Officials 5,811 16,011 55,192 125,511
2. Professional Occupations 10,758 26,552 100,134 223,027
3. Associate Professional and Technical Occupations
6,734 18,368 68,148 153,081
4. Administrative and Secretarial Occupations 5,275 16,417 66,770 154,494
5. Skilled Trades Occupations 4,946 16,537 60,637 136,011
6. Caring, Leisure and Other Service Occupations
4,393 13,241 55,781 127,540
7. Sales and Customer Service Occupations 5,284 14,358 55,076 123,132
8. Process, Plant and Machine Operatives 3,262 11,877 47,250 104,103
9. Elementary Occupations 6,168 16,417 66,230 150,132 Source: Census 2011 (KS608EW) Contains public sector information licensed under the Open Government
Licence v3.0

3
Within a 30 minute commute of the Chester railway station:
Over 150,000 people are employed in professional and managerial roles.
Over 130,000 people are employed within administrative and associate professional/technical roles.
Table 4: Highest level of qualification.
Highest level of Qualification
Qualification level
Car commute from Chester
Railway station
No Qualifications
Level 1 Level 2 Apprenticeship Level 3 Level 4
and above
Other Qualifications
Up to 10 minutes 17,618 10,855 13,071 2,992 12,426 28,791 3,690
Up to 20 minutes 53,119 34,237 40,756 10,902 33,178 72,035 10,170
Up to 30 minutes 243,032 138,076 164,269 38,354 141,495 266,220 42,440
Up to 45 minutes 564,987 313,860 366,304 84,758 293,410 574,262 92,752
Source: Census 2011 (KS501EW) Contains public sector information licensed under the Open Government Licence v3.0
Within a 30 minute commute of the Chester railway station:
Over a quarter of a million people with level 4 and above; Level 4 and above represents those with a degree qualification or equivalent and up.
There are close to three quarters of a million people (748,414 people) with Level 2 (equivalent of 5+ GCSE’s) qualifications and above.
Table 5: People Claiming Unemployment Benefits
People claiming Unemployment Benefits (October 2019)
All: Aged 16+ Aged 16-24
Car commute from Chester
Railway station
Universal Credit 'Searching for
Work' JSA
Total Claimant
Count
Universal Credit 'Searching for
Work' JSA
Total Claimant
Count
Up to 10 minutes 1,890 135 2,015 390 5 425
Up to 20 minutes 4,340 460 4,830 780 5 940
Up to 30 minutes 23,280 3,280 26,670 4,600 75 5,250
Up to 45 minutes 53,135 7,660 60,920 10,405 105 11,810
Source: ONS Crown Copyright Reserved [from Nomis on 14 January 2020], Department for Workplace and Pensions
Numbers are rounded to the nearest 5 and are subject to independent rounding. Therefore, the sum of independent components may not sum precisely to the total.
Note: The claimant count measures the number of people claiming JSA and those placed in the Universal Credit (UC) 'searching for work category'. As UC is rolled out across the country and more
people are included in the 'searching for work' category, the count is set to rise irrespective of economic conditions. (See Glossary for further details.)
Within a 30 minute commute from Chester:
There are over 26,500 people claiming Job Seekers Allowance or Universal Credit (and have been placed in the ‘Searching for Work’ category).
Around 20% of those claimants are aged 16-24.
4
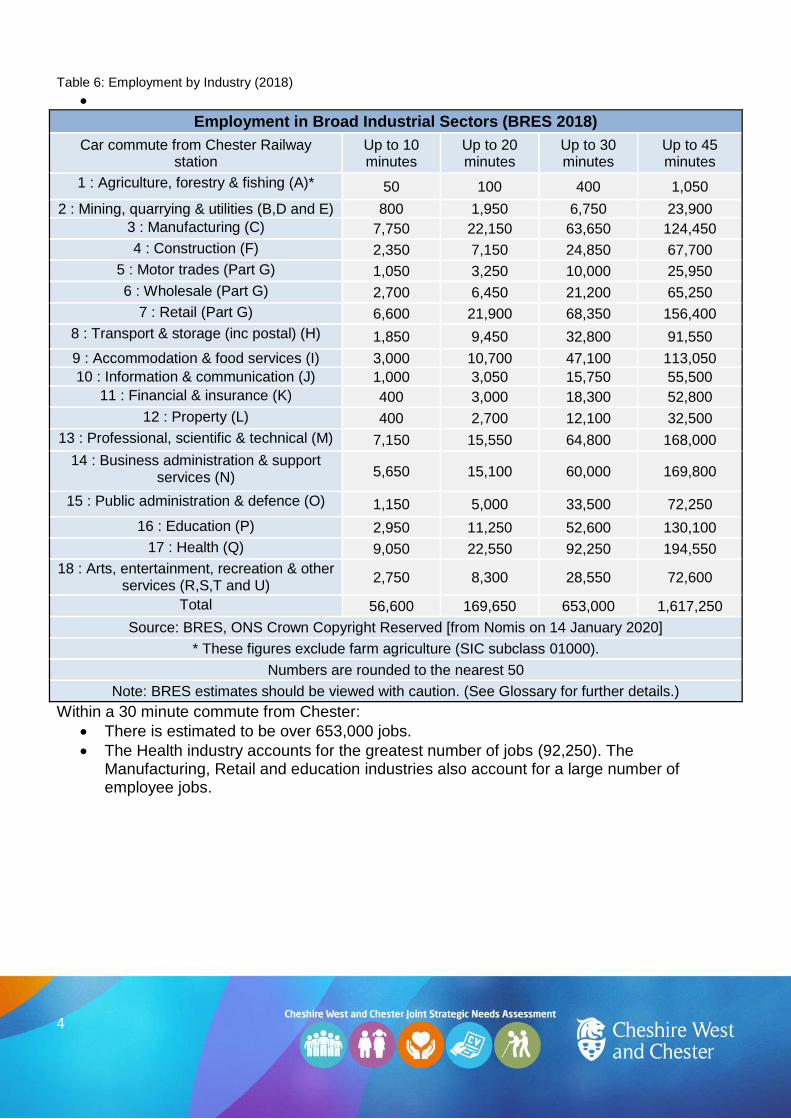
Table 6: Employment by Industry (2018)
Employment in Broad Industrial Sectors (BRES 2018)
Car commute from Chester Railway station
Up to 10 minutes
Up to 20 minutes
Up to 30 minutes
Up to 45 minutes
1 : Agriculture, forestry & fishing (A)* 50 100 400 1,050
2 : Mining, quarrying & utilities (B,D and E) 800 1,950 6,750 23,900
3 : Manufacturing (C) 7,750 22,150 63,650 124,450
4 : Construction (F) 2,350 7,150 24,850 67,700
5 : Motor trades (Part G) 1,050 3,250 10,000 25,950
6 : Wholesale (Part G) 2,700 6,450 21,200 65,250
7 : Retail (Part G) 6,600 21,900 68,350 156,400
8 : Transport & storage (inc postal) (H) 1,850 9,450 32,800 91,550
9 : Accommodation & food services (I) 3,000 10,700 47,100 113,050
10 : Information & communication (J) 1,000 3,050 15,750 55,500
11 : Financial & insurance (K) 400 3,000 18,300 52,800
12 : Property (L) 400 2,700 12,100 32,500
13 : Professional, scientific & technical (M) 7,150 15,550 64,800 168,000
14 : Business administration & support services (N) 5,650 15,100 60,000 169,800
15 : Public administration & defence (O) 1,150 5,000 33,500 72,250
16 : Education (P) 2,950 11,250 52,600 130,100
17 : Health (Q) 9,050 22,550 92,250 194,550
18 : Arts, entertainment, recreation & other services (R,S,T and U)
2,750 8,300 28,550 72,600
Total 56,600 169,650 653,000 1,617,250
Source: BRES, ONS Crown Copyright Reserved [from Nomis on 14 January 2020]
* These figures exclude farm agriculture (SIC subclass 01000).
Numbers are rounded to the nearest 50
Note: BRES estimates should be viewed with caution. (See Glossary for further details.)
Within a 30 minute commute from Chester:
There is estimated to be over 653,000 jobs.
The Health industry accounts for the greatest number of jobs (92,250). The Manufacturing, Retail and education industries also account for a large number of employee jobs.
5
Conclusions from commuting information: Within 30 minutes’ drive there are over 400,000 people with Level 3 qualifications and
above (level 3 is equivalent to two or more A levels, or a BTEC diploma or above)
Around 75% of households have access to at least one vehicle
Out of all of the occupation types, Professional occupations are the highest contributor to employment regardless of commuting distance.
Managers, directors and senior officials account for around 10% of all occupation types across all the commuting areas.
There are over 7,500 JSA claimants who are available for and actively seeking employment, and around 53,000 Universal Credit Searching for Work claimants that must search and prepare for work (or more work) within the 45 minute commuting area.
Jobs in the Health industry account for 14% of overall jobs within the 45 minute area.
There are over 570,000 economically active people educated to degree level or above within a 45 minute commuting distance of Chester railway station.
Cheshire West and Chester workforce statistics: There were around 206,500 people of working age (16-64) living in Cheshire West and
Chester.
Around a quarter (52,800) of people of working age (16-64) who lived in Cheshire West and Chester travelled outside of the Borough to work; over 51,000 who live outside the borough travel in to Cheshire West and Chester to work (Census 2011).
86% (180,400) of people of working age were in very good or good health; this is higher than the North West (83%) and similar to England and Wales (85%).
42% of residents aged 16+ were educated to at least level 3 qualifications; higher than the North West (37%) and England and Wales (40%).
The percentage of residents (aged 16 to 74) employed in higher managerial, administrative and professional occupations increased from 10% in 2001 to 12% in 2011. The percentage employed in lower managerial, administrative and professional occupations increased from 19% in 2001 to 22% in 2011.
The percentage of employees employed in professional or associate professional and technical occupations has increased from 26% in 2001 to 30% in 2011.
Looking ahead: The population in Cheshire West and Chester is forecast to increase by 10% between 2015 and 2035 reaching 366,700. This reflects an additional 22,000 new dwellings planned for 2010 to 2030 in the Local Plan. The labour supply is forecast to increase by from around 173,200 in 2015 to around 180,200 in 2035 within the Cheshire West and Chester Local Authority area.

6
Methodology This document was designed to provide an overview of the available workforce in Cheshire West and Chester and the surrounding areas. It provides key statistics and forecasts derived from detailed analysis of multiple data sets, including 2011 Census, NOMIS and our Cheshire West and Chester population forecasting. Car commuting times were identified as the key factor for worker availability (train travel only represents 2.8% of daily commuters – Census 2011), and as such were key to understanding the potential labour pool. Commuting times of 10, 20, 30 and 45 minutes were chosen to represent reasonable commuting times. These commuting intervals (isochrones) were calculated based on 85% of road speed limits, due to the fact that traffic can travel slower than the maximum speed limit. The railway station in Chester was used as the central commuting point. As can be seen in the map, motorways have a significant influence on commuting times and workforce access. To collate the data for workforce overview, the lower layer super output areas* (LSOAs) population weighted centroids that fell into the 10 min, 20min, 30min and 45min drive time isochrones were identified. These LSOA’s were then cross-referenced with the 2011 Census Data that provided key information on education, workforce participation, access to transport and occupation type amongst others. In the data tables, the numbers shown for each of the commuting isochrones are cumulative totals. * Lower Layer Super Output Areas (LLSOA’s or LSOA’s) are national statistical boundaries created by the Office for National Statistics to improve the reporting of small area statistics. They have a minimum population of 1000 people, and a mean population of 1500.
Glossary of terms Economically active: ‘Economically active’ covers those who were in full- or part-time employment and those not in employment but actively seeking and available for work (unemployed) - it includes full time students. Highest level of qualification;
No Qualifications: No academic or professional qualifications
Level 1 qualifications: 1-4 O Levels/CSE/GCSEs (any grades); Entry Level, Foundation Diploma; NVQ level 1; Foundation GNVQ; Basic/Essential Skills
Level 2 qualifications: 5+ O Level (Passes)/CSEs (Grade 1)/GCSEs (Grades A*- C); School Certificate; 1 A Level/ 2-3 AS Levels/VCEs; Intermediate/Higher Diploma; Welsh Baccalaureate Intermediate Diploma; NVQ level 2; Intermediate GNVQ; City and Guilds Craft; BTEC First/General Diploma; RSA Diploma.
Apprenticeship
Level 3 qualifications: 2+ A Levels/VCEs; 4+ AS Levels; Higher School Certificate; Progression/Advanced Diploma; Welsh Baccalaureate Advanced Diploma; NVQ Level 3; Advanced GNVQ, City and Guilds Advanced Craft, ONC, OND; BTEC National; RSA Advanced Diploma
Level 4+ qualifications: Degree (for example BA, BSc); Higher Degree (for example MA, PhD, PGCE); NVQ Level 4-5, HNC, HND, RSA Higher Diploma; BTEC Higher level; Foundation degree (NI),
Other qualifications: Vocational/Work-related Qualifications; Foreign Qualifications (Not stated/ level unknown).
Cars or vans in household: This is the number of cars or vans that are owned, or available for use, by one or more members of a household. This includes company cars and vans that are available for private use. It does not include motorbikes or scooters, or any cars or vans belonging to visitors.

7
Occupation: A person's occupation relates to their main job and is derived from either their job title or details of the activities involved in their job. This is used to assign responses to an occupation code based on the Standard Occupational Classification 2010 (SOC2010).
JSA: Job Seeker’s Allowance is an unemployment benefit. It can be claimed by people who are available for and
actively seeking employment. It was used as the headline figure for the Claimant Count, measuring the number of people claiming benefits for the reason of being unemployed, until the introduction of Universal Credit in 2013. Universal Credit: This is a monthly benefit payment which is replacing Child Tax Credit, Housing Benefit,
Income Support, income-based Jobseeker’s Allowance (JSA), income-related Employment and Support Allowance (ESA), Working Tax Credit. Each Universal Credit claimant will be put into one of six conditional regime categories based on their circumstances and capability to work. Universal Credit 'searching for work’ category: Part of the design of Universal Credit is to support and
encourage a wider group of benefit claimants into work. Claimants that are not working, or with very low earnings are required to secure work or more (better paid) work. These claimants must search and prepare for work, and are included in the Universal Credit ‘searching for work’ category.
Claimant Count: It is a measure of people claiming benefits principally for the reason of being unemployed. The
claimant count measures the number of people claiming JSA and those placed in the Universal Credit (UC) 'searching for work category'. As the number of claimants in the searching for work increases with the roll out of Universal Credit, the Claimant Count is set to rise irrespective of economic conditions. The Claimant Count has been reclassified from a National Statistic to an Experimental Official Statistic due inconsistencies within the series caused by universal credit. Caution should be taken when comparing the count over time and across locations due to the phased nature of the roll out of Universal Credit. BRES estimates: The Business Register and Employment Survey (BRES) is the official source of employee and
employment estimates by detailed geography and industry. The survey collects employment information from around 80,000 businesses across the whole of the UK economy for each site that they operate. These figures should be treated with caution as:
Reported workplace location and industry may not always be accurate especially for some business with employees on multiple sites or umbrella companies. (This particularly affects industries such as accounting, auditing and bookkeeping and other business support service activities.)
BRES is a sample survey and accuracy will depend on how representative the sample is and response rates over time.
BRES Statistics are subject to ONS rounding rules and the figures derived may be less precise than those based on the underlying, unrounded data.

Council information is also available in audio, braille, large print or other formats. If you would like a copy in a different format, in another language or require a British Sign Language interpreter, please email us
Telephone: 0300 123 8 123 Textphone: 18001 01606 867 670
Email: [email protected] Web: www.cheshirewestandchester.gov.uk
Accessing Cheshire West and Chester Council information and services.
Telephone: 01244 972176 Email: [email protected]
Insight and Intelligence, HQ, 58 Nicholas Street, Chester CH1 2NP Access JSNA products online www.cheshirewestandchester.gov.uk/jsna
If you would like further information about this report or other JSNA products, please contact Strategic Intelligence