labour market dynamics - international labour organization · 2014-06-09 · labour market...
TRANSCRIPT

EMPLOYMENT AND TRAININGPAPERS
38
Labour market dynamics:A global survey
of statistical activity
Peter StibbardConsultant
Employment and Labour Market Policies Branch
Employment and Training Department
International Labour Office Geneva
RECEIVEDii
1 i -;j
L;;;u OifjC9LO LL EiT
11111111111111111111111111111
45647'Ii

Copyright © International Labour Organization 1999
Publications of the International Labour Office enjoy copyright under Protocol 2 of the Universal Copyright Convention. Nevertheless,short excerpts from them may be reproduced without authorization, on condition that the source is indicated. For rights of reproductionor translation, application should be made to the ILO Publications Bureau (Rights and Permissions), International Labour Office,CH-121 1 Geneva 22, Switzerland. The International Labour Office welcomes such applications.Libraries, institutions and other users registered in the United Kingdom withthe Copyright Licensing Agency, 90 Tottenham Court Road,London W1P 9HE (Fax: +44171 436 3986), in the United States with the Copyright Clearance Center, 222 Rosewood Drive, Danvers,MA 01923 (Fax: +1 508 750 4470), or in other countries with associated Reproduction Rights Organizations, may make photocopies inaccordance with the licences issued to them for this purpose.
ISBN 92-2-111588-7ISS N. 1020-5322
First published 1999
The designations employed in ILO publications, which are in conformity with United Nations practice, and the presentation of materialtherein do not imply the expression of any opinion whatsoever on the part of the International Labour Office concerning the legal statusof any country, area or territory or of its authorities, or concerning the delimitation of its frontiers.The responsibility for opinions expressed in signed articles, studies and other contributions rests solely with their authors, andpublication does not constitute an endorsement by the International Labour Office of the opinions expressed in them.Reference to names of firms and commercial products and processes does not imply their endorsement by the International LabourOffice, and any failure to mention a particular firm, commercial product or process is not a sign of disapproval.
ILO publications can be obtained through major booksellers or ILO local offices in many countries, or direct from ILO Publications,International Labour Office, CH-121 1 Geneva 22, Switzerland. Catalogues or lists of new publications are available free of charge fromthe above address.
Printed by the International Labour Office, Geneva, Switzerland
Foreword
In 1996 the Committee on Employment Policies of the 83 session of the InternationalLabour Conference requested the International Labour Office to develop an expanded range ofindicators of labour market performance, and to assist member States in improving thecollection of labour market information and widening the range of labour market indicators.
Much of the response to this request is being taken forward in a project known as KeyIndicators of the Labour Market (KILM). The MLM project entails developing, maintainingand disseminating a database of up-to-date and relevant indicators for as wide a range ofcountries as possible. Guidelines and modules for measuring, collecting and analysing theselected labour market indicators are being prepared. The work is being carried out in closecollaboration with the ILO Bureau of Statistics and the field structure, in order to achieveconsistency and wide coverage in the data.
An initial list of 18 indicators has been chosen for data collection. These indicators willbecome known as the ILO Key Labour Market Indicators and will cover underemployment,educational attainment, poverty and income distribution, wages, labour costs and productivity.A new ILO publication (ILO Key Indicators of the Labour Market, to be published later in1999) will present the KILM database, along with succinct descriptions of the situation inlabour markets around the world.
The work described above is known as MLM Activity 1 and by its very nature can onlyconcern itself with the more traditional and well-established statistical indicators. Activity 2 ofthe project will develop and promote new indicators, capable of revealing new insights in thelabour market and the changing nature of employment. Bearing in mind that the 18 Activity 1indicators are almost entirely 'static' or 'snapshot' measurements at a point in time, it wasthought appropriate to begin Activity 2 with a study of the sources and analyses currently usedto measure labour movement and flows, in other words labour market dynamics (LMD).
This paper presents the results of the study, which are based partly on an examination ofliterature on LMD, assembled by various means, and partly on questionnaire responses fromnational statistical offices. A shorter account of the study will be presented in one of thechapters of ILO Key Indicators of the Labour Market, but the ILO is publishing this near-complete version of the consultant's report in advance, as a response to the fast-growinginterest in the measurement of labour market dynamics.
Gek-Boo NgChiefEmployment and Labour Market Policies Branch

ContentsPage
Foreword
Introduction
The scope and meaning of 'labour market dynamics' 1
2.1 Scope and definition 1
2.2 Labour Accounting Systems (LAS) 2
2.3 Defining labour market dynamics 2
2.3.1 Some examples 2
2.3.2 Sources and methods approach 3
2.4 LMD questiolmaire 3
2.4.1 Classification of LMD analyses 3
2.4.2 Design of questionnaire 4
2.4.3 Classification of sources and methods 4
2.4.4 Classification of types of rnilysis 4
2.5 Analytical units 6
2.6 OECD work 6
Database of references 7
3.1 Breakdown of database 7
3.2 Support documents 7
3.3 Country coverage 7
3.3.1 Sources and methods by country 8
3.3.2 Type of analysis by country 13
3.3.3 Analysis by source 15
3.4 General note on Section 3 18
Important aspects 19
4.1 Policy uses 19
4.2 Response to questionnaire request for information on policy uses 19
4.2.1 Less informative replies 19
4.2.2 More informative replies 20
4.3 Literature sources 21
4.4 Institutional responsibility 22
4.5 Accessibility 22
4.6 International comparability 23
4.7 Data presentation 24
4.8 Developing countries 26
Conclusions 28
5.1 Study fmdings 28
5.2 Possible ILO action 28
5.3 Final considerations 29
Annex 1: Terms of reference 30
Annex 2: Survey questionnaire 31
Annex 3: Sources of data: their respective advantages and disadvantages 42
Annex 4: OECD work 44
Annex 5: Basis of analyses in Section 3 55
Bibliography 57
1. Introduction
Increasingly, analysts and commentators realize that the most familiar and frequentlyused labour statistics - stock measurements of the number and composition of the employedand unemployed and derived net flows - provide only a limited contribution to understandingthe workings of labour markets. This realization is not confined to labour specialists. Thereis a growing appreciation of the pivotal role of labour markets in understanding economic andsocial developments generally and a consequential widening of interest in labour dynamics.
This is because a labour market is a system in continual movement. Counts ofemployment, unemployment and people outside the labour force give only still pictures at apoint in time; this is inadequate even when the comparatively rapid snapshots of a monthlyseries are available. Much of what is going on is not revealed. To shed light on the factors thatunderlie net changes in stocks, figures are wanted of gross as well as net flows between thecount dates or periods; also the labour market history of people and other analytical units overseveral years.
This paper describes the ways in which the need for data describing labour marketdynamics (LMD) are being met; the Terms of Reference are reproduced at Annex I. The studyis based partly on an examination of documents compiled in literature searches by ILOHeadquarters, within which OECD work - much of it published in Employment Outlook - isgiven a deservedly high profile; and partly on responses from 40 countries to a questionnaire(see Annex 2). The report also uses material assembled by the author when organizing a one-day session on LMD, held as part of the Conference of European Statisticians (CES) in June1996, including the organizer's discussion paper prepared for that occasion. The author'sattendance at meetings of the Groupe de Paris on Labour and Compensation over the past twoyears and the July 1998 KILM Workshop have also benefited this study. Collectively, thematerial gathered from these several sources falls short of being fully comprehensive, butshould be generally representative of recent practices and, thereby, should bring out the mainissues that need to be addressed in taking the topic further forward.
The layout of this paper is as follows: Section 2 deals with the coverage and otherconceptual issues relating to LMD. Section 3 describes the database of references created forthis study and provides some analyses derived from it. Section 4 discusses some key aspectsthat have emerged during the study. Section 5 draws some conclusions and offers somepointers for the future.
2. The scope and meaning of 'labour market dynamics'
2.1 Scope and definitionThere appears to be no definition of the full scope of LMD in common use; in fact there
have been scarcely any attempts to define the subject. This probably reflects the fact that, formost labour statisticians, it is not a recognized topic that can or should be separated from otherlabour statistics. In drawing a boundary round the subject it must be acknowledged,notwithstanding the introductory remarks made above, that the conventional stock figures arenot devoid of information on dynamics. Time series of stock data give net changes which tellus whether or not inflows exceed outflows. More pertinently, a single observation of anunemployment stock analysed by short- and long-term unemployment is, in effect, an LMD

2
statistic (and is included in the 18 Activity 1 KILM indicators as No. 10). The same can be saidabout an employment stock analysed by length of job tenure.
2.2 Labour Accounting SystemsLabour Accounting Systems (LAS) are intended to be a comprehensive framework for
looking at labour markets and therefore should encompass LMD. They have been describedby Eivind Hoffmann as a means for 'the description and analysis of the state and dynamics ofthe labour market and its interaction with the rest of the economy (author's underlining)
[including] studies of 'gross' changes ('flows') in the number of jobs and persons andtheir activities' The author provides a description of LMD data in an LAS context - asfollows:
'...User[s] . . .wil focus on various changes, such asthe net changes between reference periods in the number of persons in each statuscategory;the total number of changes occurring in the reference period;the total number of persons who experience at least one change within thereference period; and/or
(t) the number of persons who have changed status from one period (or one referencedate) to the next.
The numbers for (c)-(f) are only equal for short reference periods - periods which aretoo short for a post or a person to experience more than one change. We must expectthat in practice an LAS will mostly be concerned with (c) and (f) type changes forreasons relating to the availability of data
In discussions about LAS a fair amount has been said about 'flows' in the sense ofgross changes from one reference date to the next, for example item (e) ... above.Making sure that all possible forms of such changes have been identified andestimated, given the periodicity and reference periods, is one of the 'accountingrelationships' necessary within the LASOn ... issues ... such as a core set of change (or 'flow') tables ... it would seem usefulto develop international guidelines.'
LAS have scarcely developed beyond the theoretical stage and the few applications inindividual countries have so far concentrated largely on stock data. However, this study hasshown that Austria, Germany and Switzerland do have LMD data (gross flows) in an LASframework.
2.3 Defining labour market dynamics2.3.1 Some examplesTo convey the idea of data describing LMD to other people, one has to resort to near-
tautologies such as 'statistics that directly measure movement in labour markets'. More specificdefinitions tend to be rather lengthy; for example, a definition presented at the 1996 CESsession was:
Measurement over time of changes in the activity status of individuals (employed,unemployed and inactive) and of changes injobs of employed persons - either in termsof persons who have experienced changes; or the duration of completed spells in statusor job situations.
This definition excludes the dynamics of income from employment, and the demography anddynamics of workplaces. The latter is of interest in itself - describing aspects ofentrepreneurial job-creating and job-destroying activity - and also as a means of explainingsome changes in jobs and activity status.

3
2.3.2 Sources and methods approachAnother approach - perhaps particularly suitable for an audience of statisticians - is to
get them to think in terms of the sources and methods that are used to generate data describingLMD. The classification used for the 1996 CES paper was as follows:
Surveys of individuals and households1.1 Recall questions1.2 Rotation sample designs1.3 Longitudinal surveys
Establishment surveysRegisters and administrative records: personsRegisters and administrative records: establishmentsCombination and other methods
This categorization was utilized to demonstrate that there is no i&al single source of
LMD data - all of them had relative advantages and disadvantages; these are reproduced from
the CES paper at Annex 3.
2.4 LMD questionnaire2.4.1 Classification of LMD analysesThis 'sources and methods' approach was elaborated in the ILO questionnaire used to
collect and code information on current practices for this report, but was also supplemented
by a classification of types of LMD analyses. These are reproduced for convenience below and
are also shown in the questionnaire included in Annex 2 (Questions 3 and 4 respectively):
Sources and methods for data describing LMD
A Ad hoc survey of persons or households: recall questions
B Survey at regular intervals of persons or households, with a different sample each time: recall
questions
C Survey at regular intervals of persons or households: rotational sample design
D Longitudinal survey of individuals or households: cohort design
E Longitudinal survey of individuals or households: panel design
F Survey of workplace establishments: ad hoc
G Survey of workplace establishments at regular intervals
H Registers or administrative records: persons
i Registers or administrative records: workplace establishments
3 Other methods or combination of above sources
Type of LMD analysis
A Gross flows measuring transitions between labour market 'states'
B Labour and job turnover rates
C The creation and termination of jobs
D Births and deaths of firms and their life cycle
E Job tenureF Job securityG Frequency and length of periods of unemployment
H Aspects of labour market flexibility and mobility
I The profile of individuals' earnings over a period of time
J Absences to have or raise children and re-entry to the labour market
K The transition from full-time education into the labour force
L The move from work into retirement
M Other

4
Explanatory notes for most of these 'sources and method' codes were appended to thequestionnaire; explanatory notes of 'types of analyses' mainly took the form of illustrations ofLMD statistics (see pages 6-8 of the questionnaire included in Annex 2). By these means it ishoped that respondents to the questionnaire shared our understanding of the scope of the topic.
2.4.2 Design of questionnaireThe general approach to the design of the questionnaire was governed by two factors:to explain and clarify the meaning of data describing labour market dynamics and howthey differ from the more familiar stock data;to achieve a satisfactory response rate.This approach meant that the questionnaire could not be too lengthy nor complicated
and thus imposed constraints on the classification systems used for 'sources and methods' and'type of analysis' questions.
2.4.3 Classification of sources and methodsRegarding the classification systems used for 'sources and methods', although we have
used this familiar term, it is more a classification of 'sources' than 'methods'. Even for'sources' there is room for further elaboration. But for 'methods' there is much highly relevantinformation which was not gathered, for example on:° the types of survey questions asked (or recorded in the cases where administrative
sources were used) e.g. the date past labour market 'events' happened as opposed toestablishing what was the labour market status a fixed period ago - a year or quarter;whether 'dependent interviewing' techniques are employed or some other device toreduce error;whether specific weighting systems are used to compensate for the special problems ofnon-response and sample attrition which affect longitudinal surveys;whether the reporting unit for workplaces is the establishment or the enterprise.If we had attempted to collect all this information it would have resulted in a
questionnaire of great complexity which only a few enthusiasts would have completed.However, respondents were asked to supply references for their 'sources and methods' materialand this gives us the means to probe further, possibly at some future stage.
2.4.4 Classification of types of analysisRegarding the classification systems used for 'types of analysis', the approach was to
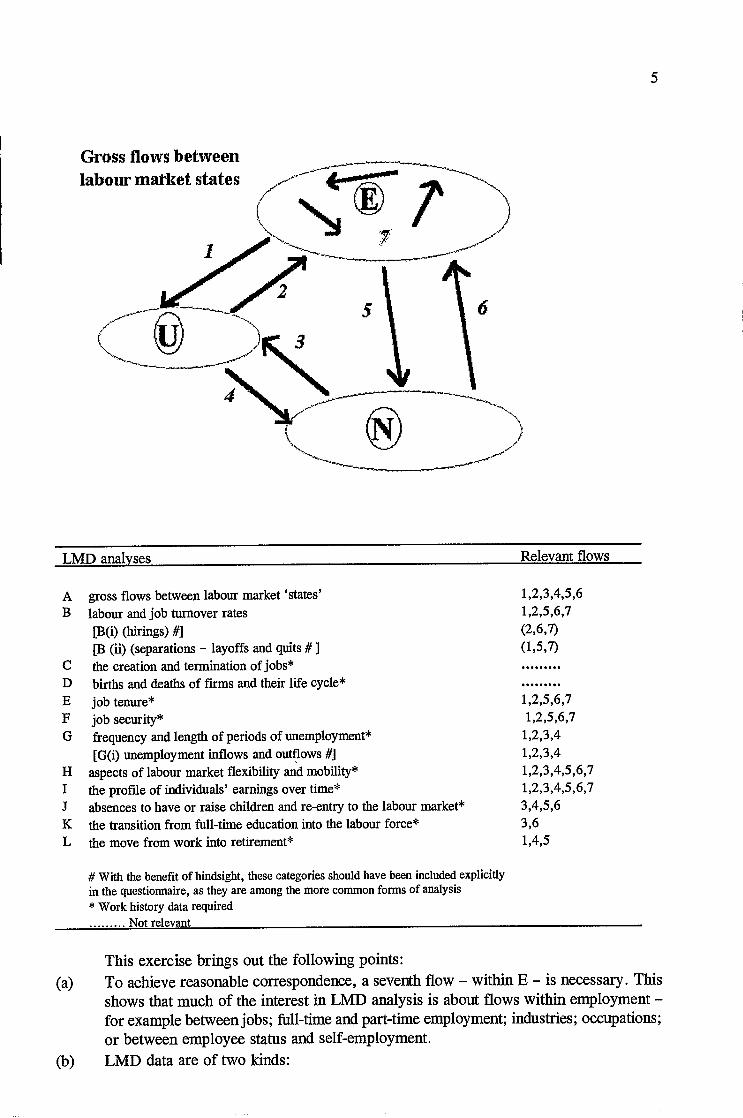
use reasonably familiar research headings topics that respondents would easily recognize. Aproblem with this approach is that the ideal properties of classification systems ofexhaustiveness and mutual exclusion are largely absent. There is work to be done in future toclassify the types of analyses rigorously in this way. As a first step towards developing sucha typology, the 'type of analysis' used in the questionnaire is mapped against the graphicalexpression of the familiar 3 X 3 transitions matrix as shown below. This shows the six flowsbetween the three basic labour market states of employment (E), unemployment (U) and 'notin the labour force' (N).
Gross flows betweenlabour market states
LMD analyses
A gross flows between labour market 'states'B labour and job turnover rates
[B(i) (hirings) #1[B (ii) (separations - layoffs and quits # I
C the creation and termination of jobs*D births and deaths of firms and their life cycle*E job tenure*F job security*G frequency and length of periods of unemployment*
[G(i) unemployment inflows and outflows #]H aspects of labour market flexibility and mobiity*I the profile of individuals' earnings over time*J absences to have or raise children and re-entry to the labour market*K the transition from full-time education into the labour force*L the move from work into retirement*
# With the benefit of hindsight, these categories should have been included explicitlyin the questionnaire, as they are among the more common forms of analysis* Work history data required
Not relevant
Relevant flows
1,2,3,4,5,61,2,5,6,7(2,6,7)(1,5,7)
1,2,5,6,71,2,5,6,7
1,2,3,41,2,3,41,2,3,4,5,6,71,2,3,4,5,6,73,4,5,63,61,4,5
5
This exercise brings out the following points:To achieve reasonable correspondence, a seventh flow - within E - is necessary. Thisshows that much of the interest in LMD analysis is about flows within employment -for example between jobs; full-time and part-time employment; industries; occupations;or between employee status and self-employment.LMD data are of two kinds:

6
short-term gross flows indicating a single change of status; the focus here is onthe status and the number of individuals entering and leaving it. Examples arecategories A and G(i) above which - besides being statistics in their own right- are also used as supporting explanatory statistics for net changes in stock data.longer-term work history data, tracking successive changes of status - whichoften involves more than one spell in a status U, E or N. The focus here is theindividual and what happens to him or her over an extended period. Examplesare starred in the above diagram and they comprise the majority of thecategories.
The inability of categories C and D to fit into this model shows that the analytical unitof interest is not necessarily the individual person.It follows from (a), (b) and (c) above that LMD analyses go well beyond what can beshown in the above gross flow diagram (or its tabular equivalent, the 3 X 3 matrix).
2.5 Analytical unitsIt is worth commenting further on (c) in the previous paragraph. Although the usual
analytical unit in LMD is the individual person, a full understanding also requires data on otheranalytical units:
jobs (including vacancies) - their creation, duration and destruction;workplaces, enterprises, establishments - their demography (births, deaths and lifecycle);events - for example, the beginning and end of labour market states: a hiring and aseparation - defining a period of employment; or a separation and a hiring - defininga period of unemployment. This is described as 'episodal' data in the Australian Surveyof Employment and Unemployment Patterns and is needed for the work history studiesmentioned above;the household or family - this is increasingly the focus of 'static' labour market studiesand will surely apply equally to LMD studies as they develop.
2.6 OECD workMoving from matters of general scope to particular elements of LMD studies, the
investigations for this study show that the most sustained attempts to conceptualize or definespecific elements of LMD - and (by implication) harmonize concepts and definitionsinternationally - have emanated from the OECD - either published in Employment Outlook(EO) or associated with the OECD in some other way. A digest of their work over the past tenyears or so is presented in Annex 4. Particularly useful features of OECD work are themeticulous recording of national sources of LMD data (a valuable input to this study) and thefrankness with which the formidable difficulties of international comparisons in this field arediscussed.
The most frequently visited subject in Annex 4 is labour turnover - decomposed intohirings and separations, the latter further decomposed into quits (voluntary separations) andlayoffs (involuntary separations). A distinction is made between labour turnover and jobturnover, and there is an associated interest in job, enterprise and employer tenure, whichappear to be alternative names for the same concept. All their work is valuable to thefurtherance of LMD studies, but to the author's mind their special contribution is to drawattention to the need for more and better enterprise-based data, and the contribution this wouldmake to understanding the process of job creation and loss. There is also interest in job-losers

7
and displaced workers and unemployment turnover, i.e. flows in and out of unemploymentrelative to the stock of unemployed people.
3. Database of references
3.1 Composition of databaseThis section presents analyses from the database of references, which has entries for:
each piece of literature identified during the study (see Introduction for their origin);
all the questionnaires dispatched - whether or not a response has been received. In thecase of those received, there is a separate entry on the database for each source/methodseparately identified in the completed questionnaire(s);every time a country's data has been used in an OECD study.Each entry is grouped by country and coded, where possible, according to the type of:
source and method;analytical topic.
3.2 Support documentsThree working documents were created to support the project:
a schedule to record completed questionnaires received by the author via the ILO;
a 'catalogue' of literature identified and received;the database of references, which is an Excel 4.0 spreadsheet recording the detailsmentioned in para 3.1 above.Annex 5 explains the analysis base for each of the tables in this section and their
relationship to each other.
3.3 Country coverageTable 3.1 ranks the 80 countries on the database by the total number of useful entries
(column d) and each case shows the make-up of those entries as follows:
Column a. Country-specific literature entries identified, received, examined and coded;
Column b. Questionnaire entries received and coded;
Column c. OECD studies received, examined, and coded (see also table at para. 34 in
Annex 4);The table also shows, for the record:
Column e. Country-specific literature entries identified but not coded because they were not
received;Columnf. Questionnaire dispatched but not received (also includes 'nil returns' reported -
indicated by #);Column g. Total entries on the database.[N.B. OBCD studies (and others by international organizations) identified but not received are
excluded from this and other tables.]It can be seen from column d of Table 3.2 that for 17 countries no information was
obtained (Côte d'Ivoire and those below), leaving 63 countries for which information has been
used to produce the remaining tables in this section.

8
For each of these 63 countries, Table 3.1 shows the origin of the infonnation on thedatabase. For example, for Germany, entries were obtained from all three - literaturereferences, questionnaires and OECD studies. In contrast, the only infonnation available forGreece and Portugal was from OECD studies and the only information about Tunisia was fromthe questionnaire they completed. Mainly due to the effect of colunm c, the upper part of thetable is dominated by OECD countries. Pages 26 and 27 in Section 4 discuss the coverage ofdeveloping countries. Overall, OECD studies contributed 38 per cent of the useful row entries,literature 34 per cent and questionnaires 28 per cent.
3.3.1 Sources and methods by countryAll 63 countries identified in Table 3.1 for which we have useful informationare shown
in Table 3.2, indicating the number of times a particular source and method occurs in thedatabase. The colunm headings used for the table closely follow those used in the questionnaire- see paragraph 2.4 above; the meaning of the letter codes is shown at the end of the table.There is some duplication between the database references for a particular country - eitherbecause different research projects identified in the literature have used the same source, orbecause official statistical agencies have reported the same source in their questionnaireresponse as the literature or an OECD study. No attempt has been made to remove theduplication for two reasons: (a) in nearly all cases the derived analyses were different and hadto be preserved to show complete analyses in Tables 3.3 and 3.4 to 3.10; (b) retaining allreferences is necessary to indicate the relative popularity and use of each source. The finalrow, beneath the total, shows the number of countries for which at least one column entry wasrecorded.

9
Table 3.1 Country coverage of database entries
Literaturecoded
Q'nairescoded
OECDstudies
Totala+b+c
Literaturenot coded
Q'nairesno reply
Totald+e+f
a b c d e I g
United States* 38 5 15 58 5 63
United Kingdom* 34 15 49 7 56
Canada* 10 10 12 32 32
Germany* 9 10 13 32 32
Australia* 2 14 10 26 26
France* 9 14 23 1 24
Finland* 5 5 9 19 19
Norway* 4 3 7 14 1 15
Netherlands* 1 4 9 14 14
Italy* 2 11 13 1 14
Sweden* 2 3 8 13 1 14
Denmark* 2 10 12 1 13
Austria* 1 4 6 11 11
Russian Federation 4 6 10 3 13
Japan* 2 8 10 1 11
New Zealand* 2 3 5 10 10
Spain* 2 6 8 1 1 10
Belgium* 1 7 8 1 9
Poland* 4 3 1 8 8
Switzerland* 2 3 3 8 8
Czech Republic* 1 4 1 6 6
Mexico* 3 3 6 6
Argentina 2 3 5 5
Brazil 2 3 5 5
Hong Kong (China) 5 5 5
Ireland* 4 4 1 5
South Africa 1 3 4 1 5
Greece* 4 4 4
Paraguay 4 4 4
India 3 3 1 4
Latvia 3 3 1 4
Lithuania 3 3 1 4
China 3 3 3
Ethiopia 3 3 3
Nicaragua 3 3 3
Portugal* 3 3 3
Romania 1 2 3 3
Slovenia 1 2 3 3
Tunisia 3 3 3
Hungary* 2 2 1# 3
Chile 1 1 2 2
Colombia 1 1 2 2
Croatia 2 2 2
Egypt 2 2 2

10
Table 3.1 Country coverage of database entries(cont.)
* OECD countries# 'nil' return
Literaturecoded
Q'nairescoded
OECDstudies
Totala+b+c
Literaturenot coded
Q'nairesno reply
Totald+e+f
a b c d e f gLuxembourg* 2 2 2Malaysia 2 2 2Turkey* 1 1 2 2Bulgaria 1 1 1 2Estonia 1 1 1 2Israel 1 1 1 2Kenya 1 1 1 2Korea, Rep. of* 1 1 1 2Peru 1 1 1 2Philippines 1 1 1 2Ukraine 1 1 1 2Venezuela 1 1 1 2Indonesia 1 1 1
Macedonia 1 1 1
Morocco 1 1 1
Pakistan 1 1 1
Slovak Republic 1 1 1
SriLanka 1 1 1
Tanzania 1 1 1
Côte d'Ivoire 0 1 1 2Zimbabwe 0 1 1 2Algeria 0 1 1
Botswana 0 1 1
Central African Rep. 0 1 1
Djibouti 0 1 1
Georgia 0 1 1
Lesotho 0 1 1
Malawi 0 1 1
Mauritania 0 1 1
Mauritius 0 1# 1
Papua New Guinea 0 1 1
Swaziland 0 1 1
Uruguay 0 1# 1
Uzbekistan 0 1 1
VietNam 0 1 1
Zambia 0 1 1
Total entries 166 133 184 483 31 27 541
11
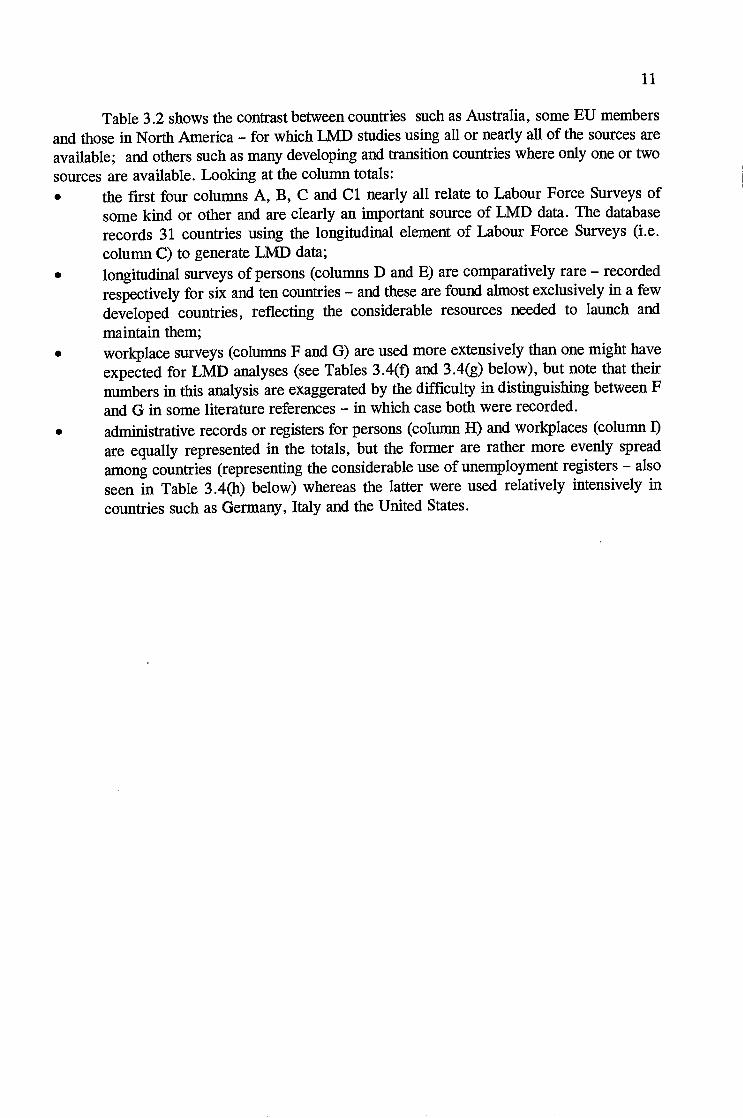
Table 3.2 shows the contrast between countries such as Australia, some EU membersand those in North America - for which LMD studies using all or nearly all of the sources areavailable; and others such as many developing and transition countries where only one or twosources are available. Looking at the column totals:
the first four columns A, B, C and Cl nearly all relate to Labour Force Surveys ofsome kind or other and are clearly an important source of LMD data. The databaserecords 31 countries using the longitudinal element of Labour Force Surveys (i.e.column C) to generate LMD data;longitudinal surveys of persons (columns D and E) are comparatively rare - recordedrespectively for six and ten countries - and these are found almost exclusively in a fewdeveloped countries, reflecting the considerable resources needed to launch andmaintain them;workplace surveys (columns F and G) are used more extensively than one might haveexpected for LMD analyses (see Tables 3.4(f) and 3.4(g) below), but note that theirnumbers in this analysis are exaggerated by the difficulty in distinguishing between Fand G in some literature references - in which case both were recorded.
administrative records or registers for persons (column H) and workplaces (colunm I)
are equally represented in the totals, but the former are rather more evenly spreadamong countries (representing the considerable use of unemployment registers - alsoseen in Table 3.4(h) below) whereas the latter were used relatively intensively incountries such as Germany, Italy and the United States.

12
Table 3.2 Number of references to each source and method type, by country
Country A B C Cl D B F G H I JArgentina 2 2 1 1
Australia 9 7 3 2 4 3 2Austria 1 1 1 1 3 1
Belgium 1 1 1 1
Brazil 1 1 1
Bulgaria 1
Canada 2 7 4 1 1 6 2 6 6 6 2Chile 1 1 1 1
China 1 1 1
Colombia 1 1 1
Croatia 1 1
Czech Republic 1 2 1 1
Denmark 1 2 4 1
Egypt 1 1
Ethiopia 1 1 1
Estonia 1
Finland 1 6 4 1 1 6 4 1
France 3 4 1 2 2 1 6 1
Germany 1 2 4 7 5 3 5Greece 1 1
Hong Kong (China) 3 1 1
Hungary 1 1
India 1 1 1
Indonesia 1 1
Ireland 1 1
Israel 1
Italy 1 4 1 6 1
Japan 2 2 5 1
Kenya 1 1 1
Korea, Rep. of 1
Latvia 1 1 1
Lithuania 1 1 1
Luxembourg 1
Macedonia
Malaysia 1 1
Mexico 1 2 2 1 1
Morocco 1 1
Netherlands 3 3 1 3 1 4NewZealand 2 2 1 2 2Nicaragua 1 1 1
Norway 1 2 2 2 5 3 1
Pakistan 1 1
Paraguay 1 1 1
Peru 1 1
Philippines 1 1
Poland 1 2 1 1 1

Table 3.2 Number of references to each source and method type, by country(cont.)
A Ad hoc survey of persons or households: recall questions
B Regular survey of persons or households with a different sample each time: recall questions
C Regular survey of individuals or households: rotational sample designCl As C but using recall questionsD Longitudinal survey of individuals or households: cohort designE Longitudinal survey of individuals or households: panel designF Survey of workplace establishments: ad hocG Survey of workplace establishments at regular intervalsH Registers or administrative records: personsI Registers or administrative records: workplace establishments
I Combinations of above sources, or other methods
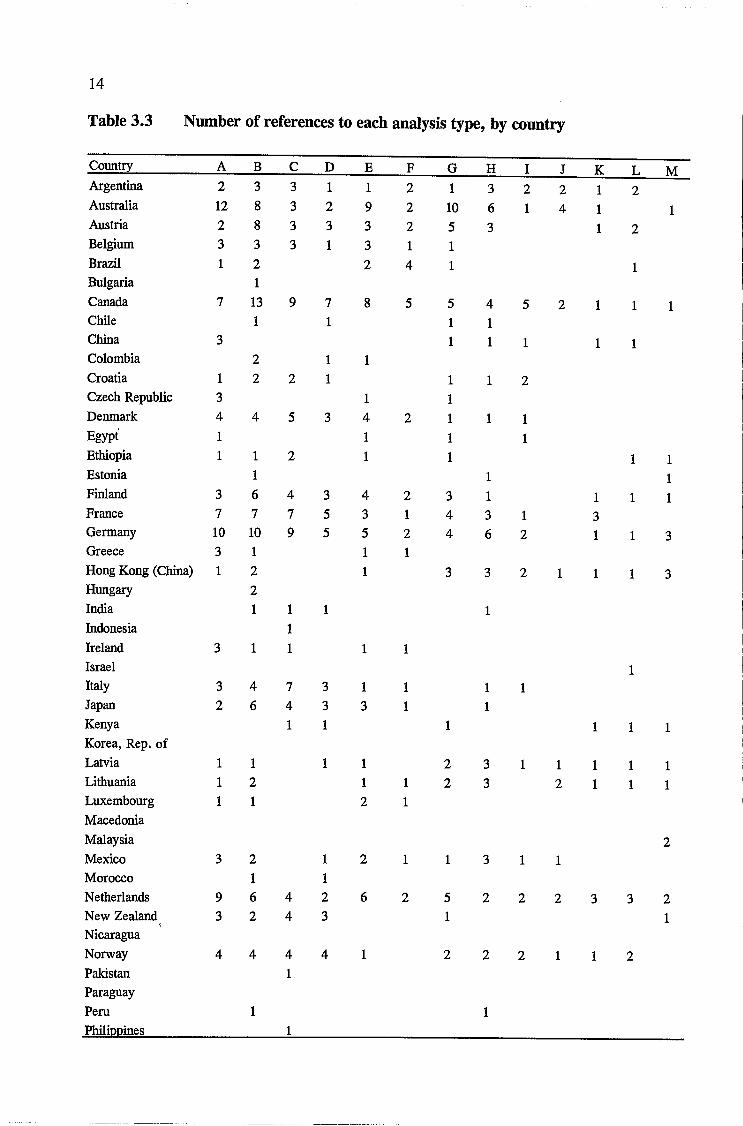
3.3.2 Type of analysis by countryAll the 63 countries identified in Table 3.1 for which we have useful information are
shown in Table 3.3, indicating the number of times a particular type of analysis occurs in thedatabase. The column headings used follow those used in the questionnaire and the meaningof the letter codes is shown at the end of the table. The numerical basis of analysis in this tableis much greater than in Table 3.2 - and there are fewer gaps - reflecting the fact that, manytimes, more than one type of analysis was reported for a given source (see Annex 8 for furtherexplanation). The fmal row, beneath the total, shows the number of countries for which at leastone column entry was recorded.
There were 141 instances of measures of 'Gross flows measuring transitions betweenlabour market 'states' (column A) from 39 countries. The most frequently reported type ofanalysis was 'labour and job turnover rates' (column B ) - 45 countries. Other analysesfrequently recorded were:C. The creation and termination of jobs - 31 countries;B. Job tenure - 32 countries;G. Frequency and length of periods of unemployment - 36 countries.
13
Country A B C Cl D E F G H I IPortugal 1 1
Romania 1 1
Russian Federation 2 4 4 4 1 1 1
Slovak Rep. 1
Slovenia 1 1 1 1
South Africa 1 1 2 3
Spain 1 3 4 1
Sri Lanka 1
Sweden 1 1 1 1 2 2 3 2
Switzerland 2 1 1 2
Tanzania 1 1
Tunisia 2 1
Turkey 1 1 1 1
Ukraine 1
United Kingdom 1 15 6 1 1 7 7 10 5 5 3
United States 11 8 20 1 9 3 3 8 1 6 6
Venezuela 1 1
Total 49 81 80 3 15 30 45 79 52 51 43
No. of countries 27 32 31
(out of 63)
3 6 10 28 35 24 14 24
Codes used for column headings in Table 3.2
14
Table 3.3 Number of references to each analysis type, by country
Country A B C D E F G H I J K L MArgentina 2 3 3 1 1 2 1 3 2 2 1 2Australia 12 8 3 2 9 2 10 6 1 4 1
Austria 2 8 3 3 3 2 5 3 1 2Belgium 3 3 3 1 3 1 1
Brazil 1 2 2 4 1 1
Bulgaria 1
Canada 7 13 9 7 8 5 5 4 5 2 1 1 1
Chile 1 1 1 1
China 3 1 1 1 1 1
Colombia 2 1 1
Croatia 1 2 2 1 1 1 2Czech Republic 3 1 1
Denmark 4 4 5 3 4 2 1 1 1
Egypi 1 1 1 1
Ethiopia 1 1 2 1 1 1 1
Estonia 1 1 1
Finland 3 6 4 3 4 2 3 1 1 1 1
France 7 7 7 5 3 1 4 3 1 3Germany 10 10 9 5 5 2 4 6 2 1 1 3Greece 3 1 1 1
Hong Kong (China) 1 2 1 3 3 2 1 1 1 3Hungary 2
India 1 1 1 1
Indonesia 1
Ireland 3 1 1 1 1
Israel 1
Italy 3 4 7 3 1 1 1 1
Japan 2 6 4 3 3 1 1
Kenya 1 1 1 1 1 1
Korea, Rep. ofLatvia 1 1 1 1 2 3 1 1 1 1 1
Lithuania 1 2 1 1 2 3 2 1 1 1
Luxembourg 1 1 2 1
Macedonia
Malaysia 2Mexico 3 2 1 2 1 1 3 1 1
Morocco 1 1
Netherlands 9 6 4 2 6 2 5 2 2 2 3 3 2NewZealand 3 2 4 3 1 1
Nicaragua
Norway 4 4 4 4 1 2 2 2 1 1 2Pakistan 1
Paraguay
Peru 1 1
Philippines 1
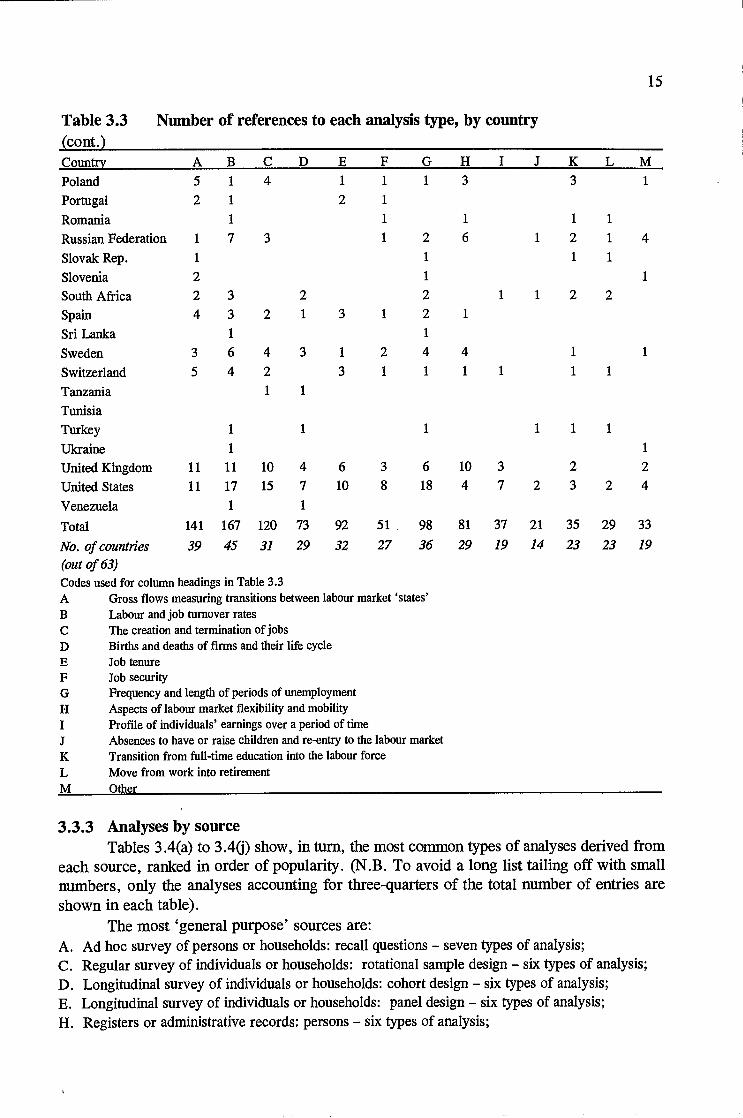
Table 3.3 Number of references to each analysis type, by country(cont.)
A Gross flows measuring transitions between labour market 'states'B Labour and job turnover ratesC The creation and termination of jobsD Births and deaths of firms and their life cycleE Job tenureF Job securityG Frequency and length of periods of unemploymentH Aspects of labour market flexibility and mobilityI Profile of individuals' earnings over a period of time
J Absences to have or raise children and re-entry to the labour marketK Transition from full-time education into the labour forceL Move from work into retirementM Other
15
3.3.3 Analyses by sourceTables 3.4(a) to 3.4(j) show, in turn, the most common types of analyses derived from
each source, ranked in order of popularity. (N.B. To avoid a long list tailing off with smallnumbers, only the analyses accounting for three-quarters of the total number of entries areshown in each table).
The most 'general purpose' sources are:A. Ad hoc survey of persons or households: recall questions - seven types of analysis;
Regular survey of individuals or households: rotational sample design - six types of analysis;Longitudinal survey of individuals or households: cohort design - six types of analysis;Longitudinal survey of individuals or households: panel design - six types of analysis;
H. Registers or administrative records: persons - six types of analysis;
Country A B C D E F G H I J K L M
Poland 5 1 4 1 1 1 3 3
Portugal 2 1 2 1
Romania 1 1 1 1
Russian Federation 1 7 3 1 2 6 1 2 1 4
Slovak Rep. 1 1 1
Slovenia 2 1
South Africa 2 3 2 2 1 1 2 2
Spain 4 3 2 1 3 1 2 1
SriLanka 1 1
Sweden 3 6 4 3 1 2 4 4 1
Switzerland 5 4 2 3 1 1 1 1 1
Tanzania 1 1
Tunisia
Turkey 1 1 1 1 1
Ukraine 1
United Kingdom 11 11 10 4 6 3 6 10 3 2 2
United States 11 17 15 7 10 8 18 4 7 2 3 2 4
Venezuela 1 1
Total 141 167 120 73 92 51 98 81 37 21 35 29 33
No. of countries 39 45 31
(out of 63)
29 32 27 36 29 19 14 23 23 19
Codes used for column headings in Table 3.3

16
and the most specialized is:I. Registers or administrative records: workplace establishments - two types of analysis.
Table 3.4(k), which is derived from Tables 3.4(a) to 3.4(j), gives a summary overviewand ranks the number of times a particular type of analysis occurs in those tables. Two-thirdsof the occurrences consist of:
gross flows measuring transitions between labour market 'states';labour and job turnover rates;
E. job tenure;G. frequency and length of periods of unemployment;H. aspects of labour market flexibility and mobility;which broadly confirms the findings of Table 3.3 on the relative popularity of the differenttypes of analyses - reported in the preceding paragraph.
Table 3.4(a) Ad hoc survey of persons or households: recall questionsRanking of most conunon types of analyses [total no. of entries: 120]
Code No. of entriesG Frequency and length of periods of unemployment 21H Aspects of labour market flexibility and mobility 15
A Gross flows measuring transitions between labour market 'states' 14
B Labour and job turnover rates 11
E Job tenure 10
J Absences to have or raise children and re-entry to the labour market 9L The move from work into retirement 9
Table 3.4(b) Regular survey of persons or households with a different sample each time:recall questionsRanking of most common types of analyses [total no. of entries: 168]
Code No. of entriesB Labour and job turnover rates 41
E Job tenure 37
F Job security 27
G Frequency and length of periods of unemployment 15
A Gross flows measuring transitions between labour market 'states' 11
Table 3.4(c) Regular survey of individuals or households: rotational sample designRanking of most common types of analyses [total no. ofentries: 172]
Code No. of entries
A Gross flows measuring transitions between labour market 'states' 40
G Frequency and length of periods of unemployment 27
B Labour and job turnover rates 20
H Aspects of labour market flexibility and mobility 20
E Job tenure 13
F Job security 9

Table 3.4(d) Longitudinal survey of individuals or households: cohort designRanking of most conunon types of analyses [total no. of entries: 421
Code No. of entries
K The transition from full-time education into the labour force 6
E Job tenure 5
I The profile of individuals' earnings over a period of time 5
M 'Other' 5
B Labour and job turnover rates 4
G Frequency and length of periods of unemployment 4
Table 3.4(e) Longitudinal survey of individuals or households: panel designRanking of most conunon types of analyses [total no. of entries: 60]
Code No. of entries
E Job tenure 11
G Frequency and length of periods of unemployment 8
A Gross flows measuring transitions between labour market 'states' 7
B Labour and job turnover rates 7
H Aspects of labour market flexibility and mobility 6
I The profile of individuals' earnings over a period of time 5
Table 3.4(t) Survey of workplace establishments: ad hocRanking of most common types of analyses [total no. of entries: 83]
Code No. of entries
B Labour and job turnover rates 24
D Births and deaths of firms and their life cycle 14
C The creation and termination of jobs 12
H Aspects of labour market flexibility and mobility 11
Table 3.4(g) Survey of workplace establishments at regular intervalsRanking of most common types of analyses [total no. of entries: 1331
Code No. of entries
C The creation and termination of jobs 32
B Labour and job turnover rates 31
D Births and deaths of firms and their life cycle 24
H Aspects of labour market flexibility and mobility 14
Table 3.4(h) Registers or administrative records: personsRanking of most common types of analyses [total no. of entries: 114]
Code No. of entries
A Gross flows measuring transitions between labour market 'states' 20
G Frequency and length of periods of unemployment 18
B Labour and job turnover rates 14
H Aspects of labour market flexibility and mobility 14
I The profile of individuals' earnings over a period of time 13
£ Job tenure 6
17

18
Table 3.4(i) Registers or administrative records: workplace establishmentsranking of most common types of analyses [total no. of entries: 87]
Code No. of entriesC The creation and termination of jobs 39D Births and deaths of firms and their life cycle 28
Table 3.4(j) Combinations of sources, or other methodsRanking of most common types of analyses [total no. of entries: 63]
Code No. of entriesA Gross flows measuring transitions between labour market 'states' 28C The creation and termination of jobs 6M 'Other' 6H Aspects of labour market flexibility and mobility 4
Table 3.4(k) Ranking of frequency of types of analysis, by source and method(derived from Tables 3.4(a) to 3.4(j))
3.4 General note on Section 3Question 2 of the questionnaire (see Annex 2) asked countries to supply information
on LMD statistics under development as well as those currently or recently in operation.Where these were reported they have been included indistinguishably in all the analyses in thissection. For the record, the following sources and methods under development for thefollowing countries were included in the analyses:
Type of analysis Source and method codescode
A B C D E F G H I J TotalB x x x x x x x x 8
H x x x x x x x 7A x x x x x x 6
E x x x x x x 6G x x x x x x 6C x x x x 4D x x x 3
I x x x 3
F x x 2M x x 2J x 1
K x 1
L x 1
Total 7 5 6 6 6 4 4 6 2 4 50

A Ad hoc survey of persons or households: recall questions KenyaSouth Africa
B Survey at regular intervals of persons or households, with South Africaa different sample each time : recall questions
C Survey at regular intervals of persons or households: Netherlandsrotational sample design Slovak Republic
G Survey of workplace establishments at regular intervals: South AfricaH Registers or administrative records: persons NorwayI Registers or administrative records: workplace Norway
establishments
N.B. Similar information for 'types of analysis' under development can be obtained from the databaseif required.
4. Important aspects
This section discusses in turn some important aspects of LMD data that have emergedduring the project.
4.1 Policy usesGenerally one would expect the main demand for flow data to come from those
concerned with formulating and monitoring labour market policies. This is because labourmarket policies are usually designed to stimulate flows in certain groups of the population. Anexamination of flow data helps to decide whether a policy is worthwhile and, if it isimplemented, assists in tracking its effectiveness.
Policies to create employment usually take the form of trying to move people out ofunemployment and into employment. But they can sometimes include stimulating or facilitatingmovements, within the employed population, from outdated and declining industries andoccupations to those expected to expand in future. Other programmes, such as vocational youthtraining, are aimed at guiding young people into employment when first entering the labourforce, rather than unemployment. Also, throughout the 1980s and 1990s, policies in anincreasing number of countries have attempted to encourage the enterprise culture and in thatregard there is interest in transitions into and out of self-employment, and activity in the 'smallfirm' sector. All these policies should require good quality LMD data.
4.2 Response to questionnaire request for information on policy usesDoes this study confirm or alter the above propositions? Respondents to the
questionnaire were given an opportunity to provide information of this kind in Question 6 (seequestionnaire at Annex 2). Unfortunately, the quality of the answers to this question was onthe whole disappointing. Of the 40 countries returning a questionnaire, eight did not answerthis question. Of the remainder, 22 provided answers that were not very enlightening, forvarious reasons, examples of which are set out below.
4.2.1 Less informative repliesOver-generalized replies
These answers could have equally applied to stock data or labour statistics of any kind.
19

20
The most succinct was:'labour market policy'
and other typical replies were:'To study the registered unemployed and their composition - which include sex,unemployment duration, etc.''description of labour administration and steering this system (also as general labourmarket indicators)''To get detailed information about the mobility in the labour market and economicactivity of the population''to quantify the employment situation in order to ease the decision making process ofthe government, the business sector and trade unions''la poursuite de i 'evolution mensuel du chômage ... le taux mensuel du chomage auniveau national et regional''to provide current estimates on employment, unemployment and labour force ... ona continuous basis'
Circular repliesThese replies were tantamount to saying that LMD data are used to monitor LMD
indicators. Examples are:'The main use of dynamic statistics are ... the measurement of ently, exit and rotationrates''To develop information about Socio-Economic Dynamics ... the relationships withinand between the dimensions education, labour market, income...'
Self-evident repliesReplies stated that LMD data are used for statistical publications, research, conferences
or inputs into other statistics or statistical systems. Examples are:'for information at the Annual Conference of the Association of Labour Economists''the most important academic institutions use the ... data for several postgraduatetheses and specialized research. They are also used in the Labour Secretariat forgovernment planning and for the evaluation of the employment programmes''A number of indicators from the taxpayer register are used in compiling the balance
of labour resources'; 'Used as a basis for drawing a sample of establishments whenconducting sample labour force surveys''Disposer d'une information sur la situation de 1 'emploi a la veille de la preparationdu IX Plan du Développement economic et social 1997-2001'
4.2.2 More informative repliesReplies from the remaining ten countries were more focused and detailed and therefore
rather more helpful. They were also generally longer, which prevents their reproduction here.The countries concerned were:
Australia Hong Kong (China)Austria Norway (enclosure A)Brazil PolandCanada SwedenGermany United States
and it is recommended that each reply to Question 6 be examined to appreciate the extent andvariety of policy uses. Those from Australia, Canada, Germany and the United States were

21
particularly carefully prepared. (The same applied to the response from France but it arrivedtoo late to be used in this report's analyses.)
4.3 Literature sourcesRegarding the literature sources, many were of academic origin and often did not
mention a policy use. These might be described as examples of 'basic' as opposed to 'applied'research. Their stated purpose is to test economic theories or to investigate previouslyunexplored aspects of the labour market (although their results may well have some influenceon policy eventually). This was sometimes the case for statements by statistical agencies:according to its 1994 report, the purpose of Statistics Canada's Survey of Labour and IncomeDynamics (SLID) is
'to measure movement - to map out patterns of labour market activity and changes inincome, and to record the events that trigger these changes'.However, some pieces of literature were more targeted. The publicity booklet for the
Australian Survey of Employment and Unemployment Patterns [SEUP] says:'the survey is designed to provide information on the labour market and, morespecifically, to assist in the assessment of the impact of labour market assistanceinitiatives in alleviating the extent ofjoblessness' and '... affords a unique opportunityto answer a number of questions concerning ... how social security payments affect
individuals' labour supply behaviour'.Some 14 policy questions expected to be answered by SEUP have been identified and several'project outlines' using results from the Longitudinal Surveys of Australian Youth giveconsiderable detail of the policy context.
An information leaflet for the British 'Lifetime Labour Market Database' (LLMDB)
says:'SpecWc ways in which the LLMDB will be used to improve policy development willinclude: Dynamic simulation;[e.g.] to massively enhance our ability to reliably modelthe future effects of pensions policy. Understanding Processes: by following a largenumber of individuals through their working lives, and examining the patterns oftransition between the different work types and benefits, and finally into retirement, weshall gain an unrivaled insight into the factors which affect peoples ability toparticipate in the labour market'.A random selection of other policy issues mentioned in the literature follows:'... the focus has sh[ted ... to the rise in long-term employment and, more generally,the increase in unemployment duration ... Longitudinal data are valuable in this areanot only because of the information on the beginning and end of spells but also becausethey allow researchers to control for unobserved individual-specific effects' (Jones and
Ridell).'... the authors use ... the Survey of Income and Program Participation to investigatewhether employer-provided health insurance reduced worker mobility' (Buclimueller
and Valletta).'The analysis exploits the short-run capability of the Current Population Survey[which] allows some examination of the following important questions; is theexperience of extensive unemployment in one year associated with extensiveunemployment in the following year? How important are repeat spells ofunemployment? ... '(Bowers).'One of the major challenges of the transition ... will be to formulate effective labourmarket policies and programs, as well as an adequate social safety net ... This paperattempts to summarize existing hard evidence concerning the pattern ofjob mobilityand changes in returns to education, experience, and gender .. . The analysis of worker

22
displacement and the effect of unemployment compensation on duration ofunemployment is also presented. Data are drawn from unusually rich administrativedata sets that include personal characteristics, work history and earnings ...'(Vodopivec).'The key questions taken up here are:How good an indicator is job turnover of adjustment in employment?What flows of workers are generated by job turnover differences across OECDcountries and what, if any, implications does this have for understandingunemployment?What are the effects ofpolicies on job turnover and labour turnover, and with whatimplications, if any, for unemployment?' (OECD, 1996).'The purpose of this paper is to quantify some of the pressures being placed on theCanadian labor force by change ... Three questions are posed. Are intersectoral shiftsin the relative size of industries important? To what extent are jobs reallocated becausesome firms expand and others contract? How does job change at the industry and firmlevel translate into worker separations?' (Baldwin and Gorecki).
4.4 Institutional responsibilityThe author's prior perception was that much LMD analysis is carried out by academics
and published in the academic literature; or that it is done for, and kept within, official policycircles. And that only few official statistical agencies analyse and publish the data themselves.This is in spite of the fact that, due to the cost and elaborate nature of LMD data-gatheringprocesses, official statistical agencies almost always have the production and processingresponsibilities. Because of the way the study was carried out, it has shed little light on thismatter but has not discredited the above perception.
The questionnaire was sent to official statistical agencies and they were encouraged todistribute it to other departments, institutions and organizations in their countries whichcompiled or analysed LMD data (see covering letter at Annex 2). In fact, this invitation wasscarcely taken up and virtually all questionnaires returned related to the activities of thenational statistical agency or some other government department. However, some of the repliesto Question 6 did indicate that research institutions and academics had access to the processedLMD data for the purposes of analysis and research. The database references originating fromthe literature were dominated by work by academics and research institutions, almost alwaysusing data produced by national statistical agencies. It was interesting to read the followingremarks in the questionnaires from two Nordic countries:
'So far Statistics Sweden has not published or analysed data from the Swedish LabourForce Surveys in order to describe labour market dynamics ... if everything works outall right there will be a publication in 1999'.'Description of 'dynamic aspects' of the labour markets have not gained much attention
from the public. This (is) probably due to the fact that 'flow' statistics are ratherdifficult for users to interpret. Also changes in the structure of the flows seem to bequite minor. (The) same purposes can be fulfilled by frequent enough cross-sectionalstatistics. Dynamic statistics would require more interpretation by official statisticians'(Finland).
4.5 AccessibilityIt follows from the above remarks that one of the reasons for LMD having such a low
profile among users of labour market statistics, especially those outside official circles, is itslack of accessibility. This is due to a number of interrelated factors:

23
LMD data are fragmented at present, non compatible and not thought of as a single,cohesive, topic; there is no overall conceptual framework;in disseminating labour market data, official agencies give stock data far moreprominence;the academic studies using LMD data, and those published by internationalorganizations, tend to appear in relatively obscure journals, are not well publicized andtherefore not widely read.In responding to the questionnaire, some countries volunteered information on
availability of data, for example:'Flows between employment, unemployment and not in the labour force, numbers andtransition responsibilities available on request' (New Zealand).Although first developed some 20 to 30 years ago, gross flows are not published by the
statistical agencies in North America; they have only been made available to researchers andacademics and some of their work has been published. In January 1997, in a paper to (theforerunner of) the Groupe de Paris, Statistics Canada said:
'As early as the 1960s, attempts were made to exploit the potential of the LFS toproduce true flow data using the sample overlap ... However, the algebraic sums ofthe flows have been inconsistent with the net change in the corresponding stocks,leading to serious (but unprovable) responte error biases. To date these gross flowestimates have never been published although a number of them have been availableOn request.'
However, through attending meetings of the Groupe de Paris, the author detects a reneweddetermination to tackle the technical problems in several countries.
In other cases the considerable resources needed to exploit LMD sources are notavailable, as is seen in the following remark in the questionnaire from Brazil regarding their'integrated system of pensions':
'These registers allow the monthly follow up of a large part of the labour force and theenterprises. The possibilities of (this) database are almost infinite but they require aprocessing capacity which is too large for us.'
4.6 International comparabilityAs has already been mentioned in paragraph 2.6, over the past ten to 15 years the
OECD has put considerable effort into international comparisons of trends of certain LMDdata. Although not attempting to collect and publish these data on a regular basis, nor seekingto impose or propose any international definitions or standards, valuable preparatory work tothis end has been done in their work in Employment Outlook and in other publications - whichhas been exploited in this report. And, although OECD has found scarcely any internationalharmonization, the organization nevertheless appears to have found the disparate countrysources of some use in its economic analyses.
As far as the author has been able to establish, the best hope for standardization ofLMD data, in the short term, lies with Eurostat influencing the 15 EU Member States (andother countries applying to be members). This is most likely to happen in the followingdevelopments:
European Community Household Panel (EHCP)This is a longitudinal survey of persons with a considerable degree of harmonization
across the Community. Part of the questionnaire is devoted to economic activity (labour forcestatus). As with any longitudinal survey, a long time elapses before useful results begin to

24
emerge, The author was infonned by Eurostat that ECHP wave 2 (for all 13 wave 2participating countries) would become available by the end of September 1998. Moreover, inearly 1999, the second ECHP quality report will be submitted to Eurostat's StatisticalProgramme Committee. To prepare for this, a questionnaire was recently sent to all 14 ECHPNational Data Collection Units. (One section of this deals with the use of ECHP data that ismade by them and other researchers in their country.) Replies were expected in September1998.
European Labour Force Survey (ELFS)There are already common defmitions of stock data across countries, in line with ICLS
decisions; common coding of responses; and Eurostat partly processes and tabulates the resultsin parallel with national statistical agencies. Current efforts are devoted towards harmonizingthe sample design - in particular moving more countries to quarterly frequency and introducinga standard rotating sample design. This should lead, in time, to the production of gross flowand maybe other LMD data on a standardized basis. There is still other harmonization workto do on the sequence of questions and several technical features of data collection and theweighting of results. Nevertheless, some work on LMD has been done using the ELFS.
Labour Market AccountsThe production of LMD data will, in time, also be stimulated by the accounting systems
which are being developed by some EU countries with the encouragement of Eurostat alsoinvolving Switzerland from outside the EU.
European Enterprise Panel ProjectIn 1995 Eurostat was commissioned to begin this project to study the effects of the
single market on enterprises.
Guidelines of the European Council on EmploymentThe following types of statistical indicators will be required for this:the frequency and length of unemployment spells;the probabilities of unemployed young persons and adults fmding employment, with orwithout being offered employability measures;the flows between employment, unemployment and inactivity for men and women;the duration of searching for employment.
4.7 Data presentationUndoubtedly, one Qf the barriers to achieving greater knowledge and appreciation of
LMD data among users is the difficulty of presenting the data in an easily digestible manner.The illustration on the following page demonstrates how complex the data can become. By theaddition of just one more labour market state to the simple model presented under section 2.4.4above (in this case separating self-employment (S-E) within employment), the number of grossflows generated is doubled.

With the addition of more labour market states the number of flows generated increasesrapidly, as is shown in the following table:
7
25
Presentation is further complicated by the need to provide separate analyses for sub-populations likely to be of policy interest:
males and females;young people and older workers;regions;In longer-term studies there is also need to account for:births (the labour market equivalent is an individual reaching an age when it is legal orcustomary to enter the workforce) and deaths;immigration and emigration;
all of which generate additional extra flows that have an effect in the dynamics of the labourmarket and need to be taken into account. As pointed out earlier, much LMD data comes fromwork history data; this also has presentational problems. In its report on this subject to the 16th
ICLS, the ILO Bureau of Statistics presented an illustrative 'retrospective' typology of labourmarket experiences - to be more precise, a typology for the 'pattern of activities during yearT for persons observed at the end of T'. This consists of 19 detailed categories grouped intoseven main categories. The report observes:
'... (this) is complicated in comparison with the basic distinction between E, 0 andN and also with a typology parsimonious enough to serve as a basis for newspaperheadlines and cabinet briefs. However, relative to the total number of situations and
No of labour market 'states' = N No of flows = N(N-1)
3 6
4 12
5 20
6 30
26
'careers' of analytical and descriptive interest over a reference ofone year the lypologyrep resented by these 19 categories is quite simplistic'.
In all the literature received for this project, the author was hoping to see someimaginative examples of good practice in the presentation of LMD data. There may be somein the official statistical publications mentioned in answers to Question 5 of the questionnaire- most of which the author has not seen. But in the literature actually received - much of itacademic or semi-academic in nature - there were scarcely any graphic or tabular presentationswhich effectively communicated the message of the data to the layman, and those which werereceived were only concerned with short-term flow data. No examples of graphicalpresentations of longer-term longitudinal data were found.
In the future development of LMD data, there is a danger that efforts will beconcentrated on aspects of data collection and processing - defmitions, sample design,weighting systems, international harmonization, etc. While all this is essential, it is equallyimportant not to overlook the means by which the resulting data is to be communicated to busydecision-makers, overcoming the challenge of its novelty and complexity. An especiallyimaginative approach will be needed, recognizing the dynamic nature of the data - includingperhaps taking advantage of the increasing possibilities of computer-generated animatedgraphics.
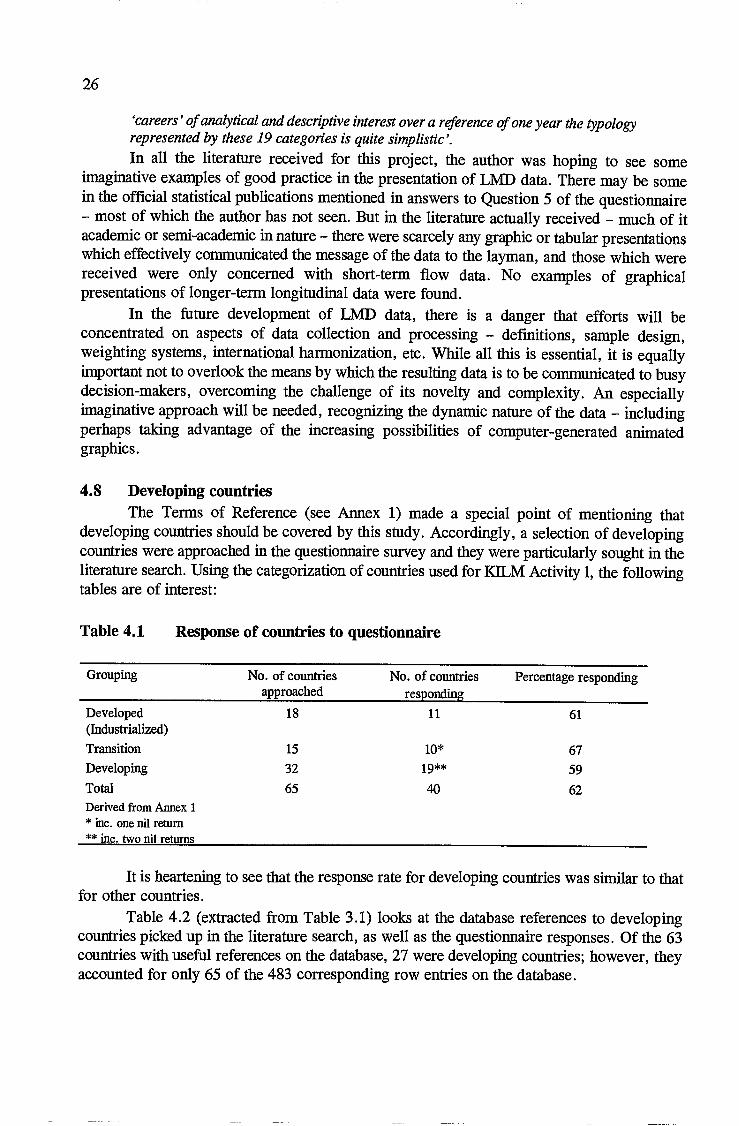
4.8 Developing countriesThe Terms of Reference (see Annex 1) made a special point of mentioning that
developing countries should be covered by this study. Accordingly, a selection of developingcountries were approached in the questionnaire survey and they were particularly sought in theliterature search. Using the categorization of countries used for KILM Activity 1, the followingtables are of interest:
* inc. one nil return** inc. two nil returns
It is heartening to see that the response rate for developing countries was similar to thatfor other countries.
Table 4.2 (extracted from Table 3.1) looks at the database references to developingcountries picked up in the literature search, as well as the questionnaire responses. Of the 63countries with useful references on the database, 27 were developing countries; however, theyaccounted for only 65 of the 483 corresponding row entries on the database.
Table 4.1 Response of countries to questionnaire
Grouping No. of countriesapproached
No. of countriesresponding
Percentage responding
Developed 18 11 61(Industrialized)
Transition 15 10* 67Developing 32 19** 59Total 65 40 62Derived from Annex 1

Table 4.2 Coverage of database entries: developing countries
* OECD countries
27
The sources and methods and types of analyses available for these 27 countries can beseen by inspecting Tables 3.2 and 3.3 respectively. Especially for the entries originating fromquestionnaires, further probing would be necessary to determine the quality of the data and,indeed, to verifr that they really are LMD data.
Literature coded Questionnairescoded
OECD studies Totala+b+c
a b c d
Argentina 2 3 5
Brazil 2 3 5
Hong Kong (China) 5 5
Mexico* 3 3 6
South African Rep. 1 3 4
Paraguay 4 4
India 3 3
China 3 3
Ethiopia 3 3
Nicaragua 3 3
Tunisia 3 3
Chile 1 1 2
Colombia 1 1 2
Egypt 2 2
Malaysia 2 2
Turkey* 1 1 2
Israel 1 1
Kenya 1 1
Korea, Rep. of* 1 1
Peru 1 1
Philippines 1 1
Venezuela 1 1
Indonesia 1 1
Morocco 1 1
Pakistan 1 1
SriLanka 1 1
Tanzania 1 1
Total entries 22 42 1 65

28
5. Conclusions
5.1 Study findingsTo the author's mind this study has broadly confirmed that, in spite of their obvious
relevance to labour market policy issues for many years, LMD data are in a relatively primitivestate. Some (interrelated) reasons for this are:
LMD is not a topic recognized by many labour statisticians, separable within labourstatistics generally, especially those in national statistical agencies;insofar as it is recognized, it is given low priority as a 'fringe' concern;there is no conceptual framework relating the strands of LMD - in part reflecting thatthere is no all-embracing framework for labour statistics as a whole;there are scarcely any international standards relevant to LMD;LMD data are expensive to collect and process;the limitations of some LMD data require especially careful explanation e.g. thedifference between current job or unemployment tenure and completed spells;there are severe difficulties in reconciling short-term flow data with stock data which,if they were more widely known among users, might unreasonably cast doubt on thequality of the stock data;long-term longitudinal data tends to be delivered late - with the risk that they are nolonger policy-relevant;there are severe data presentation problems, with complex tables and diagrams;the dissemination of LMD data is fragmented and unrelated.
5.2 Possible ILO actionThe author's view is that, initially, the ILO can do little more than publicize the
subject, educating its audience on the nature of the data, at the same time drawing attention tothe dilemma of a body of statistics that are apparently in great demand yet are in short supply.It is certainly too early to start collecting data for purely statistical publications such as the ILOStatistical Yearbook. There is more of a case for assembling them first in a future KILMpublication, perhaps on a illustrative basis, as part of the publicity and education process. Thiscould be a follow-up to the envisaged introductory article. Even this modest step will bepioneering work; at present, no individual country seems to bring together all types of LMDdata in this way. As far as the author is aware, the nearest any country comes to this is the UK,which publishes a guide to longitudinal data - and this has a wider remit than just labourmarket data. LMD data comprise a variety of outputs - the complicated results of longitudinalsurveys, gross flows, probabilities of change in status, durations - and for different analyticalunits. While we should never forget that this complexity reflects the complexity of the labourmarket (in fact LMD data simplify and summarize the underlying realities), a set of summarymeasures will have to be developed to give LMD more customer appeal. Judging from thisstudy, the indicators that would attract most interest and would likely be most widely availableare:
unemployment inflows and outflows/unemployment turnover;hirings and separations/job or labour turnover;
29
unemployment duration/probability of leaving unemployment;frequency and length of unemployment spells/work history over long periods;job tenure/probability of becoming unemployed;duration of job search.
It will aid understanding if these statistics are presented as part of a system describing LMD- using a development of the presentation on page 5 - rather than as isolated and unrelatedindicators. Some examples of real data of gross flows between labour market states can beincluded where countries are prepared to see them published.
This study has shown (see Table 3.3) that only about 30 to 40 countries would currentlybe capable of supplying indicators of the above types. This figure may be under 30, if thenumber of countries for which data are being assembled for KILM 10 (Long-termunemployment - a quasi-LMD statistic) is any guide.Only three countries on the KILM 10 listare developing countries, although this study (see Table 4.2) has suggested a few morepossibilities. However, at this stage there is no need to put great effort into maximizing thenumber of countries for which data are shown. It is better to restrict the exercise to volunteercountries that are ready, willing and able to take part. Another point is that statistical progresshas to begin with data confrontation: there should no qualms about including data which doesnot conform with international standards if they are the only LMD data available, e.g.unemployment inflows and outflows into registered unemployment.
5.3 Final considerationsOne final point to consider. Probably even more than stock data, meaningful
interpretation and international comparison of LMD indicators require an in-depth knowledgeof the institutions, labour market conditions and demography of individual countries - also thecurrent stage of the economic cycle. This is not an argument for never publishing them in apurely statistical publication but it is another reason for a measured programme of preparatorywork, which hopefully will stimulate an exchange of information and ideas between nationalstatistical offices and - indirectly - improve exploitation of the microdata sets that arepotentially a rich source of LMD data. To an extent, this is already happening through theGroupe de Paris on Labour and Compensation and the proposed actions through KILM shouldhelp to propel this work forward.
30
Annexes
Annex 1. Terms of reference"The External Collaborator will prepare a report on the state-of-the-art of labour market
dynamics measures, covering both developed and developing countries. This will beaccomplished by analysing the responses to a survey questionnaire sent to 60 countries. Thereport will also be infonned by analysis of documents and reports obtained in a literaturesearch done at ILO Headquarters, with such reports submitted to the External Collaborator,as well as documents independently available to the External Collaborator.
The report will discuss the worldwide availability of data and studies ongoing orcompleted on labour market dynamics, the methodologies of the various approaches to themeasurement and the policy uses of such data. Labour market dynamics includes but is notconfmed to studies of labour force flows, labour turnover, job creation and job destruction, andlabour market transitions."
[Extract from Contract No. 3164, signed 3 April 1998]
Background noteThis study is part of Activity 2 of the ILO's Key Indicators of the Labour Market
(KILM) project.
31
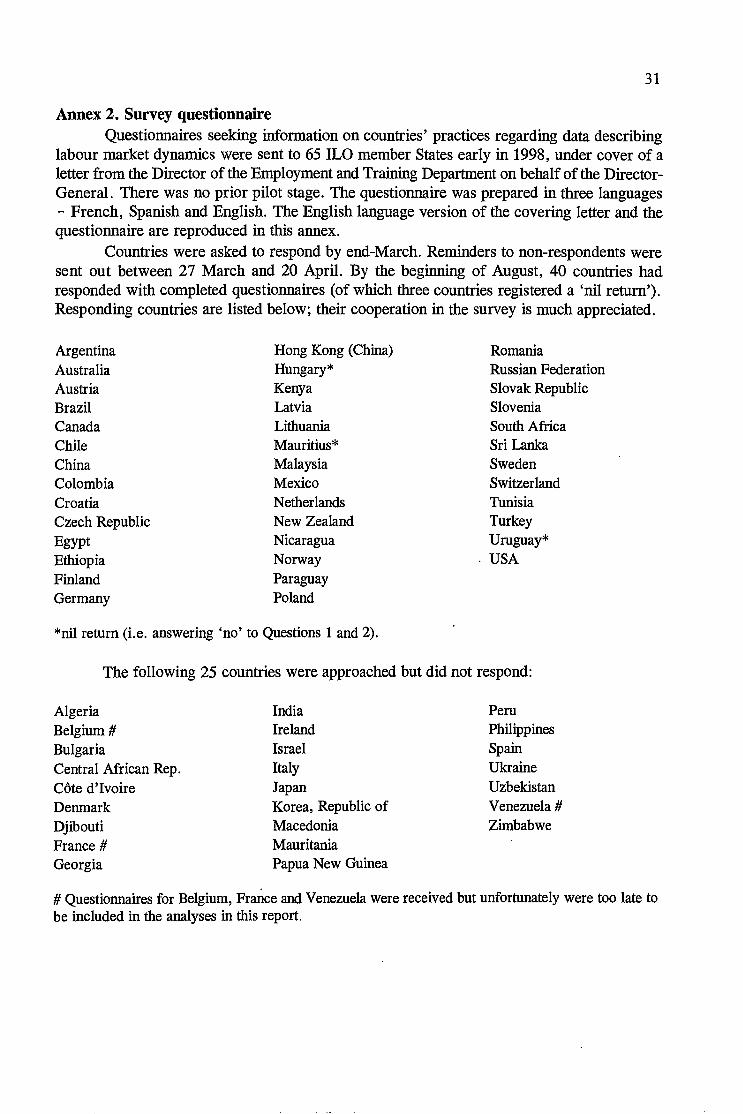
Annex 2. Survey questionnaireQuestionnaires seeking information on countries' practices regarding data describing
labour market dynamics were sent to 65 ILO member States early in 1998, under cover of aletter from the Director of the Employment and Training Department on behalf of the Director-General. There was no prior pilot stage. The questionnnire was prepared in three languages- French, Spanish and English. The English language version of the covering letter and thequestionnaire are reproduced in this annex.
Countries were asked to respond by end-March. Reminders to non-respondents weresent out between 27 March and 20 April. By the beginning of August, 40 countries hadresponded with completed questionnaires (of which three countries registered a 'nil return').Responding countries are listed below; their cooperation in the survey is much appreciated.
Argentina Hong Kong (China) RomaniaAustralia Hungary* Russian FederationAustria Kenya Slovak RepublicBrazil Latvia SloveniaCanada Lithuania South AfricaChile Mauritius* Sri LankaChina Malaysia SwedenColombia Mexico SwitzerlandCroatia Netherlands TunisiaCzech Republic New Zealand TurkeyEgypt Nicaragua Uruguay*
Ethiopia Norway USAFinland ParaguayGermany Poland
*nil return (i.e. answering 'no' to Questions 1 and 2).
The following 25 countries were approached but did not respond:
Algeria India PeruBelgium # Ireland Philippines
Bulgaria Israel Spain
Central African Rep. Italy UkraineCôte d'Ivoire Japan Uzbekistan
Denmark Korea, Republic of Venezuela #Djibouti Macedonia Zimbabwe
France # Mauritania
Georgia Papua New Guinea
# Questionnaires for Belgium, France and Venezuela were received but unfortunately were too late tobe included in the analyses in this report.

32
6463
EMP 62-2-02CS/rf
Data describing labour market dynamics: An international survey
Dear Sir/Madam,The most well-known labour statistics are measurements of 'stocks' - for example, the
number of people in employment or the number unemployed at a point in time. Other familiarstatistics are derived from these:
the relationship between two stocks at the same point in time: "the unemployment rate- i.e. unemployment as a percentage of the workforce - was 6.3% in June";the difference between two successive stock measurements - the net change:"employment rose by 30,000 over the last month"
A major limitation of these stock figures is that they portray only a static picture ofadynamic system in continual movement. Labour market analysts have long demanded statisticsof labour market dynamics that record the volume and speed of labour market movements andthereby reveal the factors that determine net changes in stocks. Yet in spite of this long-standing demand, statistics of this kind are relatively wiknown and under-developed.
I am writing to seek your help in an international survey of data describing labourmarket dynamics. Our intention is to publish the findings to improve awareness of these dataand their sources and methods - thereby transferring knowledge between countries andstimulating their further development. Eventually it may be possible to draw up internationallystandard recommendations on methods, definitions and forms of presentation, based on bestpractice. For the present, however, our work is limited to discovering the extent,characteristics and use of these statistics among ILO member States.
Accordingly, I would be grateful if you could arrange for the attached questionnaire tobe completed. It is possible that statistics of labour market dynamics are compiled or analysedby another government department, by a research institute or some other organization. Orperhaps this work is done in more than one organization in your country. Whatever thesituation, I would be pleased if you could include all activities in your return, irrespective ofthe organization carrying it out. Alternatively, please make a photocopy of the questionnaire

for other organizations to complete and return separately. Please let us know the name andpostal address of the other organization and the name, position and telephone number of theperson responsible in each case.
Besides surveys or studies entirely or mainly devoted to labour market topics, pleasealso include in this questionnaire those of wider social or economic scope within which labourmarket topics are one of the constituents.
If you wish, please qualify or expand on your answers by annotating the questionnaire,or use Question 7 to do so. The questionnaires will be processed manually and thereforewritten comments can easily be taken into account in the analysis. If you have any majorproblems with completing the questionnaire please contact:
either:Constance SorrentinoEmployment and Labour Market PoliciesBranch (Room 8-47)International Labour Office4, route des MorillonsCH-121 1 Geneva 22SwitzerlandTel (direct): 41-22-7996463Fax: 41-22-7997678E-mail: [email protected]
It would be very helpful to have your reply by 6 March 1998. Please send it to Ms.Constance Sorrentino at the address noted above.
Even if your answers to Questions 1 and 2 are 'no' please send in your return toprevent us troubling you with reminders.
Thank you.
Yours faithfully,
For the Director-General:
Werner SengenbergerDirector
Employment and Training Department
or *
Peter Stibbard, ILO Consultant62 Allington DriveTonbridgeKent TN1O 4HHUnited KingdomTel: +44 1732 358747Fax: +44 1732 361064 or +44 1732367231E-mail: 106405. [email protected][* responses available from 1 Marchonwards]
33

34
COUNTRY:
Please provide contact details below of a person who will be able to assist in any queries aboutthe completed questionnaire and any other questionnaires returned by organizations in yourcountry.
NamePositionPostal address
DATA DESCRIBING LABOUR MARKET DYNAMICS
AN INTERNATIONAL SURVEY
Telephone no.Fax no.E-mail address
LABOUR MARKET DYNAMICS
Before completing the questionnaire please carefully study the explanatory notes on pages6, 7 and 8
Mark correct answers like x and leave incorrect answers blankthis
Yes No
1 Have statistics describing labour market dynamics been publishedin your country during the last ten years
2 Are statistics describing labour market dynamics being developedthe intention of publication within the next 5 years?
I I I
I I I

Sources and methods
3 If the answer to Qi and/or Q2 is 'yes' please indicate whether or noteach of the following sources and methods are used: Yes No
Ad hoc survey of persons or households: recall questions
Survey at regular intervals of persons or households, with adifferent sample each time : recall questions
Survey at regular intervals of persons or households: rotational
Longitudinal survey of individuals or households: cohort design
Longitudinal survey of individuals or households: panel design
Survey of workplace establishments: ad hoc
Survey of workplace establishments at regular intervals:
Registers or administrative records: persons
Registers or administrative records: workplace establishments
Other methods or combination of above sources (please givedetails)
LABOUR MARKET DYNAMICS
Type of analysis
4. For each of the 'yes' answers in Question 3 please indicate, in the second column, thetype of analyses derived from these statistical studies. Use the letter codes provided at the footof the second column. If there is more than one 'yes' answer to Question 3 please enter theappropriate letter A to J in the first column to distinguish them, together with the survey orproject title. Space is provided for only three entries; if you have more please continue on aseparate piece of paper using the same format.
35

36
Q3 reference letter andsurvey/project title
Types of analyses: please use letter codes at foot of this columnand provide comments and explanations if you wish.
Type of analysis:-gross flows between labour market 'states';labour and job turnover rates;the creation and termination of jobs;births and deaths of firms and their life cycle;job tenure;job security;frequency and length of periods of unemployment;aspects of labour market flexibility and mobility;the profile of individuals' earnings over a period of time;absences to have or raise children and re-entry to the labour market;the transition from full-time education into the labour force;the move from work into retirement;other - please specify.
LABOUR MARKET DYNAMICS
Publication5. For each of the 'yes' answers in Question 3 that relate to published work please givethe full publication source(s) below, indicating with an X the types of infonnation provided,using the boxes A, B and/or C. If there is more than one 'yes' answer to Question 3 pleaseenter the appropriate letter A to J in the first column to distinguish them, together with thesurvey or project title. Space is provided for only three entries; if you have more, or if youhave insufficient space to provide full bibliographical details, please continue on a separatepiece of paper using the same format. It would be helpful if reproductions of references (orkey extracts from them) could accompany your completed return. Alternatively, if referencesare accessible on the Internet, please give Internet address.

LABOUR MARKET DYNAMICS
Uses of statistics
6. Briefly describe below, for each of the preceding entries in answer to Q4 and Q5, themain objectives of the work and the actual or potential policy applications. Continue on aseparate piece of paper if necessary.
37
Q3 reference letterand survey/projecttitle
Publication reference: also indicate type(s) of information providedin each case using the following code:A. latest dataB. interpretative commentaryC. description of sources and methods
A
B
C
A
B
C
A
B
C

38
Q3 reference letterand survey/projecttitle
Objective of study and use made of results
7. If you would like to expand or comment on any of the answers given above, please usethe space below, referring to question numbers as appropriate.
Thank you for your co-operation.

39
Explanatory notesQi and Q2: Data describing labour market dynamics: definition and coverage. Before decidinghow to answer Questions 1 and 2, please check through the statements using statistics of labourdynamics provided on page 8; also the different sources and methods used for compiling data on labourmarket dynamics which are listed in Question 3. In addition you may find the following remarkshelpful: Data on dynamics are measurements over time in the activity status of individuals or changesin jobs of employed persons, either in terms of the number of persons who have experienced changes,or the duration of completed spells in status or jobs. The dynamics of income from employment andthe life-cycle of workplaces are also relevant. Data on dynamics depends on collecting informationabout the same person (or some other analytical unit such as a household, job or workplaceestablishment) relating to two or more points in time; they usually reflect experiences at the level ofthe individual person. An analogy often used to illustrate the difference between stock figures and dataon dynamics is to liken the former to 'snapshots' of a labour market in continual movement - whereasthe latter are 'videos' recording those movements.
Q3A and Q3B: Recall questions. Flow data can be derived from retrospective questions in surveys,for example by asking about labour market status at some past date, say a year previously, and aboutprior status. Also, retrospective questions can be asked about how long ago certain events imppened(e.g. when the respondent's present job began). These can be asked in single (i.e. ad hoc or 'one off')surveys, or in surveys conducted at regular intervals such as Labour Force Surveys.
Q3C: Rotational Sample Designs. Many Labour Force Surveys include a rotational scheme in theirsample design. The sampling units are partially replaced according to a prescribed pattern, so that areducing proportion of the sample remains in successive survey periods. Although increasing theprecision of monthly or quarterly estimates of changes of levels (stocks) is the prime reason for thesedesigns, flow data can be produced as a by-product. By linking the labour force status at these differentpoints in time for individual respondents, statistics of gross flows between each status, in bothdirections, can be compiled.
Q3D and Q3E: Longitudinal survey of persons or households. These are surveys deliberatelydesigned to monitor the behavior and experiences of individuals or households over quite long periodsof time. They can take the fonn of cohort surveys, in which a sample of individuals of a particularage is selected at a point in time and then re-surveyed at intervals; or panel surveys, in which a samplerepresentative of the population is selected and then re-surveyed at intervals.
Q3F and Q3G: Survey of workplace establishments. Labour turnover statistics can be derived bycollecting aggregate information on the number of employees at the end of the reference period whowere not employed at the beginning of the period; or by asking direct questions on the number ofemployees joining and leaving. There are also surveys of establishments which seek information onindividual employees, enabling analyses which link firms' characteristics with employee characteristics.Establishment surveys are usually at regular intervals and involve a panel of establishments but ad hocsurveys collecting historical information are sometimes used.
Q3H: Registers or administrative records: persons: Gross flow statistics can be derived fromadministrative registers which record successions of events pertaining to individual persons (e.g.hiringsby and separations from employers, or registration with employment services) and their dates; or whichmatch records of individual persons at different points in time. They can be used to show how longindividuals were claiming unemployment benefit, and how many spells of unemployment theyexperienced. Such registers are often associated with taxation or social security schemes. Sometimesthe information about the same individual persons and/or establishments in more than one register canbe combined through the use of common identifiers.

40
Q31: Registers or adn'iinistrative records: workplace establishments. Registers of establishmentscan generate statistics used to study certain aspects of labour market dynamics. The traditional focuson net change in employment totals derived from establishment surveys hides most of the dynamics ofemployment. Irrespective of whether net employment is rising, falling or constant, large numbers ofjobs are being created and terminated. Data are needed where the jobs are being created (in existingor new establishments?) and where they are being terminated (in existing or closing establishments?).'Survey data on labour turnover can supply a partial answer (see Q3F and Q3G) but register analysis,preferably linked with surveys, is potentially a better source for these data, as it provides 'businessdemography' data on establishment openings and closings. Thus it is possible to link data on labourturnover and establishment turnover.
Q3J : Other methods and combination of sources. Administrative records, supplemented bysurveys, can provide useful data on the operations and outcomes of government training programmes.Individual 'starters' and 'leavers' records can provide overall numbers of flows and stocks while onthe programme, also demographic details on participants and operational information on actual durationof training, qualifications achieved and immediate destination on leaving (if known). 'Follow-up'surveys can then be conducted after an interval of six or nine months to seek information onparticipnts current activity. These provide information on the progression into employment.
Type of analysis. To correctly identify the analyses derived the different sources' please enterthe Q3 letter code in the first column - also the survey/project title or name; this will be particularlyhelpful in distinguishing two or more sources of the same type (for example, there may be more thanone longitudinal survey with labour market content in a country). Pre-coded 'types of analysis' arelisted at the foot of the second column to reduce the amount the text you have to provide; however, addfurther information if you wish. Space is provided for only three entries; if you have more pleasecontinue on a separate piece of paper.
Publication. To reduce the amount of information you have to provide please direct us topublished material, indicating the type of information provided, using one or more of the letter codesA, B & C. Where there has been several pieces of work derived from a particular source, or morethan one instance of a particular source, please give priority to recent publications and to articles whichprovide good descriptions of sources and methods . Enter full bibliographical details and, wherepossible, provide photocopies or offprints of articles and papers. References to publications in anylanguage are acceptable but those in Spanish, French, [Russian] or English are preferred. Space isprovided for only three entries; if you have more please continue on a separate piece of paper.
Uses of data. Please briefly describe the main objectives, uses and policy applications of theanalyses. Space is provided for only three entries; if you have more please continue on a separate pieceof paper.
The following statements make use of data describing labour market dynamics [Q4 letter codes fortypes of analysis are provided in each case for guidance]:
'The ,itincrease in employment in 1995 of 200,000 was the outcome of gross flows between the threebasic labour market 'states' of employment {E], unemployment {U}and economic inactivity outside thelabour force (0), as follows:-500,000 UtoE; 400,000Eto U; 700,0000toE; 600,000Eto 0' [A]
'Men are more likely than women to make the trans ition from full-time to part-time employment and lesslikely to make the converse transition from full-time to part-time' [A]

41
'12% ofpeople in employment have been in theirpresentjobfor less than one year' [B]
'20% of the unemployed have been unemployed for more than a year' [B].
'last month 350,000 people were added to the official count of the unemployed and 320,000 left thecount - a turnover of 15%' [B]
'6% of employed people changed their occupation during last year compared with 8% in the previousyear' [B, H]
'In the past year the creation of new businesses and the growth of existing ones created new jobs thatamounted to 14% of total employment; whereas the contraction and closing of businessessimultaneously was responsible for the termination ofjobs amounting to 13% of total employment'[C,D]
'Two thirds of women are continually employed by the same employer for more than two years' [E]
'Median job tenure is 3.5 years and 11 years at the 90th percentile' [E]
'The jobs taken by the previously unemployed are usually temporaly and these individuals subsequentlyeither upgrade or leave those jobs' [H]
'About one third of unemployment spells last less than 3 months' [G]
'Between 1990 and 1995 about 10 million people experienced at least one period of unemployment'[F,G]
'The number offobs a person can expect to have in a lifetime has risen sharply over the last 20 yearsfrom 7to 11' [F,H]
'individuals that escape from low paidjobs are more likely to re-enter low-paidjobs in subsequent yearsthan those with no previous experience of low pay' [I]
'The percentage of young people in gainfl4 employment in November of the same year as theycompleted their secondary education has decreased dramatically in the 1990s' [K]
Labour turnover is rising markedly for older workers ... primarily through increased exits from theemployed labour force to early retirement' [L]

42
Annex 3. Sources of data: their respective advantages and disadvantages
Surveys of individuals and households: recall questionsAdvantages
Convenient; relatively inexpensive;Produce quick results.
DisadvantagesErrors due to respondents' memory lapses, made worse by proxy responses;Less scope to. employ detailed questions to determine previous status than presentstatus; thus a risk of inconsistent definitions which would affect accuracy of resultingflow data.Analyses based on questions about status at some past date exclude additional changesof status since then.
Surveys of individuals and households: rotation sample designsAdvantages
Absence of recall errors;Flow data based on same definitions as corresponding stock data.
DisadvantagesLow response rates and high attrition rates affect quality of data;Sampling error of flow data greater than corresponding stock data;Difficulty of establish links between successive interviews when respondents changetheir address can cause bias in results;Ability to provide data on particular flow periods (month, quarter, year) depends onsuitability of sample design;Conditioning effect of repeated interviews;Generally not suitable for deriving long-term flow data;Necessary to wait until after termination of reference period for flow data before resultsare available;Spurious flows may be generated if people respond differently to face-to-face andtelephone interviews.
Surveys of individuals and households: longitudinal surveysAdvantages
Absence of recall errors;Flow data based on same definitions as corresponding stock data.
DisadvantagesExpensive to operate and require a long-term budget commitment;Attrition affects quality of data;Rarely suitable for providing regular and timely data for national statisticalinfrastructure.Problems of tracking households over time.

43
Establishment surveysAdvantages
Employment statistics derived from establishment surveys tend to be more accuratelycoded to industry than those from household surveys;Analyses by size of establishment or enterprise possible.
DisadvantagesRequires special record-keeping by respondent establishments which may affect speedand level of response;Coverage of employees may be affected by accuracy and up-to-dateness of register usedto select sample or panel of enterprises;Very limited information available on the socio-economic characteristics of employeesjoining, leaving or retained in the establishment without increasing compliance burdensignificantly.
Registers and administrative records: personsAdvantages
Less subject to measurement errors;Register analysis usually less expensive than surveys unless register especiallyconstructed for statistical use only;Non-response not a problem (although incomplete or out of date records can be adifficulty);Comprehensive coverage facilitates analysis of small geographical areas and other sub-populations.
DisadvantagesConcepts, definitions and accuracy coding usually mainly determined by administrativerather than statistical requirements;Vulnerable to changes in administrative rules and practices which could exaggerate trueflows;Use of registers, especially in combination, raises confidentiality issues.Problems of tracking analytical units (i.e. households) over time.
Registers and administrative records: establishmentsAdvantages
As for 'person' registers.Disadvantages
As for 'person' registers;Problems of tracking analytical units i.e. enterprises over time;Very limited information on the socio-economic characteristics of employees unlesslinkage established with person registers.

44
Annex 4. OECD work
This digest of OECD work over the past ten years or so is generally but not entirelypresented in chronological order - this does entail some repetition but it also captures thedevelopment of thought.
Employment Outlook Chapter 2 (E090 Ch.2) discussed Displacement and Job Loss andthe approach 'imposed by the availability of relatively comparable data' was to identify andanalyse two 'apparently similar' groups of workers:
job-losers; i.e. those who permanently lost a stable or temporary job in the last fewyears and are currently unemployed (U) or out of the labour force(N)displaced workers; i.e. those who permanently lost a stable job in the last few yearsand are currently unemployed, out of the labour force or re-employed.
The former are analysed as a stock, based on replies to labour force survey questions on thereason for being U or N, the last job held, etc. and at the time could be analysed for 15 OECDcountries. Analyses of displaced workers, on the other hand, rely on .fiQy analysis of whathappens to these workers after displacement. These studies are based on longitudinal orretrospective follow-up surveys of widely varying scope in a few countries in the 1980s.OECD said '... undeniably the displaced workers ... are the most interesting group (for)analysing the ... effects of structural change' but the lack of data at the national level made itnecessary to concentrate on stock analyses of job-losers instead. The flow analysis of displacedworkers in the Chapter was restricted to:
matched files for labour force surveys - Australia, Spain and USA only;national surveys of displaced workers - USA and Canada only;examples of case studies of redundancies from a single enterprise;examples of studies of groups of workers made redundant.
A paper prepared for December 1992 meeting of the OECD Working Party onEmployment and Unemployment Statistics looked at labour turnover data and (their part in)labour market analysis (and made proposals for collecting these data from quarterly labourforce surveys).
At the beginning of Part 1, entitled 'Turnover - a conceptual and definitional overview',it is pointed out that, to an employer, the term 'turnover' usually means the loss of employeesthrough quits to other firms or activities, often requiring the hiring of replacements. But labourmarket analysts use the term in a wider sense. Attention might be focused on 'job turnover'or the loss of jobs in certain firms or sectors and the creation of new ones. However, the termis 'more commonly used to refer to aggregate measures of gross change in employment forestablishments; it includes employment inflows (hirings or accessions) as well as outflows(separations)'.
Hirings or accessions occur to fill new jobs, or jobs directly or indirectly freed up bya quit, a dismissal, a retirement or some other reason. Hirings can fill either temporary orpermanent jobs. Hiring data can give a picture of the jobs available over a period - but onlya general one in that unfilled vacancies are excluded and some 'hirings' may be left out of datacollected from firms because the jobs may not be publicly advertised or made generallyavailable to all prospective candidates.
Separations consist of two types of transition, quits and layoffs, which should bedistinguished:
- QUItS (worker-initiated separations): these can occur for job-related reasons, becauseworkers seek better pay, opportunities or working conditions. Or for personal reasons
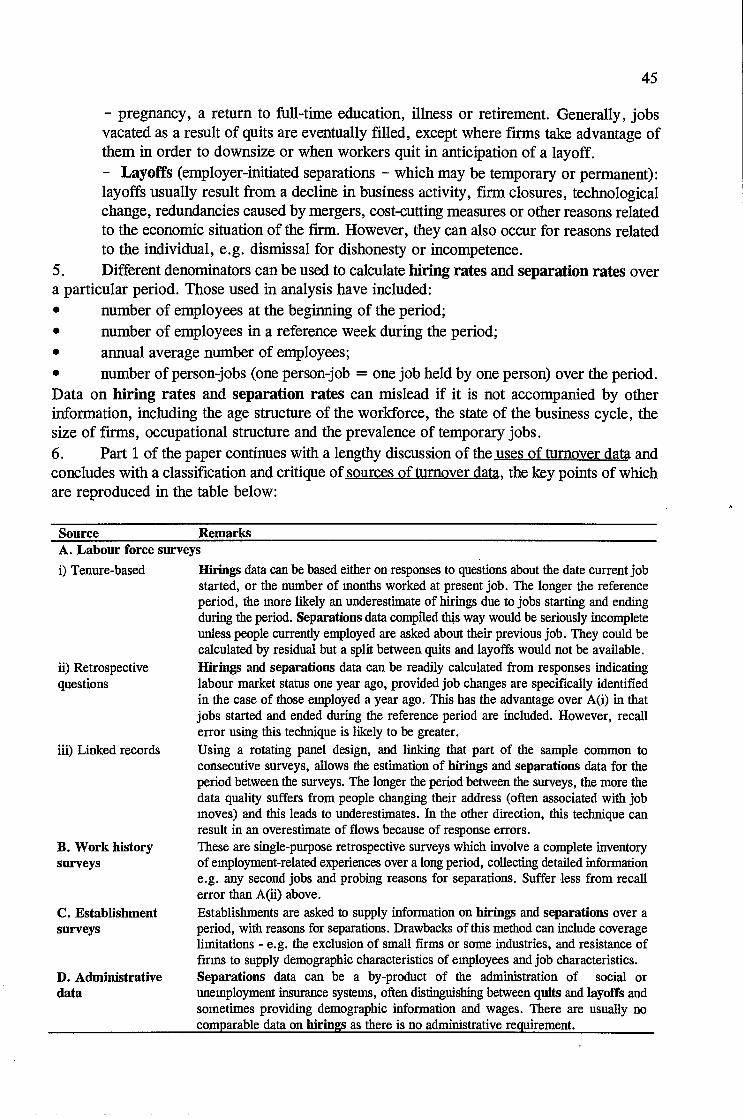
45
- pregnancy, a return to full-time education, illness or retirement. Generally, jobsvacated as a result of quits are eventually filled, except where firms take advantage ofthem in order to downsize or when workers quit in anticipation of a layoff.- Layoffs (employer-initiated separations - which may be temporary or permanent):layoffs usually result from a decline in business activity, finn closures, technologicalchange, redundancies caused by mergers, cost-cutting measures or other reasons relatedto the economic situation of the firm. However, they can also occur for reasons relatedto the individual, e.g. dismissal for dishonesty or incompetence.
5. Different denominators can be used to calculate hiring rates and separation rates overa particular period. Those used in analysis have included:
number of employees at the beginning of the period;number of employees in a reference week during the period;annual average number of employees;number of person-jobs (one person-job = one job held by one person) over the period.
Data on hiring rates and separation rates can mislead if it is not accompanied by otherinformation, including the age structure of the workforce, the state of the business cycle, thesize of firms, occupational structure and the prevalence of temporary jobs.6. Part 1 of the paper continues with a lengthy discussion of the uses of turnover data andconcludes with a classification and critique of sources of turnover data, the key points of whichare reproduced in the table below:
Source RemarksA. Labour force surveys
Tenure-based Hirings data can be based either on responses to questions about the date current jobstarted, or the number of months worked at present job. The longer the referenceperiod, the more likely an underestimate of hirings due to jobs starting and endingduring the period. Separations data compiled thjs way would be seriously incompleteunless people currently employed are asked about their previous job. They could becalculated by residual but a split between quits and layoffs would not be available.
Retrospective Hirings and separations data can be readily calculated from responses indicatingquestions labour market status one year ago, provided job changes are specifically identified
in the case of those employed a year ago. This has the advantage over A(i) in thatjobs started and ended during the reference period are included. However, recallerror using this technique is likely to be greater.
Linked records Using a rotating panel design, and linking that part of the sample common toconsecutive surveys, allows the estimation of hirings and separations data for theperiod between the surveys. The longer the period between the surveys, the more thedata quality suffers from people changing their address (often associated with jobmoves) and this leads to underestimates. In the other direction, this technique canresult in an overestimate of flows because of response errors.
B. Work history These are single-purpose retrospective surveys which involve a complete inventorysurveys of employment-related experiences over a long period, collecting detailed information
e.g. any second jobs and probing reasons for separations. Suffer less from recallerror than A(ii) above.
C. Establishment Establishments are asked to supply information on hirings and separations over asurveys period, with reasons for separations. Drawbacks of this method can include coverage
limitations - e.g. the exclusion of small firms or some industries, and resistance offirms to supply demographic characteristics of employees and job characteristics.
D. Administrative Separations data can be a by-product of the administration of social ordata unemployment insurance systems, often distinguishing between quits and layoffs and
sometimes providing demographic information and wages. There are usually nocomparable data on hirngs as there is no administrative requirement.

46
Part 2 of the paper includes some observations on the availability and comparability ofturnover data in OECD countries. The main points are: Labour Force Surveys have a richpotential which is rarely realised in practice because the right questions are not asked or, ifasked, are not standardized. Where they exist, Work History surveys provide good data onlabour mobility. In countries with establishment data, coverage is often limited tomanufacturing industries with little additional information collected; only two countries hadadministrative data. Sources that are limited to larger establishments understate turnoverbecause it is usually higher in small establishments and turnover also varies considerablybetween industrial sectors.
E093 Ch. 4 focused on enterprise tenure derived from household survey questionsabout how long employees have been with their present employer. It is pointed out that this isa measure of 'spells in progress', not of completed spells and goes on to say 'it is only withexacting datasets that all completed spells of employment could possibly be captured'.
Enterprise tenure is said to complement measures of labour turnover - whenindividuals leave or are dismissed by their employer.
Annex 4.A gives sources of enterprise tenure data from 13 countries - for 11 of thempublished or unpublished data from labour force surveys or other household surveys, fromemployer responses mainly in the case of Japan and from an administrative source in the caseof Finland.
The analytical unitin the above studies was the individual worker and the data camemainly from surveys of persons. E094 Cli. 3 studied the related topic of job gains and joblosses in firms, and here the main focus of study was the job and the firm. Developing someearlier work in EQ 1987, this chapter develops a conceptual framework for studying jobturnoverand labour turnover.
The chapter defines:jobs as filled employment positions;job turnover is based on comparisons of the stock of employment at a workplace attwo points in time - only net job changes are counted. True job turnover is thereforeunderestimated and moreover changes in unfilled vacancies are not included;labour turnover (distinct from job turnover) as the movement of individuals in and outof jobs.A graphic (reproduced on the next page) explains the relationship between these
concepts and includes the concept of 'excess job turnover'.10. Annex 3.A of this issue of EQ provides much detail on the sources, definitions andmethods of data collection for the data presented in the chapter. Data from ten countries areused; there are plenty of warnings of pitfalls of international comparisons in this subject, whichinclude differing:
employment coverage (e.g. treatment of the self-employed);industry coverage;industry classification;type of analytical unit - establishment or enterprise/firm.As an example of the problems of definition, interpretation and comparison in this field,
page 108 is devoted to the difficulties in the measuring job turnover in a USA database.

47
11. In November 1994, a meeting of experts was convened by OECD on Job Creation andLoss: Analysis. Policy and Data Development. This meeting was a result of the March 1994G-7 Jobs Summit asking the OECD to 'push forward its work on the dynamics of job creationand job loss, focusing both on improving data comparability and deepening ... analyticalunderstanding ...' A number of papers were commissioned (and subsequently published) andthe brief introductory paper by Bowers and Grey said that the work 'was partly driven by therecognition that there is a lack of internationally comparable data about the processes throughwhich workers find, lose and upgrade their jobs, as well as little information onestablishments' hiring, firing and adjustment strategies'. Three of the papers addressedquestions about concepts, definitions, sources, methods and the main points from these arepresented below.12. A paper by Blanchflower examines research questions arising from the uses ofestablishment-based data. By way of introduction, the paper says the policy-maker needs toknow what kinds of policy helps or hinders job creation and admits that theoretical analysis onjob creation and destruction is at a 'very rudimentary stage' and the empirical evidence doesnot take one very far because of the considerable number of problems in comparing databetween countries.13. Blanchflower makes a plea for the increasing availability of micro-data at the level ofhouseholds or individuals over the last 20 years (he gives examples from Germany, UK, USA)to be matched by data collected from workplaces to be available at the level of the firm or theestablishment. A reason for the scarcity of these data is worries over confidentiality and hegives examples how this is being overcome in Canada, UK and USA. He also says that dataare becoming available that match information on employees and their employers; and matchestablishments on the owning firm. This is followed by a discussion of the relative merits -for various purposes - of using the establishment or the firm as the unit of observation.14. He produces a formidable list of 17 definitional problems that arise in usingestablishment-based data for empirical work, especially in making international comparisons,all of which would need attention in any attempt to harmonize. Summarizing, these are:
Representativeness of sampling frame/sample; stratification, size cut-off.Up-to-dateness of sampling frame.Defmition of establishments - initially and then through time when premises or ownership changes(counted as death and birth?).Sectors covered - treatment of services, public administration, agriculture.Industry definition when a variety of products are produced.Treatment of part-time workers.Measurement of labour inputs by hours.Treatment of the self-employed and family workers.Subcontracted work.Job characteristics that indicate 'good' or 'bad' quality.Structure of the labour force over the economic cycle; labour hoarding.Treatment of temporary layoffs.Definition of 'large' or 'small' firm - measured by turnover, assets as well as employment.Definition of denominator in calculating job creation rate.Suitability of a standard measure of 'small'.Information on other factors of production besides labour.Position of respondent in organization.
15. After working through a long list of information needs required 'to open up theworkings of the black box that is the firm' he proposes, agreeing with Hamerinesh, that anideal data series should have the following properties:

48
(a) a monthly survey based on a random sample of establishments, defunct workplaces replacedwith appropriate substitutes, with information collected on:employment desegregated into several skill and demographic categories, including sex, race,broad occupation and age;hours, both paid for and worked for above categories;flows of workers into and out of establishments for above categories;payroll and other costs for above categories;output;inventory and capital expenditure.A sample of workers from the establishments should be followed while they are employed atthe establishments, with substitutes when they leave. Data to be collected on demographiccharacteristics, self-reported earnings and hours, including those associated with second jobsheld. Corresponding data on other household members is also desirable.Complement the establishment data at (1) with detailed interviews at intervals with owners ormanagers to examine the decision- making process and the factors influencing it.Blanchflower concludes 'The only way to properly inform ... policy is to have high-
quality, matched panel data across countries on individuals and their employers that arecomparable. Such data files need to contain a lot more detail than has been available in mostexisting establishments data sets, which are usually based on administrative records ... [Also]we need to observe more directly what is going on by interviewing interested parties'.
The second paper, by Grey, begins by repeating the definitions oflabour turnover andjob turnover, and the graphic, reproduced in this Annex as Chart 3.1, and quotes Hamermeshas follows 'While they are extremely interesting in their own right, data on gross flows tell usnothing about the magnitude of the wage or output elasticities of employment changes throughthe births or deaths of establishments or growth or contraction in existing establishments'.There are references to panel studies of enterprises or establishments in several countries(p.41) and also the recent development in a few countries of longitudinal information linkingestablishments and workers.
The third paper, also by Grey, is a comparative overview of sources, definitions andmethods of data collection on job creation and loss also begins by repeating the concepts ofE094 Ch. 3 on labour turnover and job turnover and then discusses the type of informationneeded to understand job turnover and makes the following points:
the data can come from a number of sources but there must be some degree oflongitudinality;although (by design) they carry limited information on individual establishments andenterprises, business registers do have longitudinal information, and surveys can beassociated with them or administrative sources linked to them;for several reasons the establishment is the preferred unit of analysis but there are manydefinitional problems, some of which are being tackled by Eurostat;however, enterprise level data are also desirable;definitions of opening and continuing establishments are difficult to operate;the data needed from each workplace includes:
turnover/salesoutput/value addedemployment - part- and full-timewages and salariesoccupationcapital stockinvestment (enterprise level)research and development (enterprise level)
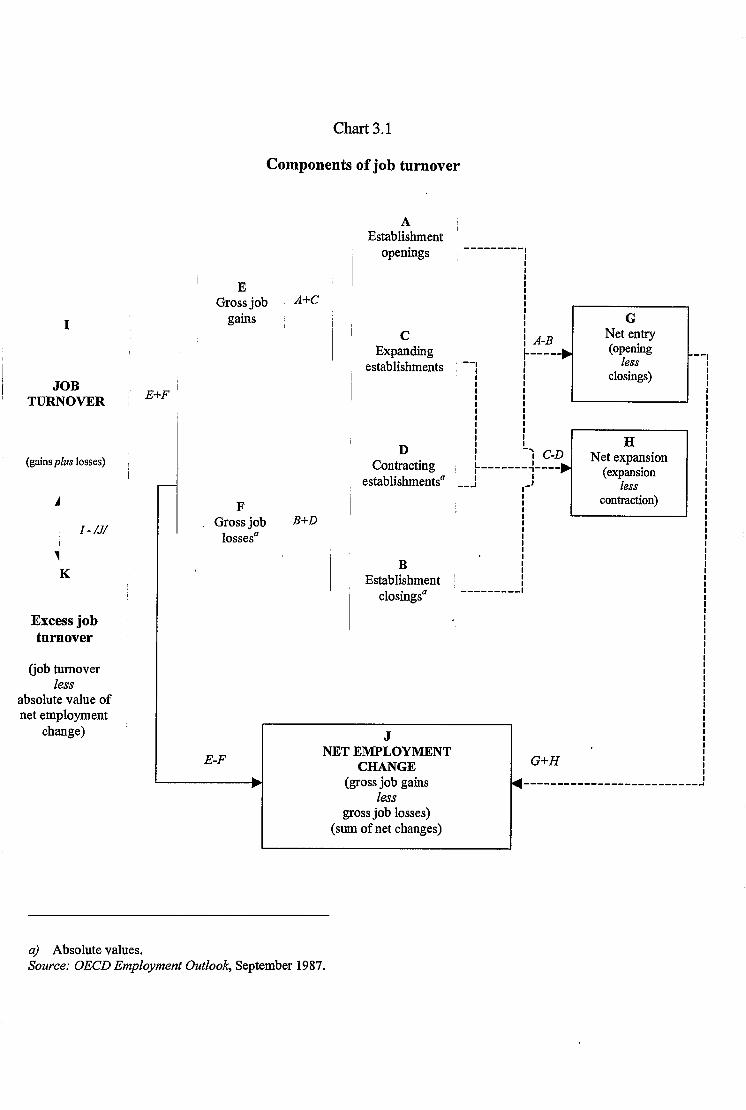
a) Absolute values.Source: OECD Employment Outlook, September 1987.
Chart 3.1
Components of job turnover
I
JOBTURNOVER
(gains plus losses)
A
I - /J/
E+F
EGross job
gains
FGross job
lossesa
A+C
B+D
AEstablishment
openings
CExpanding
establishments
DContracting
establishments'1 ---I
A-B
C-D
GNet entry(opening
lessclosings)
HNet expansion
(expansionless
contraction)
K
Excess jobturnover
BEstablishment
closings'1
(job turnoverless
absolute value ofnet employment
change) JE-F
NET EMPLOYMENTCHANGE G+H
(gross job gainsless
gross job losses)
I(sum of net changes)

50
There follows an extensive survey of country sources for the G-7 countries andDenmark and Sweden mainly displayed in three tables:Table 1. .Definitions of enterprises and establishmentsTable 2. Definitions of opening and closingTable 3. Variables availableAn annex provides further details of country data sources for 12 countries and abibliography.
E096 CJZ.5 is entitled Employment adjustment, workers and unemployment and looksat data on job turnover and labour turnover and unemployment inflows and outflows. Itdefines job turnover as 'the sum of over-the -year changes in employment levels across allestablishments' and says it is a 'reasonably comprehensive measure of employment adjustmentin that it incorporates both the reallocation of employment across industries as well as thereallocation of individual establishments across productive units within industries.' While itleaves out the turnover within establishments it is still regarded as an important tool aspolicymakers tend to focus on hiring and firing at the establishment level.
A panel (p.165) uses a simple numerical example to illustrate the difference betweenlabour turnover and job turnover, adding that 'labour turnover is the sum ofjob turnover,which relates to the expansion or contraction of establishments of firms, and the movement ofworkers into and out of ongoing jobs . . .Workers leave firms and firms hire other workers toreplace them , regardless of whether the firm itself is growing or declining.'
On page 166 it says that 'labour turnover measures changes in individuals among jobsregardless of whether the jobs themselves are newly created, ongoing (and subsequently filledby others) or whether the job themselves disappear' and goes on to outline the relationshipbetween labour turnover, job turnover, job creation and job destruction.
Discussing the links between labour turnover and unemployment, the article says thatjob turnover is a component of labour turnover, measured from the perspective of employmentchange that led to a hiring or a separation. Flows in both directions between employment andunemployment are also components of labour turnover. But new job creation or the filling ofa job vacancy does not lead to changes in either the stock of the unemployed or to an increasein outflows from unemployment. Explanations include:
new jobs may be taken by those already in work who change jobs;some new jobs may be taken by people previously inactive;people can drop out of the labour force into inactivity.The article concludes by reiterating the point that 'the development of more comparable
data sources on job creation and destruction ... is crucial. Understanding how adjustment takesplace and the implications for unemployment requires ... compatible data on labour turnover,in particular, accurate measures of flows in and out of unemployment and flows from one jobto another.' An annex provides sources and methods for seven countries and discusses thedifficulty of comparing them.
Three other recent articles cover other aspects of labour market gross flows.E095 Ch. 1 is a review of recent labour market developments and prospects and
includes in Section D an examination of the duration of unemployment, and unemploymentflows. It justifies the latter by pointing out that 'the dynamics of labour markets are only

51
partially captured by an analysis of changes in the stock of unemployment and that part of itthat is deemed 'long-term unemployment'. Underlying these changes are much larger flowsbetween the three labour force states ...'. It does this by constructing 'proxy' flows in and outof unemployment for 19 countries (using a method introduced in previous issues of EO - seebox below) and, for seven countries, mainly using matched flow data, looking particularly atthe probability of leaving unemployment and the destinations of those who do.
The proxy data for unemployment inflows are stock data for those unemployed for one month or less. The proxydata for outflows are calculated by an identity linking changes in the stock of unemployed to inflows and outflows;they are estimated as the difference between the average monthly level of inflows (as calculated above) and themonthly average change in unemployment over one year, as follows:
outflows = FT (t + I ( t -1 J - F C (t) - C (t-l) I
2 12
where 1(t) and I (t - 1) are the monthly inflows and C (t) and C (t-l) the level of unemployment for years t andt-1 respectively.
A note on p. 26 points out reasons why the proxy inflow data might be biased eitherway and also says that the proxy outflows - though clearly different from the true outflow -are nevertheless 'useful measures to capture some of the dynamics of unemployment and broaddifferences between countries'.
The same note, discussing the matched data from labour force surveys, lists a numberof pitfalls in comparing and interpreting these data, including differences over the period thedata are matched, sample attrition, errors and inconsistent answers, and changes andunwindings of labour force status between interviews.
E097 Cli. 2 is a study of earnings mobility and Annex 2.A describes data sources anddefmitions for the six countries used for the longitudinal analyses presented in the chapter. Itmentions the worry that an analysis restricted to people for whom a continuous earnings historyis available over the pericid of analysis may well not be representative of the workforce as awhole. Their exclusion may be due to sampling attrition (in which case it could becompensated for by statistical means) or because some workers are not employed for all of theperiod of analysis; these 'intermittent' workers may not be typical. The treatment of part-timeworkers is also crucial to the usefulness of the analysis.
E097 Cli. 5 focuses on measures of job security and, among other indicators, examinespatterns of employer tenure, retention rates, and job-losers and job-leavers who left jobs inthe last six months and are currently not in employment. It presents tenure data for 23countries, retention rates for ten countries and job-loser and leaver data for 18 countries.Annex 5.A provides details of sources and definitions.
Employer tenure data generally come from household surveys; the exceptions areJapan (employer survey) and Finland (administrative source). The data refer to the time aworker has been continuously employed by the same employer. A boxed panel on p.147discusses some of the issues concerning the measurement of job-losers and leavers.

52
In an OECD book on LMD in the Russian Federation there i a useful and fullrecapitulation of OECD's earlier work on the concepts and definitions of labour turnover.
In a paper by Gimpleson and Lippoldt labour turnover is defined as the sum of hiringsand separations during a specified interval - e.g. quarterly or annual. It thus measures thetotal number of individual employment transitions, whether they involve individuals gettingor leaving a job. The paper quotes from OECD E096 (p.166) as follows 'labour turnovermeasures changes in individuals among jobs, regardless of whether the jobs themselves arenewly created, ongoing (and subsequently filled by others) or whether the jobs themselvesdisappear'. Labour turnover provides insights into the behaviour of both enterprises andemployees.
Separations may be voluntary (e.g. quits) or involuntary (e.g. layoffs). Hirings maybe aimed at filling a vacated job or a new opening. Dividing the absolute numbers of separatedand hired by the average annual level of employment gives the corresponding percentage rates.For an individual, a separation may be associated with a transition any of the three basiclabour market statuses; and a hiring may involve the transition from any of them.
Labour turnover (i.e. the sum of hirings and separations or H+S) is a measure ofgross labour reallocation. The difference between hirings and separations (H-S) shows thenet change in employment. These indicators can be shown as percentages of annual averageemployment to give an indication of their relative size. Moreover, the difference betweenlabour turnover (H + S) and the absolute value of net employment change (/H-SI) shows thevolume of 'additional labour turnover' not accounted for by the net change in employment(see box on next page). Among other factors, this portion is said to include:
turnover due to attrition (e.g. some workers separate due to retirement and must bereplaced just to maintain a desired level of employment);mismatch between labour supply and demand (e.g. due to the particular distributionof skills across the labour force, in some cases two or more transitions may be requiredto achieve a one person change in employment level);job-to-job transitions (which by definition involve two transitions: a separation and ahire);friction (e.g. problems in scheduling that may result in a temporary hire to fill a gapin staffing pending a permanent hire).
Thus, additional turnover includes movement related to restructuring as well as other personnelconsiderations.
The proportion of 'additional labour turnover' in total labour turnover may be calculated as follows:
(H+S)-/H-SI or 1 - /11-SI
(H+S) (H+S)
This indicator varies from 0 if labour turnover is caused only by net changes in employment, to 1.0 in the case where no netchanges in employment occur (H =S). The closer its value is to 1.0 the less is the contribution of net employment changesto the gross labour reallocation.
'Additional labour turnover' may be considered a measure of the upper bound of 'churning' or the amount of labour turnoverbeyond the absolute minimum that is necessary to accommodate a given employment change. This measure provides only arough approximation of churning in the sense of excess turnover, in that it assumes that each hire or separation required fora particular net adjustment in employment can be accomplished by one labour market transition. Thus, in practice, the true'excess' labour turnover (e.g. the portion due to friction in the labour market or a lack of information for labour marketparticipants) would be somewhat lower. Moreover, this measure of churning does not take into account the necessity ofreallocation of labour within existing employment levels (i.e. job-to-job movement). Such transitions may be a legitimate partof restructuring; but a single job-to-job movement increases labour turnover by a factor of two (not counting any hire to fillthe vacated post). Thus, with respect to churning, this measure should not be interpreted as positive or negative, except inconjunction with other evidence.

53
Job turnover provides similar information with respect to the actual work positions, asopposed to the number of individuals. It is the net change in the number of jobs (i.e. occupiedpositions) at the enterprise level during an interval. In other words, it is equal to the netamount of jobs created in opening and expanding enterprises plus the net number of jobs lostin contracting or closing enterprises. Job turnover can be expressed as a proportion ofemployment to give an indication of the reallocation of working places.
Another way to follow changes in worker mobility is to look at job tenure. The shareof workers with less than one year of job tenure represents the share of jobs which have beenopen for at least one hiring over the past year. Thus there is a direct relationship between jobtenure and labour turnover, a phenonomen noted in international comparisons.
E098 Cli. 3 is a study of the transition from education to the labour market but wasnot available in time to be used in Section 3's database analyses.
Country data used in OECD studiesIn compiling this section I have examined 15 OECD LMD studies from 1989 to 1997
inclusive involving international comparisons - mainly in Employment Outlook. The followingtable shows, for each of the present 29 member countries, the number of times their LMD datahave featured in these studies. The countries are listed according to the year they joined theOECD. (Data considerations aside, countries joining in the 1990s will not feature veryprominently.) In nearly all cases, OECD provides good quality information on the sources usedin each country.

54
Country data used in OECD international comparison LMD studies
Country Year joined OECD No. of times data used in OECD studies
Austria 1961 6
Belgium 17
Canada 12
Denmark 10
France 14
Germany 13
Greece 4
Iceland 0
Ireland 4
Italy 11
Luxembourg 2Netherlands 9
Norway 7
Portugal 3
Spain 6
Sweden 8
Switzerland 3
Turkey 0
UK 15
USA 15
Japan 1964 8
Finland 1969 9
Australia 1911 10
New Zealand 1973 5
Mexico 1994 0
Czech Republic 1995 1
Hungary 1996 0
Korea, Rep. of 1
Poland 1

Annex 5. Basis of analyses in Section 3
The total number of row entries on the database is 601. Each of these refers to aliterature or questionnaire reference and are in alphabetical order by country (see para 3.2).
To construct Table 3.1, references to work by international organizations were deletedbecause, where relevant, their references to specific countries (nearly always OECD countries)had already been attributed to those countries when constructing the database. These deletionsreduced the analysis base to 541 row entries.
For subsequent tables the 19 entries relating to countries for which no useflilinformation was obtained (i.e. Côte d'Ivoire and shown in tablular form below) were deleted,further reducing the analysis base to 522 rows . [N.B. Of these, 39 entries related to 'dead'entries in columns e and f for those 63 countries for which useful information was otherwiseobtained.]
The analysis base of Table 3.2 is 530 colunm entries. This is not the same as thenumber of row entries (522) because there is not always a single source for each row entry.For some there was no entry, mainly for the following reasons:
the identified literature or the questionnaire was not received (see N .B for Table 3.1above);the content of the literature was theoretical economics and did not refer to specificstatistical sources and methods;the source/method could not be ascertained from an examination of the literature.On the other hand, for some row entries - particularly for literature references - there
were multiple references to sources and methods. The precise details are shown in the tablebelow.
No. of source and method codes Frequency: no. of row entries . Basis of tabular analysis
0 130 01 284 2842 90 180
3 11 334 4 16
5 1 5
6 2 12
Total 522 530
55
The analysis base of Table 3.3 is 978 column entries. Again, thi is not the same as thenumber of row entries (522) because, in approximately half the cases, there is more than onetype of analysis for each row entry. To set against that, for some row entries, there was noentry, mainly for the following reasons:
the identified literature or the questionnaire was not received (see N .B. for abovetable);the content of the literature was statistical methodology and did not refer to specifictypes of analyses.
The precise details are shown in the table below.
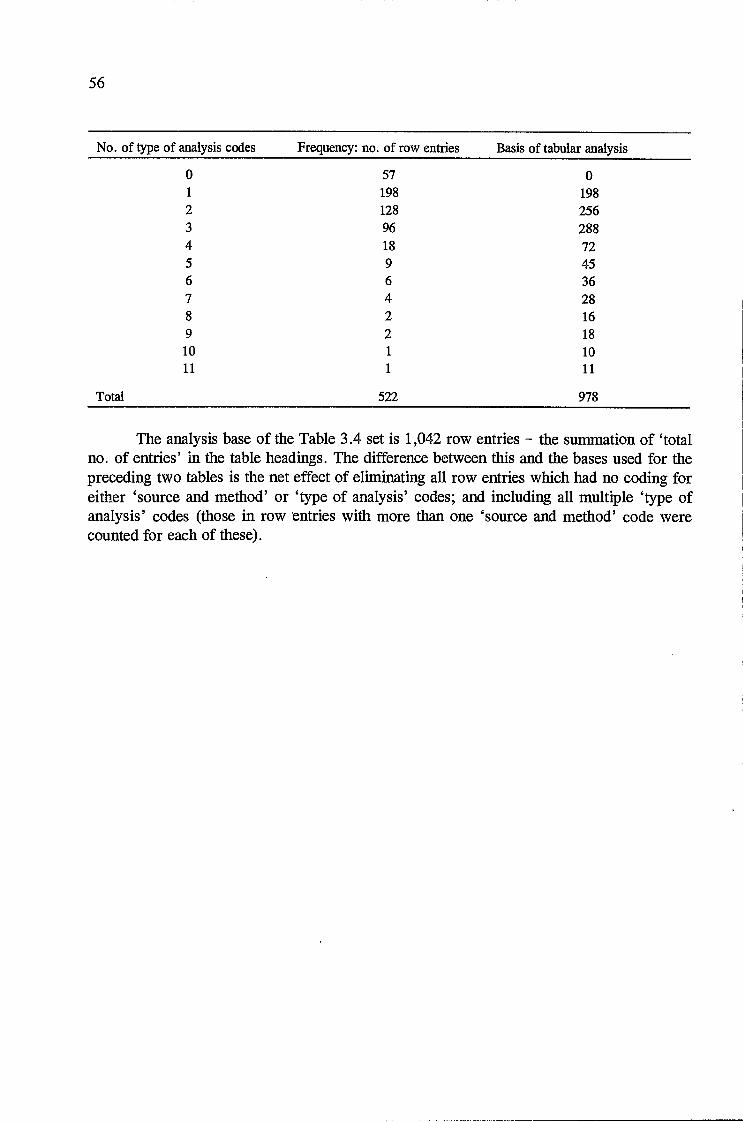
56
0 57 01 198 1982 128 2563 96 2884 18 725 9 456 6 367 4 288 2 16
9 2 18
10 1 10
11 1 11
Total 522 978
The analysis base of the Table 3.4 set is 1,042 row entries - the summation of 'totalno. of entries' in the table headings. The difference between this and the bases used for thepreceding two tables is the net effect of eliminating all row entries which had no coding foreither 'source and method' or 'type of analysis' codes; and including all multiple 'type ofanalysis' codes (those in row entries with more than one 'source and method' code werecounted for each of these).
No. of type of analysis codes Frequency: no. of row entries Basis of tabular analysis

Bibliography
Australian Bureau of Statistics, 1995. Survey of Employment and Unemployment Patterns, Information Paper1/95, Background and General Overview'.
-, 1997. 'SEUPDATE - about the Australian Survey of Employment and Unemployment Patterns', Editions 1and 2.
Baldwin, J. and Gorecki, P.K., 1993. "Dimensions of Labor Market Change in Canada: Intersectoral Shifts, Jobs,and Worker Turnover", Journal of Income Distribution, Vol. 3, No. 2 (Utrecht University).
Bowers, N., 1982. "Tracking youth joblessness: persistent or fleeting?" Monthly Labour Review, February.
Buchmueller, T.C. and Valletta, R. 0., 1996. "The Effects of Employer-Provided Health Insurance on WorkerMobility", Industrial and Labor Relations Review, Vol. 49, No. 3, Cornell University.
European Commission, 1996. "Sectoral mobility in the European labour market", Employment in Europe 1996.
Groupe de Paris on Labour and Compensation, July 1998. Cited in UK paper.
GSS (S PH) Secretariat, Office for National Statistics, 1996. Social Statistics: a Guide to Official Sources(currently being updated).
Hamermesh, 1993. "Labour Demand", Chapter 11, pp. 398-400.
Hoffiiiann, E., 1990. "A labour accounting system - reflections on main concepts and principles",Statistical Journal of the United Nations Economic Commission for Europe, Vol. 7.
ILO, 1998. "Labour market dynamics", General Report of the 16th International Conference of LabourStatisticians.
Jones, S.R.G, and Craig, R.W., 1995. "The Measurement of Labour Force Dynamics with Longitudinal Data:The Labour Market Activity Survey Filter", Journal of Labour Economics, April.
OECD. DEELSA/ELSA/WP7(92)2, Internal Paper.
-' 1996. Employment Outlook 1996, Chapter 5.
-, 1996. "Job Creation and Loss: Analysis, Policy and Data Development", OECD Documents.
-' 1997. "Labour Market Dynamics in the Russian Federation", OECD Proceedings.
Schomann, K. and Kruppe, T., 1996. "The Dynamics of Employment in the European Union", first publishedin Policies 55.
Stibbard, P.J., 1996. "Data describing labour market dynamics: can we do better?" Statistical Journal of theUnited Nations Economic Commission for Europe, Vol.13, No. 4.
Vodopivec, M., 1996. The Slovenian Labor Market in Transition: Evidence from Microdata, paper for OECDTechnical Workshop.
57

Employment and Training PapersCahiers de l'empfoi et de Ia formation
Estudios sobre empleo y formaciOn
L'insertion des jeunes et les politiques d'emploi-formationJacques Gaude, 1997
Women industrial workers in an opening economy: The case of MexicoGloria Moreno Fontes, 1997
Adjustment, employment and labour market institutions in SubSaharan Africa: An emerging consensuson consultative policy design?, 1997
Adjustment, stabilization and the structure of employment in BrazilEdward 3. Amadeo; Valéria Pero, 1997
The employment impact of external capita! flows in developing countriesE.V.K. Fitzgerald; G. Mavrotas. 1997
Employment, structural adjustment and sustainable growth in MexicoJaimeRos, 1997
The challenge of youth unemployment (Action Programme on Youth Unemployment)Niall O'Higgins, 1997
The structure of employment and structural employment in the PhilippinesJoseph Y. Lim; Manuel F. Montes, 1997
The continuing employment crisis in Kyrgyz manufacturing. Analysis of findings from the second roundof the Kyrgyz Republic survey of manufacturing establishments 1 9931 995Christine Evans-Klock, 1998
State labour market intervention in Argentina, Chile and Uruguay: Common model, different versionsAdriana Marshall, 1997
Opening, stabilization and the sectoral and skill structures of manufacturing employment in BrazilEdward 3. Amadeo; Marcelo Neri, 1998
Maquiladoras prospects of regional integration and globalizationRegina M.A.A. Galhardi, 1998
1 3. Jobs, technology and skill requirements in a globalized economy: Country study on SingaporeLinda Low, 1998
14. Openness and structural dynamics of productivity and employment in developing countries: A case ofde-industrialization ?Ute Pieper, 1998
1 5. Applying global best practice: Workers and the "new" methods of production organizationGijsbert van Liemt, 1998
16. The evaluation of active labour market measures for the long-term unemployedNigel Meager with Ceri Evans, 1998

Labour standards and industrial restructuring in Western Europe (Action Programme on Globalization,Area-based Entrepr!se Development and Employment)Philip Raines, 1998
Economic integration in Latin America: Impact on labourJohn Weeks, 1998
Strategic training partnerships between the State and enterprisesAyse G. Mitchell, 1998
Youth unemployment in Hungary and Poland (Action Programme on Youth Unemployment)Maarten Keune, 1998
Education, employment and training policies and programmes for youth with disabilities in fourEuropean countries (Action Programme on Youth Unemployment)Clemens Russell, 1998
Les relations de travail en milieu protgLau rent Visier, 1998
French youth unemployment: An overview (Action Programme on Youth Unemployment)Catherine Bruno; Sandrine Cazes, 1998
Worker displacement: Public policy and labour-management initiatives in selected OECD countriesChristine Evans-Klock; Peggy Kelly; Peter Richards; Corinne Vargha, 1998
The role of trade and technological change on the Canadian employment profile in a globalized contextMarie Lavoie, 1998
Minimum wages and youth unemployment (Action Programme on Youth Unemployment)Youcef Ghellab, 1998
The role of the social partners in the design and implementation of active measuresHugh Mosley; Tiziana Keller; Stefan Speckesser, 1998
Ajustement structurel, emplol et role des partenaires sociaux en Afrique francophone (Programmed'action sur l'ajustement structurel, l'emplo! et le rOle des partenaires sociaux)Philippe Hugon; Nalma Pages, 1998
Labour market effects under CUFTA/NAFTABruce Campbell; Andrew Jackson; Mehrene Larudee; Teresa Gutierrez Haces, 1999
Argentina, MERCOSUR and jobs: Economic integration, trade, growth and employment in the 1 990sRicardo 3. Soifer, 1999
Local development initiatives and the management of change in Europe (Action Programme onGlobalization, Area-based Entreprise Development and Employment)Frank Pyke, 1998
Regional and employment consequences of the defence industry transformation in East Central Europe(Action Programme on Globalization, Area-based Entreprise Development and Employment)Yudit Kiss, 1999
Ageing and labour markets for older workersAlexander Samorodov, 1999
Labour market policies in Asian countries: Diversity and similarity among Singapore, Malaysia, theRepublic of Korea and JapanTakeshi lnagami, 1998
Options for human resources development in Egypt: The labour market context - Analysis of findingsfrom the Egypt survey of human resources developmentChristine Evans-Klock; Lin Lean Lim, 1998
Unemployment among Indian youth: Level, nature and policy implications (Action Programme on YouthUnemployment)Pravin Visaria, 1998
Youth unemployment and youth labour market policies in Germany and Canada(Action Programme onYouth Unemployment)Dominique M. Gross, 1998
Labour market dynamics: A global survey of statistical activityPeter Stibbard, 1999
Employment, occupations and skills in increased international exposure: The Republic of Korea1970-90Byung-You Cheon, 1999
The impact of trade and technology on the skill profile in Brazil and the Republic of KoreaRegina M.A.A. Galhardi, 1999
Social security: An obstacle to full employment?Werner Tegtmeier, 1999
Youth unemployment and youth employment policies in Italy (Action Programme on YouthUnemployment)Floro Ernesto Caroleo; Fernanda Mazzotta, 1999